CATCHMENT HYDROLOGICAL RESPONSE TO CHANGING LAND SYSTEM IN KASHMIR HIMALAYA
|
|
|
- Shavonne Caldwell
- 5 years ago
- Views:
Transcription

1 IGC, August, 2012 CATCHMENT HYDROLOGICAL RESPONSE TO CHANGING LAND SYSTEM IN KASHMIR HIMALAYA Prof. SHAKIL A ROMSHOO HEAD, DEPT OF EARTH SCIENCES KASHMIR UNIVERSITY
2 PRESENTATION OVERVIEW KASHMIR HIMALAYAS UPPER INDUS SYSTEM DYNAMIC COMPONENTS STREAM FLOW CHANGES WETLANDS/LAKES LAND SYSTEM CHANGES AND PROJECTIONS CRYOSPHERE CLIMATE CHANGE SCENARIO HYDROLOGICAL CHANGES W.R.T. LULC BMPs/SCENARIO MAPPING CONCLUSIONS
3
4

5 HYDROLOGIC SYSTEM LINKAGES
6 Discharge (Cusecs) Discharge (Cusecs) Discharge (Cusecs) Discharge (Cusecs) Observed Stream Flow Changes Yearly Discharge Winter Season Years Years SpringSeason SummerSeason Years Years
7 DACHIGAM (yearly) Name of the Test Test Static a=0.1 a=0.5 a=0.01 Result Mankendall S (0.01) Spearman s Rho S (0.01) Linear Regression S (0.01) Test Type DACHIGAM (Seasonal) Season Test statistic a=0.1 a=0.05 a=0.01 Result Winter S (0.01) Mann-Kendall Spearman's Rho Linear Regression Spring S (0.01) Summer S (0.01) Winter S (0.01) Spring S (0.01) Summer S (0.01) Winter S (0.01) Spring S (0.01)
8 J F M S N L D
9 Discharge (Cusecs) Discharge (Cusecs) Discharge (Cusecs) Discharge (Cusecs) Observed Stream Flow Changes Winter Season Years Years 100 Summer Season 100 Spring Season Years
10 Name of the Test DAKIL (yearly) Test Static a=0.1 a=0.5 a=0.1 Result Mankendall NS Spearman s Rho NS Linear Regression NS Test Type DAKIL (seasonal) Season Test statistic a=0.1 a=0.05 a=0.01 Result Winter NS Mann-Kendall Spring S(0.1) Summer S(0.05) Spearman's Rho Winter NS Spring S(0.05) Summer S(0.01) Linear Regression Winter NS Spring S(0.05)
 and thus helps in maintaining ecological balance.")
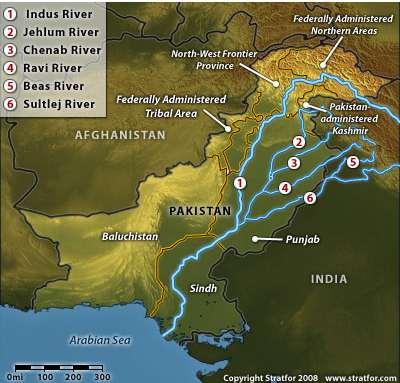
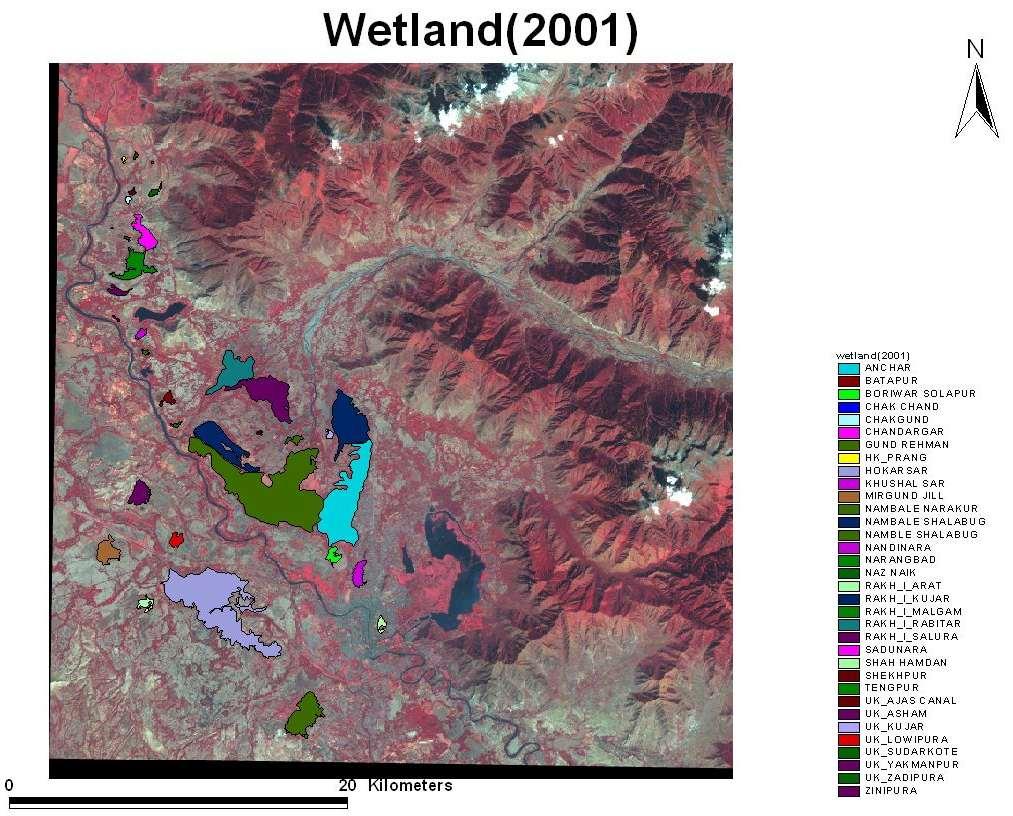
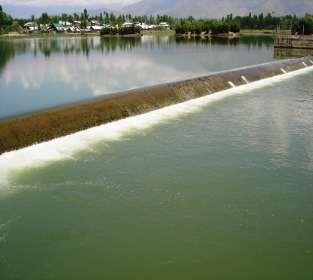
11 Introduction Water Resource Map of UIB Various beneficial functions of wetlands include life sustaining processes like water storage (domestic, agriculture, industrial usage) protection from storm and floods, ground water recharge, storage for nutrients, erosion control and stabilisation of local climate (temperature, rainfall) and thus helps in maintaining ecological balance. During the recent past wetlands have been recklessly destroyed to create land for development and only in recent years their uses and values have begun to be understood and appreciated.

12 WATER RESOURCES
13
 2008AREA (HA) FOREST 485473.31 464798.36 391368.")


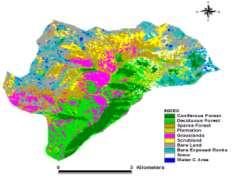
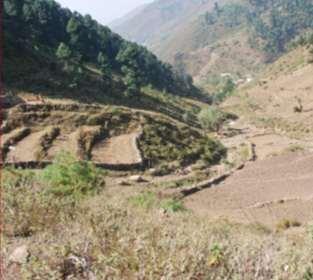
14 Land System Changes in Kashmir CLASS NAME 1972 AREA (HA) 1992 AREA (HA) 2008AREA (HA) FOREST AGRICULTURE PLANTATION HORTICULTURE WATER RIVER BED AQUA_VEGETATION BUILT-UP
15
16 Land System Change Projections ( )


 1992 (Sq.")
 2010 (Sq. Km) 45.")
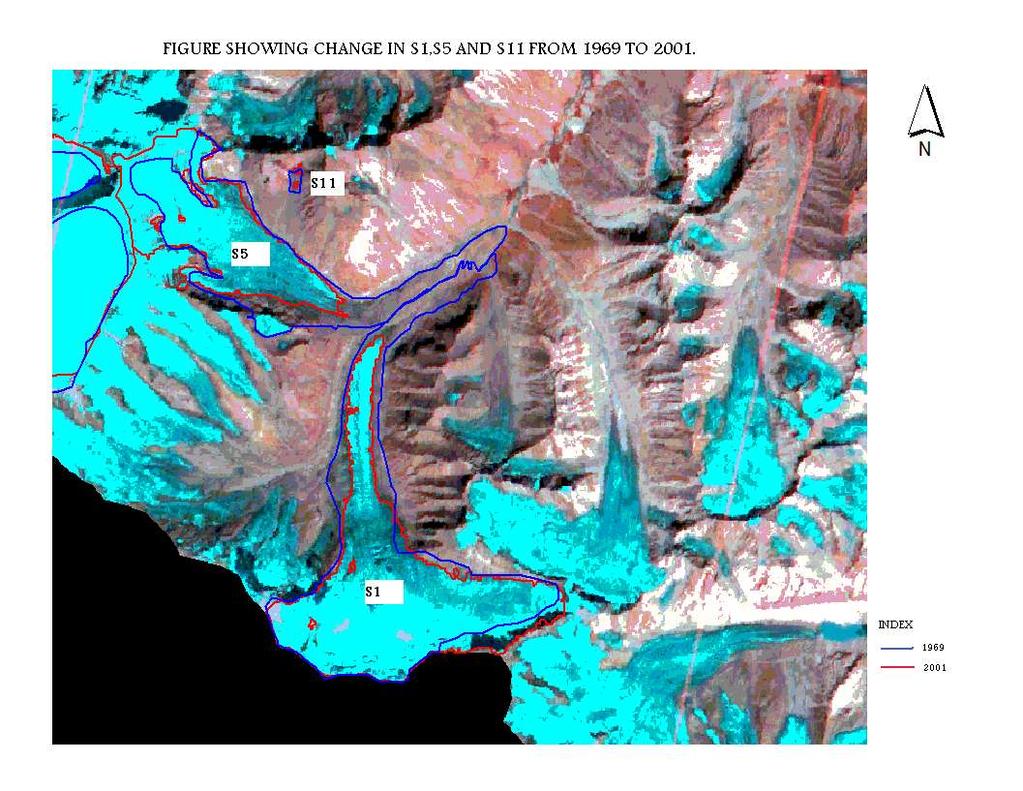
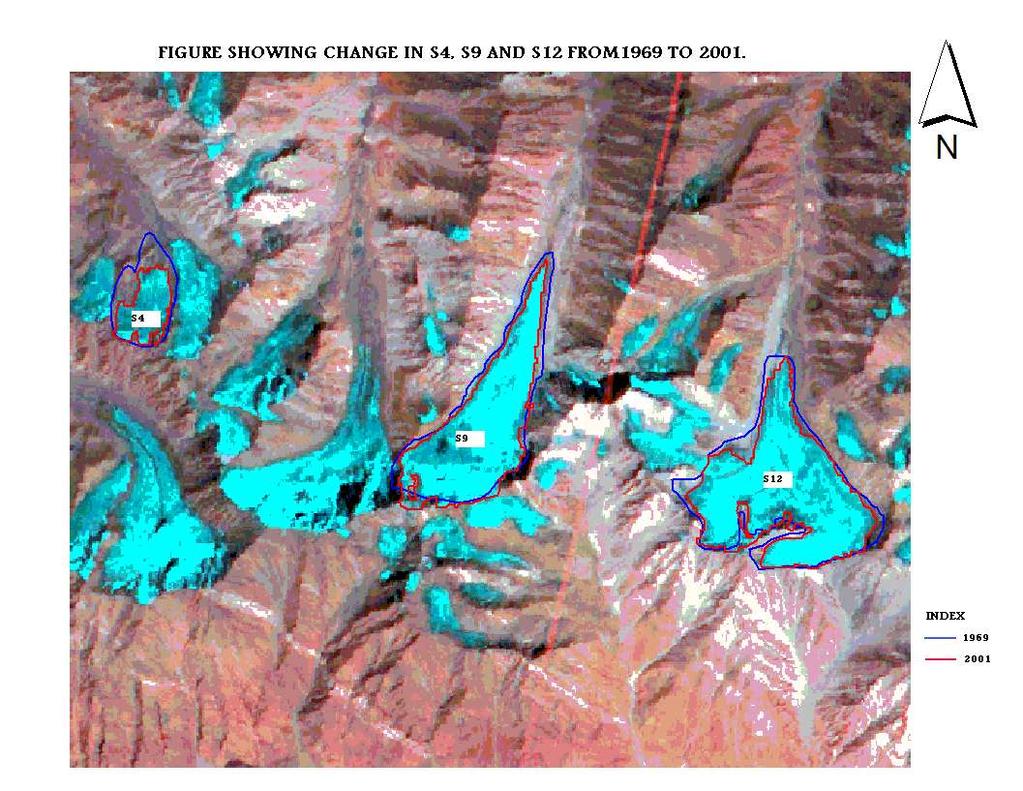
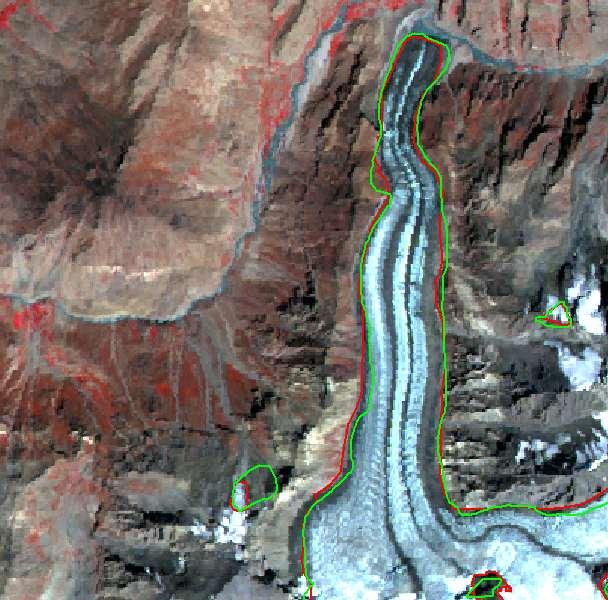
17 Changes in Kashmir Cryosphere Total Glacier area in Total Glacier area Total Glacier area Total Glacier area 1969 (sq. Km) 1992 (Sq. Km) 2001(sq. Km) 2010 (Sq. Km)

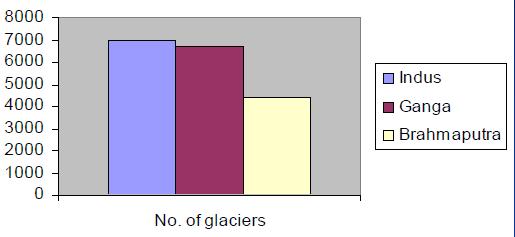
18 Water Tower of Asia
19 Rainfall (mm) Rainfall (mm) Average_Temperature ( 0 C) Temperature (0C) Average Temperature (Dec. & Jan.) ( 0 C) Average Temperature (Dec &Jan) 8,00 7,00 6,00 5,00 4,00 3,00 2,00 1,00 0, , Total Precipitation Dec-Jan Total Precipitation (Dec. &Jan. )
20 HYDROLOGIC STYTEM LINKAGES


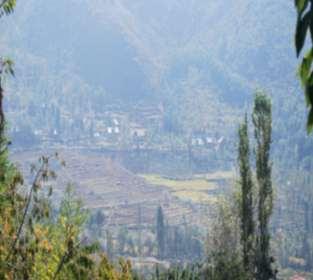
21 CATCHMENT SCALE STUDIES The study area is the Dal Lake Catchment highly urbanized and situated in Srinagar city (KASHMIR HIMALAYAS) having an area of 337 km². Location of Dal Lake Catchment

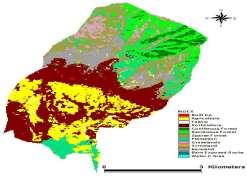
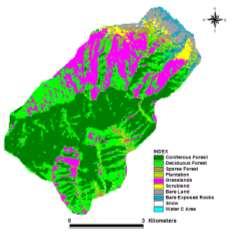
22 LU/LC MAP OF DAL LAKE CATCHMENT: 1992

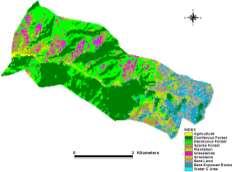
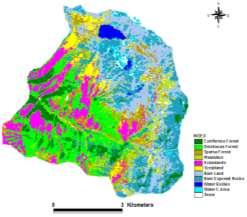
23 LU/LC MAP OF DAL LAKE CATCHMENT: 2005
24 Area change in LULC from 1992 to 2005 S. No. Class Name Area (Km 2 ) Area change % change 1 Built up Agriculture Fallow Horticulture Coniferous Forest Deciduous Forest Sparse Forest Grasslands Scrubland Plantation Aquatic Vegetation Bare Land Bare Exposed Rocks Water Bodies Water Channel Area Snow Golf course/turf
25 c Reference Totals Classified Totals Number Correct Producers Accuracy (%) Users Accuracy (%) Built up Agriculture Agriculture Fallow Horticulture Coniferous Forest Deciduous Forest Sparse Forest Grasslands Scrubland Plantation Aquatic Vegetation Barren Bare Exposed Rocks Water Water Channel Area Snow Totals Overall Accuracy = 89.67% %
26 KAPPA (K^) STATISTICS OVERALL KAPPA STATISTICS = KAPPA FOR EACH CATEGORY Class Name Kappa Built up 1 Agriculture Agric. Fallow Horticulture 1 Coniferous Forest Deciduous Forest Sparse Forest Grasslands Scrubland Plantation Aquatic Vegetation Barren Bare Exp. Rocks Water 1 Water Channel Snow OVERALL KAPPA STATISTICS= KAPPA (K^) STATISTICS KAPPA FOR EACH CATEGOR Class Name Kappa Built up Agriculture Agricultural Fallow Horticulture 1 Coniferous Forest Deciduous Forest Sparse Forest Grasslands 1 Scrubland Plantation Aquatic Vegetation Barren.9126 Bare Exposed Rocks.6610 Water 1 Water Channel Area Snow.6644


27 DW1 DW2 DW 3 D W 7 DW4 DW5 D W6 DW 11 D W 8 DW1 3 DW 12 D W 9

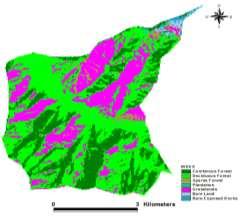
28 DAL LAKE ENVIRONS
29 LULC CHANGES AROUND DAL LAKE ( ) CLASS NAME Area (hectares) Area change ( ) Agriculture Aquatic veg Bare Land Builtup Fallow Land Forest Grasslands Horticulture Plantation Stream Bed Water
30 ETM, 1992 LISSIII, 2005 SOIL ERODIBILITY (K) FACTOR CURVE NO MULTIDATE LU/LC MAPS SLOPE LENGTH (LS) FACTOR C & P PRACTICES WEATHER DATA MULTIDATE CSA MAPS TRANSPORT DATA DAILY TEMP & PCPT GWLF MODEL SIMULATION OF RUNOFF, EROSION & SEDIMENT/NUTRIENT LOADS QUANTIFING THE HYDROLOGICAL PROCESSES
31 Hydrological Model Q kt ( R t R t M t M t 0.2DS kt 0.8DS kt ) 2 DS kt CN kt X kt 0.132* RE t * K k *( LS) k * C k * P k * AR k SR 0.001* C * Y m s m
32 DATA SETS USED SATELLITE DATA/GEOSPATIAL DATA: LANDSAT- ETM (1992) IRS: LISS III (2005) Topographic data DEM (30m) Time series of Hydrometeorological data II) FIELD DATA/ LAB INVESTIGATION Physicochemical data generated for soil Ground truth data III) ANCILLARY DATA Published reports and journals
33 HYDROLOGOICAL PARAMETERS(CM) HYDROLOGOICAL PARAMETERS(CM) Geospatial Analysis-Parameters
34 Input parameters used in the GWLF Model Source Areas Hydro Conditions LS C P K WCN Agriculture Fair Horticulture Fair Forest Fair Hay/Pasture Fair Low int Devel N/A High int Devel N/A Bare land Poor
35 CHANGES IN NUTRIENT LOADING OF DAL LAKE ( ) Hydrological Process Runoff (mm) Year Change (Tons/Yr) (mm) Erosion Sediment NUTRIENT LOADS Total Nitrogen (TN) Dissolved Nitrogen (DN) Total Phosphorus (TP) Dissolved Phosphorus (DP)
36 Source area contribution to sediment & erosion yields SOURCE 1992 LULC Erosion Tons/yr 2005 LULC Erosion Tons/yr 1992 LULC Sediment Tons/yr 2005 LULC Sediment Tons/yr pastures Cropland Forest Horticulture Bare 1, , Lo_Int_Dev Hi_Int_Dev Stream bank Total
37 Sediment (mg/l) VALIDATION STUDY RESULTS NATSH-SUTCLIFFE (R2) COEFFICIENT : 0.85

38 Source area contribution to avg. sediment & erosion yields
39 SCENARIO MAPPING
40 PREDICT POLLUTANT REDUCTION IMPACT COMPARISON TOOL developed for use in evaluating the implementation of both rural and urban pollution reduction strategies at the watershed level. allows the user to create various scenarios in which current landscape conditions can be compared against future conditions that reflect the use of different pollution reduction strategies.
41 METHODOLOGY ADOPTED FOR PREDICT MODEL BMPS STRUCTURAL/ NON-STRUCTURAL URBAN Constructed wetlands Bio-retention areas Detention basins AGRICULTURAL Crop rotation Cover crops Contour farming Agr. to wetland conversion Agr. to forest conversion Grazing land management Terraces & diversions STREAMS Vegetative buffers Stream bank fencing Stream bank stabilization SCENARIOS PREDICT MODEL BEST CASE SCENARIO

42 SOME OF THE BMPs
43 SOURCE Nutrient load reduction in response to BMP Baseline Scenario MSCN1 MSCN2 Nitrogen (Tons/Yr) Baseline Scenario MSCN1 Phosphorus (Tons/Yr) MSCN2 Hay/Pasture Agriculture Forest Horticulture Turf /Golf course Bare Land Low Int. Dev High Int. Dev Stream Bank Ground water Totals % Reductions 20.0% 37.0% 26.6% 40.0%
44 Reduction in sediment loads in response to different scenarios SOURCE Baseline Scenario MSCN1 Sediment (Tons/Yr) MSCN2 Hay/Pasture Agriculture Forest Bare Land Low Int Dev Hi Int Dev Stream Bank Total Sediment

45 Conclusions The study demonstrated the effectiveness of the GIS based Modeling system in quantifying the hydrological processes and nutrient loads from the critical source areas at the catchment scale. The change in the LULC of the catchment has contributed significantly towards increased nutrient loads at the catchment scale. The implementation of different BMPs can prove quite effective in controlling the nutrient pollution of water body and thus improve the ecological condition of the lake including the water quality


46 Thank you 46


47 50 km 2 RCM data downscaled to 10 km 2 grids
48 ANNUAL AVERAGE MAXIMUM TEMPERATURE Temperature ( 0C) Years Temperature ( 0C) Years Temperature (0C) Years Temperature (0C) Years
49 ANNUAL AVERAGE MINIMUM TEMPERATURE Temperature (0C) Years Temperature (0C) Years Temperature (0C) Years Temperature (0C) Years
50 Temperature (0C) Years Baramulla WMO RCM Temperature (0C) Years Budgam WMO RCM Validation of mean maximum temp Temperature (0C) Years Anantanag WMO RCM Temperature (0C) Years Kupwara WMO RCM
51 ANNUAL AVERAGE PRECIPITATION Rainfall (mm) Years Rainfall (mm) Years Rainfall (mm) Years Rainfall (mm) Years
52 The maximum mean annual temperature is projected to increase by 2 0 C (± 0.9) from 2011 to 2040 and C (±1.17) from 2040 to The minimum mean annual temperature is projected to increase by C (± 0.61) from 2011 to 2040 and C (± 0.88) in 2040 to The annual precipitation is likely to decrease by about 13.1 % from and 4.07 % from respectively.
53
54
55
Aspects and Case Studies of the Effects of Climate Change on Water Resources. Part II (Case Studies)
") Aspects and Case Studies of the Effects of Climate Change on Water Resources Part II (Case Studies) Manfred Koch Department of Geohydraulics and Engineering Hydrology, University of Kassel, Germany Email:
Aspects and Case Studies of the Effects of Climate Change on Water Resources Part II (Case Studies) Manfred Koch Department of Geohydraulics and Engineering Hydrology, University of Kassel, Germany Email:
State of the Water. October 25, 2016 Union County Community Center
 State of the Water October 25, 2016 Union County Community Center What is a Watershed? Nashville Birmingham Atlanta Athens Etowah Cleveland Murphy Andrews Hayesville Copper Hill Blue Ridge Young Harris
St. Johns River Water Supply Impact Study (WSIS)
") St. Johns River Water Supply Impact Study (WSIS) Michael G. Cullum, P.E. Chief, Bureau of Engineering & Hydro Science St. Johns River Water Management District The Water Supply Impact study is the most
St. Johns River Water Supply Impact Study (WSIS) Michael G. Cullum, P.E. Chief, Bureau of Engineering & Hydro Science St. Johns River Water Management District The Water Supply Impact study is the most
Sustaining the Raritan River Watershed
 Sustaining the Raritan River Watershed 8 th Annual Sustainable Raritan River Conference June 10, 2016 Rick Lathrop Department of Ecology, Evolution & Natural Resources Rutgers School of Environmental and
Suitable Applications Check dams may be appropriate in the following situations: To promote sedimentation behind the dam.
 Categories EC Erosion Control SE Sediment Control TC Tracking Control WE Wind Erosion Control Non-Stormwater NS Management Control Waste Management and WM Materials Pollution Control Legend: Primary Category
Outline. 1. Overview 2. Population 3. Flooding 4. Land Use 5. References. Overview
 Outline 1. Overview 2. Population 3. Flooding 4. Land Use 5. References Overview The two main rivers in the Cannon River watershed are the Cannon and Straight Rivers. The Cannon River originates in Shields
Climate change impacts on water availability in three Mediterranean watersheds of Catalonia (NE Spain) Diana Pascual, Eduard Pla (CREAF)
 Diana Pascual, Eduard Pla (CREAF)") Climate change impacts on water availability in three Mediterranean watersheds of Catalonia (NE Spain) Diana Pascual, Eduard Pla (CREAF) 2011 International SWAT Conference INDEX 1.The project 2.Background
Climate change impacts on water availability in three Mediterranean watersheds of Catalonia (NE Spain) Diana Pascual, Eduard Pla (CREAF) 2011 International SWAT Conference INDEX 1.The project 2.Background
Managing Chesapeake Bay s Land Use, Fish Habitat, and Fisheries: Studies. Jim Uphoff & Margaret McGinty, Fisheries Service
 Managing Chesapeake Bay s Land Use, Fish Habitat, and Fisheries: Positive Image and or Negative Graphic Case Studies Jim Uphoff & Margaret McGinty, Fisheries Service Maryland Fisheries Service has been
Total Suspended Solids, Stable Flow, and Wet Weather Event Monitoring in the Bass River Watershed. December The Cadmus Group, Inc.
 Total Suspended Solids, Stable Flow, and Wet Weather Event Monitoring in the Bass River Watershed December 2004 The Cadmus Group, Inc. Grand Valley State University Annis Water Resources Institute Submitted
USING BIOLOGICALLY IMPORTANT PHYSICAL CHARACTERISTICS OF ESTUARIES TO CLASSIFY AUSTRALIAN AND NEW ZEALAND ESTUARIES
 USING BIOLOGICALLY IMPORTANT PHYSICAL CHARACTERISTICS OF ESTUARIES TO CLASSIFY AUSTRALIAN AND NEW ZEALAND ESTUARIES Michael Whelan, Southern Cross University, Australia. Peter Saenger, Southern Cross University,
Climate Change and Hydrology in the Sierra Nevada. Lorrie Flint U.S. Geological Survey Sacramento CA
 Climate Change and Hydrology in the Sierra Nevada Lorrie Flint U.S. Geological Survey Sacramento CA Discussion Topics Climate change for California Methods to evaluate hydrologic impacts Water balance
Seasonal variations of hydro-chemistry in certain ephemeral streams in a tropical climate, northeastern India
 vailable online at www.pelagiaresearchlibrary.com dvances in pplied Science Research, 2013, 4(4): 17-21 ISSN: 0976-8610 ODEN (US): SRF Seasonal variations of hydro-chemistry in certain ephemeral streams
What is a River Basin Restoration Priority? 1. Criteria for Selecting a Targeted Local Watershed (TLW) 2. Hiwassee River Basin Overview 3
 2. Hiwassee River Basin Overview 3") Hiwassee River Basin Restoration Priorities 2008 TABLE OF CONTENTS Introduction 1 What is a River Basin Restoration Priority? 1 Criteria for Selecting a Targeted Local Watershed (TLW) 2 Hiwassee River
Hiwassee River Basin Restoration Priorities 2008 TABLE OF CONTENTS Introduction 1 What is a River Basin Restoration Priority? 1 Criteria for Selecting a Targeted Local Watershed (TLW) 2 Hiwassee River
Hydrological Condition Report including the issues of High Flow Fluctuation in Chiang Saen
 Hydrological Condition Report including the issues of High Flow Fluctuation in Chiang Saen Technical Symposium for ESCIR and MRC on Social Impact Assessment in River Basin Management Sothea KHEM, HENG
Total Suspended Solids, Stable Flow, and Wet Weather Event Monitoring in the Unnamed Tributary to the Grand River Watershed.
 Total Suspended Solids, Stable Flow, and Wet Weather Event Monitoring in the Unnamed Tributary to the Grand River Watershed December 2004 The Cadmus Group, Inc. Grand Valley State University Annis Water
Temperature Profiling Within the Trout Creek Sub-Watershed 2013 Prepared by the Kennebecasis Watershed Restoration Committee January 2014
 Temperature Profiling Within the Trout Creek Sub-Watershed 2013 Prepared by the Kennebecasis Watershed Restoration Committee January 2014 A partnership project between the KWRC and Agriculture and Agri-Foods
Climate Change Scenarios for the Agricultural and Hydrological Impact Studies
 Climate Change Scenarios for the Agricultural and Hydrological Impact Studies Martin Dubrovský (WP 3, 5, 6) hotel Mendi, Halkidiki, Greece ***** 10-12. June 2009 scheme of cc impacts study GCM output obs.wea.series
Chapter 1: Introduction
 Chapter 1: Introduction 1.0 The Report Card 1.0.1 Background People are becoming more aware of environmental issues locally and globally and want to know what they can do to improve their local watersheds.
UNDERSTANDING YOUR ESTUARY Level IA- ESTUARY SEARCH
 UNDERSTANDING YOUR ESTUARY Level IA- ESTUARY SEARCH Kakagon/Bad River Sloughs, a Lake Superior estuary located on the Bad River Reservation near Ashland, WI. GOAL Select one Wisconsin estuary to study
Spatial Distribution and Seasonal Variability of Rainfall in a Mountainous Basin in the Himalayan Region
 Water Resources Management (2006) 20: 489 508 DOI: 10.1007/s11269-006-8773-4 C Springer 2006 Spatial Distribution and Seasonal Variability of Rainfall in a Mountainous Basin in the Himalayan Region MANOHAR
City of Del Mar Local Coastal Plan (LCP) Amendment for Sea Level Rise and Coastal Flooding
 Amendment for Sea Level Rise and Coastal Flooding") City of Del Mar Local Coastal Plan (LCP) Amendment for Sea Level Rise and Coastal Flooding 6/22/17 Presentation to Sea Level Rise Stakeholder- Technical Advisory Committee (STAC) Nick Garrity, P.E. Lindsey
City of Del Mar Local Coastal Plan (LCP) Amendment for Sea Level Rise and Coastal Flooding 6/22/17 Presentation to Sea Level Rise Stakeholder- Technical Advisory Committee (STAC) Nick Garrity, P.E. Lindsey
Assessing salmon vulnerability to climate change
 Assessing salmon vulnerability to climate change Tim Beechie NW Fisheries Science Center Alisa Wade-Wilcox University of California, Santa Barbara The big question Will climate change negate salmon restoration
Changes of Ecosystem & Societies on the Mongolia Plateau: Coupled Regulations of Landuse and Changing Climate
 Changes of Ecosystem & Societies on the Mongolia Plateau: Coupled Regulations of Landuse and Changing Climate Jiquan Chen, Ranjeet John, Nan Lu, Burkhard Wilske, Changliang Shao, Linhao Li, Lin Zhen, Shiqiang
Transport and Cycling of Nutrients in Rivers and Catchments Implications for Eutrophication Risk, Resilience & Recovery
 Transport and Cycling of Nutrients in Rivers and Catchments Implications for Eutrophication Risk, Resilience & Recovery Helen Jarvie, Centre for Ecology & Hydrology, U.K. Decades of nutrient mitigation
Rice Yield And Dangue Haemorrhagic Fever(DHF) Condition depend upon Climate Data
 Condition depend upon Climate Data") Rice Yield And Dangue Haemorrhagic Fever(DHF) Condition depend upon Climate Data Dr Lai Lai Aung, Assistant Director( Met Service) Dr Khaing Khaing Soe Assistant Director(Public Health) Dr Thin Nwe htwe
Rice Yield And Dangue Haemorrhagic Fever(DHF) Condition depend upon Climate Data Dr Lai Lai Aung, Assistant Director( Met Service) Dr Khaing Khaing Soe Assistant Director(Public Health) Dr Thin Nwe htwe
Climate Change Scenarios for the Agricultural and Hydrological Impact Studies
 Climate Change Scenarios for the Agricultural and Hydrological Impact Studies Martin Dubrovský (WP 3, 5, 6) Masarykova kolej, Praha ***** 25-27 November 2009 scheme of cc impacts study GCM output obs.wea.series
Performance of three Selected Convective Schemes for Predicting Indian Summer Monsoon Rainfall using RegCM4.4
 Performance of three Selected Convective Schemes for Predicting Indian Summer Monsoon Rainfall using RegCM4.4 A.K.M. Saiful Islam Professor Institute of Water and Flood Management Bangladesh University
GONE! Coastal Erosion Happens During Storms! Why Worry About Coastal Setbacks? Goals for Today
 RI Regulatory Setbacks & Buffers: Coastal Zone Management Issues New England Onsite Wastewater Training Program @ URI OWT 155 November 21, 2013 Goals for Today Understand the impacts of storms, coastal
Assessment of Soil Erosion at a DC Park Facility Spring Valley Park NW Washington, DC
 Assessment of Soil Erosion at a DC Park Facility Spring Valley Park NW Washington, DC Annual Progress Report for FY 2004 Prepared by: Principal Investigators: Inder Bhambri, Ph.D., PE Philip Brach, Ph.D.,
Climate Change Adaptation and Stream Restoration. Jack Williams;
 Climate Change Adaptation and Stream Restoration Jack Williams; jwilliams@tu.org 1 Goals for this presentation Develop strategies for adapting streams to climate impacts by Thinking like a watershed Understanding
Barnegat Bay-Friendly Golf Course Certification Program
 Barnegat Bay-Friendly Golf Course Certification Program Businesses for a Better Barnegat Bay Thank you for your interest in becoming a Certified, Barnegat Bay-Friendly Golf Course. This American Littoral
Fish and Fisheries. Ian Cowx Hull international Fisheries Institute
 BioRA Preparation Meeting PART I Office of the Secretariat in Vientiane 18 19 March 2015 Fish and Fisheries Ian Cowx Hull international Fisheries Institute 1 Outline Characteristics of Mekong fish and
Bay of Fundy Estuary Profile
 s The is a sub-basin of the Bay of Fundy along the northwestern shore of Nova Scotia and at the western end of the Annapolis Valley. The Annapolis River is the major water source flowing into the estuary.
INTERNATIONAL JOURNAL OF CIVIL AND STRUCTURAL ENGINEERING Volume 5, No 2, 2014
 INTERNATIONAL JOURNAL OF CIVIL AND STRUCTURAL ENGINEERING Volume 5, No 2, 2014 Copyright by the authors - Licensee IPA- Under Creative Commons license 3.0 Research article ISSN 0976 4399 Modification of
Drought Situations and Management Policy in Vietnam
 Regional Workshop for Asia-Pacific Capacity Development to Support National Drought Management Policy Drought Situations and Management Policy in Vietnam Nguyen Van Tinh, Dang Thanh Mai Hanoi, May 2014
CALCASIEU SALINITY STRUCTURES. HYDRODYNAMIC MODELING (To Support Design of Salinity Barriers)
") CALCASIEU SALINITY STRUCTURES HYDRODYNAMIC MODELING (To Support Design of Salinity Barriers) Presentation Overview 1 2 3 4 5 Project Overview and CEA Circulation Modeling Vessel Hydrodynamics Modeling
CALCASIEU SALINITY STRUCTURES HYDRODYNAMIC MODELING (To Support Design of Salinity Barriers) Presentation Overview 1 2 3 4 5 Project Overview and CEA Circulation Modeling Vessel Hydrodynamics Modeling
Trout Unlimited Comments on the Scope of Environmental Impact Statement for the Constitution Pipeline Project, Docket No. PF12-9
 October 9, 2012 Kimberly D. Bose, Secretary Federal Energy Regulatory Commission 888 First Street, NE, Room 1A Washington, DC 20426 RE: Trout Unlimited Comments on the Scope of Environmental Impact Statement
BANGLADESH: TRANSBOUNDARY RIVERS PROBLEMS AND PROSPECTS
 BANGLADESH: TRANSBOUNDARY RIVERS PROBLEMS AND PROSPECTS by Md. Jahid Hossain Jahangir Executive Engineer Joint Rivers Commission, Bangladesh Presented at the Expert Scoping Workshop on quantifying the
NYS Coastal Waters. Water Resources of NYS: THE NATURE of the COASTAL ZONE. NYS Coastal Waters. NYS Coastal Atlas. Coastal Zone Management 10/10/2014
 Water Resources of NYS: THE NATURE of the COASTAL ZONE NYS Coastal Waters NYS is the only state to border the Atlantic Ocean and the Great Lakes (Lakes Erie and Ontario). Great Lakes shoreline: 577 miles
1.Warm Springs Creek (Anaconda) Watershed Description and Land Use
 Watershed Description and Land Use") 1.Warm Springs (Anaconda) Watershed Description and Land Use Table xxx: Warm Springs Watershed Overview Watershed Size 92,288 acres/144.2 sq miles/373.6 sq km Elevation Range 5,781 feet [4,800-10,581]
1.Warm Springs (Anaconda) Watershed Description and Land Use Table xxx: Warm Springs Watershed Overview Watershed Size 92,288 acres/144.2 sq miles/373.6 sq km Elevation Range 5,781 feet [4,800-10,581]
Canada s Natural Systems. Canadian Geography 1202
 Canada s Natural Systems Canadian Geography 1202 Canada s Natural Systems Natural System: A system found in nature Here are the four natural systems that we will explore in the next few weeks 1. Canada
Table xxx: Listed and Suspected Impairments for Willow Creek 2010 Reach Impairment Pollutant Impaired Uses
 1. (Fairmont) Watershed Summary Description and Land Use Table xxx: (Fairmont) Watershed Overview Watershed Size 18,331 acres/28.7 sq miles/74.3 sq km Elevation Range 2,615 feet [4,980-7,595] Stream Miles
IMPACTS OF COASTAL PROTECTION STRATEGIES ON THE COASTS OF CRETE: NUMERICAL EXPERIMENTS
 IMPACTS OF COASTAL PROTECTION STRATEGIES ON THE COASTS OF CRETE: NUMERICAL EXPERIMENTS Tsanis, I.K., Saied, U.M., Valavanis V. Department of Environmental Engineering, Technical University of Crete, Chania,
Sea-Level Rise and Coastal Habitats in Southeastern Louisiana An Application of the SLAMM Model
 Sea-Level Rise and Coastal Habitats in Southeastern Louisiana An Application of the SLAMM Model Patty Glick (National Wildlife Federation) Jonathan Clough (Warren Pinnacle Consulting, Inc.) Amy Polaczyk
Quantifying Performance of Stream Simulation Culverts in the Chehalis Basin, WA
 Quantifying Performance of Stream Simulation Culverts in the Chehalis Basin, WA AUTHORS: Joe Richards, Environmental Science Associates Jane Atha, Washington Department of Fish & Wildlife Colin Thorne,
Minnesota Department of Natural Resources Division of Fish and Wildlife Section of Fisheries. Stream Survey Report. Luxemburg Creek.
 Minnesota F-29-R(P)-24 Area 315 Study 3 March 2016 Minnesota Department of Natural Resources Division of Fish and Wildlife Section of Fisheries Stream Survey Report Luxemburg Creek 2015 Mark Pelham Sauk
NIANGUA SNAPSHOT ISSUE Nutrients 2 Suspended Sediment 3 Salinity 4 Summary 5
 Niangua River Watershed Snapshot Volume 14 Number 2 The 125-mile long Niangua River meanders northward from the town of Marshfield on I-44 to the Lake of the Ozarks. Its watershed covers more than 658,000
Understanding Today s Environmental Issues and the Oregon Stewardship Guidelines. David Phipps GCSAA NW Field Staff
 Understanding Today s Environmental Issues and the Oregon Stewardship Guidelines David Phipps GCSAA NW Field Staff My Roots Northwest Landscape Industries 1986-1990 The Oregon Golf Club 1990-2000 Stone
The effect of climate change on South West WA hydrology. Don McFarlane Research Manager
 The effect of climate change on South West WA hydrology Don McFarlane Research Manager Structure of the talk 1. Recent and projected climate change in South West WA i. Rainfall amount and intensity ii.
Skeena Salmon. Skeena River Basin. Sockeye Escapement ( ) 1. Average number of spawners. Introduction. Total Accessible Stream Length (km)
 1. Average number of spawners. Introduction. Total Accessible Stream Length (km)") Skeena Salmon Skeena River Basin Version., February 204 Sockeye Escapement (99 200) Average number of spawners Introduction This habitat report card was developed by the Pacific Salmon Foundation with
Skeena Salmon Skeena River Basin Version., February 204 Sockeye Escapement (99 200) Average number of spawners Introduction This habitat report card was developed by the Pacific Salmon Foundation with
PRELIMINARY STORM DRAINAGE REPORT
 PRELIMINARY STORM DRAINAGE REPORT DRURY LANE DEVELOPMENT 704 1ST STREET SULTAN, WA 98294-94240 PARCEL #28083200305500 AUDITOR S FILE NO. 1090255 CITY OF SULTAN SNOHOMISH COUNTY, WASHINGTON PREPARED FOR:
Minnesota Department of Natural Resources Division of Fish and Wildlife Section of Fisheries. Stream Survey Report. Cold Spring Creek.
 Minnesota F-29-R(P)-24 Area 315 Study 3 March 2015 Minnesota Department of Natural Resources Division of Fish and Wildlife Section of Fisheries Stream Survey Report Cold Spring Creek 2014 Mark Pelham Montrose
ABSTRACT INTRODUCTION
 Sengupta, M. and Dalwani, R. (Editors). 2008 Proceedings of Taal2007: The 12 th World Lake Conference: 1022-1027 Water Erosion Control Using the Fetch Calculator. Applications for Constructed Wetlands
German agricultural sector MONICA RAUMIS temperature precipitation climatic indices forest climatic water balance wine
 Application of the Model-Based Knowledge System LandCaRe DSS to Pilot Regions for Climate Change Adaptation in Germany Analyses at Regional and Local Scale Barbara Köstner, Erhard Albert, Michael Berg,
Physical Geography. Physical Geography III of the United States and Canada. Formation of Great Lakes. Climates of North America. Definitions 2/21/2013
 Physical Geography III of the United States and Canada Ancient Glacial Lakes As the Ice Age ended, areas of North America beyond the terminal moraine were flooded with melt water Prof Anthony Grande AFG
1.Mill Creek Watershed Summary Description and Land Use
 1.Mill Creek Watershed Summary Description and Land Use Table xxx: Mill Creek Watershed Overview Watershed Size 31,435 acres/49.1 sq miles/ 127.1 sq km Elevation Range 5,594 feet [4,967-10,561] Stream
The Tidal Elbe Concept Sustaining the Tidal River Seaport of Hamburg
 The Tidal Elbe Concept Sustaining the Tidal River Seaport of Hamburg 7 th international SedNet event 8. April 2011, Venice Wadden Sea North Sea MSFD Schleswig-Holstein Tidal Elbe Natura 2000 Lower Saxony
Monitoring tidal movements in Cook Inlet, Alaska, using the integration of remote sensing data, GIS, and inundation models
 Monitoring tidal movements in Cook Inlet, Alaska, using the integration of remote sensing data, GIS, and inundation models Hua Liu Department of political Science and Geography Old Dominion University
Watershed Restoration Plan for the Hiwassee River Basin
 Watershed Restoration Plan for the Hiwassee River Basin i EXECUTIVE SUMMARY This document, prepared by the North Carolina Wetlands Restoration Program (NCWRP), presents a description of Targeted Local
Importance of un-named tributary streams to Brook Trout populations. Dr. Jonathan M. Niles Dr. Dan Ressler
 Importance of un-named tributary streams to Brook Trout populations. Dr. Jonathan M. Niles Dr. Dan Ressler Pennsylvania Streams All streams of PA have a designated use - Huge resource - 8,011 named tributaries:
Low Gradient Velocity Control Short Term Steep Gradient Channel Lining Medium-Long Term Outlet Control Soil Treatment Permanent [1]
![Low Gradient Velocity Control Short Term Steep Gradient Channel Lining Medium-Long Term Outlet Control Soil Treatment Permanent [1]](/thumbs/80/80811988.jpg "Low Gradient Velocity Control Short Term Steep Gradient Channel Lining Medium-Long Term Outlet Control Soil Treatment Permanent [1]") Check Dams DRAINAGE CONTROL TECHNIQUE Low Gradient Velocity Control Short Term Steep Gradient Channel Lining Medium-Long Term Outlet Control Soil Treatment Permanent [1] [1] Though not generally considered
Check Dams DRAINAGE CONTROL TECHNIQUE Low Gradient Velocity Control Short Term Steep Gradient Channel Lining Medium-Long Term Outlet Control Soil Treatment Permanent [1] [1] Though not generally considered
APPENDIX C VEGETATED EMERGENCY SPILLWAY. VERSION 1.0 March 1, 2011
 APPENDIX C VEGETATED EMERGENCY SPILLWAY VERSION 1.0 March 1, 2011 [NOTE: Could use a better photo more clearly showing the emergency spillway in the context of the dam.] SECTION C-1: DESCRIPTION OF PRACTICE
Country report. Belgian bathing water quality in Belgium. May Photo: Peter Kristensen/EEA
 Country report Belgian bathing water quality in 2017 Belgium May 2018 Photo: Peter Kristensen/EEA BWD Report For the Bathing Season 2017 Belgium The report gives a general overview of information acquired
Upper Iowa River Watershed GIS Analysis
 Upper Iowa River Watershed GIS Analysis Adam Kiel GIS Specialist Upper Iowa River Watershed Project Northeast Iowa RC&D adamkiel@netins.net Index of Data Location. 3 Land Cover..4 Rivers & Streams..5 Karst
DMU 056 Midland County Deer Management Unit
 DMU 056 Midland County Deer Management Unit Area Description The Midland County Deer Management Unit (DMU) 056 is in the Northern Lower Peninsula (NLP) Region. It has roughly 333, 440 acres and consists
RI Regulatory Setbacks & Buffers: Coastal Management Issues
 RI Regulatory Setbacks & Buffers: Coastal Management Issues New England Onsite Wastewater Training Program @ URI OWT 155 - November 29, 2012 James Boyd - Coastal Policy Analyst Photo: October 30, 2012
JAP Additional Information Sheet
 JAP Additional Information Sheet Block 15: Purpose and Need The USACE purpose of the project is to provide a safe and reliable whitewater park for the recreational public in a city park, which will provide
Tips for Using & Printing Spreadsheets
 Key to Spreadsheets Spreadsheet # Type Description/Purpose a Development & Construction in Waterways b Debits Development & Construction in Other Aquatic Areas c Indirect Impacts to Waterways from Development
DALE HOLLOW LAKE TROOPER ISLAND IMPROVEMENT PROJECT Proposal for Reservoir Fisheries Habitat Partnership (RFHP)
") DALE HOLLOW LAKE TROOPER ISLAND IMPROVEMENT PROJECT Proposal for Reservoir Fisheries Habitat Partnership (RFHP) A. Applicant Information: US Army Corps of Engineers, Dale Hollow Lake POC: Gregg Nivens
DALE HOLLOW LAKE TROOPER ISLAND IMPROVEMENT PROJECT Proposal for Reservoir Fisheries Habitat Partnership (RFHP) A. Applicant Information: US Army Corps of Engineers, Dale Hollow Lake POC: Gregg Nivens
San Lorenzo Valley Water District, Watershed Management Plan, Final Version Part I: Existing Conditions Report
 LIST OF FIGURES Figure 1-1. Map of the San Lorenzo River watershed Figure 2-1. The Santa Cruz Mountains Bioregion Figure 2-2. Protected areas within the San Lorenzo River watershed Figure 2-3. Primary
TROUT CREEK WATERSHED (Second Year of Snowline Data)
") Extent of Snow Cover During the 2002 Spring Freshet For the TROUT CREEK WATERSHED (Second Year of Snowline Data) (Penticton Forest District) 1.0 INTRODUCTION The extent of snow cover over a watershed basin
Extent of Snow Cover During the 2002 Spring Freshet For the TROUT CREEK WATERSHED (Second Year of Snowline Data) (Penticton Forest District) 1.0 INTRODUCTION The extent of snow cover over a watershed basin
SECTION 2 HYDROLOGY AND FLOW REGIMES
 SECTION 2 HYDROLOGY AND FLOW REGIMES In this section historical streamflow data from permanent USGS gaging stations will be presented and discussed to document long-term flow regime trends within the Cache-Bayou
A Cost Effective and Efficient Way to Assess Trail Conditions: A New Sampling Approach
 A Cost Effective and Efficient Way to Assess Trail Conditions: A New Sampling Approach Rachel A. Knapp, Graduate Assistant, University of New Hampshire Department of Natural Resources and the Environment,
Nearshore Waves and Erosion Model Quantifying the Coastal Protection Benefits Provided by Natural Habitats
 Nearshore Waves and Erosion Model Quantifying the Coastal Protection Benefits Provided by Natural Habitats SaveGuanaCayReef Marinehindsight.com Necessary to quantify protection services offered by natural
Water in the Deschutes Who needs it?
 Water in the Deschutes Who needs it? Rivers and streams over appropriation and flow alteration. Junior water right holders production agriculture. The Cities long-term supply for growing populations. Climate
CLYDE RIVER FISH KILL 2016 PRELIMINARY REPORT
 CLYDE RIVER FISH KILL 2016 PRELIMINARY REPORT November 2016 CLYDE RIVER FISH KILL PRELIMINARY REPORT, NOVEMBER 2016 SUMMARY A fish kill on Clyde River was reported to e Prince Edward Island Department
Chapter 4: Google Earth Exercise
 Chapter 4: Google Earth Exercise Exercise 1 Visualizing the Three Gorges Dam Hydroelectric Project The Three Gorges Dam was the largest infrastructure project in China since the Great Wall. Completed in
Potomac River Water Quality: Current Status & Trends
 Potomac River Water Quality: Current Status & Trends Tom Parham Maryland Department of Natural Resources November 13 th, 2014 Presentation Overview 2014 Chesapeake Bay Dissolved Oxygen Conditions Historic
WINDA-GALES wind damage probability planning tool
 WINDA-GALES wind damage probability planning tool Kristina Blennow 1, Barry Gardiner 2, Neil Sang 1, Magnus Mossberg 3 1. Faculty of Landscape Planning, Horticulture and Agricultural Science, SLU, Alnarp,
FISHERIES BLUE MOUNTAINS ADAPTATION PARTNERSHIP
 FISHERIES A warming climate, by itself, substantially affects the hydrology of watersheds in the Blue Mountains. Among the key hydrologic changes projected under all scenarios for the 2040s and beyond
Upper Iroquois River atershed Management Plan
 2013 Upper Iroquois River atershed Management Plan Daniel M Perkins Jasper County Soil and Water Conservation District 12/30/2013 Table of Contents 1.1 WATERSHED COMMUNITY INITIATIVE... 12 1.2 Project
Description of the Fields
 This vernal pool assessment form was developed through funds provided by the Environmental Protection Agency to establish a GIS user interface with the capability to not only integrate all of the vernal
KOOTENAI RIVER BASIN WATERSHED RESTORATION PLAN
 KOOTENAI RIVER BASIN WATERSHED RESTORATION PLAN by Jeff Dunn, Watershed Hydrologist Karen Filipovich, Outreach Consultant Gary Ingman, Water Resources Scientist prepared by RESPEC 3810 Valley Commons Drive,
EFFECT OF LARGE-SCALE RESERVOIR OPERATION ON FLOW REGIME IN THE CHAO PHRAYA RIVER BASIN, KINGDOM OF THAILAND
 EFFECT OF LARGE-SCALE RESERVOIR OPERATION ON FLOW REGIME IN THE CHAO PHRAYA RIVER BASIN, KINGDOM OF THAILAND TAICHI TEBAKARI Hydraulic Engineering Research Group, Public Works Research Institute 1, Minamihara,
STUDY GUIDE. Physical Features. The Land. Chapter 23, Section 1. Landforms. Rivers. Natural Resources. Terms to Know DRAWING FROM EXPERIENCE
 For use with textbook pages 569 574. The Land Terms to Know subcontinent A landmass that is large and distinct but joined to a continent (page 569) alluvial plain An area of fertile soil deposited by river
Back to TOC. Title: Encouraging adoption of precision irrigation technology through on-course application and demonstration of water savings
 2017-37-647 Title: Encouraging adoption of precision irrigation technology through on-course application and demonstration of water savings Project Leaders: Josh Friell1, Brian Horgan2, Sam Bauer2, and
Water budgets of the two Olentangy River experimental wetlands in 2001
 Water Budgets 23 Water budgets of the two Olentangy River experimental wetlands in 2001 Li Zhang and William J. Mitsch School of Natural Resources, The Ohio State University Introduction Hydrologic conditions
Dr. Prakash N. Mesta
 Coastal Wetland Monitoring Dr. Prakash N. Mesta prakashhonavar@gmail.com Coastal Ecosystem is diverse in nature Most of the world human population p settled in Coastal region. Cities & Industries established
VWP CONSTRUCTION INSPECTION REPORT. Project Name: Berkmar Drive Extension Locality: Albemarle County Inspector: ERM
 VWP CONSTRUCTION INSPECTION REPORT Inspection Date: August 22, 2016 VWP Permit No. 15-1268 SPGP RO Project Name: Berkmar Drive Extension Locality: Albemarle County Inspector: ERM Impacts: PFO PEM PSS POW
Pearls in Peril (PIP): Securing the future of the freshwater pearl mussel in Great Britain. Layman s Report LIFE project LIFE/NAT/000383: PIP GB
: Securing the future of the freshwater pearl mussel in Great Britain. Layman s Report LIFE project LIFE/NAT/000383: PIP GB") Pearls in Peril (PIP): Securing the future of the freshwater pearl mussel in Great Britain Layman s Report LIFE project LIFE/NAT/000383: PIP GB Where we worked Our aims Restore in-stream habitats for freshwater
Pearls in Peril (PIP): Securing the future of the freshwater pearl mussel in Great Britain Layman s Report LIFE project LIFE/NAT/000383: PIP GB Where we worked Our aims Restore in-stream habitats for freshwater
Drought: What is the Status?
 Drought: What is the Status? Nolan J. Doesken Colorado Climate Center Colorado State University http://ccc.atmos.colostate.edu Presented at 2005 Peak to Prairie Landscape Symposium, February 11, 2005,
Hydrodynamic and hydrological modelling to support the operation and design of sea ports
 Hydrodynamic and hydrological modelling to support the operation and design of sea ports Data needs and examples Martijn de Jong (port/nautical requirements, waves, currents) Sofia Caires (mean and extreme
Youngs Creek Hydroelectric Project
 Youngs Creek Hydroelectric Project (FERC No. 10359) Resident Trout Monitoring Plan Annual Report 2014 Survey Prepared by: Everett, WA November 2014 Final This document has been prepared for the District.
VIRGINIA SOIL AND WATER CONSERVATION BOARD GUIDANCE DOCUMENT ON DAM BREAK INUNDATION ZONE AND INCREMENTAL DAMAGE ANALYSIS AND MAPPING PROCEDURES
 (Approved XXXXX, 2010) Working Draft Version January 14, 2010 VIRGINIA SOIL AND WATER CONSERVATION BOARD GUIDANCE DOCUMENT ON DAM BREAK INUNDATION ZONE AND INCREMENTAL DAMAGE ANALYSIS AND MAPPING PROCEDURES
Assessment of Baseline Geomorphic Features at. Proposed Stream Crossings On The Proposed County Road 595. Marquette County, Michigan
 Assessment of Baseline Geomorphic Features at Proposed Stream Crossings On The Proposed County Road 595 Marquette County, Michigan Prepared for: Kennecott Eagle Minerals Company Marquette, Michigan Prepared
Legacy Funding 2011 Special Session
 - Special Session FY2012 FY2013 Total FY2012 FY2013 Total Senate FY2012 FY2013 Total Senate 1 Art 1 - Outdoor Heritage Fund 2 3 Prairies 4 WMA, SNA, & Prairie Bank Easement Acq. Phase III 3,931-3,931 4,690-4,690
Science Skills Station
 Science Skills Station Objective 1. Interpret and analyze data so to determine the relationship between resource availability and carrying capacity of a population. 2. Identify biotic and abiotic factors
Water Level Fluctuations of Lake Enriquillo and Lake Saumatre in Response to Environmental Changes
 Water Level Fluctuations of Lake Enriquillo and Lake Saumatre in Response to Environmental Changes A Masters of Engineering Project Presented to the Faculty of the Graduate School of Cornell University
Pest Management Activities
 Pest Management Activities Pest Animals and Plants Pest animals and plants are reported by the Department of Natural Resources & Mines (2004) as costing Queensland over $600 million annually in lost production
Florida Seagrass Integrated Mapping and Monitoring Program
 Florida Seagrass Integrated Mapping and Monitoring Program - 2004 The following document is composed of excerpts taken from the 2011 publication, Seagrass Integrated Mapping and Monitoring for the State