Total Suspended Solids, Stable Flow, and Wet Weather Event Monitoring in the Bass River Watershed. December The Cadmus Group, Inc.
|
|
|
- Merilyn Allison Watkins
- 5 years ago
- Views:
Transcription
1 Total Suspended Solids, Stable Flow, and Wet Weather Event Monitoring in the Bass River Watershed December 2004 The Cadmus Group, Inc. Grand Valley State University Annis Water Resources Institute Submitted to U.S. Environmental Protection Agency Region 5 Under Task Order Contract No. 68-C8-0010
2 Table of Contents List of Figures... ii List of Tables... ii 1. Introduction Monitoring Locations and Watershed Description for the Bass River Sampling Methods Analytical Methods Bass River Base Flow Data Bass River Storm Event Data Deviations from the Quality Assurance Project Plan... 4 Appendix 1 Bass River Watershed Survey Forms for Monitoring Stations Appendix 2 Bass River Watershed Monitoring Station and Stormwater Outfall Pictures Appendix 3 Michigan Department of Environmental Quality Rating Curves for the Bass River i
3 List of Figures Figure 2.1 The Bass River Watershed List of Tables Table 2.1 Bass River Land Use and Cover Statistics Table 2.2 Bass River Monitoring Stations, Stormwater Outfalls, and Coordinates Table 5.1 Base Flow TSS Loading Data for the Bass River Table 6.1 Bass River TSS Loading Data for the 0.1 Inch Rain Event on 8/25/ Table 6.2 Bass River TSS Loading Data for the 1.1 Inch Rain Event on 8/02/ Table 6.3 Bass River TSS Loading Data for the 1.3 Inch Rain Event on 11/01/ ii
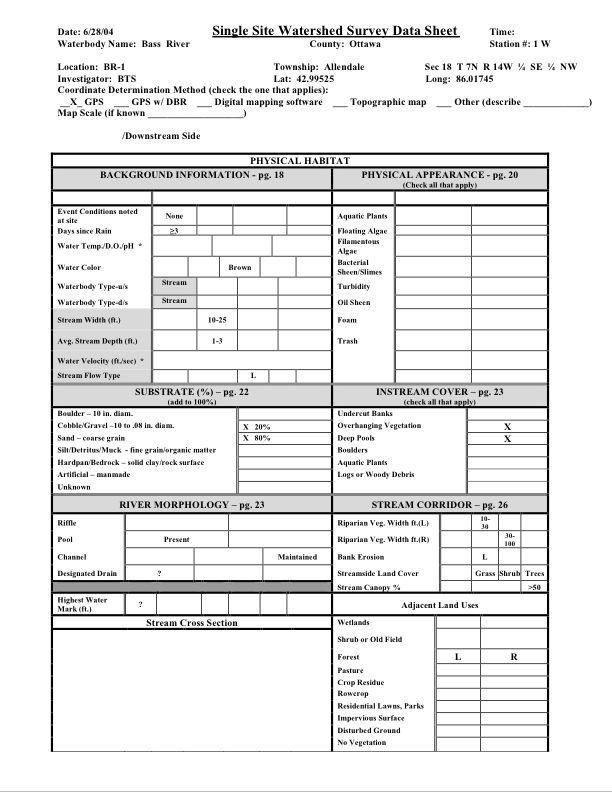
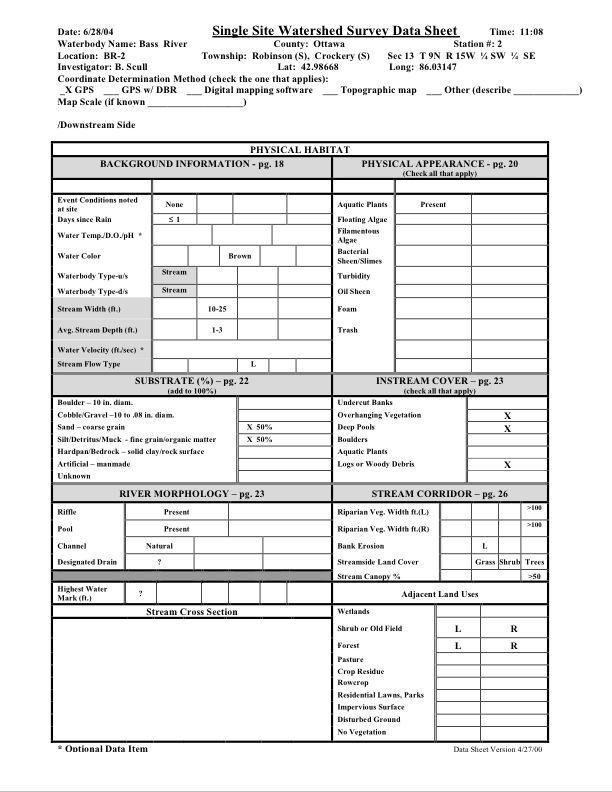
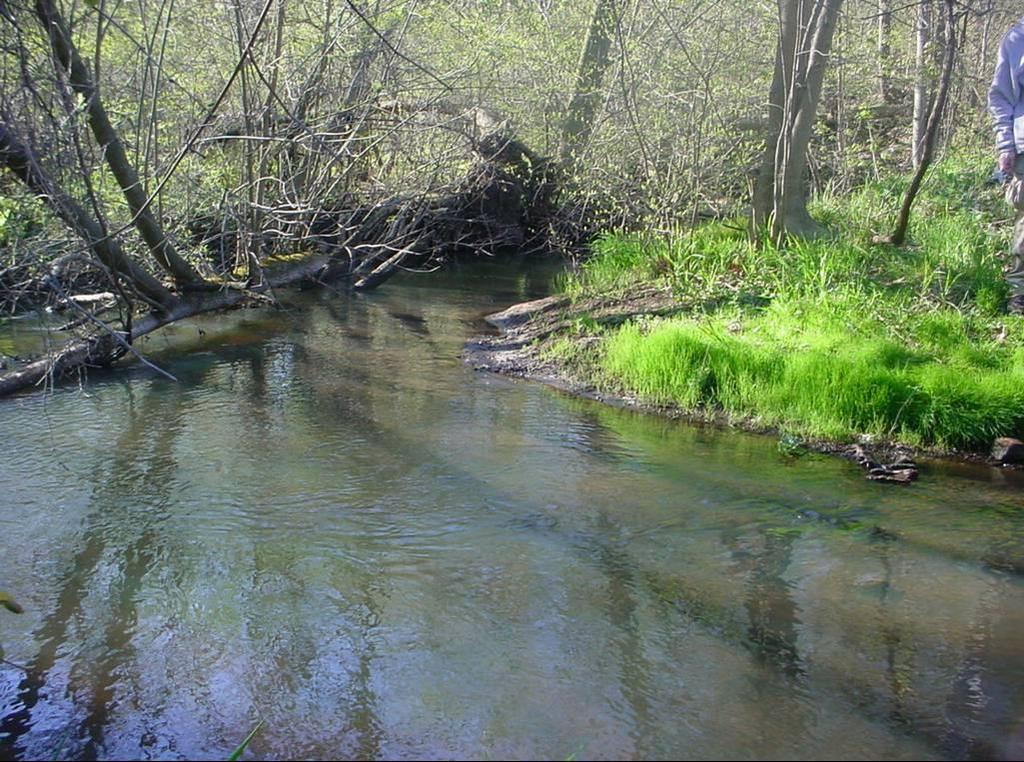
4 1. Introduction An investigation of streams in west Michigan was conducted to monitor the loading of Total Suspended Solids (TSS) and fluctuations in hydrology. The study sites were located in the lower Grand River watershed and included: Bass River, Sand Creek, Strawberry/Mill Creek, York Creek and an unnamed tributary north of Leonard Street and east of East Beltline (M-44). Each of these watersheds is a tributary to the Grand River and is included on Michigan s (d) list as requiring a Total Maximum Daily Load (TMDL) because they were identified as not supporting the designated use for biota. The data for each watershed are summarized in individual reports. This report examines the discharge and loading of TSS at 6 locations in Bass River under base flow (dry conditions) and during storm events. The data from this project will be used to develop a Biota TMDL for the Bass River watershed. 2. Monitoring Locations and Watershed Description for the Bass River Bass River has a 32,020 acre watershed located in Ottawa County (Figure 2.1). Land use in the watershed is primarily agricultural (52%), forests, fields, and wetlands (24%), and residential (20%). A summary of land use/and cover statistics is presented in Table 2.1. Stormwater discharge outfalls were inventoried and six stream locations were selected for flow and TSS monitoring (Figure 2.1). Descriptions and coordinates for the stormwater outfalls and monitoring stations are provided in Table 2.2. Data for the standard Michigan Department of Natural Resources (MDEQ) Steam Survey Form were collected at each monitoring station. The Steam Survey Forms are included in Appendix 1. Photographs of each monitoring station and stormwater location were taken and included in Appendix Sampling Methods Dry weather sampling was conducted on 6/28/04, 7/14/04, and 7/28/04. One grab sample was collected from each station. Dry weather sampling was preceded by at least 72 hours without precipitation as measured at the Grand Rapids Airport. Wet weather sampling was conducted on 8/25/04, 8/28/04, and 11/01/04. The wet weather runoff events were in response to precipitation events of 0.1, 1.1, and 1.3 inches that occurred in a 2 hour time period. Sampling was initiated near the start of each rain event. During the rise and fall of the hydrograph, individual grab samples were collected manually at hourly intervals. Wet weather sampling events lasted from 4-6 hrs. TSS samples were collected at the centroid of each stream transect where approximately 50% of cumulative flow occurred. If the stream was wadeable, samples were collected by immersing a 500 milliliter (ml) polyethylene bottle at mid depth. If the stream was not wadeable, a thief sampler was used. Sample containers were placed in coolers with ice 1

5 Figure 2.1 The Bass River Watershed. 2
6 Table 2.1 Bass River Land Use and Cover Statistics. Map Description Acres % Commercial/Institutional Confined Feeding/Permanent Pasture Coniferous Forest Cropland Deciduous Forest Grasses and Forbs - Open Field Industrial Orchards and Other Specialty Crop Other Agricultural Land 48 0 Other Developed Area Residential Shrub Open Field Water Wetland Total Table 2.2 Bass River Monitoring Stations, Stormwater Outfalls, and Coordinates. Location and GPS Coordinates Type Location Site ID Lat. (N) Long. (W) Monitoring Warner Street (Downstream) BR Monitoring Buchanan Street (Downstream) BR Monitoring Bear Creek at 104 th Avenue (Downstream) BR Monitoring 96 th Avenue (Upstream) BR Monitoring Winans Street (Downstream) BR Monitoring Stanton Street (Upstream) BR Stormwater Pond Stormwater Worley and kept at 4 o C. One field blank sample was collected for every 20 investigative samples. One field duplicate sample was collected for every 10 investigative samples. Flow was measured at each location using a Marsh-McBirney Flow Mate 2000 velocity meter according to United States Geological Survey protocols. Transects were established at each location and water depth measurements were collected using a bridge board and sounding reel or a self-leveling rod. The location of each transect was marked 3
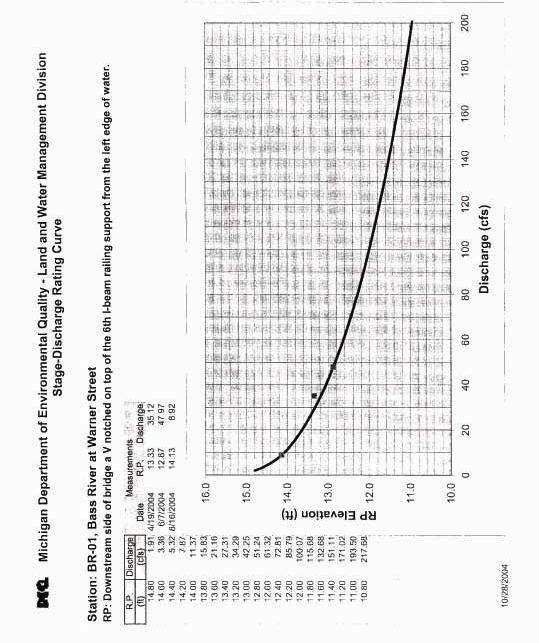
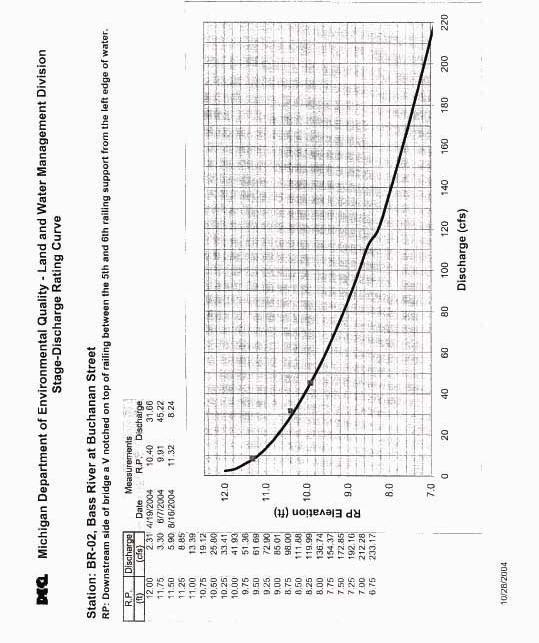
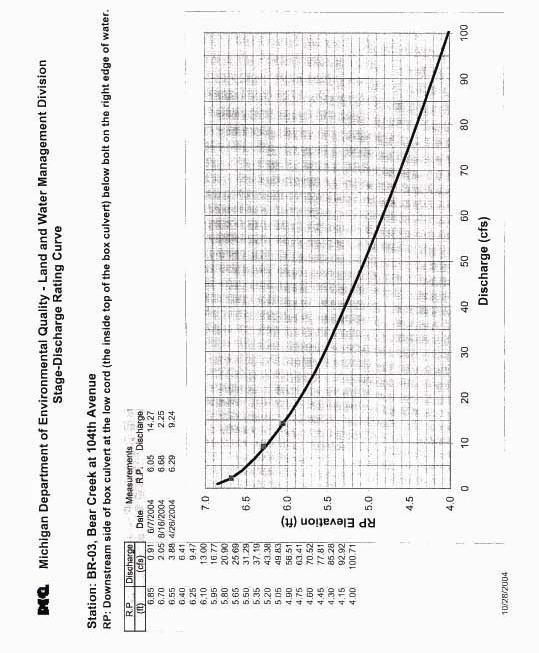
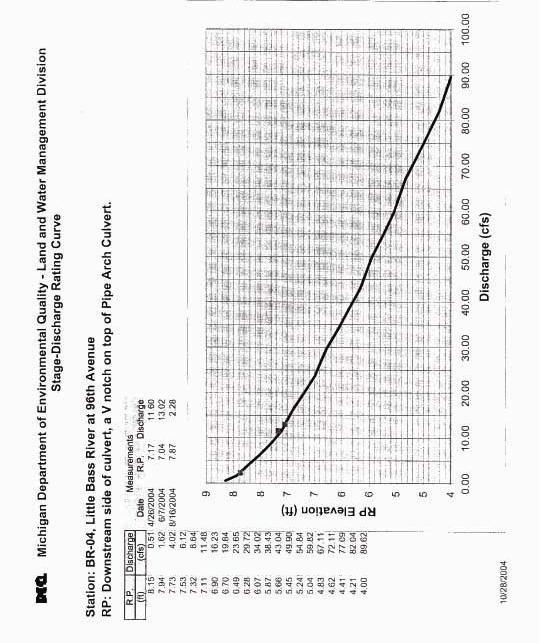
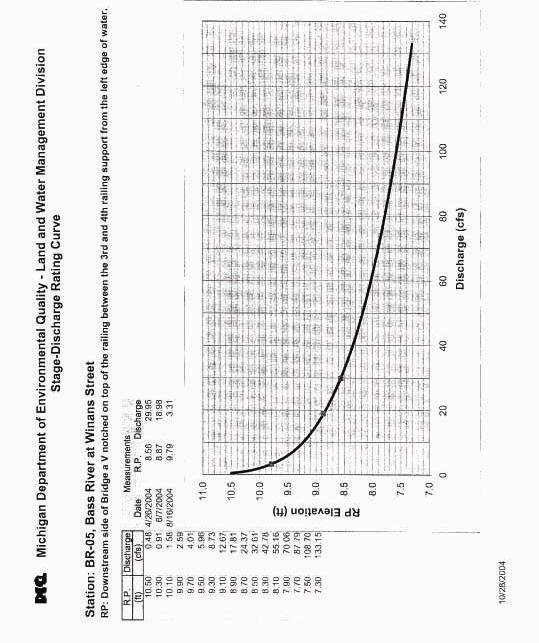
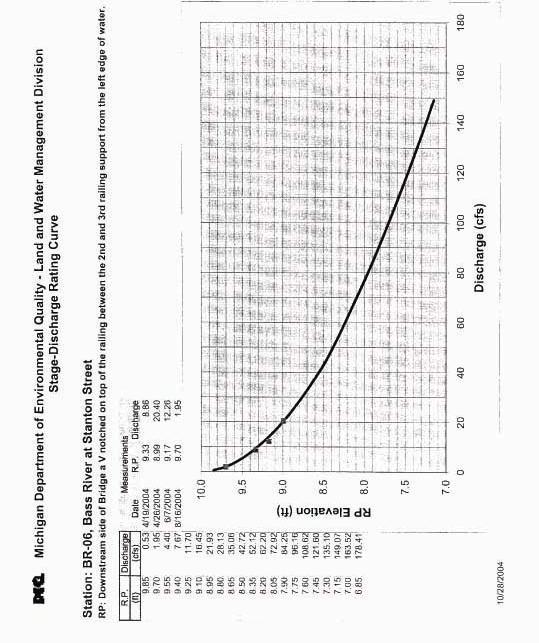
7 by stakes. Depending on stream width, 4 12 equally spaced points along each transect were used for depth and flow measurements. Transect locations were selected to minimize interferences from structural anomalies such as debris jams, bridges, and highly eroded areas. Water elevations were measured at the MDEQ reference point located on each culvert or bridge. Flow measurements were collected during each wet and dry weather sampling event. If the stream depth was < 2.5 feet, flow measurements were taken at 0.6 depth at each transect point. If depths were > 2.5 feet, flow measurements were taken at 0.2 and 0.8 depths. 4. Analytical Methods Total Suspended Solids (TSS) was measured gravimetrically by Environmental Protection Agency (EPA) Method A complete method description was provided in the Quality Assurance Project Plan (QAPP). One laboratory blank and one laboratory duplicate were analyzed for every ten investigative samples. 5. Bass River Base Flow Data Base flow and TSS loading data for the Bass River watershed are summarized in Table 5.1. High precipitation amounts in May (10 inches) and June (4.5 inches) resulted in elevated stream levels during the June 28 monitoring event. There was no measurable precipitation for 7 days prior to the June sampling. Rating Curves developed by the MDEQ for each monitoring station and the location of surface elevation reference points are provided in Appendix 3. Elevations reported at BR-4 (96 th Ave) and BR-6 (Stanton Ave) were taken from the upstream location due to the relocation of the sampling station. The MDEQ reference locations for the rating curves were on the downstream side. The discharge data for these events should not be used to verify the rating curves. 6. Bass River Storm Event Data Storm flow and TSS loading data for the Bass River watershed are summarized in Tables 6.1, 6.2, and 6.3 for the 0.1, 1.1, and 1.3 inch rainfall events, respectively. 7. Deviations from the Quality Assurance Project Plan Some of the field and laboratory duplicates with low suspended solids (<10 mg/l) exceeded the RPD limits. The difference between duplicates ranged from 1-3 mg/l. The small relative difference between duplicates reflects normal variations associated with sampling and analysis at low concentration levels. Based on professional judgment, the data was not qualified. The results of field and laboratory duplicates and blanks were submitted in a separate Quality Assurance report. 4
8 Table 5.1. Base Flow TSS Loading Data for the Bass River. Site ID: Name Discharge Discharge TSS Loading Surface m 3 / sec cfs mg/l lb/d ft Method June 28, 2004 BR-1 Warner (Bass Drive) Meter BR-2 Buchanan St Meter BR-3 Bear Creek at 104th Ave (Tributary) Meter BR-4 96th Ave Meter BR-5 Winans St Meter BR-6 Stanton St Meter July 15, 2004 BR-1 Warner (Bass Drive) Meter BR-2 Buchanan St Meter BR-3 Bear Creek at 104th Ave (Tributary) Meter BR-4 96th Ave Meter BR-5 Winans St Meter BR-6 Stanton St Meter July 29, 2004 BR-1 Warner (Bass Drive) Meter BR-2 Buchanan St Meter BR-3 Bear Creek at 104th Ave (Tributary) Meter BR-4 96th Ave Meter BR-5 Winans St Meter BR-6 Stanton St Meter 5
9 Table 6.1. Bass River TSS Loading Data for the 0.1 Inch Rain Event on 8/25/04. Site ID: Name Discharge Discharge TSS Loading Loading Water Method m 3 / sec cfs mg/l lb/d lb/hr Elevation (ft) 5:00 BR-1 Warner (Bass Drive) Meter BR-2 Buchanan Street Meter BR-3 Bear Creek at 104th Avenue (Tributary) Meter BR-4 96th Avenue Meter BR-5 Winans Street Meter BR-6 Stanton Street Meter BR-1 Warner (Bass Drive) : Meter BR-2 Buchanan Street Meter BR-3 Bear Creek at 104th Avenue (Tributary) Meter BR-4 96th Avenue Meter BR-5 Winans Street Meter BR-6 Stanton Street Meter BR-1 Warner (Bass Drive) : Meter BR-2 Buchanan Street Meter BR-3 Bear Creek at 104th Avenue (Tributary) Meter BR-4 96th Avenue Meter BR-5 Winans Street Meter BR-6 Stanton Street Meter 8:00 BR-1 Warner (Bass Drive) Meter BR-2 Buchanan Street Meter BR-3 Bear Creek at 104th Avenue (Tributary) Meter BR-4 96th Avenue Meter BR-5 Winans Street Meter BR-6 Stanton Street Meter 9:00 BR-1 Warner (Bass Drive) Meter BR-2 Buchanan Street Meter BR-3 Bear Creek at 104th Avenue (Tributary) Meter BR-4 96th Avenue Meter BR-5 Winans Street Meter BR-6 Stanton Street Meter 6
10 Table 6.2. Bass River TSS Loading Data for the 1.1 Inch Rain Event on 8/28/04. Site ID: Name Discharge Discharge TSS Loading Loading Water Method m 3 / sec cfs mg/l lb/d lb/hr Elevation (ft) 4:30 BR-1 Warner (Bass Drive) Meter BR-2 Buchanan Street Meter BR-3 Bear Creek at 104th Avenue (Tributary) Meter BR-4 96th Avenue Meter BR-5 Winans Street Meter BR-6 Stanton Street Meter BR-1 Warner (Bass Drive) : Meter BR-2 Buchanan Street Meter BR-3 Bear Creek at 104th Avenue (Tributary) Meter BR-4 96th Avenue Meter BR-5 Winans Street Meter BR-6 Stanton Street Meter 6:30 BR-1 Warner (Bass Drive) Meter BR-2 Buchanan Street Meter BR-3 Bear Creek at 104th Avenue (Tributary) Meter BR-4 96th Avenue Meter BR-5 Winans Street Meter BR-6 Stanton Street Meter 7:30 BR-1 Warner (Bass Drive) Meter BR-2 Buchanan Street Meter BR-3 Bear Creek at 104th Avenue (Tributary) Meter BR-4 96th Avenue Meter BR-5 Winans Street Meter BR-6 Stanton Street Meter BR-1 Warner (Bass Drive) : Meter BR-2 Buchanan Street Meter BR-3 Bear Creek at 104th Avenue (Tributary) Meter BR-4 96th Avenue Meter BR-5 Winans Street Meter BR-6 Stanton Street Meter BR-1 Warner (Bass Drive) : Meter BR-2 Buchanan Street Meter BR-3 Bear Creek at 104th Avenue (Tributary) Meter BR-4 96th Avenue Meter BR-5 Winans Street Meter BR-6 Stanton Street Meter 10:30 BR-1 Warner (Bass Drive) Meter BR-2 Buchanan Street Meter BR-3 Bear Creek at 104th Avenue (Tributary) Meter BR-4 96th Avenue Meter BR-5 Winans Street Meter BR-6 Stanton Street Meter 7
11 Table 6.3. Bass River TSS Loading Data for the 1.3 Inch Rain Event on 11/01/04. Site ID: Name Discharge Discharge TSS Loading Loading Water Method m 3 / sec cfs mg/l lb/d lb/hr Elevation (ft) 4:30 BR-1 Warner (Bass Drive) B Board BR-2 Buchanan Street Meter BR-3 Bear Creek at 104th Avenue (Tributary) Meter BR-4 96th Avenue Meter BR-5 Winans Street Meter BR-6 Stanton Street Meter BR-1 Warner (Bass Drive) : B Board BR-2 Buchanan Street Meter BR-3 Bear Creek at 104th Avenue (Tributary) Meter BR-4 96th Avenue Meter BR-5 Winans Street Meter BR-6 Stanton Street Meter 6:30 BR-1 Warner (Bass Drive) B Board BR-2 Buchanan Street Meter BR-3 Bear Creek at 104th Avenue (Tributary) Meter BR-4 96th Avenue Meter BR-5 Winans Street Meter BR-6 Stanton Street Meter 7:30 BR-1 Warner (Bass Drive) B Board BR-2 Buchanan Street Meter BR-3 Bear Creek at 104th Avenue (Tributary) Meter BR-4 96th Avenue Meter BR-5 Winans Street Meter BR-6 Stanton Street Meter BR-1 Warner (Bass Drive) : B Board BR-2 Buchanan Street Meter BR-3 Bear Creek at 104th Avenue (Tributary) Meter BR-4 96th Avenue Meter BR-5 Winans Street Meter BR-6 Stanton Street Meter BR-1 Warner (Bass Drive) : B Board BR-2 Buchanan Street Meter BR-3 Bear Creek at 104th Avenue (Tributary) Meter BR-4 96th Avenue Meter BR-5 Winans Street Meter BR-6 Stanton Street Meter 10:30 BR-1 Warner (Bass Drive) B Board BR-2 Buchanan Street Meter BR-3 Bear Creek at 104th Avenue (Tributary) Meter BR-4 96th Avenue Meter BR-5 Winans Street Meter BR-6 Stanton Street Meter 8
12 Appendix 1 Bass River Watershed Survey Forms for Monitoring Stations
13 10
14 11
15 12
16 13
17 14
18 15
19 16
20 17
21 18
22 19
23 20
24 21
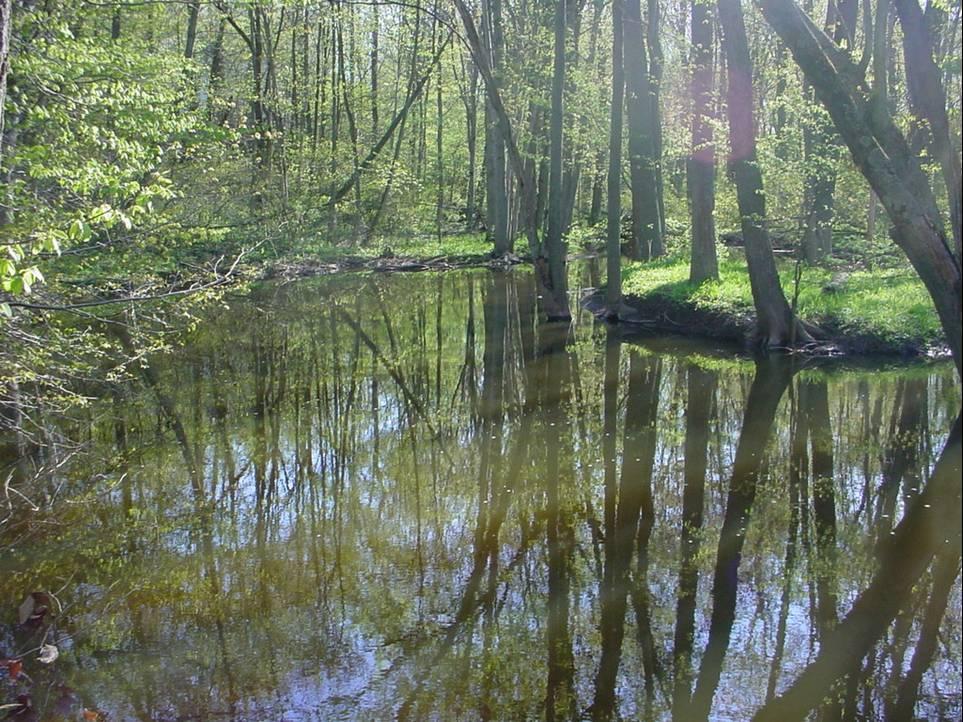
25 Appendix 2 Bass River Watershed Monitoring Station Pictures
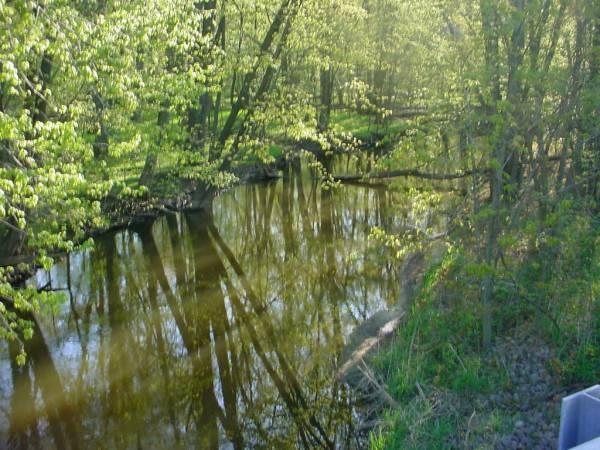
26 BR-1 Downstream 23
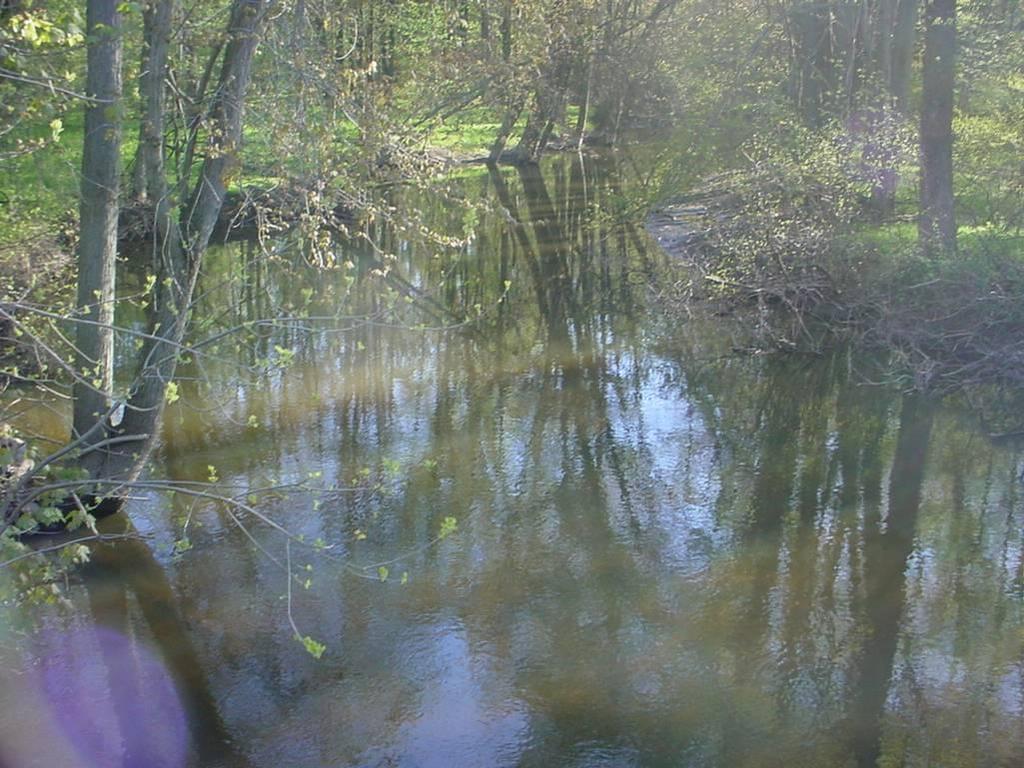
27 BR-2 Downstream 24
28 BR-3 Downstream 25

29 BR-3 Culvert 26

30 BR-4 Upstream 27

31 BR-4 Culvert 28
32 BR-5 Downstream 29

33 BR-5 Bridge 30

34 BR-6 Upstream 31

35 BR-6 Bridge 32
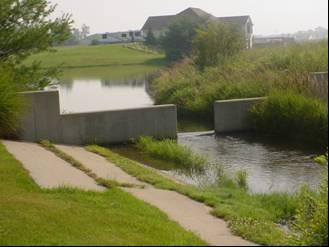
36 Stormwater Pond 33

37 Stormwater Pond 34
38 Appendix 3 Bass River Watershed MDEQ Rating Curves
39 36
40 37
41 38
42 39
43 40
44 41
Total Suspended Solids, Stable Flow, and Wet Weather Event Monitoring in the Unnamed Tributary to the Grand River Watershed.
 Total Suspended Solids, Stable Flow, and Wet Weather Event Monitoring in the Unnamed Tributary to the Grand River Watershed December 2004 The Cadmus Group, Inc. Grand Valley State University Annis Water
Minnesota Department of Natural Resources Division of Fish and Wildlife Section of Fisheries. Stream Survey Report. Cold Spring Creek.
 Minnesota F-29-R(P)-24 Area 315 Study 3 March 2013 Minnesota Department of Natural Resources Division of Fish and Wildlife Section of Fisheries Stream Survey Report Cold Spring Creek 2012 Mark Pelham Montrose
Minnesota Department of Natural Resources Division of Fish and Wildlife Section of Fisheries. Stream Survey Report. Luxemburg Creek.
 Minnesota F-29-R(P)-24 Area 315 Study 3 March 2016 Minnesota Department of Natural Resources Division of Fish and Wildlife Section of Fisheries Stream Survey Report Luxemburg Creek 2015 Mark Pelham Sauk
Minnesota Department of Natural Resources Division of Fish and Wildlife Section of Fisheries. Stream Survey Report. Cold Spring Creek.
 Minnesota F-29-R(P)-24 Area 315 Study 3 March 2015 Minnesota Department of Natural Resources Division of Fish and Wildlife Section of Fisheries Stream Survey Report Cold Spring Creek 2014 Mark Pelham Montrose
Assessment of Baseline Geomorphic Features at. Proposed Stream Crossings On The Proposed County Road 595. Marquette County, Michigan
 Assessment of Baseline Geomorphic Features at Proposed Stream Crossings On The Proposed County Road 595 Marquette County, Michigan Prepared for: Kennecott Eagle Minerals Company Marquette, Michigan Prepared
WASHINGTON CONSERVATION DISTRICT STANDARD OPERATING PROCEDURE (S.O.P.)
") Page 1 of 18 Water Monitoring Program WASHINGTON CONSERVATION DISTRICT STANDARD OPERATING PROCEDURE (S.O.P.) No. 1 FLOW MONITORING Page 2 of 18 Water Monitoring Program Standard Operating Procedure No.
Page 1 of 18 Water Monitoring Program WASHINGTON CONSERVATION DISTRICT STANDARD OPERATING PROCEDURE (S.O.P.) No. 1 FLOW MONITORING Page 2 of 18 Water Monitoring Program Standard Operating Procedure No.
APPENDIX J HYDROLOGY AND WATER QUALITY
 APPENDIX J HYDROLOGY AND WATER QUALITY J-1 Technical Report on Airport Drainage, Northern Sector Airport and Ordinance Creek Watershed / Preliminary Creek Constructed Natural Channel Culvert J-2 Preliminary
Minnesota Department of Natural Resources Division of Fish and Wildlife Section of Fisheries. Stream Survey Report. Three Mile Creek 2011
 Minnesota Department of Natural Resources Division of Fish and Wildlife Section of Fisheries Stream Survey Report Three Mile Creek 2011 By Joseph D. Stewig Montrose Area Fisheries Office TABLE OF CONTENTS
STUDY PERFORMANCE REPORT
 STUDY PERFORMANCE REPORT State: Michigan Project No.: F-80-R-4 Study No.: 702 Title: Effects of sediment traps on Michigan river channels Period Covered: October 1, 2002 to September 30, 2003 Study Objectives:
3.0 Basin and Watershed Characteristics
 3.0 Basin and Watershed Characteristics 3.1 Basin Characteristics 3.1.1 Crystal Lake Crystal Lake, located in the cities of Burnsville and Lakeville (Dakota County), covers an area of approximately 292
UPPER GALLATIN TMDL PLANNING AREA BIOLOGICAL MONITORING
 UPPER GALLATIN TMDL PLANNING AREA BIOLOGICAL MONITORING Sampling and Analysis Plan Prepared for: BLUE WATER TASK FORCE, INC. Katie Alvin PO Box 160513 Big Sky, MT 59716 AND MONTANA DEPARTMENT OF ENVIRONMENTAL
Illinois State Water Survey
 Illinois State Water Survey HYDROLOGY DIVISION SWS Contract Report 508 COMPARISON OF 1987 AND 1989 BED PROFILE SURVEYS OF THE LOWER CACHE RIVER by Richard Allgire Office of Sediment and Wetland Studies
FLOW MEASUREMENT (SEMI-SUBMERGIBLE OBJECT METHOD)
") Page 83 of 232 OKLAHOMA CONSERVATION COMMISSION WATER QUALITY DIVISION STANDARD OPERATING PROCEDURE FLOW MEASUREMENT (SEMI-SUBMERGIBLE OBJECT METHOD) Page 84 of 232 1.0 PROCEDURAL SECTION 1.1 Scope and
Page 83 of 232 OKLAHOMA CONSERVATION COMMISSION WATER QUALITY DIVISION STANDARD OPERATING PROCEDURE FLOW MEASUREMENT (SEMI-SUBMERGIBLE OBJECT METHOD) Page 84 of 232 1.0 PROCEDURAL SECTION 1.1 Scope and
Lower Coquitlam River Project Water Use Plan. Temperature Monitoring Lower Coquitlam River Project Year 2 Report
 Lower Coquitlam River Project Water Use Plan Temperature Monitoring Lower Coquitlam River Project Year 2 Report COQMON#6 Temperature Monitoring Study Lower Coquitlam River Study Period: Year 2-2007 Report
TOP:001.3 U.S. Fish and Wildlife Service TECHNICAL OPERATING PROCEDURE
 TOP:001.3 March 12, 2015 U.S. Fish and Wildlife Service Marquette Biological Station 3090 Wright Street Marquette, Michigan 49855 U.S.A. and U.S. Fish and Wildlife Service Ludington Biological Station
Technical Report Culvert A Hydraulic Analysis
 DATE: November 3, 2011 Technical Report Culvert A Hydraulic Analysis TO: FROM: RE: Jim Reiser, P.E. Project Manager Parsons Brinckerhoff, Inc. Kurt Killian, P.E., CFM Parsons Brinckerhoff, Inc. Design
TROUT CREEK WATERSHED (Second Year of Snowline Data)
") Extent of Snow Cover During the 2002 Spring Freshet For the TROUT CREEK WATERSHED (Second Year of Snowline Data) (Penticton Forest District) 1.0 INTRODUCTION The extent of snow cover over a watershed basin
Extent of Snow Cover During the 2002 Spring Freshet For the TROUT CREEK WATERSHED (Second Year of Snowline Data) (Penticton Forest District) 1.0 INTRODUCTION The extent of snow cover over a watershed basin
Gamefish Assessment Report
 MINNESOTA DEPARTMENT OF NATURAL RESOURCES Gamefish Assessment Report Spring Gamefish Assessment on the Mississippi River from Little Falls to Brainerd, MN May 31 through June 4, 2013 River Miles 966 to
Coquitlam/Buntzen Project Water Use Plan
 Coquitlam/Buntzen Project Water Use Plan Temperature Monitoring Lower Coquitlam River Project Year 3 Report Reference: COQMON#6 Study Period: March 2008 April 2009 Report Date: April 2009 Trow Associates
Creek Trash Assessment (CTA) Methodology (Demonstration: Mill Run Creek, Cheltenham, Pa.)
 Methodology (Demonstration: Mill Run Creek, Cheltenham, Pa.)") Creek Trash Assessment (CTA) Methodology (Demonstration: Mill Run Creek, Cheltenham, Pa.) Mill Run Creek emerges from a storm sewer in Philadelphia to an open creek in Cheltenham. The Creek downstream
Creek Trash Assessment (CTA) Methodology (Demonstration: Mill Run Creek, Cheltenham, Pa.) Mill Run Creek emerges from a storm sewer in Philadelphia to an open creek in Cheltenham. The Creek downstream
Fish Passage Culvert Assessment for Cahilty Creek Watershed FIA Project #
 Fish Passage Culvert Assessment for Cahilty Creek Watershed FIA Project # 4602004 Prepared for Weyerhaeuser Company Ltd. Jason Ladyman R.P.F. 1550 Mission Flats Road PO Box 40 Kamloops BC V2C 5K3 Prepared
Upper Iroquois River atershed Management Plan
 2013 Upper Iroquois River atershed Management Plan Daniel M Perkins Jasper County Soil and Water Conservation District 12/30/2013 Table of Contents 1.1 WATERSHED COMMUNITY INITIATIVE... 12 1.2 Project
Stormwater Management Pond Design Brief. Greely Village Centre - Commercial Phase - Ultimate Conditions - - City of Ottawa -
 Stormwater Management Pond Design Brief Greely Village Centre - Commercial Phase - Ultimate Conditions - - City of Ottawa - December 2008 Ref: 647-07 J.F. Sabourin and Associates Inc. Water Resources and
WMS 8.4 Tutorial Hydraulics and Floodplain Modeling HY-8 Modeling Wizard Learn how to model a culvert using HY-8 and WMS
 v. 8.4 WMS 8.4 Tutorial Hydraulics and Floodplain Modeling HY-8 Modeling Wizard Learn how to model a culvert using HY-8 and WMS Objectives Define a conceptual schematic of the roadway, invert, and downstream
INDIANA REGIONAL GENERAL CONDITIONS FOR THE STATE OF INDIANA
 INDIANA REGIONAL GENERAL CONDITIONS FOR THE STATE OF INDIANA These regional conditions are in addition to but do not supersede the requirements in the Federal Register (Volume 82 No. 4 of January 6, 2017).
Site selection criteria. Stream selection criteria
 Duluth Urban Watersheds Project 2014-2016 Advisory Council 1-22, 2015 Stream selection criteria Impaired (MPCA/EPA) DNR Trout Stream designation Geographic distribution across Duluth Acceptable site available
CCoWS. Central Coast Watershed Studies. Summary of Precipitation and Streamflow for Potrero and San Clemente Creeks in 2010
 Central Coast Watershed Studies CCoWS Summary of Precipitation and Streamflow for Potrero and San Clemente Creeks in Water-Year 2010 Santa Lucia Preserve Monterey County, California Publication No. WI-2011-01
HEC 26 Aquatic Organism Passage Design Manual Evolution & Application
 HEC 26 Aquatic Organism Passage Design Manual Evolution & Application Sven Leon, P.E., Hydraulics Engineer Federal Highway Administration 2015 Alaska Fish Passage Meeting October 13 14, 2015 VTRC, Juneau,
New two-lane bridge to replace the existing structure spanning the Maple River just south of the Village s central business district
 New two-lane bridge to replace the existing structure spanning the Maple River just south of the Village s central business district Rehabilitate the old bridge Convert to a nonmotorized trail Restore
HISTORY OF CONSTRUCTION
 HISTORY OF CONSTRUCTION CFR 257.73(c)(1) West Boiler Slag Pond Clifty Creek Plant Madison, Indiana October, 2016 Prepared for: Indiana Kentucky Electric Corporation Prepared by: American Electric Power
USING A LABYRINTH WEIR TO INCREASE HYDRAULIC CAPACITY. Dustin Mortensen, P.E. 1 Jake Eckersley, P.E. 1
 USING A LABYRINTH WEIR TO INCREASE HYDRAULIC CAPACITY Dustin Mortensen, P.E. 1 Jake Eckersley, P.E. 1 Plum Creek Floodwater Retarding Structure No. 6 is located in an area of Kyle, Texas, that is currently
Picture Spring Branch Hydrologic and Hydraulic Analysis Report. Prepared for: Anne Arundel County. Final
 Picture Spring Branch Hydrologic and Hydraulic Analysis Report Prepared for: Anne Arundel County Final Date: November 30, 2017 Picture Spring Branch Hydrologic and Hydraulic Analysis Report November 30,
Tahquamenon River Assessment
 State owned land USFS land Superior Lower Falls USGS Gauging Station Superior Tahquamenon s Belle s Slater s Bass Betty B Dollarville Flooding Eckerman McMillan Mud East Kaks Twin McPhee s Hulbert Hulbert
SECTION 2 HYDROLOGY AND FLOW REGIMES
 SECTION 2 HYDROLOGY AND FLOW REGIMES In this section historical streamflow data from permanent USGS gaging stations will be presented and discussed to document long-term flow regime trends within the Cache-Bayou
Interim Guidance Fish Presence Absence
 Interim Guidance Fish Presence Absence Source: Forest Practices Act Guidance for Division 635 of the forest practices act dealing with stream classification when no fish surveys have been done (referenced
OFFICE OF STRUCTURES MANUAL FOR HYDROLOGIC AND HYDRAULIC DESIGN CHAPTER 11 APPENDIX B TIDEROUT 2 USERS MANUAL
 OFFICE OF STRUCTURES MANUAL FOR HYDROLOGIC AND HYDRAULIC DESIGN CHAPTER 11 APPENDIX B TIDEROUT 2 USERS MANUAL APRIL 2011 APRIL 2011 Page 1 Preface TIDEROUT 2, Build 1.22 dated June 29, 2006 is the current
Chinook Salmon Spawning Study Russian River Fall 2005
 Chinook Salmon Spawning Study Russian River Fall 2005 Sonoma County Water Agency 2150 West College Avenue Santa Rosa, California 95401 Prepared by David Cook - Senior Environmental Specialist March 27,
ADDENDA B Hydrologic and Hydraulic (H&H) Study Guidance 2019
 Study Guidance 2019") 09/25/2018 DRAFT FEMA Region I PA H&H Study ADDENDA B Hydrologic and Hydraulic (H&H) Study Guidance 2019 Region I Federal Emergency Management Agency (FEMA) Public Assistance Hydrologic and Hydraulic (H&H)
09/25/2018 DRAFT FEMA Region I PA H&H Study ADDENDA B Hydrologic and Hydraulic (H&H) Study Guidance 2019 Region I Federal Emergency Management Agency (FEMA) Public Assistance Hydrologic and Hydraulic (H&H)
Assessment of Soil Erosion at a DC Park Facility Spring Valley Park NW Washington, DC
 Assessment of Soil Erosion at a DC Park Facility Spring Valley Park NW Washington, DC Annual Progress Report for FY 2004 Prepared by: Principal Investigators: Inder Bhambri, Ph.D., PE Philip Brach, Ph.D.,
Suitable Applications Check dams may be appropriate in the following situations: To promote sedimentation behind the dam.
 Categories EC Erosion Control SE Sediment Control TC Tracking Control WE Wind Erosion Control Non-Stormwater NS Management Control Waste Management and WM Materials Pollution Control Legend: Primary Category
Public Notice. Corps File No. LRE Date: March 19, 2017 Expires: March 18, 2022
 US Army Corps of Engineers Detroit District Public Notice Corps File No. LRE-2016-00006-100 Date: March 19, 2017 Expires: March 18, 2022 PUBLIC NOTICE ANNOUNCING REGIONAL CONDITIONS AND WATER QUALITY CERTIFICATIONS
Water budgets of the two Olentangy River experimental wetlands in 1998
 Water budgets of the two Olentangy River experimental wetlands in 1998 Naiming Wang and William J. Mitsch School of Natural Resources The Ohio State University Water Budgets 17 Introduction An understanding
STUDY REPORT W&AR-03 RESERVOIR TEMPERATURE MODEL ATTACHMENT B DON PEDRO RESERVOIR BATHYMETRIC STUDY REPORT
 STUDY REPORT W&AR-03 RESERVOIR TEMPERATURE MODEL ATTACHMENT B DON PEDRO RESERVOIR BATHYMETRIC STUDY REPORT DON PEDRO RESERVOIR BATHYMETRIC STUDY REPORT Prepared for: TURLOCK IRRIGATION DISTRICT MODESTO
APPENDIX H LAKE OKEECHOBEE FLOOD ROUTINES
 1 2 3 APPENDIX H LAKE OKEECHOBEE FLOOD ROUTINES 1 2 3 4 5 6 7 8 9 10 11 12 13 14 15 16 17 18 19 20 21 22 23 24 25 26 27 28 29 30 31 32 33 34 35 36 37 38 39 40 41 42 43 44 45 LAKE OKEECHOBEE FLOOD ROUTINGS
E-3: Jurisdictional Determination Supplement Report
 Lake Ralph Hall Appendix E E-3: Jurisdictional Determination Supplement Report P.O. Drawer 305 Lewisville, TX 75067 REGIONAL WATER DISTRICT (972)219-1228 Fax(972)221-9896 June 22, 2017 Mr. Chandler Peter
Advancing Fish Passage in the Menomonee River Watershed
 University of Massachusetts - Amherst ScholarWorks@UMass Amherst International Conference on Engineering and Ecohydrology for Fish Passage International Conference on Engineering and Ecohydrology for Fish
MINNESOTA FRESHWATER MUSSEL SURVEY AND RELOCATION PROTOCOL
 MINNESOTA FRESHWATER MUSSEL SURVEY AND RELOCATION PROTOCOL Minnesota Department of Natural Resources, Division of Ecological and Water Resources U.S. Fish and Wildlife Service, Twin Cities Field Office
STREAM SURVEY File form No..
 scanned for KRIS THE RESOURCES AGENCY OF CALIFORNIA California Department of Fish and Game STREAM SURVEY File form No.. Date: September 4, 1969. NAME: North Fork Schooner Gulch Creek COUNTY: Mendocino.
FINAL REPORT APPENDIX A. Physical Description of the Shubenacadie River
 FINAL REPORT APPENDIX A Physical Description of the Shubenacadie River Smart Solutions for Engineering, Science and Computing Physical Description of the Shubenacadie River Martec Technical Report # TR-07-12
EXTENT OF OBSERVATION
 scanned for KRIS THE RESOURCES AGENCY OF CALIFORNIA Department of Fish and Game STREAM SURVEY Date: May 25 and 31, 1977. NAME: Unnamed Stream (Tributary to Sonoma Creek) COUNTY: Sonoma. STREAM SECTION:
Temperature Profiling Within the Trout Creek Sub-Watershed 2013 Prepared by the Kennebecasis Watershed Restoration Committee January 2014
 Temperature Profiling Within the Trout Creek Sub-Watershed 2013 Prepared by the Kennebecasis Watershed Restoration Committee January 2014 A partnership project between the KWRC and Agriculture and Agri-Foods
Michigan Department of Natural Resources Status of the Fishery Resource Report Page 1
 Michigan Department of Natural Resources 2008-59 Status of the Fishery Resource Report Page 1 Bowens Manistee County, (T24N R16W Sec. 11, 12, 13, 14, 15, 24, and 30). Last surveyed 2008 Mark A. Tonello
Annual Meeting and Director Elections
 Annual Meeting and Director Elections 6:00 p.m. Reception 6:30 p.m. Annual Meeting & Election 1 vacant seat on 5- member board 4-year term Candidate: Scott Hanshue Meet the Candidate Scott Hanshue: Scott
Final TMDL Report Fecal Coliform TMDLs for Trout River, WBIDs 2203A and 2203
 FLORIDA DEPARTMENT OF ENVIRONMENTAL PROTECTION Division of Environmental Assessment and Restoration, Bureau of Watershed Management NORTHEAST DISTRICT LOWER ST. JOHNS BASIN Final TMDL Report Fecal Coliform
San Antonio Creek Spreading Grounds Rehabilitation Project Ojai Valley, CA
 Ventura County Watershed Protection District San Antonio Creek Spreading Grounds Rehabilitation Project Ojai Valley, CA Presentation to Ventura River Watershed Council Project Funding Proposition 50 Integrated
Newaukum Watershed Culvert Assessment
 Newaukum Watershed Culvert Assessment Water Resource Inventory Area 23 Lewis County Conservation District Final Report By: Kelly Verd and Nikki Wilson July 2002 Funded by: Chehalis Fisheries Restoration
ATTACHMENT F. Minnesota Department of Natural Resources. Marsh Lake Ecosystem Restoration Project
 ATTACHMENT F Minnesota Department of Natural Resources Marsh Lake Ecosystem Restoration Project Mussel Rescue and Translocation Plan for Pomme de Terre River Restoration (Prepared June, 2016) Attachment
Culvert Design for Low and High Gradient Streams in the Midwest. Dale Higgins, Hydrologist Chequamegon-Nicolet National Forest
 Culvert Design for Low and High Gradient Streams in the Midwest Dale Higgins, Hydrologist Chequamegon-Nicolet National Forest Overview Culvert Design Considerations Hydraulic Terms Culvert Impacts Low
HYDROLOGIC AND HYDRAULIC REPORT PROPOSED CULVERT STRUCTURES SR 194, SECTION 10
 HYDROLOGIC AND HYDRAULIC REPORT PROPOSED CULVERT STRUCTURES SR 194, SECTION 10 RACETRACK ROAD CULVERT OVER THE SPRING RUN & GREEN SPRINGS ROAD CULVERT OVER AN UNNAMED TRIBUTARY TO SPRING RUN BERWICK TOWNSHIP
STRUCTURE 65-B PURPOSE SPILLWAY OPERATION
 STRUCTURE 65-B This structure is a reinforced concrete, gated spillway with discharge controlled by three cable operated vertical lift gates and a reinforced concrete lock structure with two pairs of sector
South Fork Chehalis Watershed Culvert Assessment
 South Fork Chehalis Watershed Culvert Assessment Water Resource Inventory Area 23 Lewis County Conservation District Final Report By: Kelly Verd and Nikki Wilson March 2003 Funded by: The Washington State
STREAM Girls field notebook
 s STREAM Girls field notebook Welcome...... to your stream! Trout Unlimited is excited to offer you and other Girl Scouts the chance to really get to know your home waters. Over the next three days, you
1.Mill Creek Watershed Summary Description and Land Use
 1.Mill Creek Watershed Summary Description and Land Use Table xxx: Mill Creek Watershed Overview Watershed Size 31,435 acres/49.1 sq miles/ 127.1 sq km Elevation Range 5,594 feet [4,967-10,561] Stream
Hard Hat Services ph: hardhatinc.com 932 N. Wright St., Suite 160 Naperville, IL 60563
 Interstate Power and Light Company Ottumwa Generation Station CCR Surface Impoundment Annual Inspection Report 154.018.015.003 Report issued: July 03, 2017 Hard Hat Services ph: 877-630-7428 hardhatinc.com
CLYDE RIVER FISH KILL 2016 PRELIMINARY REPORT
 CLYDE RIVER FISH KILL 2016 PRELIMINARY REPORT November 2016 CLYDE RIVER FISH KILL PRELIMINARY REPORT, NOVEMBER 2016 SUMMARY A fish kill on Clyde River was reported to e Prince Edward Island Department
QC CHECKS OF DATA SHEETS FROM QUARTERLY MONITORING Rev. 6/11/18
 QC CHECKS OF DATA SHEETS FROM QUARTERLY MONITORING Rev. 6/11/18 Definitions of levels of monitoring events, for Streamkeepers quarterly stream-teams: o Episode: entire quarterly monitoring set o Tour:
Table 1. Monthly precipitation totals from the on-site rain gage and from the Dulles weather station and their differences.
 Table 1. Monthly precipitation totals from the on-site rain gage and from the Dulles weather station and their differences. Precipitation Month On-Site Rain Dulles Weather Difference Ratio 1996-97 Gage
Stream Assessment Cut-block: For: Island Timberlands Limited Partnership, Cameron Operation
 Stream Assessment Cut-block: 171214 For: Island Timberlands Limited Partnership, Cameron Operation Tony Norris Area Engineer Island Timberlands Cameron Operation Port Alberni D.G. Rigets E.I.A. CTech.
Kasaan to Goose Creek Road Project Project Description U.S. Army Corps of Engineers Permit The following table presents the mile point of the culverte
 Kasaan to Goose Creek Road Project Project Description U.S. Army Corps of Engineers Permit The following table presents the mile point of the culverted open water crossings, name of water crossing if known,
Packwood Lake Intake Screen Velocity Test Report for Energy Northwest's Packwood Lake Hydroelectric Project FERC No Lewis County, Washington
 for Energy Northwest's Packwood Lake Hydroelectric Project FERC No. 2244 Lewis County, Washington Submitted to P.O. Box 968 Richland, Washington 99352-0968 Submitted by EES Consulting 1155 North State
SUMMARY OF MOVEMENT AND HABITAT USED BY TAGGED BROOK TROUT IN THE MAIN BRANCH AND NORTH BRANCH AU SABLE RIVER DURING SUMMER Data Submitted to:
 SUMMARY OF MOVEMENT AND HABITAT USED BY TAGGED BROOK TROUT IN THE MAIN BRANCH AND NORTH BRANCH AU SABLE RIVER DURING SUMMER 2014 Data Submitted to: Anglers of the Au Sable Submitted by: Dr. Mark R. Luttenton
SSO 700 Integrated Watershed Action Plan: Continuous Calibration of a Model
 SSO 700 Integrated Watershed Action Plan: Continuous Calibration of a Model 5 Cities Plus August 16, 2017 Presented by Matt Spidare, P.E MSDGC Victoria Berry, P.E. CH2M Overview of Presentation Project
Great Lakes Stream Crossing Inventory Instructions
 Great Lakes Stream Crossing Inventory Instructions This document is a guide to completing the Stream Crossing Data Sheet (2/28/11 version). Careful attention to this guidance will ensure consistent crossing
INTERNATIONAL JOURNAL OF CIVIL AND STRUCTURAL ENGINEERING Volume 5, No 2, 2014
 INTERNATIONAL JOURNAL OF CIVIL AND STRUCTURAL ENGINEERING Volume 5, No 2, 2014 Copyright by the authors - Licensee IPA- Under Creative Commons license 3.0 Research article ISSN 0976 4399 Modification of
Dr. Bob Harrington March 2, 2015 Inyo County Water Department 135 South Jackson Street Independence, CA 93526
 Dr. Bob Harrington March 2, 2015 Inyo County Water Department 135 South Jackson Street Independence, CA 93526 RE: Summary of Hydrologic Monitoring Activities February 2015 Rose Valley, Inyo County, California
reported in stream flow.
 Chicago River Field Trip Activity Summary Students will calculate flow rate and stream flow of a local river. Background Flow rate measures the speed at which water in a river is travelling down the river
BC Ministry of Forests. March Fish Stream Crossing Guidebook. Forest Practices Code of British Columbia.
 FRST 557 Lecture 7c Bridges and Culverts: Water Velocity and Discharge Lesson Background and Overview: The previous two lessons presented methods for estimating water volume flow at a particular site and
COLUMBIA LAKE DAM REMOVAL PROJECT
 COLUMBIA LAKE DAM REMOVAL PROJECT Major Goals of the Columbia Lake Dam Removal: Reconnect 10 miles of the Paulins Kill River to the Delaware River, restoring natural flow regime and sediment transport.
Stormwater Level of Service Study - Phase 2 Flooding Adjacent to Rock Creek
 Stormwater Level of Service Study - Phase 2 Flooding Adjacent to Rock Creek City of Fairway, Kansas Fairway Stormwater Level of Service Study - Phase 2 Project No. 108200 Revision 1 12/6/2018 Stormwater
Sediment Basin 7E-12. Design Manual Chapter 7 - Erosion and Sediment Control 7E - Design Information for ESC Measures BENEFITS.
 7E-12 Design Manual Chapter 7 - Erosion and Sediment Control 7E - Design Information for ESC Measures Sediment Basin BENEFITS Flow Control Erosion Control Sediment Control Runoff Reduction Flow Diversion
PRELIMINARY STORM DRAINAGE REPORT
 PRELIMINARY STORM DRAINAGE REPORT DRURY LANE DEVELOPMENT 704 1ST STREET SULTAN, WA 98294-94240 PARCEL #28083200305500 AUDITOR S FILE NO. 1090255 CITY OF SULTAN SNOHOMISH COUNTY, WASHINGTON PREPARED FOR:
STRUCTURE S-65 PURPOSE SPILLWAY OPERATION
 STRUCTURE S-65 This structure is a reinforced concrete, gated spillway with discharge controlled by three cable operated, vertical lift gates, and a reinforced concrete lock structure with two pairs of
CHAPTER 4 SPALDING COUNTY, GEORGIA 4.0 CULVERT DESIGN
 SPALDING COUNTY, GEORGIA CHAPTER 4 4.0 CULVERT DESIGN... 4-1 4.1 INTRODUCTION... 4-1 4.2 SYMBOLS AND DEFINITIONS... 4-1 4.3 ENGINEERING DESIGN CRITERIA... 4-2 4.3.1 FREQUENCY FLOOD... 4-2 4.3.2 VELOCITY
Job 1. Title: Estimate abundance of juvenile trout and salmon.
 STUDY PERFORMANCE REPORT State: Michigan Project No.: F-53-R-13 Study No.: 461 Title: Population dynamics of juvenile rainbow trout and coho salmon in Lake Superior tributaries Period Covered: April 1,
Wisconsin s Citizen-Based Monitoring Partnership Program and Trout Unlimited Driftless Area Restoration Effort (TUDARE)
") Wisconsin s 2010-11 Citizen-Based Monitoring Partnership Program and Trout Unlimited Driftless Area Restoration Effort (TUDARE) TUDARE Stream Monitoring Sites Established in 2010-2011 Summary Prepared
Wisconsin s 2010-11 Citizen-Based Monitoring Partnership Program and Trout Unlimited Driftless Area Restoration Effort (TUDARE) TUDARE Stream Monitoring Sites Established in 2010-2011 Summary Prepared
Stony Creek Creel Census
 Stony Creek Creel Census conducted for Division of Fisheries Illinois Department of Conservation 600 North Grand Ave. West Springfield, IL 62706 by R. Weldon Larimore, Principal Investigator Jack A. Swanson,
Redd Dewatering and Juvenile Salmonid Stranding in the Lower Feather River,
 Redd Dewatering and Juvenile Salmonid Stranding in the Lower Feather River, 2005-2006 Interim Report for NOAA Fisheries Prepared by: California Department of Water Resources Division of Environmental Services
Plan B Dam Breach Assessment
 Plan B Dam Breach Assessment Introduction In support of the Local Sponsor permit applications to the states of Minnesota and North Dakota, a dam breach analysis for the Plan B alignment of the Fargo-Moorhead
APPENDIX A STRUCTURE DESCRIPTIONS AND RATING CURVES
 3 4 5 6 7 8 9 0 3 APPENDIX A STRUCTURE DESCRIPTIONS AND RATING CURVES Kissimmee River Vol December 005 Version Draft 4 3 4 5 6 7 8 9 0 3 4 5 6 7 8 9 0 3 4 5 6 7 8 9 30 3 3 33 34 35 36 37 38 39 40 4 4 43
CHAPTER 5 CULVERT DESIGN
 CHAPTER 5 CULVERT DESIGN HYDRAULICS OF CULVERTS There are two major types of culvert flow: 1) flow with inlet control, and 2) flow with outlet control. For each type, different factors and formulas are
INFILTRATION PRACTICE MAINTENANCE INSPECTION FORM
 Facility Number: Date: Time: Subdivision Name: Watershed: Weather: Inspector(s): Date of Last Rainfall: Amount: Inches Streets: Mapbook Location: GPS Coordinates: Property Classification: Residential 9
PROFILE OF SACRAMENTO RIVER, FREEPORT TO VERONA, CALIFORNIA,
 PROFILE OF SACRAMENTO RIVER, FREEPORT TO VERONA, CALIFORNIA, FLOOD OF FEBRUARY 1986 By J.C. Blodgett and J.B. Lucas U.S. GEOLOGICAL SURVEY Open-File Report 88-82 CO CM I m r-h CM Sacramento, California
Little Traverse Bay Watershed Road/Stream Crossing Inventory
 Little Traverse Bay Watershed Road/Stream Crossing Inventory Completed by Tip of the Mitt Watershed Council with support from: Petoskey-Harbor Springs Area Community Foundation s Little Traverse Bay Protection
Table VI-Proj SITE-SPECIFIC MANAGEMENT MEASURES FOR THE ROOT RIVER WATERSHED
 00216268.DOC 300-1104 MGH/JEB/pk 01/31/14, 02/04/14 Table VI-Proj SITE-SPECIFIC MANAGEMENT MEASURES FOR THE ROOT RIVER WATERSHED LRC-01 Habitat Hoods Creek entire length Village of Mt. Various Reiterate
NIANGUA SNAPSHOT ISSUE Nutrients 2 Suspended Sediment 3 Salinity 4 Summary 5
 Niangua River Watershed Snapshot Volume 14 Number 2 The 125-mile long Niangua River meanders northward from the town of Marshfield on I-44 to the Lake of the Ozarks. Its watershed covers more than 658,000
APPENDIX L DETAILED ANALYSIS OF EAST AND LATERAL RUNWAY SAFETY AREA ALTERNATIVES ON TIDAL CHANNEL GEOMORPHOLOGY
 APPENDIX L DETAILED ANALYSIS OF EAST AND LATERAL RUNWAY SAFETY AREA ALTERNATIVES ON TIDAL CHANNEL GEOMORPHOLOGY MEMORANDUM TO: Sheri Ellis (SWCA), Patti Sullivan (FAA), Allan Heese (JNU), Randy Vigil (ACOE),
Exploring Kikuletwa South
 Exploring Kikuletwa South Tour with James (FTK) to the Kikuletwa (S) and Chem Chem region 02-12-2014 On 2 December 2014 the plan was to visit Chem Chem and get to know more about the flooding extent over
Final Report August 2005
 2.0 REGIONAL STUDY AREA 2.1 Regional Setting 2.1.1 Topography The Los Angeles Region is located within the western portion of the Transverse Ranges Geomorphic Province. The San Andreas transform fault
Detailed Model Simulation Results for Proposed Situation
 APPENDIX C Detailed Model Simulation Results for Proposed Situation Status Issue 2 Page 89 January 2013 Figure C-1 to C-15 complement the tabulated peak flood level and discharge predictions in Tables
Manual of Fisheries Survey Methods II: with periodic updates. Chapter 22: Guidelines for Sampling Warmwater Rivers with Rotenone
 Manual of Fisheries Survey Methods II: with periodic updates : Guidelines for Sampling Warmwater Rivers with Rotenone P. W. Seelbach, G. L. Towns, and D. D. Nelson Suggested citation: Seelbach, Paul W.,