Countywide Bus Rapid Transit Study Consultant s Report (Final) July 2011 DEPARTMENT OF TRANSPORTATION. Barrier system (from TOA)
|
|
|
- Erick Ramsey
- 5 years ago
- Views:
Transcription


1 Countywide Bus Rapid Transit Study Consultant s Report (Final) July 2011 DEPARTMENT OF TRANSPORTATION Barrier system (from TOA)

")
2 COUNTYWIDE BUS RAPID TRANSIT STUDY Consultant s Report (Final) July 2011
3 Table of Contents Executive Summary... ES-1 1 Introduction Key additional elements of BRT network Relationship to land use Station access Brand identity Organization of report Acknowledgments Study Methodology High-level roadway screening Corridor development and initial corridor screening Field review and refined route assessment Demand modeling/policy area analysis Background on the forecast model How models are applied Routes in Proposed BRT Network Capital and Operating Costs Estimates Capital costs estimate Operating statistics and costs estimate...31 Appendix A Comparison of Transitway Options: MD 355-Rockville Pike... A-1 A.1 Exclusive bus lanes... A-1 A.2 Median transitway... A-2 A.3 Service roads... A-3 A.4 Conclusions... A-3 Appendix B Initial Corridor Screening Methodologies... B-1 B.1 Preliminary screening methodology... B-1 B.1.1 Existing daily bus trips... B-1 B.1.2 Percent of corridor within a 1/2-mile radius having BRT-supportive density under future conditions... B-1 B.1.3 Presence of major attractors/activity centers... B-2 B.1.4 Regional transit connectivity... B-2 i
4 B.1.5 Weighting of Total Score... B-3 B.2 Revised screening methodology... B-5 B.2.1 Presence of major attractors/activity centers... B-6 B.2.2 Regional transit connectivity... B-7 B.2.3 Corridor Scoring and Results... B-7 Appendix C BRT Treatments Evaluated for Refined Route Assessment... C-1 C.1 Guideway assessment... C-1 C.1.1 Treatment options... C-1 C.1.2 Median assessment... C-4 C.1.3 Take-a-lane assessment... C-5 C.1.4 Side-of-road assessment... C-5 C.1.5 Packaging of treatments... C-5 C.2 Intersection assessment... C-6 C.2.1 Transit signal priority... C-6 C.2.2 Queue jumps... C-7 C.2.3 Special turn signals... C-8 C.2.4 Packaging of treatments... C-8 C.3 Station locations... C-8 Appendix D BRT Route Descriptions and Treatment Options... D-1 D.1 Route 3: Veirs Mill Road... D-1 D.2 Route 4a: Georgia Avenue North... D-2 D.3 Route 4b: Georgia Avenue South... D-3 D.4 Route 5: Rockville Metrorail-Life Sciences Center... D-4 D.5 Route 7: Muddy Branch Road/Lakeforest Mall... D-5 D.6 Route 8: MD 185/Connecticut Avenue... D-6 D.7 Route 10a: MD 355 North... D-8 D.8 Route 10b: MD 355 South... D-9 D.9 Route 11: New Hampshire Avenue... D-10 D.10 Route 12: Old Georgetown Road... D-11 D.11 Route 13: MD 124/Quince Orchard Road/Montgomery Village Avenue... D-12 D.12 Route 14: Randolph Road... D-13 D.13 Route 16: Shady Grove Road... D-15 ii
5 D.14 Route 18: MD 193/University Boulevard... D-16 D.15 Route 19: US D-17 D.16 Route 20: ICC... D-18 D.17 Route 21: North Bethesda Transitway... D-19 D.18 Route 23: Midcounty Highway... D-20 Appendix E Methodology for BRT System Unit Cost Estimates... E-1 E.1 Guideway... E-1 E.1.1 BRT in mixed traffic... E-1 E.1.2 BRT in exclusive roadway lane... E-1 E.1.3 Median Busway... E-2 E.1.4 Side-of-Road Busway... E-6 E.2 Stations... E-6 E.3 Intersection priority treatments... E-6 E.4 Off-board fare collection... E-7 E.5 Real-time passenger information... E-7 E.6 Vehicles... E-7 E.7 Application... E-7 iii
6 List of Figures Figure ES1: Queue jump operation example... ES-4 Figure ES2: Transit signal priority (TSP) example... ES-5 Figure ES3: Final corridor analysis and selection process... ES-7 Figure ES4: Proposed BRT network... ES-9 Figure 1-1: Examples of BRT system elements with respect to surrounding land uses... 3 Figure 1-2: Ensure BRT is accessible to all riders... 4 Figure 1-3: Examples of brand identity Orange Line BRT in Los Angeles... 5 Figure 2-1: Study process and interdependencies... 8 Figure 2-2: Baseline roadway network...10 Figure 2-3: Initial BRT Corridors...13 Figure 2-4: Example treatment options map Route 4a: Georgia Avenue North...17 Figure 3-1: Proposed BRT network...26 Figure A-1: Exclusive bus lanes concept along MD A-1 Figure A-2: Median guideway concept along MD A-2 Figure A-3: Service roads concept along MD A-3 Figure C-1: Cross-sections of possible BRT guideway treatments... C-2 Figure C-2: Example of TSP application... C-6 Figure C-3: Example of queue jump application... C-7 Figure D-1: Route 3: Veirs Mill Road treatment options... D-22 Figure D-2: Route 4a: Georgia Avenue North... D-23 Figure D-3: Route 4b: Georgia Avenue South... D-24 Figure D-4: Route 5: Rockville Metrorail-Life Sciences Center treatment options... D-25 Figure D-5: Route 7: MD 124/Muddy Branch Road treatment options... D-26 Figure D-6: Route 8: MD 185/Connecticut Avenue treatment options... D-27 Figure D-7: Route 10a: MD 355 North treatment options... D-28 Figure D-8: Route 10b: MD 355 South treatment options... D-29 Figure D-9: Route 11: MD 650/New Hampshire Avenue treatment options... D-30 Figure D-11: Route 13: MD 124/Quince Orchard Road/Montgomery Village Avenue treatment options... D-32 Figure D-12: Route 14: Randolph Road treatment options... D-33 Figure D-13: Route 16: Shady Grove Road treatment options... D-34 iv
7 Figure D-14: Route 18: MD 193/University Boulevard treatment options... D-35 Figure D-15: Route 19: US 29/Columbia Pike/Colesville Road treatment options... D-36 Figure D-16: Route 20: ICC treatment options... D-37 Figure D-17: Route 21: North Bethesda Transitway treatment options... D-38 Figure D-18: Route 23: Midcounty Highway treatment options... D-39 Figure E-1: Options for roadway and intersection reconfigurations... E-4 List of Tables Table ES1: Proposed BRT routes... ES-8 Table ES2: Forecasted (2040) peak-period travel times for highway, local bus, and BRT... ES-11 Table ES3: Forecasted (2040) peak-period travel speeds for highway, local bus, and BRT ES-12 Table ES4: Daily boarding for BRT network, by daily boardings per route mile (year 2040) ES-13 Table ES5: Annual O&M costs for BRT network, by O&M costs per boarding (year 2040).. ES-14 Table ES6: BRT system element costs (2010 dollars)... ES-15 Table ES7: Summary of treatment assumptions for the network... ES-16 Table 2-1: Initial BRT Corridors and Termini...12 Table 2-2: Corridors Advanced for Refined Assessment...14 Table 2-3: Constrained long-range plan for 2040 transit projects...19 Table 2-4: Constrained long-range plan for 2040 highway projects...20 Table 2-5 Comparison of end-to-end travel times based on forecasting model...22 Table 3-1: Proposed BRT routes...25 Table 4-1: BRT system element costs...28 Table 4-2: BRT system cost (low end of range)...30 Table 4-3: Daily boarding for BRT network, by daily boardings per route mile (year 2040)...31 Table 4-4: Annual O&M costs for BRT network, by O&M costs per boarding (year 2040)...32 Table 4-5: Operating data for BRT and other transit modes (year 2040)...33 Table 4-6: Change in operating costs due to BRT service (2010 dollars)...34 Table 4-7: Change in fare revenue due to BRT service (2010 dollars)...34 Table 4-8: Change in operating subsidies due to BRT service (2010 dollars)...34 Table A-1: Summary of cross-section options... A-4 Table B-1: Results of Initial BRT Corridor Screening: Detailed Scoring Matrix... B-4 Table B-2: Results of Initial BRT Corridor Screening: Final Scores... B-5 v
8 Table B-3: Results of Revised BRT Corridor Screening: Detailed Scoring Matrix... B-9 Table B-4: Results of Revised BRT Corridor Screening: Final Scores... B-10 Table C-1: Relationship of LOS to v/c ratios for signalized intersections... C-7 vi
9 LIST OF ACRONYMS APTA BRT CCT CLRP FTA GIS ICC LOS M-NCPPC MCDOT MTA MWCOG NCHRP O&M PID SHA TAZ TCRP TSP WMATA American Public Transportation Association bus rapid transit Corridor Cities Transitway constrained long-range transportation plan Federal Transit Administration geographic information system Intercounty Connector level of service Maryland-National Capital Park and Planning Commission Montgomery County Department of Transportation Maryland Transit Administration Metropolitan Washington Council of Governments National Cooperative Highway Research Program operations and maintenance passenger information display Maryland State Highway Administration traffic analysis zone Transit Cooperative Research Program transit signal priority Washington Metropolitan Area Transit Authority vii
10 EXECUTIVE SUMMARY ES1. Context for the Study The Montgomery County Department of Transportation (MCDOT) initiated the Countywide Bus Rapid Transit (BRT) Study to identify key corridors within the county that could facilitate premium rapid transit service. The intent of this effort was to complete a planning-level analysis to draw conclusions regarding the feasibility of a network of BRT routes across the county. The background for the study was established through several individual corridor studies exploring BRT service and conducted by the Metropolitan Washington Council of Governments (MWCOG) through a regional premium transit study and by Montgomery County Councilmember Marc Elrich through a BRT system concept. The consulting team was directed by the MCDOT to explore the feasibility of constructing a set of BRT corridors within the available constrained rights-of-way on county and state roads. The study provided analysis results at a level to allow MCDOT to identify possible BRT routes; determine treatments that would enhance speed, reliability, rider comfort, and convenience; and measure the system s performance in the horizon planning year This analysis was conducted at a level that indicates relative potential demand for the system and rough estimated costs to build and operate the system. The results should be assessed from that perspective, while also recognizing additional detailed analysis would be required to establish policies or recommendations on specific corridors to include in the final recommended network, the design options to be incorporated along each corridor, and the estimated ridership that would be expected for individual corridors. The work effort conducted for this study gives the following results: About 92,000 daily linked transit trips are estimated on the 150-mile BRT system, with 52,000 being new transit trips. The average BRT trip lengths would be 9.3 miles during the peak hour and 8.6 miles daily. The system would have approximately 165,000 and 207,000 daily boardings, with annual O&M costs ranging from $150 million to $180 million. Construction of the highest capacity BRT system with all recommended improvements would range between $2.3 and $2.5 billion (in 2010 dollars), averaging between 15.8 and $17.1 million/route-mile. This refined feasibility study serves as the first step toward implementing a BRT system in Montgomery County for individual corridors. Additional work on forecasting of demand, assessing the combination or alterations to proposed BRT routes, further refinement of land-use and parking expectations along the corridors, availability of funding as well as various combinations of these factors could yield differing results. These are just a few of many factors that need to be discussed and resolved jointly by the County and neighboring agencies and jurisdictions to further inform final route selection and forecasted system performance, and help drive policy and investment decisions. Routes also need to be weighed for their relative user benefit by developing a phasing plan for the system, and each route must be further refined through an alternatives analysis to verify its feasibility for construction. The results presented in ES-1


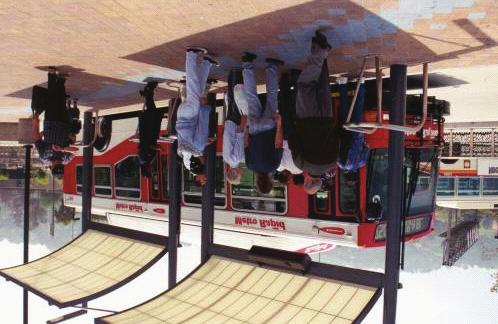
11 this summary should be considered an initial dialogue to the conversations that will need to be concluded before implementationn can begin. ES2. What is BRT? The study focused on implementing a BRT system that would emulate light rail operations in terms of the features provided, but would operate on the arterial roadway system in the county. This BRT system would rely on walk access, local bus transfers, and some park-and-ride access, and would combine the most attractive features of light rail with the LTD Emx Eugene, OR lower costs of bus technology. Instead of trains and tracks, BRT invests in improvements to vehicles, roadways, rightssignals to speed up bus transit of-way, intersections, and traffic service. BRT service differs from commuter bus service, which focuses on peak-period service during the weekday with a limited schedule, intermediate stops, and dependence on park-and-ride access. BRT was assumed for this study to be premium bus service operating with the following characteristics: All-day service Higher frequencies Stops at 1/2- to one-mile spacing Provision for exclusive lanes Transit signal priority and queue jump lanes where appropriate Enhanced stations with greater passenger amenities Real-time passenger information Potential for off-board fare collection Efficient boarding and alighting ES2.1. Key BRT Elements ES2.1.1 Stylish vehicles Many BRT vehicles have sleek, modern designs that emulate light rail features. They can be standard, 40-foot or articulated 60-foot buses (as assumed for this study). They should have level floors and multiple wide doors for easy boarding and alighting. Vehicles should have comfortable interiors designed for different configurations, including space for bicycle storage. ES2.1.2 Attractive stations BRT stations should reflect the level of investment and permanence of the system. They should welcome Cleveland Healthline Station (with protective shelter, ticket vending, and information kiosk) ES-2


12 passengers and feature a comfortable, attractive design. Stations should provide a variety of passenger amenities, including real-time information displays, benches, substantial shelters, and security features. Station platforms should be at the same level as the floor of the BRT vehicle to accommodate efficient boarding and alighting. This study assumed level-floor boarding for all stations. ES2.1.3 Faster fare collection On- or off-board fare collection options can help reduce BRT dwell time at stations and increase speed of service. Some onboard fare collection options include exact change payment and pass scanners. Examples of off-board fare collection include the use of ticket vending machines as proof of payment and special prepayment boarding areas. Pass scanners, such as those using the SmarTrip system in the Washington, DC region, provide complete integration with the area-wide transit system. ES2.1.4 Guideways and rights-of-way Guideways can serve to increase BRT travel speeds, improve service reliability, and reinforce the system s permanence by separating the vehicles from mixed traffic. Examples of guideways applicable to BRT include median, side-of-road, or separate busways and exclusive bus lanes within the roadway cross section. WMATA On-Board Smart Card Reader LTD EmX Median Guideway BRT vehicles may operate in mixed traffic in areas with constrained rights-of-way. In these conditions, implementing queue jumps can help increase operating speed and service reliability. A queue jump (shown in Figure ES1), as assumed in this study, is when a rapid transit vehicle can use an auxiliary lane (such as a right-turn lane) at a signalized intersection to bypass the general traffic queue at the intersection. An advanced green signal would allow the vehicle to move through the intersection unimpeded ahead of general traffic. ES-3

13 Figure ES1: Queue jump operation example (a) Bus approaches intersection at red signal (b) Bus receives green signal before other vehicles (c) Other vehicles proceed a few seconds later Source: TCRP Report 118 ES2.1.5 Intelligent transportation systems (ITS) Using ITS technology can help increase quality of service, improve operations, and provide passengers with timely and reliable information about BRT service. A key ITS application ES-4
 by extending the green phase or truncating the red phase by a few seconds.")
14 assumed for this study Figure ES2: Transit signal priority (TSP) example was transit signal priority (TSP). TSP technology allows a vehicle to request priority through a signalized intersection (shown in Figure ES2) by extending the green phase or truncating the red phase by a few seconds. This is a different application from signal pre-emption, which is often applied at locations of emergency vehicles where signals are controlled to stop all traffic. Typically, TSP saves only a few seconds per intersection. TSP implementation may be conditional, depending on whether the vehicle is behind schedule. TSP, in this study, was assumed to be feasible where the roadway level of service (LOS) was in the C or D range. LOS A or B represents more free-flow traffic conditions, where priority would not give a BRT vehicle an extra advantage. LOS E or F represents failing traffic conditions, where congestion would be so great a BRT vehicle cannot effectively actuate priority calls. In those cases, BRT would provide minimal benefit to bus operations and increase overall delay to other vehicles. Other ITS applications can aid passengers with travel decisions by providing timely and reliable information. Riders can learn of the next BRT vehicle to arrive or route delays over the internet, through real-time information displays at BRT stations, or through a user s mobile phone. This study assumed the use of real-time passenger information for the proposed network. ES2.1.6 Operations BRT service should provide reliable, frequent service with fewer stops compared to local bus service. It should also provide connectivity to other transportation modes such as local buses, rail, park-and-rides, and bicycle and pedestrian paths. Routes should be easy to understand and designed for passengers to have a one-seat ride to the extent possible. Local transit service should be re-oriented to provide access to BRT corridors. ES2.1.7 Land use BRT routes operating along corridors with high concentrations of development that support transit make BRT service more effective as a transportation option. Transit-oriented development is a key component for successful BRT. BRT takes advantage of the pedestrian and customer activity found in areas with higher land use densities and a mixture of types of Dense land use near Cleveland Healthline Station ES-5

15 development, including residential, retail, employment, and entertainment. Automobile use and parking needs can decrease where there are clusters of such development. BRT corridors require a minimal level of concentrated development. For this study, a threshold of at least six households or five employees per acre was used during early analysis as a method for identifying corridors where BRT service may be appropriate. The planning horizon year of 2040 includes the recently approved White Flint, Great Seneca Science Corridor and the Germantown Plans, all of which focus on transit oriented communities. ES2.1.8 Station access Improved bicycle, pedestrian and auto access to stations, and the correct placement of the station locations are critical factors in the success of a BRT system. Considerations for station locations in this study included placement at existing bus stops, Metrorail or planned light rail stations, transit centers, and parkand-ride lots. Detailed corridor implementation programs following this study should also consider the surrounding physical environment to enhance or improve access to BRT stations. BRT stations also must be accessible to passengers with varying levels of physical abilities. ES2.1.9 Strong brand identity Branding of BRT service conveys to new transit users and users unfamiliar with BRT that they are encountering a premium transit system with enhanced service and amenities. Typical branding methods include: 1 Branding stations and terminal features such as bus/brt stop signs, passenger information boards, fare collection equipment, and media Giving vehicles a special styling, unique livery, added passenger amenities, and marketing panels Branding running ways by using special paving materials, colors, and markings Branding marketing materials such as route maps, route schedules, web sites, and media information ES2.2. Study methodology Ensure BRT is accessible to all riders Orange Line BRT Branding - Los Angeles This feasibility study consisted of several tasks to identify a set of viable BRT routes that could operate along state and county roadways in Montgomery County. These tasks were as follows: 1 TCRP Report 118: Bus Rapid Transit Practitioner s Guide ES-6
16 1. Conduct an initial screening to identify a set of county roads that exhibit characteristics consistent with BRT operations. 2. Conduct field reviews and planning level right-of-way analysis along potential BRT corridors to determine potential design options, primarily within the existing right of way. 3. Determine travel demandd along identified corridors. 4. Determine capital and operating costs for the BRT network. Figure ES3 depicts the study methodology in flow chart form and identifies the steps taken to determine the final network and analyze that network for viability. The work conducted for these tasks ultimately produced a network of 16 BRT routes that would incorporate most of the key elements discussed in Section ES2.1 and could be built within the existing right-of-way. The conceptual level of this study did not involve identifying the locations of right-of-way impacts; therefore, this proposed network would involve realigning roadway cross-sections, sometimes beyond the existing right-of-way. For example, exclusive guideways would be constructed through the spaces of existing medians and left-turn lanes at signalized intersections. However, constructing exclusive guideways would include replacing the left-turn lanes to maintain similar levels of traffic operations along the corridors. Figure ES3: Final corridor analysis and selection process ES-7
17 ES3. Study findings ES3.1. Proposed BRT network and treatments Table ES1 summarizes the proposed BRT network of 16 routes forecasted by 2040 to be viable BRT corridors. Figure ES4 illustrates this network. The specific guideway and intersection treatment options for each route can be found in the main body of the report. Route Number Table ES1: Proposed BRT routes Corridor From To Route Length (miles) Number of Stations 3 MD 586/Veirs Mill Road Rockville Metrorail station Wheaton Metrorail station a Georgia Avenue North Montgomery General Hospital 4b Georgia Avenue South Wheaton Metrorail station a Rockville Metrorail-Life Sciences Center MD 124/Muddy Branch Road MD 185/Connecticut Avenue MD 355 North Wheaton Metrorail station Silver Spring Transit Center Life Sciences Center Rockville Metrorail station Lakeforest Mall Life Sciences Center Georgia Avenue and Bel Pre Road MD 355 and Stringtown Road Medical Center Metrorail station Rockville Metrorail station b MD 355 South Rockville Metrorail station Bethesda Metrorail station MD 650/New Hampshire Avenue Montgomery Mall/Old Georgetown Road 14 Randolph Road MD 193/University Boulevard US 29/Columbia Pike/Colesville Road White Oak Transit Center Montgomery Mall Transit Center White Flint Metrorail station Wheaton Metrorail station Burtonsville park-and-ride lot 20 ICC Life Sciences Center 21 North Bethesda Transitway 23 Midcounty Highway Montgomery Mall Transit Center Snowden Farm Parkway and Stringtown Road Fort Totten Metrorail station Bethesda Metrorail station Glenmont Metrorail station Takoma/Langley Park Transit Center Silver Spring Transit Center Briggs Chaney park-andride lot Grosvenor Metrorail station Shady Grove Metrorail station ES-8
18 Figure ES4: Proposed BRT network ES-9
19 ES3.2. Ridership and operating costs Based on the study s proposed implementation of BRT treatments including exclusive transitways, transit signal priority (TSP) and queue jump lanes, and improved stations a system of BRT routes could operate effectively within the county. The recommended 150-mile network of BRT routes could significantly increase daily transit use, with 165,000 to 207,000 BRT boardings and 52,000 new and 92,000 total daily linked transit trips 2 in Montgomery County. The study applied the transit forecasting model developed by the Maryland Transit Administration and accepted by the Federal Transit Administration for use on the Purple Line and Corridor Cities Transitway Alternative Analysis projects. Forecasts were developed for the proposed BRT network, and ridership and operating costs were determined for the planning forecast year of In addition to the 16 proposed BRT routes, the modeled transportation networks assumed some modified commuter local bus service to reflect enhanced commuter access to the western county and to other regional transit options. Model outputs used to determine ridership and operating costs were based on travel times developed from field work. Table ES2 identifies the end-to-end travel times for the routes and compares highway and local bus travel times. 2 A linked transit trip is a trip composing the complete travel between an origin and destination. This can include walking or driving to transit, as well as one or more unlinked trips. An unlinked trip is one in which a passenger boards a transit vehicle ES-10
20 Table ES3 shows a similar comparison based on highway and local bus speeds and BRT speeds, as generated by the forecasting model. Table ES2: Forecasted (2040) peak-period travel times for highway, local bus, and BRT BRT Time Savings over Local Bus (min) % BRT Time Savings over Local Bus Average Highway Average Local Average BRT Route Number Time (min) Bus Time (min) Time (min) % 4a % 4b % % % % 10a % 10b % % % % % % % % % Average % ES-11
21 Table ES3: Forecasted (2040) peak-period travel speeds for highway, local bus, and BRT Average Highway Travel Speed (mph) Average Local Bus Speed (mph) Average BRT Travel Speed (mph) BRT Speed Increase over Local Bus (mph) % BRT Speed Increase over Local Bus Route Number % 4a % 4b % % % % 10a % 10b % % % % % % % % % Average % Detailed analyses of forecasts (highway networks, land use, speeds, etc.) were developed for the year 2040 to determine the functioning of the system in the forecast planning horizon year. In response to a request from MCDOT staff, the consulting team also conducted an analysis of land use projections only for the year 2020 (keeping all other factors constant for 2040) as a method to determine information that could be used for later decision making on corridor phasing. This information is presented in Table ES4 to provide context on assumed ridership and operating costs by the year 2040, as well as assumed by The forecasted ridership for 2040 is about double the ridership for existing Ride On service throughout the county. Lastly, Table ES5 presents information on the estimated operations and maintenance (O&M) costs and farebox recovery ratios for the network by BRT route. ES-12
22 Table ES4: Daily boarding for BRT network, by daily boardings per route mile (year 2040) Route Number Daily Boardings Daily Boardings/ Route Mile Required Peak Headway Percent of 2040 Achieved w/2020 Land Use 14 Randolph Road 13,400-16,800 3,000-3, % 10b MD 355 South 23,200-29,000 3,000-3, % 4b MD 97/Georgia Avenue South 8,200-10,200 2,300-2, % 10a MD 355 North 30,400-38,000 2,200-2, % 21 North Bethesda Transitway 6,600-8,300 2,200-2, % 18 MD 193/University Boulevard 12,700-15,900 2,000-2, % 12 MD 187/Old Georgetown Road 9,000-11,300 1,800-2, % 5 Rockville Metro-LSC 6,100-7,600 1,300-1, % 11 MD 650/New Hampshire Avenue 9,400-11,700 1,300-1, % 4a MD 97/Georgia Avenue North 11,900-14,900 1,200-1, % 19 US 29 13,700-17,100 1,100-1, % 3 MD 586/Veirs Mill Road 6,200-7,700 1,000-1, % 7 Lakeforest Mall/Muddy Branch Rd 4,400-5, , % 23 Mid-County 5,400-6, % 8 MD 185/Connecticut Avenue 3,400-4, % 20 ICC 1,600-2, % Total 165, ,000 1,300-1, % ES-13
23 Table ES5: Annual O&M costs for BRT network, by O&M costs per boarding (year 2040) BRT Route Annual O&M Cost O&M Cost/ Boarding Farebox Recovery Ratio 14 Randolph Road $5,974,000 - $7,168,800 $ $ % - 54% 21 North Bethesda Transitway $3,654,000 - $4,384,800 $ $ % - 43% 5 Rockville Metro-LSC $3,432,000 - $4,118,400 $ $ % - 42% 3 MD 586/Veirs Mill Road $3,529,000 - $4,234,800 $ $ % - 41% 18 MD 193/University Boulevard $8,047,000 - $9,656,400 $ $ % - 38% 12 MD 187/Old Georgetown Road $6,357,000 - $7,628,400 $ $ % - 34% 4b MD 97/Georgia Avenue South $5,757,000 - $6,908,400 $ $ % - 34% 10b MD 355 South $16,931,000 - $20,317,200 $ $ % - 33% 7 Lakeforest Mall/Muddy Branch Rd $3,955,000 - $4,746,000 $ $ % - 27% 4a MD 97/Georgia Avenue North $11,383,000 - $13,659,600 $ $ % - 25% 11 MD 650/New Hampshire Avenue $9,832,000 - $11,798,400 $ $ % - 23% 10a MD 355 North $34,584,000 - $41,500,800 $ $ % - 21% 8 MD 185/Connecticut Avenue $4,263,000 - $5,115,600 $ $ % - 19% 19 US 29 $18,716,000 - $22,459,200 $ $ % - 17% 23 Mid-County $7,851,000 - $9,421,200 $ $ % - 17% 20 ICC $6,290,000 - $7,548,000 $ $ % - 6% Total $150,555,000 - $180,666,000-33% - 26% Note: Farebox recovery ratio is the percentage of annual O&M costs regained from fares, based on an assumed trip fare. BRT O&M cost estimates assume average of 70 persons/bus during peak hour. Farebox recovery assumes an average fare per BRT boarding of $0.80. ES3.3. Capital costs The capital costs for the proposed network were derived using estimating methods at a planning analysis level. Unit costs used were taken from Maryland State Highway Administration s 2010 Price Index. Professional experience on other BRT system and corridor studies nationwide, and documentation of unit costs from the FTA Characteristics of Bus Rapid Transit for Decision- Making report and TCRP Report 118: Bus Rapid Transit Practitioner s Guide also were applied. Projects recently constructed within the county were consulted to identify whether cost estimating methods were reasonable and an adjustment applied based on the costs noted in those projects. The costs do not include right-of-way, utility relocation, or stormwater management costs, as these assessments were beyond the scope of work for this study. Table ES6 summarizes the elements comprising the network. ES-14
24 Table ES6: BRT system element costs (2010 dollars) System Element Guideways and bus lanes TSP Queue jumps Intersection widening Stations Concrete pads Articulated buses Maintenance facility Add-ins Unit Costs $56-$1,643 per linear foot $25,000 per intersection $10,000 per approach $1.8-$2.9 million for both sides of roadway $110,000-$220,000 per station $26,728 per pad $1.1 million per bus $356,000 per bus 25% of route/system cost (excluding vehicles) Note: Maintenance facility costs were averaged across the total number of buses in system fleet. The cost of the system, a network of approximately 150 route-miles including all the elements listed previously, is estimated to range between $2.3 and $2.5 billion (without right-of-way costs) in 2010 dollars. This reflects the cost of incorporating the highest level of design possible for the proposed BRT system. Actual total system costs would vary based on anticipated funding availability and implementation strategy. Table ES7 summarizes the elements comprising the network. ES-15
25 Table ES7: Summary of treatment assumptions for the network Elements Quantity Guideway and bus lane segments two-way guideway only one-way guideway only guideway and bus lane bus lane (both directions) bus lane (one direction) no guideway and bus lanes Queue jumps by location by direction TSP Stations by location by platforms Concrete pads Absolute total 24 route miles 48 route miles 27 route miles 1 route mile 7 route miles 44 route miles 26 intersections 37 queue jumps 174 intersections 150 sites 367 (median and curb) 209 pads Percentage of network 16% 32% 18% < 1% 5% 29% Articulated vehicles 284 buses (peak period); 347 buses (total fleet) A 30 percent contingency was applied to the derived construction costs for guideway and bus lanes treatments, signal priority treatments, intersection widenings, and stations, given the conceptual nature of the study. A 15 percent contingency was applied to maintenance facilities because the unit cost is comparable to estimates from recently constructed facilities. These contingencies do not assume right-of-way purchase. The consulting team allocated a portion of the estimated costs to utility modifications, pavement drainage, and maintenance of traffic. However, refined costs for elements such as major utility relocation and structures (including drainage structures and overhead lane use control structures) and off-roadway stormwater detention were not included in the capital costs but may be covered by the construction contingency. The estimated capital costs derived for this study are to be considered only as a planning level assessment. More detailed studies identifying specific alignments, cross-sections, and roadway characteristics along each of the 16 routes would be required to develop a more specific estimate. ES-16
26 ES4. Key Considerations This study presents a conceptual high-investment BRT network operating within the rights-ofway of county and state roadway corridors. While it provides a foundation for a viable network, several considerations must be addressed prior to developing final policy and investment level decisions and prior to advancing individual routes for implementation. ES4.1. Detailed Recommendations The results presented in this document provide a level of detail appropriate for generating an initial understanding of potential demand in the identified corridors. More refined analysis that informs local bus service changes needed to support the BRT system and include ongoing demand forecasting model adjustments underway for other studies will be required before developing final corridor demand estimates that can then be used to develop implementation policies. ES4.2. Costs It is difficult to know all the impacts along a corridor based on the level of analysis consistent with a feasibility study. Constructing a high-investment BRT network affects elements such as right-of-way and utility relocation. While the consulting team allotted some of the capital costs and applied contingencies toward utility reconstruction and pavement drainage systems, detailed corridor studies would extensively document the infrastructure impacts of constructing and implementing BRT treatments. Additionally, detailed field reviews and measurements would identify specific right-of-way impacts expected. Again, right-of-way estimates are not included in the cost estimates generated by this study. ES4.3. Land use and BRT branding Two of the key BRT elements land use and branding can significantly affect system ridership. Additional studies should consider whether increased transit-oriented development is warranted along individual BRT corridors to help assure the viability of the system. The county should institute a branding campaign should this network advance to implementation. Attracting passengers who associate BRT with a form of premium transit service would be expected to increase the system s chance of strong, sustained ridership. ES4.4. Implementation Next steps toward implementation based upon the findings of this study will be defined by the County Executive, County Council, MCDOT, M-NCPPC, Maryland State Highway Administration, and Maryland Transit Administration. Refined studies focused on specific corridors would identify more factors affecting the success of BRT routes, and consider the refined package of facility and service improvements based on anticipated funding availability. ES-17
27 1 INTRODUCTION This report outlines the effort to define a viable network of BRT routes that would enhance Montgomery County s diverse existing and planned transportation options. This study was a yearlong effort conducted by the consulting team, with guidance from MCDOT and a multiagency technical advisory group. It presents a proposed BRT network that provides the highest level of service possible within the constrained transportation rights-of-way, while balancing the importance of regional connectivity and need for a cost-effective transit system. The study focused on a BRT system that emulates light rail operations in terms of the features provided, but operates on the arterial roadway system in the County and relying on walk access, local bus transfers, and some non-metrorail park-and-ride access. It combines the most attractive features of light rail with the lower costs of bus technology. Instead of trains and tracks, BRT invests in improvements to roadways, rights-of-way, intersections, and traffic signals to speed up bus transit service. BRT service differs from commuter bus service, which focuses on peak-period service during the weekday with limited trips, intermediate stops, and dependence on park-and-ride access. Therefore, BRT, when referenced in this study, is premium bus service operating with the following characteristics: All-day service Higher frequencies Stops at 1/2- to one-mile spacing Provision for exclusive lanes Transit signal priority and queue jumps Enhanced stations with greater passenger amenities Real-time passenger information Potential for off-board fare collection Efficient boarding and alighting The consulting team developed viable BRT routes that could qualify for federal funding. FTA provides funding for small starts projects, such as the proposed BRT routes, that meet the following criteria: Having substantial transit stations Providing traffic signal priority or pre-emption Would operate with vehicles with low floors or level boarding Targeted branding of the proposed service Operating at 10-minute peak/15-minute off-peak headways or better and for more than 14 hours each weekday Developing a network that supports frequent bus service was a major factor in creating the initial BRT corridors. Based on professional experience, the consulting team found it most reasonable to identify those roadways adjacent to or traversing developments with BRT-supportive densities of at least six households or five employees per acre. In November 2010, MWCOG updated its land-use model to Round 8.0, providing forecasts through the year The study incorporated this latest land-use model during the demandmodeling phase. It also modified under the guidance of MWCOG and M-NCPPC the
28 highway network to include all new transit and highway projects planned and programmed in MWCOG s 2040 CLRP. One of the primary means for conveying the fastest possible travel with BRT service is to provide exclusive guideways. The consulting team selected median guideways as a solution because they facilitate higher operating speeds with fewer traffic conflicts compared to bus lanes on curbside or service roadways. Appendix A compares the three transitway types, focusing on their application on a section of MD 355 in Rockville. This study presents a BRT network based on a level of investment that could generally be implemented within the County s right-of-way, most according to the following investment scenario framework: Priority treatment: Mainly roadway segments Service levels: Meeting FTA thresholds in all corridors BRT facility: Upgraded stations/real-time passenger information at all stops/off-board fare collection Such a network would consist of exclusive BRT lanes (referred to as guideways in this report) located within roadway medians; general purpose lanes converted into bus-only lanes operating in the peak period; intersection priority treatments; and enhanced stations with fare collection machines, real-time passenger information displays, level-boarding platforms, benches, extended shelters, and other passenger amenities. Most stations would exist within the guideways; curbside stations would exist in locations where median guideways are not possible. Travel times for this network would reflect the high investment in treatments that benefit BRT service. The network also assumes the use of 60-foot articulated buses, stations designed to accommodate two articulated buses at a time, and additional maintenance facilities beyond those already owned and operated by the County. 1.1 Key additional elements of BRT network This study focused on the feasibility and cost implications of developing and constructing a BRT system within the County s constrained right-of-way. However, other BRT characteristics namely, relationship to land use, station access, and brand identity play key roles in a successful system. The following sections briefly discuss these characteristics Relationship to land use BRT routes operating along corridors with high concentrations of development that support transit make BRT service more effective as a transportation option. Transit-oriented development is a key component for successful BRT. BRT takes advantage of the pedestrian and customer activity found in areas with higher land use densities and a mixture of types of development, including residential, retail, employment, and entertainment. Automobile use and parking needs can decrease where there are clusters of such development. BRT corridors require a minimal level of concentrated development. For this study, a threshold of at least six households or five employees per acre was used during early analysis as a method for identifying corridors where BRT service may be appropriate. The planning horizon year of 2040 includes the recently approved White Flint, Great Seneca Science Corridor and the Germantown Plans, all of which focus on transit oriented communities. 2


29 Figure 1-1: Examples of BRT system elements with respect to surrounding land uses (a) BRT station in Cleveland (b) BRT corridor in Curitiba, Brazil (station highlighted by blue circle) Station access Improved bicycle, pedestrian and auto access to stations, and the correct placement of the station locations are critical factors in the success of a BRT system. Considerations for station locations in this study included placement at existing bus stops, Metrorail or planned light rail stations, transit centers, and park-and-ride lots. Detailed corridor implementation programs following this study should also consider the surrounding physical environment to enhance or improve access to BRT stations. BRT stations also must be accessible to passengers with varying levels of physical abilities. 3


30 Figure 1-2: Ensure BRT is accessible to all riders Source: Brand identity Branding of BRT service conveys to new transit users and users unfamiliar with BRT that they are encountering a premium transit system with enhanced service and amenities. Typical branding methods include: 3 Branding stations and terminal features such as bus/brt stop signs, passenger information boards, fare collection equipment, and media Giving vehicles a special styling, unique livery, added passenger amenities, and marketing panels Branding running ways by using special paving materials, colors, and markings Branding marketing materials such as route maps, route schedules, web sites, and media information 3 TCRP Report 118: Bus Rapid Transit Practitioner s Guide 4


31 Figure 1-3: Examples of brand identity Orange Line BRT in Los Angeles (a) Orange Line BRT vehicle Source: (b) Orange Line station Source: Organization of report Chapter 2 of this report covers the processes used to identify a proposed BRT network beginning with initial corridor definition to route modeling. Note that, although it proposed a network operating within the County s rights-of-way, the consulting team also modeled a baseline, unconstrained BRT network that assumed unlimited rights-of-way and funding. Chapter 3 present the proposed BRT network resulting from the efforts outlined in Chapter 2. Chapter 4 shows the capital and operating costs for the BRT network. The appendices provide technical supplements to the report and are excerpts of the memoranda developed during the course of the study. 1.3 Acknowledgments The consulting team including Loiederman Soltesz Associates, Inc. and Gallop Corporation, and led by staff from Parsons Brinckerhoff would like to acknowledge the invaluable contributions of the client agency, core members of the technical advisory group, and many others. The results of this study exist because of the dedication, professional expertise, data, and time given by these contributors. City Of Gaithersburg City of Rockville Howard County Department of Planning and Zoning Maryland-National Capital Park and Planning Commission Maryland State Highway Administration Maryland Transit Administration Metropolitan Washington Council of Governments 5
32 Montgomery County Department of Transportation Montgomery County Council Washington Metropolitan Area Transit Authority 6
33 2 STUDY METHODOLOGY The study consisted of several tasks that led to a set of viable BRT routes that could operate along state and county roadways in Montgomery County, as shown in Figure 2-1. The tasks were as follows: 1. Conduct high-level review of state and county roadways 2. Develop potential BRT corridors 3. Conduct an initial corridor screening to advance viable BRT corridors 4. Conduct field reviews along potential BRT corridors 5. Define potential BRT routes and station locations 6. Conduct refined route assessments to identify applicable BRT treatments 7. Determine travel demand within the BRT network and for other transit modes in the County, as well as testing performance measures 8. Determine capital and operating costs for the BRT network This chapter discusses Tasks 1 through 7; Task 8 is discussed in Chapter 4. The study was sensitive to providing a balanced network that accessed not only destinations along the major radial corridors in the County, but also provided cross-county access to key destinations present and planned on the east and west sides of the County. The corridor scoring system emphasized this effort in the preliminary and revised scoring methodologies. 7


34 Figure 2-1: Study process and interdependencies Universe of County roadways -Roads from BRT system concept -Roads from PCN corridors High-level Roadway Screening screened against minimum density thresholds Baselinee roadway network Corridor Development and Initial Corridor Screening developed corridors screened corridor subset against four criteria Screened BRT corridors Field Review collected data on physical/operational infrastructure Define BRT Routes and Station Locations Refined Route Assessment identified BRT treatments by route Demand Modeling/Policy Area Analysis defined transportation network modeled unconstrained and constrained BRT networks Operating statistics Capital/O&M Costs developed unit costs for BRT elements determined costs for BRT network Proposed BRT Network 16 routes, 150 miles 8

35 2.1 High-level roadway screening The team began the study by conducting a high-level screening of all roadways in the County classified as county roads, state roads, and divided highways. The purpose of this initial task was twofold. First, it defined a baseline roadway network that may function as BRT corridors and removed from consideration state and county roadways less likely to support possible BRT corridors, as identified in the Small Starts funding criteria described in Chapter 1. Second, this list limited the analysis to a level that could be accomplished within the scope of this study. The consulting team assumed that roads providing access to land uses with at least six households or five employees per acre could support BRT service. This was determined by analyzing traffic analysis zones (TAZs) for existing and future (year 2030) conditions within the County. Supplementing this baseline roadway network were the following County roads reviewed by other studies and discussions: Roads identified in the 2008 BRT system concept proposed by Councilman Marc Elrich and his staff Roads included in the 2010 draft MWCOG report, An Evaluation of the Metrobus Priority Corridor Networks, including proposed corridor improvements recently advanced through the federal TIGER grant application Figure 2-2 highlights the baseline roadway network resulting from this screening. 9
36 Figure 2-2: Baseline roadway network 10

37 2.2 Corridor development and initial corridor screening The consulting team used the baseline roadway network and input from the technical advisory group to create 23 BRT corridors on which to conduct an initial corridor screening. The following conditions guided the corridor development. Corridors should be at least five miles in length, where possible. Corridors should terminate at potential BRT corridors, a major attraction/activity center, premium transit stations, or a county or District border. Table 2-1 summarizes the initial corridors, and Figure 2-3 shows the initial corridors. The team conducted the initial corridor screening using four criteria to advance a network of potential BRT corridors for further assessments. The criteria represented characteristics that would facilitate BRT service. The criteria were as follows: 1. Existing daily bus trips 2. Percent of corridor within a 1/2-mile radius having BRT-supportive density under future conditions 3. Presence of major attractors/activity centers 4. Regional transit connectivity Using these criteria, the consulting team applied two sets of screening methodologies. One was a preliminary methodology and the other was a revised methodology, with each including a weighted scoring system. The revised screening methodology, developed with input from the advisory group, helped reduce the effects of some corridors having a greater concentration of BRT-supportive characteristics compared to others, as well as increased the opportunity for balanced (north-south and east-west) connectivity throughout the County. During the process, several corridors were either shortened or split into multiple corridors. Appendix B provides detailed information for both screening methodologies and the changes made to the initial BRT corridors based on meetings with the advisory group. 11
38 Corridor Number Table 2-1: Initial BRT Corridors and Termini Corridor Corridor Length (miles) 1 Bel Pre Road/Bonifant Road 5.5 Georgia Avenue New Hampshire Avenue From 2 CCT (master plan alignment) 14.8 COMSAT Shady Grove Metrorail station 3 4 Darnestown Road/Montgomery Avenue/Veirs Mill Road/MD Quince Orchard Road Georgia Avenue Georgia Avenue/Olney Sandy Spring Road Olney Sandy Spring Road and Spartan Road To Silver Spring Metrorail station 5 Gude Drive/Key West Avenue 5.2 MD 28/Darnestown Road Norbeck Road 6 I-270/I Frederick County border VA border 7 MD 124/Muddy Branch Road 7.0 Airpark Road MD 28 8 MD 185/Connecticut Avenue 6.9 Georgia Avenue East-West Highway 9 MD 190/River Road/Seven Locks Road 9.2 Montrose Road DC border 10 MD Comus Road, Clarksburg DC border 11 MD 650/New Hampshire Avenue 10.2 Bonifant Road DC border 12 Montgomery Mall/Old Georgetown Road/Rockville 12.3 Westlake Terrace University Boulevard Pike/East-West Highway 13 Montgomery Village Avenue/Quince Orchard Road 6.5 Snouffer School Road MD Montrose Road/Randolph Prince George s County 12.8 Seven Locks Road Road/Cherry Hill Road border 15 Norbeck Road 13.9 Rockville Metrorail station Prince George s County border 16 Shady Grove Road 4.8 MD 28 Muncaster Mill Road 17 Snouffer School Road/Muncaster Mill Road 9.6 Brink Road MD 28/Norbeck Road 18 University Boulevard 6.6 Connecticut Avenue University Boulevard 19 US 29/Columbia Pike/Colesville Road 11.7 Burtonsville Silver Spring Metrorail Station 20 ICC 18.6 MD 355 and I-370 Prince George s County border 21 North Bethesda Transitway 5.1 Westlake Terrace Grosvenor Metrorail station 22 Sam Eig Highway 14.8 Shady Grove Metrorail station Belward Farm 23 Midcounty Highway Clarksburg Shady Grove Metrorail station 4 Later separated into two corridors: 4a: Georgia Avenue North and 4b: Georgia Avenue South 5 Later separated into two corridors: 10a: MD 355 North and 10b: MD 355 South 6 Corridor was developed during later stages of the study in response to comments. 12
39 Figure 2-3: Initial BRT Corridors 13
40 The results of the revised methodology identified the 16 corridors that would ultimately comprise the BRT network tested during demand forecasting activities. These corridors were advanced for refined assessment. Eight corridors advanced without being screened because they had been evaluated for transit enhancements in previous studies. Another eight corridors advanced based on their scores from the revised screening methodology. The CCT corridor was removed from further consideration because it is part of the long-range transportation plan as a separate project. The results of the initial screening prompted additional corridor changes. Corridor 4 was made into two routes of reasonable lengths. Corridor 4a: Georgia Avenue North would operate between Olney and Wheaton. Corridor 4b: Georgia Avenue South would operate between Wheaton and Silver Spring Metrorail station. Additionally, the Corridor 5 was made a circulator route. Added to it were the segments of Corridor 3 operating along Darnestown Road and Montgomery Avenue, as well as small segments along Great Seneca Highway, Norbeck Road, MD 355, and a few local roads within Rockville Town Center. This formed Corridor 5: Rockville Loop, operating to the Life Sciences Center area by way of Rockville Metrorail station. Table 2-2 lists the corridors advanced for refined assessment. Table 2-2: Corridors Advanced for Refined Assessment Advanced without screening Advanced with screening (in order of highest scores) Corridor 3: MD 586/Veirs Mill Road 7 Corridor 10a: MD 355 North 8 Corridor 4a: Georgia Avenue North 9 Corridor 5:Rockville Loop 10 Corridor 4b: Georgia Avenue South 10 Corridor 10b: MD 355 South 8 Corridor 14: Montrose Road/Randolph Road/Cherry Hill Road Corridor 18: University Boulevard Corridor 19: US 29/Columbia Pike/Colesville Road Corridor 21: North Bethesda Transitway Corridor 12: Montgomery Mall/Old Georgetown Road Corridor 13: Montgomery Village Avenue/Quince Orchard Road Corridor 16: Shady Grove Road Corridor 7: MD 124/Muddy Branch Road Corridor 8: MD 185/Connecticut Avenue Corridor 11: MD 650/New Hampshire Avenue The following four corridors did not advance under either screening methodology. Corridor 9: Bel Pre Road/Bonifant Road Corridor 13: MD 190/River Road/Seven Locks Road Corridor 17: Snouffer School Road/Muncaster Mill Road Corridor 18: Norbeck Road Although Corridors 9 and 18 were desirable for east-west connectivity, their scores suggested they could best be suited for less-frequent service. 7 This corridor was shortened to operate only along Veirs Mill Road. 8 This corridor was initially part of Corridor 10: MD This corridor was initially part of Corridor 4: Georgia Avenue/Olney Sandy Spring Road 10 This corridor was created by combining Gude Drive and Key West Avenue with Great Seneca Highway, Norbeck Road, MD 355, and a few local roads within Rockville Town Center. 14
41 The modeled transportation network discussed in Section 2.4 included some modified local bus routes (increased service) to test enhanced commuter access to the across the County that were added in response to stakeholder comments. These modifications were as follows: Increased bus frequencies during the peak periods for Ride On Route 52 Combined Metrobus Routes Z2 and K6 to provide increased bus frequencies between Olney and Ft. Totten Metrorail station Combined Metrobus Routes C8 and C9 to provide increased bus frequencies between the White Flint area and Greenbelt Metrorail station None of these routes performed at a level that would make them viable for BRT routes given the identified assessment criteria. 15
. This involved a four-day field review creating an inventory of existing physical conditions to highlight opportunities for and constraints to implementing BRT service.")
42 2.3 Field review and refined route assessment The consulting team conducted a refined assessment of the 17 potential BRT corridors advanced from the initial screening (refer to Table 2-2 in Section 2.2 of this report). This involved a four-day field review creating an inventory of existing physical conditions to highlight opportunities for and constraints to implementing BRT service. The consulting team also supplemented its field survey data with aerials and GIS data to conduct the refined route assessment. This provided a thorough picture of the following conditions along each corridor: Roadway cross sections On-street parking Sidewalks Bicycle lanes Curbs Shoulders Medians Overhead utilities Bus stops Bus stop features Surrounding development Major traffic generators Ability to widen the roadway Right turn lanes Congestion (queuing) Density of development Although the focus was recommending transitway treatments that could be built within the County s right-of-way, this study notes that implementing such a network would involve realigning roadway cross-sections, sometimes beyond the existing right-of-way. For example, exclusive guideways would use the envelopes of existing medians and left-turn lanes at signalized intersections. However, the left-turn lanes would be replaced to maintain similar levels of traffic operations along the corridors. GIS measurements and aerial photographs provided the level of detail needed for this feasibility study. The inventory helped the consulting team assess the potential to implement guideways, intersection priority, and stations along each corridor. Implementing guideways considered whether they could be built within the roadway median, within the roadway traffic lanes, or alongside the roadway. A guideway alongside the roadway was only considered if the right-ofway currently existed, such as using shoulders for bus-only lanes. Intersections were reviewed to identify possible locations for TSP, queue jump lanes and signals, or special turn signals. Lastly, the inventory helped with identifying station locations to facilitate walk access, passenger drop-off and pickup, bus transfers, and park-n-ride access. Appendix C details the methodology used and assumptions made for locating these system components. 16

43 The consulting team packaged guideways, intersection treatments, and station locations for each route. Termini were also clearly defined, as were locations for buses to possibly turn around and restart their routes. Appendix D contains maps illustrating the proposed treatment options and station locations for each route. Each map shows the locations of all possible BRT treatment options along a route. The legend on each map helps interpret the limits and locations of the treatment options. For example, Figure 2-4 shows the northern portion of Route 4a: Georgia Avenue North. As noted in the legend, the map shows the potential for a one-way guided transitway along Olney-Laytonsville Road between Prince Philip Drive and Georgia Avenue. It is also possible to implement a twoway guided transitway and transition to a two-way unguided transitway along Georgia Avenue starting at Olney-Laytonsville Road. Additionally, the map shows three locations for potential BRT stations, as well as TSP and queue jump options located at numerous signalized intersections along the route. The consulting team also developed templates of roadway and intersection reconfigurations, with general dimensions for widened roadways. Appendix E contains these templates. Future corridor studies would provide detailed measurements for any required roadways shifts. The travel times calculated for each route were based on the information contained within these maps; Section 2.4 of this report discusses the modeling of the network. Figure 2-4: Example treatment options map Route 4a: Georgia Avenue North 17

44 2.4 Demand modeling/policy area analysis Background on the forecast model Analyzing the relative potential of the BRT network in the county required application of a demand forecasting model with a level of detail necessary to determine transit trips along each of the corridors analyzed for this study. This study benefitted from work completed by MTA on a demand forecasting model used for the Purple Line and CCT Alternative Analysis projects. The model, termed the MDAA model or Maryland Alternative Analysis model is now in its second phase (MDAAII) and includes a number of improvements to the forecasting model maintained by MWCOG for the specific purpose of generating ridership estimates. One of the benefits of the MDAAII is that in incorporates very detailed ridership information from the MWCOG 2007 regional bus survey and a Metrorail rider survey funded by MTA. The work to construct the MDAAII model included a number of refinements, including; improving consistency between bus speeds and highway congestion, adding flexibility to the fare model, full implementation of the parking capacity restraint routine, and a corrected defined hierarchy of modes. All of these technical refinements were completed to make the model more reliable for forecasting transit trips. The forecasting effort conducted for this study was appropriate to help determine whether a BRT system was viable. The scope of the work effort allowed for limited assessments of model coding, transit connectivity, land use or other specific model inputs that can impact ridership forecasts. Additionally, it was the first study in which the MDAAII s transit network included both the Purple Line and Corridor Cities Transitway projects. The results presented in this document should, therefore, be considered a cursory assessment of the viability of the system, applying the results to policy decisions or in setting funding priorities would be an incorrect application of the material presented here How models are applied Demand forecasting models are used to judge the relative benefits of transportation projects when assessed from the perspective of a particular moment in time. They are built from the statistical analysis of travel patterns and use information from current year travel to determine how future travelers would make decisions for choosing a method for travel. Often travel decisions are based on a cost of travel which can include the time spent traveling, costs (vehicle operations or fare), and directness of the trip. Model inputs take into account the type of trip (home to work, home to shopping, work to daycare, etc.) as well as the location of various land use types (employment, shopping, etc.). Models are not prescient and cannot be considered exact ridership estimates for future facilities. Instead they are considered as a tool in 18
45 determining the relative attractiveness of a travel option when compared to other travel options or other alignments for the same trip type (such as LRT or BRT). Transportation planning for facilities usually relies on identifying a planning horizon year for analysis to determine how the transportation facilities could function given their construction within an identified period. Typically, a 30-year horizon year is used for transportation projects and regional planning agencies have been tasked with developing long-range transportation plans that extend 30 years out to identify improvements and could reasonably be expected to be funded within that timeframe. These plans are developed typically in five- to 10-year increments to coincide with the release of data from the US Census Bureau and are used to check conformity with air quality emissions targets set for the region. For this project a horizon year of 2040 was used to determine the operation of the BRT network, with the base year being the 2010 census year. Transportation improvements in this 30-year timeframe are identified by MWCOG in their document National Capital Region Transportation Planning Board Constrained Long Range Plan (CLRP) and include those projects that are expected to be built given financial constraints in the region. This 2040 plan for the region is termed the constrained long-range plan for its assessment of financial constraints and the likelihood of transportation facilities being constructed Comparison to no-build conditions Analysis of transportation projects is completed by comparing how new or altered facilities would function in an identified future year. For this project the models were used to identify ridership potential along a network of BRT routes which were identified as an output of the screening process identified in the previous section. The analysis is conducted against what is termed the no build conditions, which means that none of the BRT network has been built, but that all other projects identified in the CLRP are constructed. For this project this means that the Purple Line and Corridor Cities Transitway projects are assumed to have been built by the year 2040 as have other roadway improvements. Table 2-3 and Table 2-4 identify those projects that are assumed to have been constructed by the year 2040 in Montgomery County and are in the areas near the identified BRT network. Table 2-3: Constrained long-range plan for 2040 transit projects Limits Lanes Completion Improvement Facility From To From To Year Construction Purple Line Bethesda New Carrollton 2020 Construction CCT COMSAT Shady Grove Metro 2020 Construction Veirs Mill Rd Enhancements Rockville Wheaton 2015 Note: Veirs Mill Road transit enhancements were included in route recommendations. 19
46 Table 2-4: Constrained long-range plan for 2040 highway projects Limits Lanes Completion Improvement Facility From To From To Year Construction ICC I-270 I-95/US Construction US 29 Upgrade MD 97 Upgrade MD 97 Interchange at Musgrove/Fairland Rd Interchange at MD 28 (Norbeck Rd) Interchange at Randolph Rd Construction MD 355 Montrose/Randolph Rds CSX RR /2020 Reconstruction BRAC intersection improvements near NNMC Widen MD 27 MD 355 A305 (Mid County Hwy ext) Construction MD 28 MD 97 I-95 2/4 4/ A305 (Mid County Hwy Construction ext) MD 355 MD Construction Chapman Avenue Randolph Rd Old Georgetown Road Widen Construction Father Hurley /Ridge Rd. I-270 MD M83 (Mid County Hwy) Middlebrook Rd Widen MD 118 ext MD 355 Montgomery Village Ave Watkins Mill Rd Widen Middlebrook Rd ext MD 355 M Construction Montrose Pkwy E Parklawn Dr Veirs Mill Rd Construction Nebel Rd ext Randolph Rd Target Store site Construction Randolph Rd Parklawn Dr Rock Creek Park Construction Watkins Mill Rd ext I-270 MD
47 Land-use assumptions A process similar to that used to develop the assumed 2040 transportation network is used by the county and MWCOG to generate land use forecasts for population, households and employment (by type) for geographic units termed traffic analysis zones. These traffic analysis zones are the basis for determining the number of trips into and out of a bounded geographic area, which are then distributed over the transportation network to generate forecasts. Land-use forecasts are developed after careful review of approved master plans and working within a county control total to derive these figures for the future year. This work is done in Montgomery County by M-NCPPC, which then forwards them to MWCOG to determine land use assumptions for the entire Washington region. This study uses the Round 8 forecasts developed by MWCOG as its baseline land use forecast for the year This land use forecast includes, among other things, new land use estimates for the White Flint, Germantown, and Life Sciences areas of the county for recently approved master plans for those areas Travel time assumptions A critical factor in analyzing a BRT network is the travel time determinations for each route as the relative travel speed of the BRT mode as an option for travel is an important decision point for travel. The effort to determine travel speeds for each corridor was based in the field work and corridor recommendations determined in the field and described in the previous section. Travel times developed for the routes studied as part of this analysis include the following: Acceleration and deceleration of transit vehicles near stations and at intersections Posted speed limits Boarding/alighting time at stations o 15 seconds for low volume station, 20 seconds for high volume stations Intersection delay, stratified for those intersections where TSP and queue jumper lanes were either assumed or not assumed o 42 second average delay assumed for intersections with no treatments o 30 second average delay for intersections with TSP o 15 second average delay for intersections with queue jump lanes Congested speeds The methodology for determining travel time assumptions along the corridor involved a bottomup estimating using assumptions noted above. Generally described, travel times for links were calculated and delays for intersections and stations added to develop corridor-level travel times. For links where BRT service was provided in general purpose travel lanes, the congested highway speeds from the forecasting model were used as a method for determining maximum speeds in those segments. Resulting travel time assumptions for the various corridors were then used to code the transit network used to analyze ridership potential across the county. Table 2-5 identifies the end-toend travel time and speeds for the routes carried forward into final analysis and shows the comparison between highway speeds, local bus speeds and BRT speeds as generated by the forecasting model. 21
48 Route Table 2-5 Comparison of end-to-end travel times based on forecasting model Average Highway Time (min) Average Local Bus Time (min) % of Route in Busway Average BRT Time (min) Average Highway Travel Speed (mph) Average Local Bus Speed (mph) Average BRT Travel Speed (mph) 3: Darnestown Road/Montgomery Avenue/Veirs Mill Road/MD % a: Georgia Avenue North % b: Georgia Avenue South % : Rockville Loop % : MD 124/Muddy Branch Road % : MD 185/Connecticut Avenue % a: MD 355 North % b: MD 355 South % : MD 650/New Hampshire Avenue % : Montgomery Mall/Old Georgetown Road % : Montrose Road/Randolph Road/Cherry Hill Road % : University Boulevard % : US 29/Columbia Pike/Colesville Road % : ICC % : North Bethesda Transitway % : Midcounty Highway % Headways, fares, and parking The final inputs to the model to derive forecasts are to specify the headways (how often a bus passes a certain location), fare and parking availability. These factors are obviously important ones to travelers assessing travel options. Initially in this study, a 10-minute headway was applied and a flat fare assumed and significant constraints on parking at Metro stations were assumed. A 10-minute headway is a typical analysis method, specifying a headway consistent with Small Starts criteria to determine how well the network performs. The model operates with an unconstrained vehicle capacity so testing a 10-minute headway often yields results which identify needs of a more or less frequent headway to handle expected ridership in the corridors. For this study, the majority of the routes tested would require headways more frequent than 10 minutes to handle expected passenger volumes by the year 2040 (see results in Section 4.2). Final ridership forecasts were developed by incorporating a second step and applying reduced headways on those corridors where appropriate to approximate the relative demand for each corridor. 22
49 Fare assumptions for the forecasting process assumed a base fare ($1.50 in current dollars) which mirrors Ride-On fares and is consistent with assumptions for the Purple Line and Corridor Cities Transitway projects. Transfers from local bus to BRT, from BRT to local bus, and from BRT-to-BRT were assumed to be a no cost transfer. Transfers to the Metro system assumed a transfer fare consistent with Metro s existing distance based fares. Parking availability can impact ridership by limiting travel options for those accessing the BRT system. For this study, the parking assumptions included restricted access to Metro station parking (reflecting the limited availability of parking at Metro stations that could be accessed by riders on the BRT system) and unconstrained availability of parking at three park-and-ride lot locations in the study area, including the following: Burtonsville Park and Ride lot off Route 29 Briggs Chaney Park and Ride lot off Briggs Chaney Road New ICC Park and Ride lot at the interchange of the ICC and MD 97 (Georgia Avenue) Model runs A series of model runs were generated to test the network for various investment conditions to help with decision making on selecting corridors as the larger network was assessed for viability and the final network presented in this document was identified. The three model runs used for various analyses included the following: 1. A fully separate, bi-directional BRT facility, termed the unconstrained scenario for this project. This model run was conducted to test the viability of various routes in the network for ridership assuming conditions higher than would ever be expected to be built due to right of way constraints. This run was used to screen out most routes that did not meet the 10-minute headway standard for accommodating passenger flows under ideal operating conditions The BRT network run that assumed assumed no right-of-way needs along the links of the network and combined the various design options in a way that would yield the most efficient BRT network. This scenario included dedicated lanes, TSP, queue jump lanes, additional rights of way at intersections to accommodate a transit lane, and off-board fare collection. 3. A BRT network run with the same assumptions as outlined in Bullet 2, but with year 2020 land uses to test the impact of development on systemwide ridership. During evaluation of the model runs, the consulting team with input from the County made some modifications to the BRT network. The following outlines those considerations. 11 Those routes presenting headways greater than 10 minutes were retained for evaluation in more detailed corridor studies. 23
50 Removals Two of the initially screened corridors those along Montgomery Village Avenue/Quince Orchard Road and Shady Grove Road were removed from the proposed BRT network due to relatively low daily boardings. Additions and Modifications Although initially removed as a possible BRT corridor, the ICC corridor was retained because of the new facility s future capacity to accommodate premium bus service. It was combined with the Sam Eig Highway corridor to provide cross-county service between Briggs Chaney and the Life Sciences Center. The Mid-County Highway corridor was added for both additional service for northern County residents and direct access to the planned Clarksburg Town Center. 24
51 3 ROUTES IN PROPOSED BRT NETWORK Table 3-1 lists and Figure 3-1 shows the proposed BRT network of 16 routes that performed well under the modeled unconstrained scenario. An additional route, Route 23: Midcounty Highway was added in response to stakeholder comment as it was noted as helping the County achieve its goal of supporting transit-oriented development proposed in the Clarksburg Master Plan, as well as providing northern County residents with an alternate access to destinations in the southern portion of the County and connections to premium transit serving the DC Metropolitan area. Appendix D provides detailed descriptions of each route. 12 Route Number Table 3-1: Proposed BRT routes Corridor From To Route Length (miles) 3 MD 586/Veirs Mill Road Rockville Metrorail station Wheaton Metrorail station a Georgia Avenue North Montgomery General Hospital 4b Georgia Avenue South Wheaton Metrorail station a Rockville Metrorail-Life Sciences Center MD 124/Muddy Branch Road MD 185/Connecticut Avenue MD 355 North Wheaton Metrorail station Silver Spring Transit Center Life Sciences Center Rockville Metrorail station Lakeforest Mall Life Sciences Center Georgia Avenue and Bel Pre Road MD 355 and Stringtown Road Medical Center Metrorail station Rockville Metrorail station b MD 355 South Rockville Metrorail station Bethesda Metrorail station MD 650/New Hampshire Avenue Montgomery Mall/Old Georgetown Road 14 Randolph Road MD 193/University Boulevard US 29/Columbia Pike/Colesville Road White Oak Transit Center Montgomery Mall Transit Center White Flint Metrorail station Wheaton Metrorail station Burtonsville park-and-ride lot 20 ICC Life Sciences Center 21 North Bethesda Transitway 23 Midcounty Highway Montgomery Mall Transit Center Snowden Farm Parkway and Stringtown Road Fort Totten Metrorail station Bethesda Metrorail station Glenmont Metrorail station Takoma/Langley Park Transit Center Silver Spring Transit Center Briggs Chaney park-andride lot Grosvenor Metrorail station Shady Grove Metrorail station Number of Stations 12 Appendix D also contains the two corridors that included in the refined route assessment: the Montgomery Village Avenue/Quince Orchard Road and Shady Grove Road corridors. 25
52 Figure 3-1: Proposed BRT network 26

53 4 CAPITAL AND OPERATING COSTS ESTIMATES 4.1 Capital costs estimate The consulting team determined capital costs for the proposed BRT system using unit costs developed for a number of elements. Unit costs comprised information from SHA s 2010 Price Index, professional experience with developing and applying BRT costs on other BRT system and corridor studies, and documentation of unit costs from the FTA Characteristics of Bus Rapid Transit for Decision-Making report and TCRP Report 118: Bus Rapid Transit Practitioner s Guide. The unit costs reflect both construction and vehicle acquisition costs, but exclude possible right-ofway acquisition or business/residential relocation costs. The next several paragraphs describe the costs comprising the following list of elements: BRT guideway treatments Intersection treatments: TSP and queue treatments, as well as widening of signalized intersections Construction of station platforms, concrete bus pads for BRT vehicles serving curb-side stations while operating in mixed traffic Articulated, low-floor BRT vehicles Maintenance facility Add-ins BRT guideway treatments considered the cost of implementing any of the six options identified in Appendix C of this report. One of the options a possible side-of-road treatment, which would be implemented on the side of the roadway within the existing right-of-way (such as shoulders) was applied only to Route 3: MD 586/Veirs Mill Road to take advantage of existing shoulders along the corridor. The consulting team determined the locations of possible guideway treatments for each route, as summarized on route treatment maps in Appendix D. TSP and queue jump treatments, described in Appendix C of this report, considered the cost of implementing these treatments at specific locations identified on route treatment maps located in Appendix D. These costs also included the widening of signalized intersections based on the type of median guideway treatment. The consulting team assumed side (as opposed to center) station platforms would be constructed to accommodate a full 120-foot long BRT station (long enough for two 60-foot articulated BRT vehicles). For major stations serving at least 500 daily boardings by the year 2040, construction elements included extended shelter, benches, unique station ID sign, landscaping, lighting, security system, and bicycle storage. The costs also included an off-board fare collection vending machine and two real-time passenger information displays (PIDs). For minor stations serving less than 500 daily boardings, the station would be smaller, not provide 27
54 for off-board fare collection, have one PID unit, and have reduced shelter and other passenger amenities. Concrete pads pertain to curbside stations where BRT vehicles would operate in mixed traffic. Articulated BRT vehicles assume 60-foot low-floor vehicles with hybrid propulsion, as well as automatic vehicle location (AVL), automatic passenger counters (APC), TSP, and security and maintenance monitoring systems. Maintenance facility costs were based on the total number of vehicles needed, applying an average facility cost per vehicle. This estimate was determined for each BRT route and calculated for the entire system. Add-ins would address post-planning activities and include preliminary engineering, final design, construction management, insurance, and start-up costs for the system. Table 4-1 shows the unit costs for each BRT system element in the network. Table 4-1: BRT system element costs System Element Guideways and bus lanes TSP Queue jumps Intersection widening Stations Concrete pads Articulated buses Maintenance facility Add-ins Unit Costs $56-$1,643 per linear foot $25,000 per intersection $10,000 per approach $1.8-$2.9 million for both sides of roadway $110,000-$220,000 per station $26,728 per pad $1.1 million per bus $356,000 per bus 25% of route/system cost (excluding vehicles) Note: Maintenance facility costs were averaged across the total number of buses in system fleet. Table 4-2 shows individual route and total system costs. The total system cost ranges between $2.3 and $2.5 billion, averaging between $15.8 and $17.1 million per route-mile. These costs include a 30-percent unallocated contingency 13 applied to guideways, intersection treatments, station elements, and maintenance facilities due to the many unknowns associated with 13 Unallocated contingency covers unknown costs, including changes in project scopes. 28
55 developing planning level estimates. Add-ins are 25 percent of system elements, excluding articulated vehicles. The capital costs represents the option of only restriping and signing segments where BRT vehicles would use curb-side lanes exclusively, up to rebuilding the existing bus lanes to accommodate BRT vehicles (as identified in initial capital cost assumptions). The cost estimate reflects the greatest level investment for the proposed BRT system in existing dollars. Actual total system costs will vary based on anticipated funding availability and implementation strategy. Additionally, this estimated capital cost reflects a BRT network with the removal of duplicative treatments due to route overlaps. The cost of constructing the first set of individual routes would cost more. Contingency excludes right-of-way costs because assessing right-of-way impacts was beyond the scope of the study. Additionally, this study acknowledges right-of-way costs, stormwater management, and utility relocations can significantly increase the cost of intersection impacts. Individual corridor studies can best quantify those specific needs and develop more refined cost estimates. 29
56 Table 4-2: BRT system cost (low end of range) Guideway Treatment Intersections Stations Vehicles BRT Route Total Transitway Length Total Transitway Cost Total # Intersection Treatments Total Intersection Cost Total # Stations Total Station Cost Total # Vehicles Total Vehicle Cost Maintenance Facility Add-Ins Total Route Cost Cost/Mile $356,000 25% 3 MD 586/Veirs Mill Road 42,089 $50,200, $30,400, $9,560,000 8 $8,800,000 $3,700,000 $23,500,000 $126,000,000 $19,000,000 4a MD 97/Georgia Avenue North 58,265 $79,400, $90,500, $7,030, $30,800,000 $13,000,000 $47,500,000 $268,000,000 $27,400,000 4b MD 97/Georgia Avenue South 12,672 $924, $341, $3,210, $26,400,000 $11,100,000 $3,900,000 $45,900,000 $11,600,000 5 Rockville Metro-LSC 32,627 $22,400, $24,400, $3,640,000 8 $8,800,000 $3,700,000 $13,500,000 $76,400,000 $14,500,000 7 Lakeforest Mall/Muddy Branch Rd 22,105 $36,500, $41,200, $3,860, $12,100,000 $5,090,000 $21,700,000 $120,000,000 $16,700,000 8 MD 185/Connecticut Ave 69,808 $45,900, $43,900, $9,170, $11,000,000 $4,630,000 $25,900,000 $141,000,000 $14,900,000 10a MD 355 North 110,520 $66,800, $84,100, $15,700, $72,600,000 $30,500,000 $49,300,000 $319,000,000 $21,900,000 10b MD 355 South 54,895 $51,100, $63,100, $11,100, $35,200,000 $14,800,000 $35,000,000 $210,000,000 $24,000, MD 650/New Hampshire Ave 21,001 $20,400, $26,900, $6,280, $27,500,000 $11,600,000 $16,300,000 $109,000,000 $12,400, MD 187/Old Georgetown Rd 24,395 $22,300, $42,900, $7,990, $15,400,000 $6,480,000 $19,900,000 $115,000,000 $16,600, Randolph Road 13,755 $2,330,000 8 $3,680, $3,850, $19,800,000 $8,330,000 $4,550,000 $42,500,000 $7,670, MD 193/University Boulevard 27,117 $33,600, $36,000, $7,420, $28,600,000 $12,000,000 $22,300,000 $140,000,000 $21,800, US 29 43,695 $78,700, $46,600, $7,100, $42,900,000 $18,000,000 $37,600,000 $231,000,000 $17,200, ICC 14,329 $25,800,000 9 $18,700,000 4 $1,210,000 8 $8,800,000 $3,700,000 $12,400,000 $70,600,000 $3,080, North Bethesda Transitway 14,688 $10,700, $19,400, $4,710, $13,200,000 $5,550,000 $10,100,000 $63,700,000 $12,600, Mid-County 63,252 $122,000, $58,200, $4,610, $19,800,000 $8,330,000 $48,200,000 $261,000,000 $19,500,000 Total Cost Entire Network $669,000,000 $630,000,000 $106,000,000 $382,000,000 $161,000,000 $392,000,000 $2,300,000,000 $15,800,000 Notes: Costs are based on 2010 dollars and excludes escalation and necessary right-of-way acquisition. Total system cost reflects removal of overlapping treatments for routes operating along the same segments. Construction of individual routes would represent higher costs for each route. Intersection treatments include TSP and queue jump treatments, as well as widening of signalized intersections. Station costs include Ticket Vending Machines and Passenger Information. Maintenance facility costs exclude right-of-way. Add-ins include preliminary engineering, final design, construction management, insurance, and startup costs. 30
57 4.2 Operating statistics and costs estimate The following tables summarize daily operating statistics and O&M costs for the BRT network by the year Table 4-3 lists the range of daily boardings, daily boardings per route mile, and required peak headway for each route. Overall, the BRT system could expect to provide between 165,000 and 207,000 daily boardings. The table also shows the percentage of daily boardings achieved by the year 2040, based on the land uses developed by the year As shown, about 80 percent of the BRT network s daily boardings can be realized by the year In addition to the BRT routes, the consulting team modified and modeled three existing local bus routes as express buses to provide enhanced service along corridors in the eastern portion of the County. Table 4-3 also shows these results. Table 4-3: Daily boarding for BRT network, by daily boardings per route mile (year 2040) Route Number Daily Boardings Daily Boardings/ Route Mile Required Peak Headway Percent of 2040 Achieved w/2020 Land Use 14 Randolph Road 13,400-16,800 3,000-3, % 10b MD 355 South 23,200-29,000 3,000-3, % 4b MD 97/Georgia Avenue South 8,200-10,200 2,300-2, % 10a MD 355 North 30,400-38,000 2,200-2, % 21 North Bethesda Transitway 6,600-8,300 2,200-2, % 18 MD 193/University Boulevard 12,700-15,900 2,000-2, % 12 MD 187/Old Georgetown Road 9,000-11,300 1,800-2, % 5 Rockville Metro-LSC 6,100-7,600 1,300-1, % 11 MD 650/New Hampshire Avenue 9,400-11,700 1,300-1, % 4a MD 97/Georgia Avenue North 11,900-14,900 1,200-1, % 19 US 29 13,700-17,100 1,100-1, % 3 MD 586/Veirs Mill Road 6,200-7,700 1,000-1, % 7 Lakeforest Mall/Muddy Branch Rd 4,400-5, , % 23 Mid-County 5,400-6, % 8 MD 185/Connecticut Avenue 3,400-4, % 20 ICC 1,600-2, % Total 165, ,000 1,300-1, % RO52E 800-1, WMZ2K WMC8C9 2,000-2, Table 4-4 shows O&M costs and farebox recovery ratios for each route, arranged according to farebox recovery. Total annual operating costs for the BRT system at full build-out by 2040 would be between $150 and $180 million (in existing dollars). Projected farebox recovery ranges between 26 and 33 percent for the entire system. The farebox recovery ratios of many 31
58 BRT routes would exceed those of Metrobus routes, which currently range between 30 and 35 percent. Table 4-4: Annual O&M costs for BRT network, by O&M costs per boarding (year 2040) BRT Route Annual O&M Cost O&M Cost/ Boarding 14 Randolph Road $5,974,000 - $7,168,800 $ $ % - 54% 21 North Bethesda Transitway $3,654,000 - $4,384,800 $ $ % - 43% 5 Rockville Metro-LSC $3,432,000 - $4,118,400 $ $ % - 42% 3 MD 586/Veirs Mill Road $3,529,000 - $4,234,800 $ $ % - 41% 18 MD 193/University Boulevard $8,047,000 - $9,656,400 $ $ % - 38% 12 MD 187/Old Georgetown Road $6,357,000 - $7,628,400 $ $ % - 34% 4b MD 97/Georgia Avenue South $5,757,000 - $6,908,400 $ $ % - 34% 10b MD 355 South $16,931,000 - $20,317,200 $ $ % - 33% 7 Lakeforest Mall/Muddy Branch Rd $3,955,000 - $4,746,000 $ $ % - 27% 4a MD 97/Georgia Avenue North $11,383,000 - $13,659,600 $ $ % - 25% 11 MD 650/New Hampshire Avenue $9,832,000 - $11,798,400 $ $ % - 23% 10a MD 355 North $34,584,000 - $41,500,800 $ $ % - 21% 8 MD 185/Connecticut Avenue $4,263,000 - $5,115,600 $ $ % - 19% 19 US 29 $18,716,000 - $22,459,200 $ $ % - 17% 23 Mid-County $7,851,000 - $9,421,200 $ $ % - 17% 20 ICC $6,290,000 - $7,548,000 $ $ % - 6% Total $150,555,000 - $180,666,000-33% - 26% Note: Farebox recovery ratio is the percentage of annual O&M costs regained from fares, based on an assumed trip fare. BRT O&M cost estimates assume average of 70 persons/bus during peak hour. Farebox recovery assumes an average fare per BRT boarding of $0.80. Farebox Recovery Ratio Table 4-5 provides systemwide operating information for the proposed BRT system and other transit systems operating in the County including Ride On and WMATA buses, Metrorail, and the Purple Line and CCT both modeled as light rail. The BRT system would require about 285 articulated buses during peak demand service and a total fleet of 350 articulated buses to accommodate the estimated boardings. Such a fleet size would require additional bus maintenance facilities and/or the modification to existing facilities to service articulated vehicles. (Section 4.1 discussed maintenance facility costs.) 32
59 Table 4-5: Operating data for BRT and other transit modes (year 2040) % Change from No-build MCBRT LRT Ride On Metrobus Daily Boardings 206,956-18% -31% -4% Daily Vehicle Revenue Miles 48,257-7% -15% -4% Daily Vehicle Revenue Hours 3,029-6% -16% -3% Daily Train Revenue Hours -- -6% Daily Peak Vehicles % -38% -6% Total Fleet % -38% -6% Track Miles -- 0% Cost/Boarding $ % 19% 0% Table 4-5 also shows implementing the BRT network would result in reduced boardings across all other transit modes and reduced peak vehicle and total fleet needs, in part due to transit mode shifts. Considering all Metrobus (including DC and Virginia service), Ride On, and BRT services combined, the net change in operating costs by the year 2040 would be between $104 and $134 million greater than they would for operations under 2040 no-build conditions. Similarly, the net fare revenue would be about $39 to $41 million greater and the net change in operating subsidy would be about $63 and $95 million greater by the year 2040 than they would for 2040 no-build conditions. Table 4-6 through Table 4-8 present this information. 33
60 Table 4-6: Change in operating costs due to BRT service (2010 dollars) Range (Low - High) BRT (Range of Operating Costs) $150,555,000 - $180,666,000 Total 2040 Operating Costs (Buses and BRT) $748,223,000 - $778,334,000 Total Net Change in Operations Costs $104,185,000 - $134,296,000 Table 4-7: Change in fare revenue due to BRT service (2010 dollars) Range (Low - High) BRT (Range of Operating Subsidy) $101,217,000 - $133,301,000 Total 2040 Operating Subsidy (Buses and BRT) $576,439,000 - $608,523,000 Total Net Change in Operations Subsidy $63,009,000 - $95,093,000 Table 4-8: Change in operating subsidies due to BRT service (2010 dollars) Range (Low - High) BRT $47,365,000 - $49,338,000 Total 2040 Fare Revenue (Buses and BRT) $169,811,320 - $171,784,320 Total Net Change in Fare Revenue $39,203,280 - $41,176,280 34
61 APPENDIX A COMPARISON OF TRANSITWAY OPTIONS: MD 355-ROCKVILLE PIKE The consulting team evaluated the three conceptual cross-sections for Rockville Pike through the White Flint area (as developed by M-NCPPC, City of Rockville, and the White Flint Partnership). The concepts have been evaluated with respect to facilitating future BRT operations and to overall traffic conflicts among transit, other motor vehicles, pedestrians, and bicycles. Cost was not a major consideration, given the entire Rockville Pike cross section would be reconstructed to develop one of the concepts identified. A.1 Exclusive bus lanes This treatment (see Figure A-1) would involve the development of 11-foot bus lanes on the outside of a seven-lane general traffic roadway (six through lanes and a center left turn lane), with bicycle and then parking lanes on the right side of the roadway. With the identified concept, BRT vehicles and local buses would have to cross the bicycle lane to serve curb-side transit stations. Developing a curb extension out to the bus lane to avoid buses from crossing the bicycle lane would end up blocking the bicycle lane, which is not desirable. Curbside bus lanes are typically difficult to enforce due to the difficulty in identifying whether a general traffic vehicle is using the lane for local access, making a turn, or violating the lane use. In such cases, the shared use of the bus would reduce BRT operating speeds, with the degree of impact dependent on the amount of other vehicles and local buses in the lane. Lastly, parallel parking maneuvers would temporarily block the bus and bicycle lanes. Overall, this concept has a fair number of potential traffic conflicts working against BRT operations. Figure A-1: Exclusive bus lanes concept along MD 355 Source: Rockville Pike Charette Results Presentation (2008) A-1

62 A.2 Median transitway This treatment (see Figure A-2) would develop a median transitway with 10-foot lanes and a raised landscaped median section from the general roadway section on both sides. The 10-foot lanes for the transitway, assuming curbing is provided, reflects lower operating speeds unless the lanes were further narrowed and became truly guided or widened with some shoulder treatment (which could be done if the landscaped median area is narrowed). This treatment would minimize conflicts between buses and other motor vehicle traffic at signalized intersections. The left turn lanes would be developed to the right of the transitway, and left-turning vehicles would be under protective signal control. This could be done by cutting into the landscaped median area nearside of intersections (assuming stations would be located on the farside of signalized intersections). A major impact of median transitways is the restriction of local access at unsignalized intersections and driveways. The median transitway acts as a raised median, and it would require restricting vehicles wanting to turn left into and out of local driveways and intersections. Vehicles should not cross a transitway facility at-grade unless under signal control, as it would be difficult for drivers to see and properly interpret bus movements along the transitway. Figure A-2: Median guideway concept along MD 355 Source: White Flint Redevelopment presentation to WMCOG (2009) Conceptually, the median transitway would result in higher operating speeds than would curbside bus lanes with the absence of general traffic in the lane. There is sufficient median area to develop a bus bypass lane at stations or in a midblock section to get a BRT vehicle around a local bus (or vice versa) if there were a high number of vehicles using the transitway. Additionally, the identified 15-foot landscaped median on both sides of the transitway would be more than adequate width to accommodate side platforms at designated BRT stop locations (which should be far side if transit signal priority is also applied). Platforms as narrow as 10 feet might be considered, which would reduce the landscaped median area by five feet on both sides and save 10 feet of right-of-way. With a median transitway, all transit riders would cross half of the street to access a station. However, there must be adequate pedestrian waiting area at the end of the platforms to accommodate transit riders waiting for a pedestrian signal to cross the street. A-2

63 A.3 Service roads This treatment (see Figure A-3) would separate the BRT vehicles from through traffic. If parking were located on the left side of the service road, as shown in the concept, parking maneuvers would not conflict with BRT operations. BRT stations could then be provided curbside in an expanded sidewalk area. This concept does identify a 200-foot right-of-way requirement, compared to 162 feet for the previous cross-section options. Figure A-3: Service roads concept along MD 355 Source: Rockville Pike Charette Results Presentation (2008) The major problem with this concept is the potential traffic conflicts and delays associated with merging the service road traffic (including BRT) onto the main roadway before signalized intersections. Transit signal priority would be rendered ineffective by potential queue backup with mainline traffic at such intersections. General traffic on the service roads could not take advantage of the limited green associated with individual bus movements out of the service road. This concept would appear to have the most potential for BRT delay and conflicts with through traffic and create some queue backup on the service roads, which would impact parking maneuvers and freight deliveries. A.4 Conclusions Table A-1 identifies a rating of each Rockville Pike cross section option with respect to four criteria: 1) BRT operations 2) BRT capacity 3) Conflicts with other motor vehicles and bicycles and 4) Station/pedestrian accessibility (does not reflect the added right-of-way required to develop the service road concept). Considering 1) the high traffic volume on Rockville Pike, 2) the extent of BRT (and local bus) service envisioned, and 3) the opportunity to integrate a bus bypass lane into the identified median section, a median transitway treatment would provide for both the highest BRT speeds and overall capacity for the corridor and the least conflict with other motor vehicles and bicycles. A-3
64 Table A-1: Summary of cross-section options Criterion Exclusive Bus Lanes Median Transitway Service Roads BRT Operations BRT Capacity Traffic Conflicts Station Access Total Score Note: 1 = Highest rating, 3 = Lowest rating A-4
65 APPENDIX B INITIAL CORRIDOR SCREENING METHODOLOGIES B.1 Preliminary screening methodology The consulting team developed and applied a preliminary screening methodology for the first 20 initial BRT corridors listed in Table 2-1 in Section 2.2 of this report. The methodology attempted to normalize certain attributes of some corridors relative to others. The four screening criteria developed for this stage of the study embodied these corridor attributes; they are as follows: Existing daily bus trips Percent of corridor within a 1/2-mile radius having BRT-supportive density under future conditions Presence of major attractors/activity centers Regional transit connectivity Sections B.1.1 through B.1.4 describe the analyses for each criterion in this preliminary screen methodology and the scoring ranges used to select the potential BRT corridors. Section B.1.5 describes the weighting system applied to the final score for each corridor. B.1.1 Existing daily bus trips This analysis determined the average number of daily inbound and outbound bus trips along each potential BRT corridor. Daily bus trips was used as a surrogate for daily transit ridership, which, at the time the analysis was initiated, was unavailable for the Ride On, WMATA, and MTA Commuter Bus routes operating within Montgomery County. The consulting team screened for this criterion using data from the Maryland Alternatives Analysis (MDAA) Phase I model developed in 2007 for both the Purple Line and Corridor Cities Transitway projects. The model output used for this screening was total origin-destination transit trips in the year 2000 for both peak and off-peak travel along each link in network. Based on this data, the average number of daily bus trips per corridor was calculated as the weighted average of the product of the total daily trips per link along a corridor and the length of each corresponding link, divided by the total length of the corridor. Transit trips were not determined for the CCT and ICC alignments because these facilities were in their respective planning stages in the year The scores for average number of daily bus trips were as follows: 5: More than 35 average daily trips 3: Between 20 and 35 average daily trips 1: Up to 20 average daily trips B.1.2 Percent of corridor within a 1/2-mile radius having BRT-supportive density under future conditions This analysis used GIS software to capture portions of the TAZs within 1/2-mile of each corridor that had BRT-supportive density under future conditions. Corridors such as I-270 and ICC had similar analyses conducted within 1/2-mile of each interchange. The analysis used minimum thresholds of six households per acre or five employees per acre as being supportive of BRT B-1
66 service. Past research and actual experience with BRT systems identified these thresholds as reasonable minimum targets for BRT service. The scores for BRT-supportive density under future conditions were as follows: 5: More than 43 percent density 3: Between 31 and 43 percent density 1: Up to 31 percent density B.1.3 Presence of major attractors/activity centers Information from Montgomery County s Department of Technology Services, the 2005 Ride On system map, and the MWCOG report, Metropolitan Washington Regional Activity Centers and Clusters (2007) supplemented by professional knowledge of the County identified the types and locations of major attractors and activity centers. The analysis first identified attractors and activity centers within 1/2-mile of each corridor (within 1/2-mile of the I-270 and ICC interchanges), followed by a review to retain facilities that were considered regionally significant. This reduced set of attractors and activity centers included business parks, colleges and universities, secondary schools, libraries, and hospitals. They also included mixed-use and employment centers identified by MWCOG. Attractors and activity centers not considered regionally significant included community, convenience, and neighborhood shopping centers; the majority of government offices in Montgomery County except district courts, Judicial Center, Executive Office Building, and Rockville Center; and college and universities with very low enrollment, such as health training facilities or those primarily providing online programs. The scores for major trip attractions/activity centers were as follows: 5: More than 29 attractors 3: Between 10 and 29 attractors 1: Up to 10 attractors B.1.4 Regional transit connectivity The analysis for this criterion identified the intersection of potential BRT corridors with local bus routes and major transit facilities, which include Metrorail, MARC commuter rail, future Purple Line service, bus transit centers, and park-and-ride lots. The intersecting connections were verified visually using Google Earth. Potential BRT corridors such as I-270 and ICC were analyzed by considering the number of intersecting transit connections at each interchange within the County. Each corridor was evaluated to determine the number of times it intersected one of the three types of transit facilities rail station, bus transit center, and local bus transfer. Weights were assigned to each facility type to emphasize its relative importance to regional connectivity. 5: Rail station 3: Bus transit center 1: Local bus B-2
67 The final score for this criterion was the total number of transit connections. For example, the total score for a corridor with two rail connections, four connections to a bus transit center, and 11 local bus connections would be calculated as follows: weights (2 x 5) + (4 x 3) + (11 x 1) = 33 attractors/centers The scores for regional transit connectivity were as follows: 5: More than 30 connections 3: Between 15 and 30 connections 1: Up to 15 connections B.1.5 Weighting of Total Score The total scores for each corridor were calculated two different ways: 1) assuming equal weights for all four criteria and 2) assuming different weights for each criterion. For the latter calculations, the following assumptions were made on weights: Percent future BRT-supportive density: 2 Presence of major attractors/activity centers: 2 Regional transit connectivity: 1.5 Existing bus trips: 1 Population and employment density and the number of major attractors and activity centers received the highest weights because these criteria provide strong justifications for offering and supporting BRT service. Daily bus trips received the lowest weight because data on existing daily ridership was unavailable by corridor segment at the time of the evaluation. Table B-1 shows the scores for each criterion by route. Table B-2 compares the scores for both the unweighed and weighed criteria, and shows similar rankings of the corridors. The corridors were divided into three tiers based on the range in scores. The Tier 1 and 2 corridors, consisting of the top 10 corridors with the highest scores, comprise about 122 miles (excluding the CCT corridor), which was close to the initial goal of a 120-mile network of corridors for the refined assessment. The CCT corridor was evaluated as part of this exercise and its scoring results are included in the criteria scoring matrix and summary scoring table. As this is a committed transit corridor in MWCOG s constrained long-range transportation plan, the team did not include it in the top corridors advanced for refined assessments. Tier 3 corridors included those with low scores and fell outside the 120-mile threshold. These corridors excluded the ICC corridor, for reasons similar to those for the CCT corridor. B-3
68 Table B-1: Results of Initial BRT Corridor Screening: Detailed Scoring Matrix Existing Bus Trips BRT-supportive Density (Future Year) Presence of Major Activity Centers (1/2- mile area) Number of Regional Transit Connections Corridor Number Corridor From To Corridor Length (miles) Avg. # of Daily Bus Trips Score % BRT Supportive Density Score Reduced # of Major Trip Attractions Score # of Metro/MARC/P urple Line Connections Weighted Rail Connections (5) # of Major Transit/Transfer Centers/PnR Weighted Center Connections (3) # of Intersecting Bus Routes Score 1 Bel Pre Road/Bonifant Road Georgia Avenue New Hampshire Avenue % CCT (master plan alignment) COMSAT Shady Grove Metrorail station % Darnestown 3 Road/Montgomery Avenue/Veirs Mill Road/MD 586 Quince Orchard Road Georgia Avenue % Georgia Avenue/Olney Sandy Olney Sandy Spring Road and Silver Spring Metrorail Spring Road Spartan Road station % Gude Drive/Key West Avenue MD 28/Darnestown Road Norbeck Road % I-270/I-495 Frederick border VA border % MD 124/Muddy Branch Road Airpark Road MD % MD 185/Connecticut Avenue Georgia Avenue East-West Highway % MD 190/River Road/Seven Locks Road Montrose Road DC border % MD 355 Clarksburg DC border % MD 650/New Hampshire Avenue Bonifant Road DC border % Montgomery Mall/Old Prince George's County Georgetown Road/Rockville Westlake Terrace border Pike/East-West Highway % Montgomery Village 13 Avenue/Quince Orchard Snouffer School Road MD % Road 14 Montrose Road/Randolph Road/Cherry Hill Road Seven Locks Road Montgomery County border % Norbeck Road/MD 198/Spencerville Road MD/28/MD 586 Montgomery County border % Shady Grove Road MD 28 Muncaster Mill Road % Snouffer School Road/Muncaster Mill Road Brink Road MD 28/Norbeck Road % University Boulevard Connecticut Avenue Montgomery County border % US 29/Columbia Pike/Colesville Road Howard County border DC border % ICC MD 355 and I-370 Prince George's County border % B-4
69 Table B-2: Results of Initial BRT Corridor Screening: Final Scores Corridor Number Corridor Unweighted Score Weighted Score 1 Bel Pre Rd/Bonifant Rd Number of Miles 2 CCT Darnestown Rd/Montgomery Ave/Veirs Mill Rd/MD Georgia Ave/Olney Sandy Spring Rd Gude Dr/key West Ave I-270/I MD 124/Muddy Branch Rd MD 185 Connecticut Ave MD 190/River Rd/Seven Locks Rd MD MD 650/New Hampshire Ave Montg Mall/Old Georgetown Rd/Rockville Pike/E-W Hwy Montgomery Village Ave/Quince Orchard Rd Montrose Rd/Randolph Rd/Cherry Hill Rd Norbeck Rd/MD 198/Spencerville Rd Shady Grove Rd Snouffer School Rd/Muncaster Mill Rd University Blvd US 29/Columbia Pike/Colesville Rd ICC Tier 1 Corridors - 87 miles (minus CCT) Tier 2 Corridors - 35 miles (122 miles Tiers 1 & 2) Tier 3 Corridors - 76 miles (minus ICC) (198 miles Total) B.2 Revised screening methodology After reviewing the preliminary screening results and receiving feedback from the technical advisory committee, the consulting team made several changes to the corridors and revised the corridor screening methodology. The first change involved removing the following three corridors from the initial set of potential BRT corridors: Corridor 2: CCT Corridor 6: I-270/I-495 Corridor 20: ICC Corridors 2 and 6 were removed because they were subjects of separate studies under current consideration for transportation enhancements by another agency. Corridor 20 was removed during the initial corridor screening it was designed and in the midst of being constructed as a B-5
70 limited-access toll facility; however, it was reconsidered for inclusion in the final proposed network to help improve east-west connectivity within the County. Second, the following corridors were added to be screened: Corridor 21: North Bethesda Transitway Corridor 22: Sam Eig Highway Next, the MD 355 corridor was split into MD 355 North (Corridor 10a) and MD 355 South (Corridor 10b). Additionally, the advisory group recommended advancing eight of the potential BRT corridors to the refined route assessment without being screened because transit enhancements had been evaluated for them in previous studies. These corridors were as follows: Corridor 3: Darnestown Road/Montgomery Avenue/Veirs Mill Road/MD 586 Corridor 4: Georgia Avenue/Olney Sandy Spring Road 14 Corridor 10a: MD 355 South Corridor 14: Montrose Road/Randolph Road/Cherry Hill Road Corridor 18: University Boulevard Corridor 19: US 29/Columbia Pike/Colesville Road Corridor 21: North Bethesda Transitway Corridor 22: Sam Eig Highway Finally, the remaining 12 corridors were screened using a revised definition of the criteria. Corridor 12, one of the remaining corridors, was shortened during this step to terminate it in Bethesda instead of running it through Montgomery County and into Prince George s County. The first two criteria existing daily bus trips and percentage of BRT-supportive density did not change from the definition in the preliminary screening methodology. Sections B.2.1 and B.2.2 redefine the last two criteria presence of attractors/activity centers and regional transit connectivity and Section B.2.3 describes the overall scoring system applied to all four criteria and used to select corridors for refined assessment. B.2.1 Presence of major attractors/activity centers The analysis identified regional activity centers within 1/2-mile of each corridor. Using MWCOG s Metropolitan Washington Regional Activity Centers and Clusters (2007) as a guide, the following weights were applied to each type of regional activity center: 5: mixed-use activity centers 3: employment centers 1: all remaining activity centers The final weight was applied to all remaining activity centers within 1/2-mile of each corridor as identified using GIS data from the County s Department of Technology Services and the advisory committee s knowledge of the County. Attractors and activity centers that were considered regionally significant included the following: 14 Corridor 4: Georgia Avenue/Olney Sandy Spring Road, was separated into two corridors during the refined route assessment. B-6
71 Business parks Colleges and universities, except those with very low enrollment Secondary schools Libraries The sub-score for each corridor was based on a weighted sum of the total number of attractors and activity centers. For example, the sub-score for a BRT corridor proximate to one mixed-use center, two employment centers, and 14 others attractors was calculated as follows: weights (1 x 5) + (2 x 3) + (14 x 1) = 25 attractors/centers B.2.2 Regional transit connectivity Using Google Earth, the analysis for this criterion identified the total number of direct intersections of potential BRT corridors with local bus routes. Weights were applied to each facility type to emphasize its relative importance to regional connectivity. 5: presence of Metrorail, MARC, and future CCT and Purple Line stations within a 1/4- mile radius of a potential BRT corridor 3: presence of park-and-ride lots and bus transit centers within 1/4-mile radius of a potential BRT corridor 1: direct intersection of local bus routes to a potential BRT corridor The sub-scores for transit connectivity were calculated similar to that for major attractors and activity centers. B.2.3 Corridor Scoring and Results The thresholds for scoring each of the four criteria were defined based on the following conditions: 5: value greater than at least one standard deviation above the average 3: value at least equal to the average, but within one standard deviation of the average 1: value less than the average Expanding on the previous example, a potential BRT corridor, and three other corridors scoring 21, 40, and 10 for the presence of major attractors and activity centers would have an average score of 24 with a standard deviation of The thresholds would be as follow: 5: 3: 1: > 36.4 transit connections 24 < x < 36.4 transit connections < 24 transit connections Therefore, the potential BRT corridor scoring 25 for the presence of major attractors and activity centers would receive a threshold score of three. The threshold score finally was multiplied by B-7
72 the criterion weight to determine a final score for the criterion measured along the potential BRT corridor. In this example, the score of 3 would be multiplied by a criterion weight of 1.5 to give a final score of 4.5. All potential BRT corridors scoring at least a 10 across all criteria were advanced for refined assessment. Table B-3 shows the results of the revised screening analysis. In addition to the eight corridors that were automatically advanced for refined assessment, the following eight corridors were added to the list (in order of highest to lowest score). Corridor 10a: MD 355 North Corridor 5: Gude Drive/Key West Avenue Corridor 12: Montgomery Mall/Old Georgetown Road Corridor 13: Montgomery Village Avenue/Quince Orchard Road Corridor 16: Shady Grove Road Corridor 7: MD 124/Muddy Branch Road Corridor 8: MD 185/Connecticut Avenue Corridor 11: MD 650/New Hampshire Avenue Comparing the corridor scores in Table B-2 and Table B-4 show that, under both screening methodologies, four corridors did not advance for refined assessments. They were the following: Corridor 9: Bel Pre Road/Bonifant Road Corridor 13: MD 190/River Road/Seven Locks Road Corridor 17: Snouffer School Road/Muncaster Mill Road Corridor 18: Norbeck Road B-8

73 Table B-3: Results of Revised BRT Corridor Screening: Detailed Scoring Matrix Corridor Number a Corridor Name Bel Pre Rd/Bonifant Rd Gude Dr/Key West Ave MD 124/Muddy Branch Rd MD 185/Connecticut Ave MD 190/River Road/Seven Locks Road MD 355 North MD 650/New Hampshire Ave Mont Mall/Old Georgetown Rd Montgomery Village/Quince Orchard Norbeck Rd Shady Grove Road Snouffer School/Muncaster Mill Rds Existing Bus Trips BRTsupportive Presence of Major Attractors/Activity Centers Number of Regional Transit Connections Density From Georgia Ave. MD 28/Darnestown Rd Airpark Rd. to Muddy Branch Georgia Ave. Montrose Rd Comus Rd., Clarksburg US 29 Westlake Terrace Snouffer School Rd Rockville Metrorail station MD 28 Brink Rd To New Hampshire Ave Norbeck Rd Hwy 124 to MD 28 East-West Highway DC border Rockville Metrorail station University Boulevard Bethesda Metrorail station MD 28 Georgia Avenue/Nobeck Road PnR Muncaster Mill Rd MD 28/Norbeck Rd. Corridor Length (miles) Avg. # of Daily Bus Trips Threshold Score (Weight=1) Future % BRT Supportive Density 35.4% 75.4% 53.5% 12.2% 4.2% 64.2% 27.8% 60.5% 51.4% 21.5% 60.1% 7.0% Threshold Score (Weight=2) # of Mixed-use Centers Mixed-use Weight (5) # of Employment Centers Employment Center Weight (3) # of Remaining Attractors Remaining Attractors Weight (1) Total Weighted Regional Attractions Threshold Score (Weight=2) # of Metro/MARC/Purple Line/CCT Connections Weighted Rail Connections (5) # of Major Transit/Transfer Centers/PnR Weighted Center Connections (3) # of Intersecting Bus Routes Weighted Intersecting Bus Routes (1) Total Weighted Transit Connections Threshold Score (Weight=1.5) B-9
74 Table B-4: Results of Revised BRT Corridor Screening: Final Scores Corridor Length (miles) Corridor Number Corridor 1 Bel Pre Road/Bonifant Road Gude Drive/Key West Avenue MD 124/Muddy Branch Road MD 185/Connecticut Avenue MD 190/River Road/Seven Locks Road a MD 355 North MD 650/New Hampshire Avenue Total Score Ranking 12 Montgomery Mall/Old Georgetown Road Montgomery Village Avenue/Quince Orchard Road Norbeck Road Shady Grove Road Snouffer School Road/Muncaster Mill Road B-10
75 APPENDIX C BRT TREATMENTS EVALUATED FOR REFINED ROUTE ASSESSMENT The consulting team considered several treatment options during the refined route assessment. This appendix describes them and outlines the methodology for each option. C.1 Guideway assessment C.1.1 Treatment options The guideway assessment identified the applicability of the following potential guideway treatment options along each of the current designated BRT routes: Operating in travel lane One-lane guided busway Two-lane guided busway One-lane unguided busway Two-lane unguided busway Side-of-road guided busway Figure C-1 shows the cross section for the first five of these treatments. The last treatment, the side-of-road guided busway, has dimensions similar to those for the one-lane guided busway. The given busway dimensions are consistent with new BRT guideway planning and design guidelines being developed by APTA. C-1
76 Figure C-1: Cross-sections of possible BRT guideway treatments (a) Bus Lane on Street (b) One-lane Guided (c) One-lane Unguided C-2
77 Figure C-1 (continued) (d) Two-lane Guided (e) Two-lane Unguided: open concept (f) Two-lane Unguided: closed concept C-3
78 C Operating in travel lane This treatment would involve either widening a roadway and operating in a new lane (assumed to be in the same direction as general traffic) or converting an existing general traffic lane to an exclusive bus lane. In the case of widening a roadway to provide an added lane(s), a 12-foot lane width was assumed in the evaluation. C Guided busway A guided busway would allow some reduction in cross section width because of the greater ability to steer a vehicle. Guide wheels typically would be mounted on the vehicle, though a driver could also operate a bus without guide wheels if under a lower speed. This represents the narrowest cross-section for a potential busway treatment. In this assessment, both one-lane and two-lane guided busways were evaluated. A one-lane guided busway was assumed to have a cross section requirement of 15 feet, including nine feet for the operating lane, one-foot curbing on both sides, and a two-foot separation distance to an adjacent traffic lane or adjacent off-road feature. If developed in the median, it could be reversible, operating in the peak direction during the peak period. If it were developed along the side of the roadway, a one-lane guided busway would operate only in the direction of travel on that side of the roadway all of the time. A two-lane guided busway was also evaluated, which would provide two-directional operation at all times, and was assumed to have a cross section width of 24 feet, two 8.5-foot lanes, three one-foot curbs for separation, and two feet separation distance on both sides. C Unguided busway With an unguided busway, narrow shoulders would be included in the busway section, with the buses operating unguided. This is to provide some latitude for drivers to maneuver past other vehicles or to be able to have a maintenance or tow vehicle service a disabled vehicle. Thus, a wider cross section width was identified, assumed to be 24 feet for a one-lane section and 36 feet for a two-lane section. The one-lane unguided section would have a single 10-foot lane, four-foot shoulders, one-foot curbing on both sides, and a two-foot separation from an adjacent traffic lane or off-road feature. The two-lane unguided section would have dual 11-foot lanes, four-foot shoulders, one-foot curbing on both sides, and a two-foot separation distance. Although not assessed during this study, an added narrower cross section for a two-lane unguided median busway was identified. This would consist of 11-foot lanes in each direction, separated by a two-foot raised median, and a two-foot pavement separation on both sides from adjacent general traffic lanes, with raised markers in those transition areas. This cross-section would have a total width of 28 feet. C.1.2 Median assessment Using GIS mapping for each BRT route, the existing median width along each BRT route for different segments was identified. Changes in median widths were recorded. The median width in each segment was then related to the width required to develop each of the busway options between intersections. It was recognized that at intersections, particularly signalized intersections, where turn lanes have been developed, that a narrower median width typically C-4
79 exists compared to midblock sections. Thus, the applicability of developing one or more of the median busway options at intersections would be based on the ability to widen approaches to replace turn lanes, and even widen further where BRT stations would be located (the extent of widening to accommodate stations based on the station platform configuration and overall platform width identified). As a surrogate for this impact, the number of signalized intersections along each BRT route was identified. With a median guideway treatment, all vehicle crossings of such a corridor would have to be signalized. C.1.3 Take-a-lane assessment This assessment involved using both years 2005 and 2030 weekday peak-hour and off-peakhour model volumes and roadway capacities to identify whether a general traffic lane in a particular direction could be converted to an exclusive bus lane. This option could occur along roadway sections with two or more lanes in a particular direction. The volume to capacity ratio was calculated in the remaining general traffic lanes after a lane removal for a bus lane, for different segments of the route where the volume and/or capacity varied. If the volume to capacity ratio was assumed to be 1.0 or greater, representing overcapacity conditions in the remaining general traffic lane (s), then the take a lane option was not considered applicable. C.1.4 Side-of-road assessment GIS mapping was also used to identify what right-of-way was available outside of the existing roadway along each BRT route to either widen a roadway in a particular direction to develop an added lane which could be devoted to bus-only use, or the development of one or two-lane guided or unguided busways. The analysis was conducted assuming that space would need to be available within the existing right-of-way to replace on-street parking, sidewalks, and overhead utility lines, if a widened roadway or separate busway were provided. It was also assumed that there would be a minimal five-foot separation between the back of sidewalk or utility pole locations and the start of the busway treatment. This assessment only applied to Route 3: MD 586/Veirs Mill Road to take advantage of existing shoulders alongside the roadway in each direction. C.1.5 Packaging of treatments Once the different guideway assessments were completed, the applicability and continuity of the different potential BRT cross sections were evaluated to identify where possible a logical continuous guideway treatment could be developed along all or a segment of the corridor. This included keeping one particular treatment over as long a stretch as possible, and transitioning to another treatment only at signalized locations where, through special signal phasing, safe transitions could be made from one treatment to another. In general, a guideway treatment was considered applicable if it could extend at least one mile. A few exceptions were made where shorter guideways were acceptable, related to a BRT route pulling off its main corridor onto a cross street to serve a station (such as the US 29 route serving the Briggs Chaney Road park-nride). C-5

80 C.2 Intersection assessment C.2.1 Transit signal priority At this stage of the study, an overview assessment of TSP applicability at the signalized intersections along each BRT route was conducted. TSP was considered to represent green extension and/or red truncation for BRT vehicles operating straight through at intersections, as illustrated in Figure C-2. In such cases, LOS was used as the measure to determine potential TSP applicability. Existing conditions were assessed, as intersection LOS data was only available related to existing conditions. In particular, if the intersection LOS during a particular weekday peak period was C or D, TSP was assumed to have a benefit to transit operations and a negligible impact on traffic operations, and hence potentially applicable. Using LOS C and D was considered a conservative assumption for TSP applicability. A more detailed assessment of TSP applicability using Synchro models or other detailed operations analysis data, and the possibility of TSP being feasible in certain cases under LOS E, was not possible within the study budget. Figure C-2: Example of TSP application Source: TCRP Synthesis 83 Intersection level of service information was available from SHA for about 70 percent of the signalized intersections along the BRT routes. For the other intersections, critical lane volume and volume to capacity information from M-NCPPC was used, where available, to convert to LOS using the relationships relating critical lane volumes to LOS in the NCHRP Circular 212 report from Table C-1 shows the relationship of volume to capacity ratio to LOS described in Circular 212. C-6

81 Table C-1: Relationship of LOS to v/c ratios for signalized intersections LOS V/C Ratio A B C D E F Source: NCHRP Circular 212 C.2.2 Queue jumps An alternate priority treatment to TSP at signalized intersections is a queue jump treatment. This is where a bus could use an auxiliary lane at a signalized intersection to bypass the adjacent general traffic queue, and then have an advance green signal to move through the intersection unimpeded ahead of the general traffic. Figure C-3 illustrates this application. In this study, the queue jump assessment considered the following factors: If there was an existing right turn lane available on a particular intersection approach which could be used for a queue jump, and o If there was not an excess number of right turns and heavy adjacent through traffic volumes that would hinder the ability of a BRT vehicle to access the right turn lane, or o Be substantially delayed in the lane by right turn traffic Figure C-3: Example of queue jump application (a) Bus receives green signal before other vehicles (b) Other vehicles proceed a few seconds later Source: TCRP Synthesis 83 Given the absence of detailed intersection operations data, a qualitative assessment of potential queue jump applicability was undertaken, with rough queue lengths estimated during weekday AM and PM peak periods based on assumed signal cycle lengths and knowing right turn volumes and adjacent through traffic volumes on approaches from intersection turning movement counts. The assessment was only undertaken for existing/recent conditions, as year 2030 intersection turning movements were not available. C-7
Countywide Transit Corridors Functional Master Plan
 Countywide Transit Corridors Functional Master Plan Makeover Montgomery II May 10, 2014 Master Plan Status Begun: August 2011 Planning Board Approved Draft Plan: July 2013 Council Approved Final Plan:
Presentation of Staff Draft March 18, 2013 COUNTYWIDE TRANSIT CORRIDORS FUNCTIONAL MASTER PLAN
 Presentation of Staff Draft March 18, 2013 COUNTYWIDE TRANSIT CORRIDORS FUNCTIONAL MASTER PLAN Public Outreach Fall 2011: Two community meetings/open houses Fall 2012: Three community meetings/open houses
MONTGOMERY COUNTY PLANNING DEPARTMENT THE MARYLAND-NATIONAL CAPITAL PARK AND PLANNING COMMISSION
 MONTGOMERY COUNTY PLANNING DEPARTMENT THE MARYLAND-NATIONAL CAPITAL PARK AND PLANNING COMMISSION MCPB Item No. 2 Date: 12-15-11 Network and Methodology Report - Countywide Transit Corridors Functional
Operational Comparison of Transit Signal Priority Strategies
 Operational Comparison of Transit Signal Priority Strategies Revision Submitted on: November, 0 Author: Adriana Rodriguez, E.I Assistant Engineer Parsons Brinckerhoff 0 South Orange Avenue, Suite 00 Orlando,
PURPOSE AND NEED SUMMARY 54% Corridor Need 1. Corridor Need 2. Corridor Need 3. Corridor Need 4. Corridor Need 5
 SUMMARY PURPOSE AND NEED Chapel Hill Transit ridership has increased Buses operate every 4 minutes and have standing room only Exceeding seated capacity by 12% Corridor Need 1 by more than 20 percent between
ALTERNATIVES ANALYSIS EXECUTIVE SUMMARY
 West Valley Connector Corridor ALTERNATIVES ANALYSIS EXECUTIVE SUMMARY FINAL September 2014 Ontario International Airport Ontario Mills Rancho Cucamonga Metrolink Station Kaiser Permanente PARSONS EXECUTIVE
Preliminary Transportation Analysis
 Preliminary Transportation Analysis Goals of a Robust, Multimodal Transportation Network Safe Accessible/Connected Efficient Comfortable Context-Sensitive Motor Vehicle: Continue to analyze the data to
Arlington County 10-Year Transit Development Plan & Premium Transit Network Briefing. May 2016
 Arlington County 10-Year Transit Development Plan & Premium Transit Network Briefing May 2016 Overview 10-Year Transit Development Plan Premium Transit Network Columbia Pike service concept Premium amenities
Rapid Transit in Montgomery County
 Rapid Transit in Montgomery County Montgomery County Department of Transportation Al Roshdieh, Acting Director 1 Background Corridors in Detail Corridor Cities Transitway MD 355 (Bethesda to Rockville
Bus Rapid Transit Plans
 Twin Cities Region Bus Rapid Transit Plans ULI Minnesota Workshop Connecting Bus Rapid Transit to the Community December 15, 2009 John Levin Director of Service Development Metro Transit Metropolitan Area
APPENDIX E BIKEWAY PRIORITIZATION METHODOLOGY
 APPENDIX E BIKEWAY PRIORITIZATION METHODOLOGY INTRODUCTION The network of bikeways recommended in the Bicycle Master Plan is extensive and is likely to be only partially completed during the 25-year life
Spring Lake Park Mounds View North Oaks. Arden Hills. Shoreview. Roseville. Little Canada. Falcon Heights SNELLING. Lilydale. West Saint Paul 35E
 Coon Rapids Blaine Spring Lake Park Mounds View rth Oaks In 2011, Metro Transit embarked on the Arterial 494 Minnetonka Maple Grove Plymouth Hopkins Brooklyn Park New Hope Golden Valley Louis Park Edina
MONTGOMERY COUNTY PLANNING DEPARTMENT THE MARYLAND-NATIONAL CAPITAL PARK AND PLANNING COMMISSION
 MONTGOMERY COUNTY PLANNING DEPARTMENT THE MARYLAND-NATIONAL CAPITAL PARK AND PLANNING COMMISSION MCPB Item No. 4 Date: 09-10-15 Scope of Work for the Bicycle Master Plan David Anspacher, Planner/Coordinator,
Chapter 3 BUS IMPROVEMENT CONCEPTS
 Chapter 3 BUS IMPROVEMENT CONCEPTS The purpose of this chapter is to describe potential bus improvement strategies and potential impacts or implications associated with BRT implementation within the existing
Roadways. Roadways III.
 Introduction 97 Roadway Design Principles 98 Safe Speeds 99 Optimizing of Street Space 00 Minimum Lane Widths in the City of Boston 02 Design Features that Reduce Operating Speeds 05 Travel Lanes Transit
Multimodal Approach to Planning & Implementation of Transit Signal Priority within Montgomery County Maryland
 Multimodal Approach to Planning & Implementation of Transit Signal Priority within Montgomery County Maryland A Path to Successful Implementation James Allday Bunch - Sabra, Wang & Associates, Inc. ITS
ROUTES 55 / 42 / 676 BUS RAPID TRANSIT LOCALLY PREFERRED ALTERNATIVE
 ROUTES 55 / 42 / 676 BUS RAPID TRANSIT LOCALLY PREFERRED ALTERNATIVE April, 2012 1 INTRODUCTION The need for transit service improvements in the Routes 42/55/676 corridor was identified during the Southern
MONTGOMERY COUNTY PLANNING DEPARTMENT THE MARYLAND-NATIONAL CAPITAL PARK AND PLANNING COMMISSION
 MONTGOMERY COUNTY PLANNING DEPARTMENT THE MARYLAND-NATIONAL CAPITAL PARK AND PLANNING COMMISSION MCPB Item No. 3 Date: 01-19-12 Worksession: Countywide Transit Corridors Functional Master Plan Larry Cole,
Purpose and Need. Chapter Introduction. 2.2 Project Purpose and Need Project Purpose Project Need
 Chapter 2 Purpose and Need 2.1 Introduction The El Camino Real Bus Rapid Transit (BRT) Project (Project) would make transit and other transportation improvements along a 17.6-mile segment of the El Camino
Scottsdale Road/Rural Road Alternatives Analysis (AA) Study. Arizona ITE/IMSA Spring Conference March 7, 2012
 Study. Arizona ITE/IMSA Spring Conference March 7, 2012") Scottsdale Road/Rural Road Alternatives Analysis (AA) Study Arizona ITE/IMSA Spring Conference March 7, 2012 Study Location and Duration Primary Study Corridor (major focus of effort) Rural Road and Scottsdale
Scottsdale Road/Rural Road Alternatives Analysis (AA) Study Arizona ITE/IMSA Spring Conference March 7, 2012 Study Location and Duration Primary Study Corridor (major focus of effort) Rural Road and Scottsdale
Community Task Force July 25, 2017
 Community Task Force July 25, 2017 Welcome and Introductions Project Partners Regional Transportation District (RTD) Colorado Department of Transportation (CDOT) Denver Regional Council of Governments
Appendix G: Bicycle Parking Space Recommendations at Transit Stations
 Appendix G: Bicycle Parking Space Recommendations at Transit Stations Bicycle parking is needed at all Metrorail Red Line, MARC, Purple Line and Corridor Cities Transitway stations. This appendix includes
Arterial Transitway Corridors Study. Ave
 Arterial Transitway Corridors Study Ave January 2012 Arterial Transitway Corridors Study Overview Corridor Features and Demographics 11 study corridors, 95 route miles 86,000 daily rides and half of existing
Appendix A-2: Screen 1 Alternatives Report
 Appendix A-2: Screen 1 Alternatives Report SCREEN 1 ALTERNATIVES REPORT Western & Ashland Corridors Bus Rapid Transit (BRT) Project Prepared for Chicago Transit Authority 567 West Lake Street Chicago,
APPENDIX 14: CONNECTIONS: TRANSPORTATION ANALYSIS. Transportation Planning, Analysis
 APPENDIX 14: CONNECTIONS: TRANSPORTATION ANALYSIS Transportation Planning, 2008 Germantown has various options of transportation for citizens in the community. There are major highways, buses, MARC, bicycle
Arterial Transitway Corridors Study
 Arterial Transitway Corridors Study February 2012 Arterial Transitway Corridors Study Overview Corridor Features and Demographics 11 study corridors, 95 route miles Routes: 86,000 daily rides and half
6 Screen 3 Analysis and Results
 6 Screen 3 Analysis and Results Introduction This chapter documents the results of the Screen 3 (final) evaluation and screening process. This chapter contains the following elements: Description of the
David Jickling, Public Transportation Director Regional Transportation Commission, Washoe County
 David Jickling, Public Transportation Director Regional Transportation Commission, Washoe County Virginia Street Resort corridor connecting University of Nevada, Reno Downtown Truckee River Strip Casinos
South King County High-Capacity Transit Corridor Study
 HIGH-CAPACITY TRANSIT CORRIDOR STUDY South King County Corridor South King County High-Capacity Transit Corridor Study Corridor Report August 2014 South King County High Capacity Transit Corridor Report
ALTERNATIVES SCREENING REPORT
 VAN NESS AVENUE BUS RAPID TRANSIT (BRT) ALTERNATIVES SCREENING REPORT Revised Draft, 3/28/08 San Francisco County Transportation Authority 1 Introduction The San Francisco County Transportation Authority
Corridor Advisory Group and Task Force Meeting #10. July 27, 2011
 Corridor Advisory Group and Task Force Meeting #10 July 27, 2011 1 Agenda Recap CAG/TF #9 Public Meeting #2 Summary Single Mode Alternatives Evaluation Results Next Steps 2 3 CAG/TF #9 Recap CAG /TF #9
Executive Summary BEYOND THE B-LINE: RAPID TRANSIT LINE PHASE II - COMMERCIAL DRIVE WEST. Final Draft December 13, Appendix B BROADWAY/LOUGHEED
 BEYOND THE B-LINE: BROADWAY/LOUGHEED RAPID TRANSIT LINE PHASE II - COMMERCIAL DRIVE WEST Appendix B Executive Summary Final Draft December 13, 1999 UMA Lloyd Lindley Davidson Yuen Simpson Architects BROADWAY/LOUGHEED
Gratiot Avenue Transit Study Tech Memo #4: Ridership
 Gratiot Avenue Transit Study Tech Memo #4: Ridership 5/31/2016 Table of Contents 1 INTRODUCTION... 3 PROJECT DESCRIPTION... 3 2 TECH MEMO #4 OVERVIEW... 5 METHODOLOGY... 5 3 THE ALTERNATIVES AND POTENTIAL
Abstract. Source of Copies The Maryland-National Capital Park and Planning Commission 8787 Georgia Avenue Silver Spring, MD 20910
 1 Abstract This document contains an examination of and recommendations for transit, bicycle, and pedestrian infrastructure that will help create complete transportation options. With the approval and
NY 5 BRT Conceptual Design Study: Study Advisory Committee Meeting 1. with Creighton Manning Engineering, LLP Logitrans Herb Levinson
 NY 5 BRT Conceptual Design Study: Study Advisory Committee Meeting 1 with Creighton Manning Engineering, LLP Logitrans Herb Levinson September 22, 2003 Overview Introduction to the consultant team Goals
WHAT IS BRT? Jack M. Gonsalves, PE, Parsons Brinckerhoff, Inc. February 22, 2012
 WHAT IS BRT? Jack M. Gonsalves, PE, Parsons Brinckerhoff, Inc. February 22, 2012 What is Bus Rapid Transit (BRT)? A flexible, high performance rapid transit mode that combines a variety of physical, operating,
Washington DC Section of ITE Project Briefing
 Washington DC Section of ITE Project Briefing November 5, 2015 Renée Hamilton, VDOT, Deputy District Administrator I-66 Outside the Beltway Improvement Area Project Location Virginia 2 Purpose and Need
Multimodal Through Corridors and Placemaking Corridors
 68 Multimodal Through Corridors and Placemaking Corridors Corridors have different functions in a region. Some corridors are used to get smoothly and rapidly through a region or to get quickly to major
Greater Cleveland Regional Transit Authority
 Greater Cleveland Regional Transit Authority Transit Priority Corridor Initiatives West 25 th Street /East 105 th /East 93 rd Streets June 20, 2017 Presented to: Planning & Development Committee Greater
Southwest Bus Rapid Transit (SW BRT) Functional Planning Study - Executive Summary January 19 LPT ATTACHMENT 2.
 Functional Planning Study - Executive Summary January 19 LPT ATTACHMENT 2.") Southwest Bus Rapid Transit (SW BRT) Functional Planning Study - Executive Summary 2011 January 19 1 of 19 Introduction This executive summary presents the results of the Southwest Bus Rapid Transit (SW
Southwest Bus Rapid Transit (SW BRT) Functional Planning Study - Executive Summary 2011 January 19 1 of 19 Introduction This executive summary presents the results of the Southwest Bus Rapid Transit (SW
MONTGOMERY COUNTY PLANNING DEPARTMENT
 MONTGOMERY COUNTY PLANNING DEPARTMENT THE MARYLAND-NATIONAL CAPITAL PARK AND PLANNING COMMISSION Veirs Mill Corridor Master Plan: Work Session #5 MCPB Item No. Date: 10/04/18 Jessica McVary, Planner Coordinator,
Main-McVay Transit Study: Phase 2 Options Definition and High Level Constraints Evaluation
 Main-McVay Transit Study: Phase 2 Options Definition and High Level Constraints Evaluation APRIL 2016 A collaborative study between: For Additional Information or to Comment If you would like additional
2014 Mobility Assessment Report Functional Planning & Policy Montgomery County Planning Department
 2014 Mobility Assessment Report Functional Planning & Policy Montgomery County Planning Department Travel Trends National & Local Travel Trends Multi-Modal Monitoring Pedestrian Bikes Bus Rail Future Efforts
DUNBOW ROAD FUNCTIONAL PLANNING
 DUNBOW ROAD FUNCTIONAL PLANNING Final Report August 3, 216 #31, 316 5th Avenue NE Calgary, AB T2A 6K4 Phone: 43.273.91 Fax: 43.273.344 wattconsultinggroup.com Dunbow Road Functional Planning Final Report
Guidelines for Providing Access to Public Transportation Stations APPENDIX C TRANSIT STATION ACCESS PLANNING TOOL INSTRUCTIONS
 APPENDIX C TRANSIT STATION ACCESS PLANNING TOOL INSTRUCTIONS Transit Station Access Planning Tool Instructions Page C-1 Revised Final Report September 2011 TRANSIT STATION ACCESS PLANNING TOOL INSTRUCTIONS
5.0 Roadway System Plan
 Southwest Boise Transportation Study Page 16 5.0 Roadway System Plan The Roadway System Plan outlines roadway improvements in the Initial Study Area. It forecasts future deficiencies on the arterial system,
In station areas, new pedestrian links can increase network connectivity and provide direct access to stations.
 The Last Mile Planning for Pedestrians Planning around stations will put pedestrians first. Making walking to stations safe and easy is important; walking will be a part of every rapid transit Accessible
4 DISRUPTION MANAGEMENT PLAN HIGHWAY 7 RAPIDWAY CONSTRUCTION BETWEEN BAYVIEW AVENUE AND WARDEN AVENUE TOWNS OF MARKHAM AND RICHMOND HILL
 4 DISRUPTION MANAGEMENT PLAN HIGHWAY 7 RAPIDWAY CONSTRUCTION BETWEEN BAYVIEW AVENUE AND WARDEN AVENUE TOWNS OF MARKHAM AND RICHMOND HILL The Transportation Services Committee recommends the adoption of
ADOT Statewide Bicycle and Pedestrian Program Summary of Phase IV Activities APPENDIX B PEDESTRIAN DEMAND INDEX
 ADOT Statewide Bicycle and Pedestrian Program Summary of Activities APPENDIX B PEDESTRIAN DEMAND INDEX May 24, 2009 Pedestrian Demand Index for State Highway Facilities Revised: May 29, 2007 Introduction
TABLE OF CONTENTS FIGURES TABLES. Executive Summary Report: BLUE LINE
 TABLE OF CONTENTS 1.0 INTRODUCTION... 1 1.1 Blue Line Project Goals... 1 1.2 Corridor Travel Demand... 2 1.2.1 Market Analysis... 2 1.2.2 Existing Transit Operations... 2 2.0 RECOMMENDED ALTERNATIVE...
Appendix B: Forecasting and Traffic Operations Analysis Framework Document
 Existing Conditions Report - Appendix Appendix B: Forecasting and Traffic Operations Analysis Framework Document This document defines the methodology and assumptions that will be used in the traffic forecasting
SANTA MONICA BOULEVARD CORRIDOR
 CIRCULATION ELEMENT WHITE PAPER NO. 3 SANTA MONICA BOULEVARD CORRIDOR INTRODUCTION From the 1930s to the beginning of Los Angeles freeway era, Santa Monica Boulevard, (previously Route 66, the Beverly
Providence Downtown Transit Connector STAKEHOLDER MEETING #2. Stakeholder Meeting #1 October 24, 2016
 Providence Downtown Transit Connector STAKEHOLDER MEETING #2 Stakeholder Meeting #1 October 24, 2016 February 2017 1 AGENDA 1 DTC Goals and Expectations 2 Street Design Concepts 3 Potential Benefits and
Chapter 7. Transportation. Transportation Road Network Plan Transit Cyclists Pedestrians Multi-Use and Equestrian Trails
 Chapter 7 Transportation Transportation Road Network Plan Transit Cyclists Pedestrians Multi-Use and Equestrian Trails 7.1 TRANSPORTATION BACKGROUND The District of Maple Ridge faces a number of unique
METRO RTA TRANSIT MASTER PLAN. May 25-26, 2011
 METRO RTA TRANSIT MASTER PLAN May 25-26, 2011 WHAT IS THE TRANSIT MASTER PLAN? A twenty-year plan for METRO RTA What will METRO look like in 2031? 1 TRANSIT TECHNOLOGIES 2 TRANSIT TECHNOLOGIES Transit
City of Wayzata Comprehensive Plan 2030 Transportation Chapter: Appendix A
 A1. Functional Classification Table A-1 illustrates the Metropolitan Council s detailed criteria established for the functional classification of roadways within the Twin Cities Metropolitan Area. Table
Regional Transportation Needs Within Southeastern Wisconsin
 Regional Transportation Needs Within Southeastern Wisconsin #118274 May 24, 2006 1 Introduction The Southeastern Wisconsin Regional Planning Commission (SEWRPC) is the official areawide planning agency
Highway 111 Corridor Study
 Highway 111 Corridor Study June, 2009 LINCOLN CO. HWY 111 CORRIDOR STUDY Draft Study Tea, South Dakota Prepared for City of Tea Sioux Falls Metropolitan Planning Organization Prepared by HDR Engineering,
Appendix A-K Public Information Centre 2 Materials
 Appendix A-K Public Information Centre 2 Materials Our Rapid Transit Initiative Make an impact on the future of transit Join the discussion on Rapid Transit in London You re invited to a Public Information
Proposed White Flint Separated Bike Lane Network September 2015
 Proposed White Flint Separated Bike Lane Network September 2015 Abstract This report includes a proposed separated bike lane network for the White Flint Sector Plan area. Separated bike lanes create a
WHITE PAPER: TRANSIT SERVICE FOR SOUTH SHAGANAPPI
 9/27/2012 TRANSIT PLANNING WHITE PAPER: TRANSIT SERVICE FOR SOUTH SHAGANAPPI 2012 Calgary Transit 1 Table of Contents Purpose... 3 Area of Change... 3 Background... 3 Access to destinations... 5 Connecting
APPENDIX 2 LAKESHORE ROAD TRANSPORTATION REVIEW STUDY EXECUTIVE SUMMARY
 APPENDIX 2 LAKESHORE ROAD TRANSPORTATION REVIEW STUDY EXECUTIVE SUMMARY Appendix 2 City of Mississauga Lakeshore Road FINAL REPORT Transportation Review Study December 2010 EXECUTIVE SUMMARY Study Purpose
Circulation in Elk Grove includes: Motor vehicles, including cars and trucks
 Circulation, as it is used in this General Plan, refers to the many ways people and goods move from place to place in Elk Grove and the region. Circulation in Elk Grove includes: Motor vehicles, including
Interim Transit Ridership Forecast Results Technical Memorandum
 Interim Transit Ridership 401 South Jackson Street Seattle, WA 98104-2826 September 2012 Table of Contents 1 INTRODUCTION... 1-1 1.1 Project Background... 1-1 2 RIDERSHIP FORECASTS... 2-1 2.1 System Ridership
University Hill Transportation Study Technical Memorandum Alternatives Modeling and Analysis May 2007
 Technical Memorandum May 2007 Syracuse Metropolitan Transportation Council Edwards and Kelcey with Wallace Roberts and Todd Alta Planning and Design CONTENTS SECTION ONE- INTRODUCTION...1 SECTION TWO-
Arterial Transitway Corridors Study
 Arterial Transitway Corridors Study April 2012 Prepared by with SRF Consulting Group, Inc. Kimley-Horn and Associates, Inc. Connetics Transportation Group Luken Architecture CR Planning April 2012 Final
Midtown Corridor Alternatives Analysis
 Midtown Corridor Alternatives Analysis Ridership Forecast Methodology and Results December 2013 Prepared by the SRF Consulting Group Team for Table of Contents Introduction... 1 Methodology... 1 Assumptions...
US 29 Bus Rapid Transit Corridor Planning Study FINAL. Corridor Study Report From Silver Spring Transit Center. April 2017
 US 29 Bus Rapid Transit Corridor Planning Study Corridor Study Report From Silver Spring Transit Center to Burtonsville Park and Ride FINAL April 2017 APRIL 2017 Table of Contents page Executive Summary...
MONTGOMERY COUNTY PLANNING DEPARTMENT THE MARYLAND-NATIONAL CAPITAL PARK AND PLANNING COMMISSION
 MONTGOMERY COUNTY PLANNING DEPARTMENT THE MARYLAND-NATIONAL CAPITAL PARK AND PLANNING COMMISSION MCPB Item No. 4 Date: 04-17-14 2014 Mobility Assessment Report José Dory, Senior Planner, Functional Planning
Basalt Creek Transportation Refinement Plan Recommendations
 Basalt Creek Transportation Refinement Plan Recommendations Introduction The Basalt Creek transportation planning effort analyzed future transportation conditions and evaluated alternative strategies for
Arterial Transitway Corridors Study. Sept. 26, 2011
 Arterial Transitway Corridors Study Sept. 26, 2011 Purpose of Study Study 11 urban corridors in Minneapolis, St. Paul and surrounding communities Develop service and facilities plan to improve Transit
Integrated Corridor Approach to Urban Transport. O.P. Agarwal World Bank Presentation at CODATU XV Addis Ababa, 25 th October 2012
 Integrated Corridor Approach to Urban Transport O.P. Agarwal World Bank Presentation at CODATU XV Addis Ababa, 25 th October 2012 What is the Integrated Corridor Approach for Urban Transport Public? Why
4. ENVIRONMENTAL IMPACT ANALYSIS 9. TRANSPORTATION AND TRAFFIC
 4. ENVIRONMENTAL IMPACT ANALYSIS 9. TRANSPORTATION AND TRAFFIC 4.9.1 INTRODUCTION The following section addresses the Proposed Project s impact on transportation and traffic based on the Traffic Study
Bus Rapid Transit ALTERNATIVES ANALYSIS. Open House
 Bus Rapid Transit ALTERNATIVES ANALYSIS Open House June 23, 2015 Open House Meeting Agenda Agenda Introductions What is BRT? Project Goals Study Tasks Next steps Discussion PVTA Bus Rapid Transit Study
5. RUNNINGWAY GUIDELINES
 5. RUNNINGWAY GUIDELINES These guidelines should be considered collectively when making runningway decisions. A runningway is the linear component of the transit system that forms the right-of-way reserved
Aurora Corridor to E Line
 Aurora Corridor to E Line Jack Whisner Transit Planner, Service Development King County Metro Transit Seattle, Washington jack.whisner@kingcounty.gov 206-477-5847 King County Metro Transit Part of general
Topics To Be Covered. Summarize Tier 2 Council Direction Discuss Mill and Ash Alternatives Next Steps
 Topics To Be Covered Summarize Tier 2 Council Direction Discuss Mill and Ash Alternatives Next Steps Tier 2 Council Direction Dismiss Bus Rapid Transit along the Union Pacific Railroad Dismiss Bus Rapid
Evan Johnson, Tindale Oliver & Associates. Alan Danaher, P.E., PTOE, AICP, PTP
 To: Copies: From: Evan Johnson, Tindale Oliver & Associates Matt Muller, RTS Jesus Gomez, RTS Alan Danaher, P.E., PTOE, AICP, PTP Date: January 14, 2014 Subject: Ridership Projections Gainesville Streetcar
Active Transportation Facility Glossary
 Active Transportation Facility Glossary This document defines different active transportation facilities and suggests appropriate corridor types. Click on a facility type to jump to its definition. Bike
Technical Working Group November 15, 2017
 Technical Working Group November 15, 2017 Welcome and Introductions Project Partners Regional Transportation District (RTD) Colorado Department of Transportation (CDOT) Denver Regional Council of Governments
Ownership Lots 17 & 18 (Part of Lot 14), Montgomery Auto Sales Park
, Montgomery Auto Sales Park") Traffic Impact Analysis Ownership Lots 17 & 18 (Part of Lot 14), Montgomery Auto Sales Park Silver Spring, MD Lot 17: Site Plan No. 821413 Lot 18: Site Plan No. 821414 Filing Number: 13-TS-1198527A Prepared
Traffic Impact Analysis Ownership Lots 17 & 18 (Part of Lot 14), Montgomery Auto Sales Park Silver Spring, MD Lot 17: Site Plan No. 821413 Lot 18: Site Plan No. 821414 Filing Number: 13-TS-1198527A Prepared
Transportation Master Plan Advisory Task Force
 Transportation Master Plan Advisory Task Force Network Alternatives & Phasing Strategy February 2016 BACKGROUND Table of Contents BACKGROUND Purpose & Introduction 2 Linking the TMP to Key Council Approved
Cedar Avenue Transitway/ METRO Red Line Implementation Plan Update. Metropolitan Transportation Committee July 27, 2015
 Cedar Avenue Transitway/ METRO Red Line Implementation Plan Update Metropolitan Transportation Committee July 27, 2015 Purpose of Cedar Avenue Transitway Previous IPU August 2011 Review current transit
Sixth Line Development - Transit Facilities Plan
 Memorandum Date: November 13, 2012 To: From: c.c. Subject: Rob Freeman (Freeman Planning) Kevin Phillips Sixth Line Development - Transit Facilities Plan 33016631 This memo was prepared to review the transit
Chapter 4 Traffic Analysis
 Chapter 4 Traffic Analysis PURPOSE The traffic analysis component of the K-68 Corridor Management Plan incorporates information on the existing transportation network, such as traffic volumes and intersection
Wilshire Boulevard Bus Rapid Transit Project
 Los Angeles County Metropolitan Transportation Authority Wilshire Boulevard Bus Rapid Transit Project COMMUNITY MEETINGS November 2008 Agenda Introduction Proposed Project Overview Participating Agencies
TRAFFIC STUDY GUIDELINES Clarksville Street Department
 TRAFFIC STUDY GUIDELINES Clarksville Street Department 9/1/2009 Introduction Traffic studies are used to help the city determine potential impacts to the operation of the surrounding roadway network. Two
December For more information, call the Area 2 Division at (301)
") December 2013 Appendix B: Transportation Analysis For more information, call the Area 2 Division at (301) 495-4500 GLENMONT SECTOR PLAN TRANSPORTATION APPENDIX November 8, 2013 1 Contents Purpose Transportation
December 2013 Appendix B: Transportation Analysis For more information, call the Area 2 Division at (301) 495-4500 GLENMONT SECTOR PLAN TRANSPORTATION APPENDIX November 8, 2013 1 Contents Purpose Transportation
Having held a public hearing, that Council approve:
 3. MODIFICATIONS TO MERIVALE ROAD FROM FALLOWFIELD ROAD TO OLD HIGHWAY 16 TO ACCOMMODATE THE GROWTH WITHIN THE SOUTH MERIVALE BUSINESS PARK - PUBLIC HEARING COMMITTEE RECOMMENDATIONS Having held a public
Executive Summary Route 30 Corridor Master Plan
 Route Corridor Master Plan Project Overview The Route Corridor Master Plan is a coordinated multimodal transportation and land use plan for the entire stretch of Route through East Whiteland Township,
FY2006 Budget Board Budget Committee request for information. Board Request: Detailed information on bus route 5A DC-Dulless Airport
 Board Request: Detailed information on bus route 5A DC-Dulless Airport Tracking Number: 29 Assigned to Dept/Office: OPER Contact Person: Jim Hughes Metrobus Route 5A was established in December 2000 in
SANTA CLARA COUNTYWIDE BICYCLE PLAN August 2008
 SANTA CLARA COUNTYWIDE BICYCLE PLAN August 2008 To assist VTA and Member Agencies in the planning, development and programming of bicycle improvements in Santa Clara County. Vision Statement To establish,
VOLUME 5 Technology and Option Evaluation
 VICTORIA REGIONAL RAPID TRANSIT Victoria / West Shore Link VOLUME 5 Technology and Option Evaluation August 2011 Prepared for BC Transit by SNC-Lavalin Inc McElhanney Consulting Services Ltd Errata 1.
Understanding Rail and Bus Ridership
 Finance Committee Information Item III-A October 12, 2017 Understanding Rail and Bus Ridership Washington Metropolitan Area Transit Authority Board Action/Information Summary Action Information MEAD Number:
Highway 49, Highway 351 and Highway 91 Improvements Feasibility Study Craighead County
 Highway 49, Highway 351 and Highway 91 Improvements Feasibility Study Craighead County Executive Summary March 2015 Highway 49, Highway 351 and Highway 91 Improvements Feasibility Study Craighead County
Clackamas County Comprehensive Plan
 ROADWAYS The County s road system permits the movement of goods and people between communities and regions, using any of a variety of modes of travel. Roads provide access to virtually all property. They
Maryland State Highway Mobility Report. Morteza Tadayon
 Maryland State Highway Mobility Report Morteza Tadayon Background Mobility is a Key Performance Area (KPA) in the SHA Business Plan SHA adopts a performance based approach Monitors Highway System to identify
Complete Street Analysis of a Road Diet: Orange Grove Boulevard, Pasadena, CA
 Complete Street Analysis of a Road Diet: Orange Grove Boulevard, Pasadena, CA Aaron Elias, Bill Cisco Abstract As part of evaluating the feasibility of a road diet on Orange Grove Boulevard in Pasadena,
Scope of the Transit Priority Project
 Transit Planning Committee #1 March 19, 2015 Scope of the Transit Priority Project Review of the 2010 plan Analysis of Transit Priority Measures Preliminary plans for rapid transit Recommendations for
Corporate. Report COUNCIL DATE: June 26, 2006 NO: C012 COUNCIL-IN-COMMITTEE. TO: Mayor & Council DATE: June 22, 2006
 Corporate NO: C012 Report COUNCIL DATE: June 26, 2006 COUNCIL-IN-COMMITTEE TO: Mayor & Council DATE: June 22, 2006 FROM: General Manager, Engineering FILE: 0410-20(MoT/Gate) SUBJECT: Surrey Response on