Travel to Work Survey Report
|
|
|
- Buck Miller
- 5 years ago
- Views:
Transcription

1 2018 Travel Plan Plus Area Po Box No. SH1315 Travel to Work Survey Report Prepared For: St Mary s School Bateman Street Cambridge CB2 7EB Prepared by
2 Prepared For: Cambridge Science Park The Bradfield Centre 184 Cambridge Science Park Milton Road Cambridge CB4 0GA Cambridge Business Park Cowley Road Cambridge CB4 0WZ St John s Innovation Park Cowley Road Milton Cambridge CB4 0WS Author: Prajina Baisyet Our Ref: Date: 13/12/2018 Prepared By: Travel Plan Plus The Bradfield Centre 184 Cambridge Science Park Milton Road Cambridge CB4 0GA
3 TABLE OF CONTENTS 1.0 INTRODUCTION Methodology FACTS AND FIGURES FOR THE TP+ AREA MODAL SPLITS SURVEY FINDINGS Response Rate Commute Time Comparison between the Three Parks Alternative to Driving Alone and Prevention on Selected Mode ANALYSIS OF THE COMMENTS CONCLUSION Tables Table 1: 2011 Census Data for the UK and East of England versus TP+ Travel to Work 2018 Results for the TP+ Area Table 2: Comparison of the Travel to Work Survey Results for the TP+ Area from 2009 to 2018 Table 3: Comparison between Mode and the Three Parks within the TP+ Area for 2018 Figures Figure 1: Figure 2: Number of Responses for the TP+ Area Commute Time in Minutes for the TP+ Employees Appendices Appendix A Location of the TP+ Area Appendix B List of TP+ Participating Employers Appendix C TP+ Area 2018 Survey Results Appendix D Cambridge Science Park 2018 Survey Results Appendix E Cambridge Business Park 2018 Survey Results Appendix F St John s Innovation Park 2018 Survey Results Appendix G Weather View for the Survey Week 2018
4 1.0 INTRODUCTION Travel Plan Plus (TP+) asked employees about their journey to work from Saturday 6th October to Friday 12th October 2018, through its annual Travel to Work Survey. This is the eighteenth annual Travel for Cambridgeshire (TfC) survey and the tenth since Travel Plan Plus (TP+) was launched. Based on employee responses, the survey provides a snapshot of the way commuters travel to work in the TP+ area which includes businesses in the Cambridge Science Park (CSP), Cambridge Business Park (CBP) and St John s Innovation Park (SJIP). Refer to Appendix A for the location plan. This report provides an overall summary of results for the TP+ area, based on those organisations that participated. Specific individual reports have been issued to participating employers with their own results. Appendix B contains a full list of organisations that participated in the 2018 travel to work survey. Each year we report the total number of trips undertaken by employees getting to work during the survey week. These figures can be found in Section 3, Modal Splits, and in Appendix C. The figures are for all trips that were made during the survey week, Saturday to Friday. Further analysis on how each park performed is in Appendix D (CSP), Appendix E (CBP) and Appendix F (SJIP). Appendix C1 to F1 provides quantitative information, while Appendix C2 to F2 provides qualitative information on these questions: Would you consider an alternative to driving alone? Which of these modes would you consider as an alternative to driving alone? What is preventing you from cycling/train/guided bus/public bus and car sharing as ways to get to work? If we have a choice of transport, the weather obviously affects our decision-making. During the survey week, we had dry and warm weather, except on Sunday 7 th October when it was bit cooler. Appendix G outlines the weather data for the survey week. Please refer to Section 4 of the report, which details our interpretation of TP+ area results along with previous years. Respondent s comments are in Section 5. Section 6 provides the summary and key recommendations of the Travel to Work survey. If you have any questions or queries regarding these results, or the survey in general, please contact us. 1.1 Methodology The Travel to Work Survey recorded data relating to the way employees travelled to work from Saturday 6 th October to Friday 12 th October The survey was available online for two weeks (using a customised link) for employees to respond and it closed at midnight on Friday 26 th October The survey collected a total of 3,124 responses (2,192 from CSP, 538 from CBP and 394 from SJIP). Using an online survey allowed a greater level of detail on specific issues, without lengthening the survey for those who did not need to answer additional questions through filtering. In these instances, the size of the subset is calculated from a subset of number of respondents. The survey was promoted through a range of internal communication channels and direct correspondence. It should be noted that rounding to the nearest whole number is applied to all percentage results. This is done to obtain a value that is easier to report and communicate. 1
5 2.0 FACTS AND FIGURES FOR THE TP+ AREA 2018 The overall results for the TP+ area are shown in the table below, based on data from 2018 participating companies located in the TP+ area. The survey results are compared against the most upto-date UK and East of England travel to work data collated from the 2011 census. Table 1: 2011 Census Data for the UK and East of England versus TP+ Travel to Work 2018 Results for the TP+ Area England Travel to East of England TP+ Mode Work Statistics Travel to Work Travel to Work 2011* Statistics 2011* Statistics 2018 (%) (%) (%) Drive (Alone) Car Share ** Cycle Walk Motorbike Train Public Bus Home Working Other * Source: ** Car share (driver and non-driver) Below are the key summary points of the Travel to Work Survey for the TP+ area in 2018: 132 organisations from the TP+ area took part in the survey. 13 organisations and 3 parks heavily promoted the survey which generated 3,124 valid responses from employees in the TP+ area saw us achieve a participation rate of 31% for the TP+ area. This year, 6 organisations within the TP+ area (Astex Therapeutics, Broadcom, Cambridge Consultants, Frontier Developments, Qualcomm and Royal Society of Chemistry) achieved an excellent participation rate of over 5. 3 TP+ area employers achieved drive alone figures between 31% and 39% (Broadcom, Cambridge Consultants and Royal Society of Chemistry) which is excellent. 2 companies (Broadcom and Ricardo) demonstrated zero number of employees driving less than 2 miles which is outstanding to report. 283 employees are driving alone and covering a distance of less than 2 miles. 34% of the employees live within a 10.1 to 20 miles from work. The average distance travelled to work is 17 miles, which has decreased by 3% from 20 miles in
6 3.0 MODAL SPLITS (5 days Monday 8 th October to Friday 12 th October 2018) Table 2 below compares the TP+ area results by main mode, the average number of trips in percentage by each mode, Monday to Friday, for the last 10 years. Table 2: Comparison of the Travel to Work Survey Results for the TP+ Area from 2009 to 2018 Mode Drive Alone 58% 52% 5 51% 54% 54% 52% 54% 48% 49% Car Share (Driver) Car Share (Non Driver) 1 8% 1 1 8% 9% 11% 8% 5% 4% % 3% Cycle 17% 23% 23% 22% 21% 22% 23% 25% 22% 24% Walk 4% 7% 5% 5% 4% 5% 5% 4% 6% 5% Motorbike 1% 1% 1% 1% 1% 1% 1% 1% 1% 1% Train 1% 2% 2% 2% 2% 1% 1% 1% 4% 3% Public Bus 3% 2% 3% 4% 4% 5% 4% 4% 1% 1% Guided Bus % 2% Company Shuttle Bus Taxi Aircraft Worked at Home 2% 3% 2% 3% 2% 3% 2% 3% 4% 3% Off Work % 5% Number of one way journeys recorded by all modes Participation (no of respondents as a percentage of total staff) 7,399 5,885 7,841 5,913 12,125 10,481 10,988 6,409 13,125 15,601 21% 17% 29% 17% 46% 35% 36% 44% 37% 31% The Saturday and Sunday results can be found in Appendix C1 which includes the full set of results for those employees who took part in the survey. 3
7 Number of Responses 4.0 SURVEY FINDINGS 4.1 Response Rate The response rate for the TP+ area has increased steadily since 2017 although the percentage does not reflect this as the total number of employees on the park has increased. This year, the TP+ area had a total response rate of 3,124 as shown in Figure 1. Since the survey recording began for the TP+ area in 2009, the participation rate has almost doubled. 3,000 Figure 1: Number of Responses for the TP+ Area 2,500 2,000 1,500 1, Year 4.2 Commute Time Respondents were asked how long their commute to work takes on a normal day and the results are shown in Figure 2. For the majority of employees, the commute time is between 21 to 40 minutes and this has been the case for several years. Employees who commute less than 20 minutes has increased from 28% in 2017 to 29%. For those whose commute time is between 61 to 90 minutes, the percentage of those employees who fall into this category is increasing steadily from 9% in 2017 to 1. However, there is a small percentage (3%) of employees who are travelling 91+ minutes to get to work. 4
8 Percentage 4 Figure 2: Commute Time in Minutes for the TP+ Employees 35% 3 25% 2 15% 1 <20 21 to to to % Year 4.3 Comparison between the Three Parks The participation rate was good from the CSP at 31%, from the CBP at 34% and from the SJIP at 25%. This is the first year SJIP has been involved in our Travel to Work survey (refer to Table 3). Full calculations are in Appendix D, E and F. Table 3: Comparison between Mode and the Three Parks within the TP+ Area for 2018 Mode Cambridge Science Park Cambridge Business Park St John's Innovation Park Drive Alone 48% 48% 56% Car Share (Driver) 4% 4% 4% Car Share (Non Driver) 3% 2% 2% Cycle 23% 26% 25% Walk 6% 5% 2% Motorbike 1% 1% 1% Train 3% 4% 1% Public Bus 1% 2% 1% Guided Bus 2% 2% 1% Company Shuttle Bus Taxi Aircraft Worked at Home 3% 3% 4% Off Work 5% 4% 4% Participation (no of respondents as a percentage of total staff) 31% 34% 25% 5
9 Drive Alone Drive alone figures for CSP and CBP are at 48%, while the figure for the SJIP is extremely high at 56%. Compared to the previous year, there has been no change in the drive alone figure for CSP from 48%. However, for CBP there has been an increase in the drive alone figure from 47% to 48%. Within the TP+ area, of the single occupancy car drivers (49%), 4% (283) are driving less than 2 miles to work. There is potential to convert this cohort to walking or cycling to work instead. 9% (697) are driving between 2.1 and 5 miles to work and there is potential to convert this cohort to cycling, using public transport, or car sharing with their colleagues. When asked, What fuel type did the vehicle you travelled in use? 39% (1,226) said petrol and 31% (977) said diesel were the two main fuel types. 2% (58) used a hybrid vehicle while 1% (26) used an electric vehicle. An additional question asked employees, Are you considering an electric vehicle in the next 12 months?. 83% (2,590) said No, 16% (497) said Yes and 1% (37) said I already use an electric vehicle. When asked, Did you use the Park & Ride (P&R) last week?, 2% (51) answered Yes to this section. Respondents mentioned the following P&R sites: St Ives (19), Trumpington (9), Longstanton (13), Milton (5), Madingley (3), Newmarket (1) and Swavesey (1). Car Share Car sharing (driver) is at 4% for all three parks, while the car share as non-driver is very similar across the three parks (3% at CSP, 2% at CBP and 2% at SJIP). Cycling Cycling levels are similar across the three parks, ranging from 23% at CSP to 26% at CBP, while the TP+ area average is 24% (3,737). Walking Walking levels are extremely different for the three parks. 6% of the employees walk at CSP, 5% of the employees walk at CBP and only 2% of the employees walk at SJIP. Motorbike A small percentage (1%) of the employees from all three parks indicated that they use a motorbike to get to work. This figure has remained static over the last 10 years (refer to Table 2). Train Train use within the TP+ area is at 3% which has decreased by 1% from More employees from the CSP (3%) and CBP (4%) use the trains, compared to 1% of employees at SJIP. When asked, Which of these stations was your final destination to work last week?, 5% (170) responded Cambridge North Station (CNS) while only 1% (25) responded Cambridge Main Station (CMS). Those who mentioned Other mostly said London Kings Cross, London Liverpool Street, and London Bridge. When asked, How did you get from CNS or CMS to your place of work?, 4% (125) respondents said walk and 2% (72) respondents said own cycle. 6
10 When asked, Have you purchased a rail season ticket with TP+ 1 discount?, 1% (42) responded Yes. When asked, which of these smart cards have you used, 7% (211) responded I wasn t aware of these smart cards. Public Bus and Guided Bus Public bus use is at 1% for the TP+ area average while the guided bus use is at 2% which has decreased by 1%. When asked, Which of these smart cards have you used?, 4% (117) responded Stagecoach smart card and 3% (92) said I wasn t aware of these cards. Worked at Home Worked at home figures were at 3% for CSP and CBP, while this was slightly higher for those who worked at SJIP (4%). Over the years, worked at home figures have been within the range of 2% to 4%. Off Work For respondents who indicated they were off work during the survey week, the figure this year remained the same as last year at 5%. 4.4 Alternative to Driving Alone and Prevention on Selected Mode When asked, Would you consider an alternative to driving alone?, 37% (1,168) said Yes. The highest percentage of respondents said they would consider car share at 2 (614), cycle at 16% (492), train at 11% (344), guided bus at 9% (274) and public bus at 6% (199) as an alternative to driving alone. Some were happy to walk to work as an alternative to driving alone. When asked, What is preventing you from cycling to work?, weather conditions at 7% (206), takes too long at 4% (130) and cycle route is dangerous at 4% (126) were three common responses. Some of the comments from the TP+ area were: I don t have a bike yet, other commitments after work to get to, school drop-off on the way / pick-up on the way home, can t carry everything required on a bike, cycle route is dark during the winter, bike was stolen, can t afford to replace it and cycle broken. When asked, What is preventing you from travelling by train today?, 4% (137) said journey time longer than driving, 4% (131) responded costs more than driving and 3% (92) said cost of railway tickets are too expensive. Some of the comments from the TP+ area were: train services are very unreliable, there is no satisfactory connection from Cambridge North to Science Park, distance of CNS to CSP, adds extra time to my journey. When asked, What is preventing you from travelling to work on the guided bus?, 1% (41) responded I live too far away from the Busway, 1% (32) also responded too expensive compared to driving and 1% (18) responded services not frequent enough. Some of the comments received for the TP+ area were: the guided bus is too expensive for how unreliable it is, no direct bus, so quicker to drive and infrequent and unreliable service. Full most mornings. However, when asked What is preventing you from travelling to work on a public bus?, 1% (24) responded services not frequent enough. The main comment from the TP+ area is that there is no direct service to CSP, CBP and SJIP. When asked, What is preventing you from car sharing?, 5% (154) responded, I don t know anybody to car share with and 4% (121) responded I work irregular hours. Many commented that I already car share, nobody seems to travel from where I live, and childcare/school run responsibilities. 7
11 5.0 ANALYSIS OF THE COMMENTS Of the 3,124 respondents who took part in the survey, we had a total of 1,383 comments from the employees. A selection of some of the common comments are shown below: Driving Alone Lack of reliable public transport near my home prevents me from using it as driving is convenient. If buses were more readily available I would take the train from Ely more frequently. I do nursery drop off/pick up, which is a large reason I drive. Otherwise, I would probably take the train from Royston. Car Sharing I have child care arrangements at home to sort out before and after work so car sharing is difficult to coordinate. Likewise a bus or public transport would take too long. Cycling I cycle down the guided busway path; which is great. When this path floods however in winter that can mean me being forced to drive for a number of weeks. More segregated cycle lanes make cycling easier and more attractive. My cycle is done with an ebike. I would take the bus more, but it is ludicrously expensive, unreliable, and it's unpleasant to be jammed in like a sardine! I cycle to work most days, unless I need to go to the supermarket/doctors/or go shopping after work or go somewhere directly after work, in which case I will drive. Using the bicycle is the only reliable way of transport for me. It takes me ~30mins. Walking Walking 2.6 miles each way is the fastest route as there is no direct bus route from Cambridge airport to the Science Park. Train Trains between CMS and CNS have terrible timing in the morning. My train arrives at Main about 7.40ish, missing the 7.35 Kings Lynn (unless it's late) meaning I'd have to wait until 8.05 for the next train that stops at CNS. (I can be sat at my desk by then if I cycle in from CMS). Cambridge Main station is terrible for commuters traveling on to Cambridge North station. Train travel is too expensive it s cheaper to drive. Great Northern trains are not reliable. Frequently late and too often cancelled. 8
12 The travel plan plus discount is a huge help with the incredibly expensive annual season ticket that allows me to work in Cambridge. Public Bus It would be good if there was a direct bus service to the Cambridge Science Park from where I commute to work. Far too expensive and irregular, slow service. Years ago there used to be a direct bus from Newmarket to Cambridge via Science Park. If that existed then I would happily use it occasionally but having to change in the city makes the bus journey too long. Guided Bus There are insufficient buses during peak times, with passengers being crammed on to the point of it being unsafe. Minor traffic issues upset the whole timetable, with buses sometimes not arriving. The guided busway for the last 4 months has been very unreliable. Buses do not turn up at all even though they are on the automatic schedule and app. The have also cut a lot of the buses in the evening with only 1 or 2 buses an hour going into the city after 6pm when a lot of people work until 6pm. The buses are not scheduled in time for CNS trains. The unreliable service and the lack of scheduled buses at sensible times i.e. no bus at 6.10pm to take people back to the city is making people consider driving to work. In the last 6 MONTHS THE SERVICE ON BOTH A and B buses has significantly deteriorated. Buses are less frequent, always full to capacity or don't turn up at all. I catch the bus at St Ives Park and Ride and several times the buses have driven straight past us, already full. The poor folks who rely on the buses beyond this stop have no chance of a seat and often just watch buses driving past full. In order to be a reliable rush hour commute there should be a bus at least every 5 mins. Milton Road / Cowley Road The longest part of my journey is queuing to get onto Milton Road.. About 1/3 of my journey to work is waiting to cross from Cowley Road to the Science Park. Travelling home is annoying because of the amount of traffic on Cowley Road. The cars at the top of the road don't let you out, meaning that only two or three cars go when the lights turn green. A14 It's getting more difficult to get to work on time with the A14 getting worse. The traffic is awful. The A14 ruins my life. Most of my traffic issues are caused by roadworks on the A14. In summary, those who drive alone do so because of nursery/childcare/school run pickup and dropoffs on the way into or after work. Those who can car share are doing so, but for those who are unable to, this is because of childcare responsibilities or due to other commitments after work. It seems that those who have been commuting by train have been severely affected by the major timetable change 9
13 in May and further amendments in July this year. This has had a major impact on people s journey and unreliable services has reverted them back to driving alone. With the guided bus, it seems the service has significantly deteriorated in the last few months with fewer bus services which have been running at full capacity during peak hours. There are major congestion issues along Milton Road and Cowley Road, mostly in the afternoons, and major road works until 2020 on the A14 does not help, as this has led to longer journey times. 10
14 6.0 CONCLUSION In conclusion, below is a summary and key recommendations of the Travel to Work survey results for Overall participation levels for the TP+ area was good at 31%. There is a need to work alongside businesses and encourage as many employers from the CSP, CBP and SJIP to take part in our annual Travel to Work survey to obtain a better understanding of how employees travel to work each year. The drive alone figure has increased from 48% in 2017 to 49% this year. Work closely with all three parks to encourage 283 employees (4%) to adopt more active travel (walking and cycling) and to change the behaviours of those who live less than 2 miles from CSP, CBP and SJIP. Promote key messages such as it is quicker to walk than to wait for public transport and walking or cycling will make you more active, fitter and stress free while at work. Work closely with all three parks to encourage 697 employees (9%) to consider cycling, car sharing or using public transport to get to work and to change the behaviours of those who live within 2.1 to 5 miles of CSP, CBP and SJIP. Discourage driving alone where possible and encourage sustainable modes. Encourage all three parks to plot employees home postcodes to locate possible car share matches to the park, or across the three parks. Ensure employers across the three parks are aware of the 1 train travel discount available on season tickets and the potential cost savings by using the train. To relieve some of the congestion around the CSP and SJIP routes onto Milton Road and Cowley Road, work closely with all three parks to encourage employees to park their cars at Milton Park & Ride and walk, or use their own cycle or bike hire, or use the Milton Park & Ride bus to get to their place of work. Work with all three parks to encourage employers to allow some flexible working, i.e. working one day from home if possible, allowing an early start and an early finish, or allowing a late start and late finish. This would reduce the number of employees travelling onsite and create a better work life balance for employees. Where feasible, action some of the comments provided by employees (1,383) by working closely with the local authorities and operators such as Stagecoach, Greater Anglia and Great Northern. Implementing even one of these recommendations above will create less congestion on our roads, especially during peak hour rush and reduce unnecessary impacts on our environment. 11
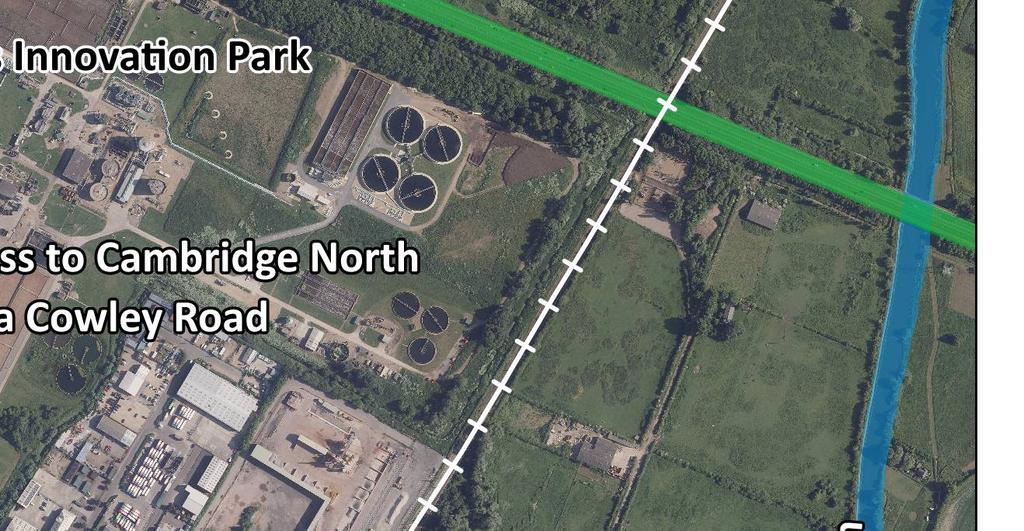
15 Appendix A - Location of the TP+ Area


16
17 Appendix B - List of TP+ Participating Employers Cambridge Science Park Astex Therapeutics Ltd Broadcom Cambridge Consultants Frontier Developments Napp/Bard/Mundipharma Group Riccardo Royal Society of Chemistry Cambridge Business Park Redgate Software Qualcomm St John s Innovation Park St John s Innovation Centre
18 Appendix C - TP+ Area 2018 Survey Results
19 Appendix C1 - Employer Results Reporting area Number of respondents Percentage of workforce (CSP base = 7,000; CBP base = 1,600 & SJIP base = 1,600 employees) Number of one way journeys recorded by all modes Monday - Friday Number of one way journeys recorded by all modes Saturday - Sunday Average number of trips per respondent Monday - Friday Average distance travelled (miles) Travel Plan Plus Area Cambridge Science Park, Cambridge Business Park & St John's Innovation Park % Longest distance travelled by mode (miles) Shortest distance travelled by mode (miles) Average distance travelled by mode (miles) Aircraft Cycle Drive Alone Car Share (Driver) Car Share (Non Driver) Cycle Walk/Run Motorbike Train Public Bus Guided Bus Company Shuttle Bus Taxi Aircraft Worked at Home Off Work Less than 2 miles 283 4% miles 697 9% Drive alone - number and percentage of respondents and distance miles % miles % miles % miles More than 40 miles %
20 Drive Alone % 8227 Car Share (Driver) 613 4% Car Share (Non Driver) 428 3% Cycle % Walk/Run 815 5% Average number of trips and percentage by each mode Monday - Friday Motorbike 149 1% Train 501 3% Public Bus 150 1% Guided Bus 342 2% Company Shuttle Bus 0 Taxi 22 Aircraft 7 Worked at Home 517 3% Off Work 706 5% Drive Alone 119 2% 151 Car Share (Driver) 32 1% Car Share (Non Driver) 11 Cycle 79 1% Walk/Run 48 1% Motorbike 4 Average number of trips and percentage by each mode Saturday - Sunday Train 12 Public Bus 6 Guided Bus 7 Company Shuttle Bus 0 Taxi 0 Aircraft 1 Worked at Home 18 Off Work %
21 Appendix C2 - Additional Analysis Drivers or Passengers Responses 1. Did you use the Park & Ride last week? 2. What fuel type did the vehicle you travelled in use? Measures Petrol Diesel Liquefied Petroleum Gas (LPG) Compressed Natural Gas (CNG) Electric Responses Yes 51 2% No % Yes % No % Yes % No % Yes 4 No Yes 0 No Yes 26 1% No % Hybrid 3. If you were a car driver, are you considering an electric vehicle in the next 12 months? 4. Would you consider an alternative to driving alone? Yes 58 2% No % Yes % No % I already use an electric 37 1% Yes % 5. Which of these modes would you consider as an alternative to driving alone? Cycle Train Guided Bus Public Bus Car Share No % Yes % No % Yes % No % Yes 274 9% No % Yes 199 6% No % Yes No Walk; Run; Cycle; Motorcycle
22 6. What is preventing you from cycling to work today? 7. What is preventing you from travelling by train today? Takes too long Cycle route is dangerous Waiting for the Chisholm Trail to open Weather conditions No railway station near my home Journey time longer than driving Costs more than driving Lack of flexibility e.g. I have to drop children at school/go out after work Infrequent services Parking at my railway station is too expensive Yes 130 4% No % Yes 126 4% No % Yes 24 1% No % Yes 206 7% No % I don't have a bike; Health conditions; Personal commitments. Yes 73 2% No % Yes 137 4% No % Yes 131 4% No % Yes 74 2% No % Yes 74 2% No % Yes 39 1% No % 8. What is preventing you from travelling to work on the guided bus today? Cost of railway tickets are too expensive I live too far away from the Busway Services not frequent enough Too expensive compared to driving I can't get on the bus because its full Yes 92 3% No % No direct route; Train too crowded; Train services are very unreliable. Yes 41 1% No % Yes 18 1% No % Yes 32 1% No % Yes 12 No No direct bus; Convenience; There is no direct guide bus from home to work.
23 9. What is preventing you from travelling to work on the public bus today? I live too far away from a bus stop Services not frequent enough Too expensive compared to driving I can't get on the bus because its full 10. What is preventing you from car sharing today? I don't know anybody to car share with I work irregular hours Yes 7 No Yes 24 1% No % Yes 9 No Yes 1 No There is no direct service; It takes too long. Yes 154 5% No % Yes 121 4% No % Rail Section Responses 11. Did you travel by rail any day last week? Safety issues Yes 4 No I already car share; Family responsibilities; Inconvienience. Yes 223 7% 12. Have you purchased a rail season ticket with Travel Plan Plus 1 discount? No % Yes 42 1% 13. Which of these stations was your final destination to work last week? Cambridge North Station Cambridge Main Station No % Yes 170 5% No % Yes 25 1% No % London Kings Cross; London Lime St; London Liverpool St; London St Pancras
24 14. How did you get from Cambridge North or Main stations to your place of work? Walk Own Cycle Shared Cycle Scheme Public Bus Guided Bus Company Shuttle Bus Taxi Yes 125 4% No % Yes 72 2% No % Yes 1 No Yes 7 No Yes 8 No Yes 1 No Yes 6 No Which of these smart cards have you used? Yes 10 Drive Alone No Greater Anglia 14 Key smart cards 5 I wasn't aware of these smart cards 211 Not applicable % 7% Bus Section Responses 16. Did you travel by bus any day last week? Yes 223 7% No % 17. Which of these smart cards have you used? Stagecoach smart card 117 4% Busway smart card 19 1% I wasn't aware of these cards 92 3% Not applicable %
25 Appendix D - Cambridge Science Park 2018 Survey Results
26 Appendix D1 - Employer Results Reporting area Number of respondents Percentage of workforce (base = 7,000 employees) Number of one way journeys recorded by all modes Monday - Friday Number of one way journeys recorded by all modes Saturday - Sunday Average number of trips per respondent Monday - Friday Average distance travelled (miles) Cambridge Science Park CSP % Longest distance travelled by mode (miles) Shortest distance travelled by mode (miles) Average distance travelled by mode (miles) Aircraft Cycle Drive Alone Car Share (Driver) Car Share (Non Driver) Cycle Walk/Run Motorbike Train Public Bus Guided Bus Company Shuttle Bus Taxi Aircraft Worked at Home Off Work Less than 2 miles 122 4% miles 286 9% Drive alone - number and percentage of respondents and distance miles % miles % miles % miles More than 40 miles %
27 Drive Alone % 5652 Car Share (Driver) 445 4% Car Share (Non Driver) 340 3% Cycle % Walk/Run 639 6% Average number of trips and percentage by each mode Monday - Friday Motorbike 119 1% Train 378 3% Public Bus 90 1% Guided Bus 273 2% Company Shuttle Bus 0 Taxi 14 Aircraft 5 Worked at Home 361 3% Off Work 532 5% Drive Alone 88 2% 109 Car Share (Driver) 21 Car Share (Non Driver) 6 Cycle 45 1% Walk/Run 36 1% Motorbike 2 Average number of trips and percentage by each mode Saturday - Sunday Train 6 Public Bus 3 Guided Bus 7 Company Shuttle Bus 0 Taxi 0 Aircraft 0 Worked at Home 13 Off Work %
28 Appendix D2 - Additional Analysis Drivers or Passengers Responses 1. Did you use the Park & Ride last week? 2. What fuel type did the vehicle you travelled in use? Measures Petrol Diesel Liquefied Petroleum Gas (LPG) Compressed Natural Gas (CNG) Electric Responses Yes 37 2% No % Yes % No % Yes % No % Yes 4 No Yes 0 No Yes 21 1% No % 3. If you were a car driver, are you considering an electric vehicle in the next 12 months? 4. Would you consider an alternative to driving alone? Hybrid Yes 40 2% No % Yes % No % I already use an electric vehicle 31 1% Yes % 5. Which of these modes would you consider as an alternative to driving alone? Cycle Train Guided Bus Public Bus Car Share No % Yes % No % Yes % No % Yes 202 9% No % Yes 140 6% No % Yes % No % Walk; Cycle
29 6. What is preventing you from cycling to work today? 7. What is preventing you from travelling by train today? Takes too long Cycle route is dangerous Waiting for the Chisholm Trail to open No dedicated cycle lane on the Cambridge Science Park Weather conditions No railway station near my home Journey time longer than driving Costs more than driving Lack of flexibility e.g. I have to drop children at school/go out after work Infrequent services Parking at my railway station is too expensive Yes 95 4% No % Yes 95 4% No % Yes 15 1% No % Yes 41 2% No % Yes 139 6% No % Health conditions; Need to take packages home; No bike Yes 54 2% No % Yes 104 5% No % Yes 104 5% No % Yes 56 3% No % Yes 61 3% No % Yes 28 1% No % 8. What is preventing you from travelling to work on the guided bus today? Cost of railway tickets are too expensive I live too far away from the Busway Services not frequent enough Too expensive compared to driving I can't get on the bus because its full Yes 71 3% No % The trains are unreliable; Train too crowded; Poor connection with bus services Yes 38 2% No % Yes 17 1% No % Yes 23 1% No % Yes 9 No Lack of flexibility - service doesn't run long enough; No direct route; Drop child off
30 9. What is preventing you from travelling to work on the public bus today? I live too far away from a bus stop Services not frequent enough Too expensive compared to driving I can't get on the bus because its full 10. What is preventing you from car sharing today? I don't know anybody to car share with I work irregular hours Yes 4 No Yes 14 1% No % Yes 4 No Yes 0 No No direct bus service; It takes too long Yes 122 6% No % Yes 98 4% No % Rail Section Responses 11. Did you travel by rail any day last week? Safety issues Yes 4 No I already car share; Need to travel straight to nursery; Inconvenience Yes 157 7% 12. Have you purchased a rail season ticket with Travel Plan Plus 1 discount? No % Yes 29 1% 13. Which of these stations was your final destination to work last week? Cambridge North Station Cambridge Main Station No % Yes 118 5% No % Yes 16 1% No % London Kings Cross; London Liverpool St; Green Park; Huntingdon
31 14. How did you get from Cambridge North or Main stations to your place of work? CSP Taxi/Shuttle Walk Own Cycle Shared Cycle Scheme Public Bus Guided Bus Company Shuttle Bus Taxi Yes 15 1% No % Yes 77 4% No % Yes 57 3% No % Yes 1 No Yes 6 No Yes 7 No Yes 1 No Yes 6 No Which of these smart cards have you used? Yes 7 Drive Alone No Greater Anglia 11 1% Key smart cards 2 I wasn't aware of these smart cards 148 Not applicable % 7% Bus Section Responses 16. Did you travel by bus any day last week? Yes 165 8% No % 17. Which of these smart cards have you used? Stagecoach smart card 88 4% Busway smart card 14 1% I wasn't aware of these cards 67 3% Not applicable %
32 Appendix E - Cambridge Business Park 2018 Survey Results
33 Appendix E1 - Employer Results Reporting area Number of respondents Percentage of workforce (base = 1,600 employees) Number of one way journeys recorded by all modes Monday - Friday Number of one way journeys recorded by all modes Saturday - Sunday Average number of trips per respondent Monday - Friday Average distance travelled (miles) Cambridge Business Park CBP % Longest distance travelled by mode (miles) Shortest distance travelled by mode (miles) Average distance travelled by mode (miles) Drive Alone Cycle Drive Alone Car Share (Driver) Car Share (Non Driver) Cycle Walk/Run Motorbike Train Public Bus Guided Bus Company Shuttle Bus Taxi Aircraft Worked at Home Off Work Less than 2 miles 28 4% miles 80 12% Drive alone - number and percentage of respondents and distance miles % miles % miles % miles 60 9% More than 40 miles 78 12%
34 Drive Alone % 1393 Car Share (Driver) 95 4% Car Share (Non Driver) 53 2% Cycle % Walk/Run 131 5% Average number of trips and percentage by each mode Monday - Friday Motorbike 20 1% Train 108 4% Public Bus 47 2% Guided Bus 46 2% Company Shuttle Bus 0 Taxi 4 Aircraft 2 Worked at Home 75 3% Off Work 96 4% Drive Alone 13 1% 24 Car Share (Driver) 11 1% Car Share (Non Driver) 2 Cycle 21 2% Walk/Run 8 1% Motorbike 0 Average number of trips and percentage by each mode Saturday - Sunday Train 6 1% Public Bus 3 Guided Bus 0 Company Shuttle Bus 0 Taxi 0 Aircraft 1 Worked at Home 3 Off Work %
35 Appendix E2 - Additional Analysis Drivers or Passengers Responses 1. Did you use the Park & Ride last week? 2. What fuel type did the vehicle you travelled in use? Measures Petrol Diesel Liquefied Petroleum Gas (LPG) Compressed Natural Gas (CNG) Electric Responses Yes 10 2% No % Yes % No % Yes % No % Yes 0 No Yes 0 No Yes 4 1% No % Hybrid 3. If you were a car driver, are you considering an electric vehicle in the next 12 months? 4. Would you consider an alternative to driving alone? Yes 10 2% No % Yes 97 18% No % I already use an electric 4 1% Yes % 5. Which of these modes would you consider as an alternative to driving alone? Cycle Train Guided Bus Public Bus Car Share No % Yes 78 14% No % Yes 36 7% No % Yes 29 5% No % Yes 20 4% No % Yes 48 9% No % Walk; Motorcycle; I already car share
36 6. What is preventing you from cycling to work today? 7. What is preventing you from travelling by train today? Takes too long Cycle route is dangerous Waiting for the Chisholm Trail to open Weather conditions No railway station near my home Journey time longer than driving Costs more than driving Lack of flexibility e.g. I have to drop children at school/go out after work Infrequent services Parking at my railway station is too expensive Yes 17 3% No % Yes 14 3% No % Yes 3 1% No % Yes 35 7% No % Broken bike; I don't have a bike; Security of bicycle parking at work; School run Yes 9 2% No % Yes 11 2% No % Yes 11 2% No % Yes 9 2% No % Yes 7 1% No % Yes 4 1% No % 8. What is preventing you from travelling to work on the guided bus today? Cost of railway tickets are too expensive I live too far away from the Busway Services not frequent enough Too expensive compared to driving I can't get on the bus because its full Yes 7 1% No % No direct train; Train not stopping in Cambridge North Yes 0 No Yes 1 No Yes 4 1% No % Yes 1 No Infrequent and unreliable service. Full most mornings.
37 9. What is preventing you from travelling to work on the public bus today? I live too far away from a bus stop Services not frequent enough Too expensive compared to driving I can't get on the bus because its full 10. What is preventing you from car sharing today? I don't know anybody to car share with I work irregular hours Yes 1 No Yes 3 1% No % Yes 1 No Yes 0 No There is no bus to take me to work. Yes 9 2% No % Yes 10 2% No % Rail Section Responses 11. Did you travel by rail any day last week? Safety issues Yes 0 No I already car share, but would do so with more people. Yes 49 9% 12. Have you purchased a rail season ticket with Travel Plan Plus 1 discount? No % Yes 13 2% 13. Which of these stations was your final destination to work last week? 14. How did you get from Cambridge North or Main stations to your place of work? Cambridge North Station Cambridge Main Station Walk Own Cycle Shared Cycle Scheme Public Bus Guided Bus No % Yes 40 7% No % Yes 5 1% No % London St Pancras; London Bridge; Peterborough; Needham Market Yes 39 7% No % Yes 8 1% No % Yes 0 No Yes 1 No Yes 1 No
38 Company Shuttle Bus Taxi Yes 0 No Yes 0 No Which of these smart cards have you used? Yes 2 Drive Alone No Greater Anglia 3 1% Key smart cards 1 I wasn't aware of these smart cards Not applicable % 47 9% Bus Section Responses 16. Did you travel by bus any day last week? Yes 43 8% No % 17. Which of these smart cards have you used? Stagecoach smart card 22 4% Busway smart card 3 1% I wasn't aware of these cards 19 4% Not applicable %
39 Appendix F - St John s Innovation Park 2018 Survey Results
40 Appendix F1 - Employer Results Reporting area Number of respondents Percentage of workforce (base = 1,600 employees) Number of one way journeys recorded by all modes Monday - Friday Number of one way journeys recorded by all modes Saturday - Sunday Average number of trips per respondent Monday - Friday Average distance travelled (miles) St John's Innovation Park SJIP % Longest distance travelled by mode (miles) Shortest distance travelled by mode (miles) Average distance travelled by mode (miles) Train Walk/Run Drive Alone Car Share (Driver) Car Share (Non Driver) Cycle Walk/Run Motorbike Train Public Bus Guided Bus Company Shuttle Bus Taxi Aircraft Worked at Home Off Work Less than 2 miles 35 3% miles 102 9% Drive alone - number and percentage of respondents and distance miles % miles % miles % miles More than 40 miles 93 8%
41 Drive Alone % 1182 Car Share (Driver) 73 4% Car Share (Non Driver) 35 2% Cycle % Walk/Run 45 2% Average number of trips and percentage by each mode Monday - Friday Motorbike 10 1% Train 15 1% Public Bus 13 1% Guided Bus 23 1% Company Shuttle Bus 0 Taxi 4 Aircraft 0 Worked at Home 81 4% Off Work 78 4% Drive Alone 18 2% 18 Car Share (Driver) 0 Car Share (Non Driver) 3 Cycle 13 2% Walk/Run 4 1% Motorbike 2 Average number of trips and percentage by each mode Saturday - Sunday Train 0 Public Bus 0 Guided Bus 0 Company Shuttle Bus 0 Taxi 0 Aircraft 0 Worked at Home 2 Off Work %
42 Appendix F2 - Additional Analysis Drivers or Passengers Responses 1. Did you use the Park & Ride last week? 2. What fuel type did the vehicle you travelled in use? Measures Petrol Diesel Liquefied Petroleum Gas (LPG) Compressed Natural Gas (CNG) Electric Responses Yes 6 2% No % Yes % No % Yes % No % Yes 0 No Yes 0 No Yes 1 No Hybrid 3. If you were a car driver, are you considering an electric vehicle in the next 12 months? 4. Would you consider an alternative to driving alone? Yes 8 2% No % Yes 75 19% No I already use an electric vehicle 2 1% Yes % 5. Which of these modes would you consider as an alternative to driving alone? Cycle Train Guided Bus Public Bus Car Share No % Yes 75 19% No % Yes 54 14% No % Yes 43 11% No % Yes 39 1 No Yes 79 2 No Motorcycle; I already cycle; Any type of public transport which is frequent, direct.
43 6. What is preventing you from cycling to work today? 7. What is preventing you from travelling by train today? Takes too long Cycle route is dangerous Waiting for the Chisholm Trail to open Weather conditions No railway station near my home Journey time longer than driving Costs more than driving Lack of flexibility e.g. I have to drop children at school/go out after work Infrequent services Parking at my railway station is too expensive Yes 18 5% No % Yes 17 4% No % Yes 6 2% No % Yes 32 8% No % I do cycle; Health conditions; I don't own a bike Yes 10 3% No % Yes 22 6% No % Yes 16 4% No % Yes 9 2% No % Yes 6 2% No % Yes 7 2% No % 8. What is preventing you from travelling to work on the guided bus today? Cost of railway tickets are too expensive I live too far away from the Busway Services not frequent enough Too expensive compared to driving I can't get on the bus because its full Yes 14 4% No % No seats - negates any advantage of travelling by train; Walk from station takes too long 20+ mins Yes 3 1% No % Yes 0 No Yes 5 1% No % Yes 2 1% No % No direct bus; Unreliable, plus sometimes have to visit external locations
44 9. What is preventing you from travelling to work on a public bus today? I live too far away from a bus stop Services not frequent enough Too expensive compared to driving I can't get on the bus because its full 10. What is preventing you from car sharing today? I don't know anybody to car share with I work irregular hours Yes 2 1% No % Yes 7 2% No % Yes 4 1% No % Yes 1 No Takes too long. There is no direct service; Service too unreliable. Yes 23 6% No % Yes 13 3% No % Rail Section Responses 11. Did you travel by rail any day last week? Safety issues Yes 0 No Childcare responsibilities (via nursery); I do car share already when possible. Yes 17 4% 12. Have you purchased a rail season ticket with Travel Plan Plus 1 discount? No % Yes Which of these stations was your final destination to work last week? 14. How did you get from Cambridge North or Main stations to your place of work? Cambridge North Station Cambridge Main Station Walk Own Cycle Shared Cycle Scheme Public Bus Guided Bus No Yes 12 3% No % Yes 4 1% No % London; London Kings Cross; Liverpool Lime St; Manchester Yes 9 2% No % Yes 7 2% No % Yes 0 No Yes 0 No Yes 0 No
45 Company Shuttle Bus Taxi Yes 0 No Yes 0 No Which of these smart cards have you used? Yes 1 Drive Alone No Greater Anglia 0 Key smart cards 2 1% I wasn't aware of these smart cards Not applicable % 16 4% Bus Section Responses 16. Did you travel by bus any day last week? Yes 15 4% No % 17. Which of these smart cards have you used? Stagecoach smart card 7 2% Busway smart card 2 1% I wasn't aware of these cards 6 2% Not applicable %
46 Appendix G - Weather View for the Survey Week 2018 (Source: Saturday 6th October Light rain (0.14mm) Wind 7.2 knots (Windy) North Westerly Temp 6.8 O C Sunday 7th October Dry Wind 2.4 knots (Light Breeze) North Westerly Temp 2.8 O C Monday 8th October Dry Wind 0.2 knots (Calm) Southerly Temp 5.6 O C Tuesday 9th October Dry Wind 1.3 knots (Light Breeze) Southerly Temp 8.0 O C Wednesday 10th October Dry Wind 0.0 knots (Calm) South Easterly Temp 8.8 O C Thursday 11th October Light rain (0.36mm) Wind 7.2 knots (Windy) South Easterly Temp 14.1 O C Friday 12th October Light rain (0.01 mm) Wind 7.3 knots (Windy) Southerly Temp 14.1 O C

47 Travel Plan Plus The Bradfield Centre 184 Cambridge Science Park Milton Road Cambridge CB4 0GA E:
GETTING WHERE WE WANT TO BE
 CAMBRIDGESHIRE & peterborough GETTING WHERE WE WANT TO BE A GREEN PARTY TRANSPORT POLICY CONTENTS Our Campaign Priorities 4 Bus Franchising 6 Supporting Active Transport 8 Workplace Parking Levy 9 Tackling
15% Survey on Smart Commuting. Factsheet: University of Twente. 435 out of invited employees. This is a response rate of
 Survey on Smart Commuting Factsheet: University of Twente Tiago Fioreze, University of Twente - 27 October 2016 435 out of 2.900 invited employees. This is a response rate of SURVEY ON SMART COMMUTING
Sandwell General Hospital Travel Plan 2014
 Sandwell General Hospital Travel Plan 2014 Travel Plan Survey Dated 24 th June 2013 Travel plan finalised March 2014 Prepared by Michael Raynor, JMP Consultants Ltd Site Address Lyndon, West Bromwich,
Mobility 2040 Results of 2 nd Survey
 Mobility 2040 Results of 2 nd Survey November 2015 1 1. Which of the following would most benefit you as you travel on the region s roadways? A. A handful of large-scale improvements to the region s most
Sustainable Transport Blueprint for Canterbury. Lynn Sloman
 Sustainable Transport Blueprint for Canterbury Lynn Sloman 01654 781358 lynn@transportforqualityoflife.com www.transportforqualityoflife.com Travel to work by walk, bus, bike, carshare, train: 34% of
Satisfaction with getting to work 56% 15% 6% 6% Total distance travelled. miles per week
 Page/... Headlines Emersons Green Travel to Work Survey March 0 Number of respondents Main modes of travel (%) 0% Satisfaction with getting to work % % Satisfaction with getting % % % (driver with others/
Bristol City Council has produced a draft Bristol Transport Strategy document.
 Bristol Transport Strategy Summary Document Introduction Bristol City Council has produced a draft Bristol Transport Strategy document. The Strategy fills a gap in transport policy for Bristol. We have
Travel Planning WC & NWCD Cycling Group. Thursday 2 nd July Amanda Holden
 Travel Planning WC & NWCD Cycling Group Thursday 2 nd July Amanda Holden 1 Today s workshop What is Travel Planning? University Travel Plan NWCD Travel Plan Targets Cycling Initiatives Other Travel Plan
Satisfaction with getting to work 54% 14% 6% 5% Total distance travelled. miles per week
 Page/... Travel to Work Survey March 0 Headlines South Gloucestershire LA Area Number of respondents Main modes of travel (%) Satisfaction with getting to work % Satisfaction with getting % (driver with
1999 On-Board Sacramento Regional Transit District Survey
 SACOG-00-009 1999 On-Board Sacramento Regional Transit District Survey June 2000 Sacramento Area Council of Governments 1999 On-Board Sacramento Regional Transit District Survey June 2000 Table of Contents
UWA Commuting Survey 2013
 UWA Commuting Survey 2013 September 2013 Project: UWA/10 UWA Commuting Survey 2013 September 2013 Client: University of Western Australia Project: UWA/10 Consultants: Donna Hill Petra Roberts Jennifer
STAFF TRAVEL SURVEY 2006 KEY FINDINGS
 Survey introduction STAFF TRAVEL SURVEY 2006 KEY FINDINGS The Staff Travel Survey 2006 was launched on 13 th January and ran for 3 weeks. Links to an online survey form were provided via the Friday Memo
1.0 FOREWORD EXECUTIVE SUMMARY INTRODUCTION CURRENT TRENDS IN TRAVEL FUTURE TRENDS IN TRAVEL...
 Sustainable Travel Plan 2008-2012 1 Contents Page Number 1.0 FOREWORD... 3 2.0 EXECUTIVE SUMMARY... 3 3.0 INTRODUCTION... 4 4.0 CURRENT TRENDS IN TRAVEL... 4 5.0 FUTURE TRENDS IN TRAVEL... 7 6.0 TRAVEL
Travel Patterns and Cycling opportunites
 Travel Patterns and Cycling opportunites The Household Travel Survey is the largest and most comprehensive source of information on the travel patterns of residents of the Sydney Greater Metropolitan Area
ReadyBike. Corporate Packages
 ReadyBike Corporate Packages J a n u a r y 2016 Transport hub with 15M+ passengers using Reading Station each year. Reading A modern town with vision One of the UK s top 10 shopping centres. Large town
Satisfaction with getting to work 55% 17% 8% 7% Total distance travelled. miles per week
 Page/... Headlines North Bristol Suscom Travel to Work Survey March 0 Number of respondents 0 Main modes of travel (%) % Satisfaction with getting to work % % % % Satisfaction with getting % % (driver
Report to: Greater Cambridge Partnership Executive Board 4 July Transport Strategy - Future Public Transport Requirements
 Report to: Greater Cambridge Partnership Executive Board 4 July 2018 Lead officer: Peter Blake GCP Transport Director Transport Strategy - Future Public Transport Requirements 1. Purpose 1.1. This paper
Cambridge Parking Strategy Review
 Cambridge Parking Strategy Review Cambridgeshire County Council Report May 2017 Our ref: 23132601 Client ref: SH Cambridge Parking Strategy Review Cambridgeshire County Council Report May 2017 Our ref:
Thursday 18 th January Cambridgeshire Travel Survey Presentation to the Greater Cambridge Partnership Joint Assembly
 Thursday 18 th January 2018 Cambridgeshire Travel Survey Presentation to the Greater Cambridge Partnership Joint Assembly Contents 1. Study Background 2. Methodology 3. Key Findings An opportunity for
2013 Staff Travel Survey Results
 Executive Summary A total of 384 University of Lincoln employees responded to the 2013 Staff Travel Survey a response rate of 30.7% The single occupancy car user rate fell to 49.0% from 51.4% in the previous
Student Travel Survey 2012 results
 Student Travel Survey 2012 results Survey overview Number of respondents: 1525 Expected number of respondents: 7775 Response rate: 19.6% Launch date: 12 Nov 2012 Close date: 15 Mar 2013 Section A: About
No-car lanes in Tyneside results from modelling and stakeholder analysis
 No-car lanes in Tyneside results from modelling and stakeholder analysis Dr Corinne Mulley, Newcastle University Dr Jessica Anderson, JMP Consulting Vilnius, September 2007 Belfast Brighton Glasgow Leeds
Contents Location Map Welcome and Introduction Travel Plan Management Science Park Accessibility Walking Cycling Bus Rail Car Sharing Contact Details
 Contents Contents Location Map Welcome and Introduction Travel Plan Management Science Park Accessibility Walking Cycling Bus Rail Car Sharing Contact Details 1 2 3 5 7 9 11 13 15 17 19 Thames Valley Science
Report on trends in mode share of vehicles and people crossing the Canal Cordon to 2013
 Report on trends in mode share of vehicles and people crossing the Canal Cordon 2006 to 2013 Dublin City Council, National Transport Authority, Civic Offices, Dun Scèine, Wood Quay, Harcourt Lane, Dublin
Staff Travel Survey 2015 Key Findings
 Staff Travel Survey Key Findings Introduction Between February and April, staff were asked to take part in the University of St Andrews Staff Travel Survey. The travel survey has been conducted approximately
Final Plan 20 December 2016
 Final Plan 20 December 2016 Introduction Aims of the Travel Plan How do we travel? Understanding travel behaviours? The University Master Plan and its implications Galway City sustainable transport policies
WELCOME TO YOUR NEW HOME TRAVEL INFORMATION RAIL CYCLING PARKING SERVICES FACILITIES CAR SHARING BUS WALKING SERVICES
 WELCOME TO YOUR NEW HOME TRAVEL INFORMATION PARKING CYCLING RAIL SERVICES FACILITIES BUS SERVICES CAR SHARING WALKING CONTENTS 01 PUBLIC TRANSPORT Bus Services Rail Services 02 WALKING AND CYCLING Walking
May Canal Cordon Report 2017
 May 2018 Canal Cordon Report 2017 Report on trends in mode share of vehicles and people crossing the Canal Cordon to 2017 2 Analysis of trends in mode share of people crossing the canal cordon - 2017 Contents
National Transport Awards Cambridge Park & Ride
 National Transport Awards Cambridge Park & Ride What Cambridgeshire has achieved q An award winning scheme focussed on quality. q Four sites, with a fifth site due to be built later this year. q 950,000
21/02/2018. How Far is it Acceptable to Walk? Introduction. How Far is it Acceptable to Walk?
 21/2/218 Introduction Walking is an important mode of travel. How far people walk is factor in: Accessibility/ Sustainability. Allocating land in Local Plans. Determining planning applications. Previous
RE-CYCLING A CITY: EXAMINING THE GROWTH OF CYCLING IN DUBLIN
 Proceedings ITRN2013 5-6th September, Caulfield: Re-cycling a city: Examining the growth of cycling in Dublin RE-CYCLING A CITY: EXAMINING THE GROWTH OF CYCLING IN DUBLIN Brian Caulfield Abstract In the
North West Non-Technical Summary of the Transport Assessment September 2011
 North West Non-Technical Summary of the Transport Assessment September 2011 Introduction This is a Non-Technical Summary of the findings of the Transport assessment work undertaken for the proposed North
The Greater Cambridge Travel Survey Report
 The Greater Cambridge Travel Survey Report Commissioned by the Greater Cambridge Partnership as part of the Big Conversation about travel and transport in the area Autumn 2017 April 2018 Report Details
The most innovative bike hire scheme in the UK
 The most innovative bike hire scheme in the UK What is Brompton Dock? Brompton Dock is a secure hire, return and storage facility that has been developed specifically and uniquely for the Brompton folding
CAMBRIDGE ACCESS STUDY: TACKLING CONGESTION WORKSHOP
 WEDNESDAY, 18 TH NOVEMBER, 2014 Carl Beet Paul Parkhouse Sarah Tuohy CAMBRIDGE ACCESS STUDY: TACKLING CONGESTION WORKSHOP A REMINDER OF THE CHALLENGE 30,000 EXTRA PEOPLE OF WORKING AGE 44,000 new jobs
BIKEPLUS Public Bike Share Users Survey Results 2017
 BIKEPLUS Public Bike Share Users Survey Results 2017 September 2017 Public Bike Share Users Survey Results 2017 The second annual Bikeplus survey combines robust data, and expert opinion to provide a snapshot
London Cycle Network Annual Report 2000
 London Cycle Network Annual Report 2000 A cycle network for London by 2005 A cycle network for London by 2005 The London Cycle Network will: provide local links between residential neighbourhoods, railway
University of Leeds Travel Survey June 2015
 University of Leeds Travel Survey June 2015 Steven Welch Project Funded by University of Leeds Sustainability Service 1 Contents 1. Background to survey & implementation 3 2. Scope 3 emissions. 4 2.1 Staff
Car Parking Survey Revised
 Car Parking Survey Revised Showing,6 of,6 responses Showing all responses Showing all questions Do you think the University has... Too much parking 70 (%) The right amount given the city centre nature
Travel Plan Monitoring Report. Bourton View, Wellingborough - Residential
 Travel Plan Monitoring Report Bourton View, Wellingborough - Residential Prepared by: Developer Eyes Property and Estate Management, Broughton Grange Business Centre, Headlands, Kettering, Northants, NN15
Travel Plan Monitoring Report. Buttercross Park, Whittlesey - Residential
 Travel Plan Monitoring Report Buttercross Park, Whittlesey - Residential Prepared by: Developer Eyes Property and Estate Management Limited Headlands, Kettering, Northants NN15 6XA Company Registration
Greater Cambridge City Deal Executive Board & Joint Assembly
 Greater Cambridge City Deal Executive Board & Joint Assembly Welcome to the Call for Evidence on tackling congestion in Cambridge Launch Event 11 th November 2015 Bob Menzies Service Director: Strategy
Typical Rush Hour Commute. PennyforTransportation.com
 Typical Rush Hour Commute In the News Overview of the Plan Collaborative plan with projects in every community Prioritizing connectivity and congestion relief Dedicated transportation-specific funding;
CONTENTS PREFACE 1.0 INTRODUCTION AND SCOPE 2.0 POLICY AND GOVERNANCE 3.0 SUMMARY OF PROGRESS 4.0 NATURE OF DEMAND 5.0 TRAVEL AND PARKING INITIATIVES
 CONTENTS PREFACE 1.0 INTRODUCTION AND SCOPE 2.0 POLICY AND GOVERNANCE 3.0 SUMMARY OF PROGRESS 4.0 NATURE OF DEMAND 5.0 TRAVEL AND PARKING INITIATIVES 6.0. TARGETS PREFACE The University of St Andrews has
Low Level Cycle Signals with an early release Appendices
 Low Level Cycle Signals with an early release Appendices Track trial report This document contains the appendices to accompany the report from the second subtrial of a larger track trial investigating
Tackling Social Inequality by Promoting Sustainable Transport. Huw Thomas, Smarter Choices Programme Manager
 Tackling Social Inequality by Promoting Sustainable Transport Huw Thomas, Smarter Choices Programme Manager Agenda Sustrans who are we? Transport and Social Inequality Group work how to inform and change
PERSONALISED TRAVEL PLANNING IN MIDLETON, COUNTY CORK
 PERSONALISED TRAVEL PLANNING IN MIDLETON, COUNTY CORK Elaine Brick Principal Transport Planner AECOM Abstract Smarter Travel funding was awarded to the Chartered Institute of Highways and Transportation
CAMBOURNE TO CAMBRIDGE BETTER PUBLIC TRANSPORT PROJECT PHASE 2 PUBLIC CONSULTATION MADINGLEY MULCH ROUNDABOUT TO CAMBOURNE
 CAMBOURNE TO CAMBRIDGE BETTER PUBLIC TRANSPORT PROJECT PHASE 2 PUBLIC CONSULTATION MADINGLEY MULCH ROUNDABOUT TO CAMBOURNE Have your say on proposals for a new public transport link and Park & Ride facility
Transport Workshop Dearbhla Lawson Head of Transport & Infrastructure Policy & Funding University of the Third Age.
 Transport Workshop Dearbhla Lawson Head of Transport & Infrastructure Policy & Funding University of the Third Age 30 th March 2015 1 Presentation Overview Roles and responsibilities Snapshot of Key Challenges
Map 1 shows the two roads, and how they fit into the public transport network in and around Cambridge.
 Milton Road and Histon Road corridors bus priority infrastructure 1. Purpose The County Council would like to understand in more detail, the options to deliver the most effective corridor-based public
DE MONTFORT UNIVERSITY TRAVEL PLAN PROGRESS REPORT
 DE MONTFORT UNIVERSITY TRAVEL PLAN PROGRESS REPORT 2013 This is the November 2013 progress report on the De Montfort University Travel Plan, prepared by Ian Murdey, Transport Co-ordinator, De Montfort
BUS PASSENGER SURVEY RESULTS FOR: BUS PASSENGER SURVEY STAGECOACH Stagecoach in GMPTE area
 BUS PASSENGER SURVEY RESULTS FOR: BUS PASSENGER SURVEY STAGECOACH Stagecoach in GMPTE area July 2010 July 2010 Contacts Ian Wright Passenger Focus 2nd Floor, One Drummond Gate, Pimlico, London SW1V 2QY
Smart Network Smarter Choices
 Employer Site Audit Form Please fill in this site audit form giving as much detail as possible. Remember to take photos to support the audit. Once completed please return the form to business@centro.org.uk
REPORT N O A1307 HAVERHILL TO CAMBRIDGE PREFERRED OPTIONS REPORT APPENDICES
 REPORT N O 70012014-2016-04 A1307 HAVERHILL TO CAMBRIDGE PREFERRED OPTIONS REPORT APPENDICES FEBRUARY 2017 APPENDIX A A1307, THREE CAMPUSES TO CAMBRIDGE CONSULTATION REPORT FINAL SEPTEMBER 2016 [2] Cambridgeshire
Cabrillo College Transportation Study
 Cabrillo College Transportation Study Planning and Research Office Terrence Willett, Research Analyst, Principle Author Jing Luan, Director of Planning and Research Judy Cassada, Research Specialist Shirley
Route User Intercept Survey Report
 Route User Intercept Survey Report Hills Road, Cambridge Fieldwork: October 2016 Report published: December 2016 1 About Sustrans Sustrans makes smarter travel choices possible, desirable and inevitable.
2016 APS Go! Surveys Summary Results for Oakridge Elementary School
 2016 APS Go! Surveys Summary Results for Oakridge Elementary School This report summarizes results from the 2016 APS Go! surveys for Oakridge Elementary School. Student, parent/caregiver and staff surveys
GD 0043/18 ACTIVE TRAVEL STRATEGY
 GD 0043/18 ACTIVE TRAVEL STRATEGY 2018-2021 May 2018 Minister s Introduction There is strong evidence that regular physical activity reduces the risk of a range of health conditions. The best way to increase
CAMBRIDGE SOUTH WEST PARK & RIDE
 CAMBRIDGE SOUTH WEST PARK & RIDE Have your say on: Extra Park & Ride spaces to the south west of Cambridge Bus priority measures into the city centre CREATING MORE PARK & RIDE SPACES The existing Park
Stagecoach in Swindon Borough area
 BUS PASSENGER SURVEY STAGECOACH BUS PASSENGER SURVEY RESULTS FOR: July 2010 Stagecoach in Swindon Borough area July 2010 Contacts Ian Wright Passenger Focus 2nd Floor, One Drummond Gate, Pimlico, London
A bold but realistic vision for a world-class transport future for Shrewsbury and the region
 A bold but realistic vision for a world-class transport future for Shrewsbury and the region Professor Whitelegg is the Managing Director of the transport consultancy Eco-Logica Ltd. He is Professor of
2016 APS Go! Surveys Summary Results for Arlington Traditional School
 2016 APS Go! Surveys Summary Results for Arlington Traditional School This report summarizes results from the 2016 APS Go! surveys for Arlington Traditional School. Student, parent/caregiver and staff
Initial ideas for bus and cycle links
 Initial ideas for bus and cycle links HAVE YOUR SAY The Greater Cambridge City Deal working in partnership: Please complete the survey inside this leaflet or online at: www.gccitydeal.co.uk/a1307 by 1
4. Guided Bus Explained
 4. Guided Bus Explained Contents 1 INTRODUCTION... 2 Structure of this report... 2 2 KERB GUIDED BUS... 3 Overview... 3 Kerb guidance... 3 Figures Figure 2.1 Figure 2.2 Figure 2.3 Figure 2.4 Figure 2.5
#GetBathMoving. Adam Reynolds
 #GetBathMoving Adam Reynolds The Analysis In god we trust, everyone else bring data. Commuters (Census 2011) 27,715 drive to work in Bath: 7,931 work in city centre 4,443 work at RUH/Locksbrook 4,969 work
TRANSPORTATION TOMORROW SURVEY
 Clause No. 15 in Report No. 7 of was adopted, without amendment, by the Council of The Regional Municipality of York at its meeting held on April 17, 2014. 15 2011 TRANSPORTATION TOMORROW SURVEY recommends
Reflections on our learning: active travel, transport and inequalities
 Reflections on our learning: active travel, transport and inequalities Jill Muirie Glasgow Centre for Population Health Active travel definition Active travel refers to walking, cycling or using some other
Part 3: Active travel and public transport planning in new housing developments
 1 Linking active travel and public transport to housing growth and planning Part 3: Active travel and public transport planning in new housing developments Active Travel Toolkit Slide Pack July 2017 Linking
Chapter 12 TRAFFIC AND TRANSPORT
 Chapter 12 TRAFFIC AND TRANSPORT 12 12 Traffic and transport Introduction 12.1 Alan Baxter Ltd undertook the traffic and transport assessment. The findings of the assessment are summarised in this chapter
Scope of the Transit Priority Project
 Transit Planning Committee #1 March 19, 2015 Scope of the Transit Priority Project Review of the 2010 plan Analysis of Transit Priority Measures Preliminary plans for rapid transit Recommendations for
BUS BUS PASSENGER SURVEY RESULTS ARRIVA Arriva in Merseyside November 2009 PTE (Merseytravel) area
 area") BUS BUS PASSENGER SURVEY RESULTS ARRIVA FOR: Arriva in Merseyside November 2009 PTE (Merseytravel) area July 2010 Contacts Ian Wright Passenger Focus 2nd Floor, One Drummond Gate, Pimlico, London SW1V
BUS BUS PASSENGER SURVEY RESULTS ARRIVA FOR: Arriva in Merseyside November 2009 PTE (Merseytravel) area July 2010 Contacts Ian Wright Passenger Focus 2nd Floor, One Drummond Gate, Pimlico, London SW1V
St Anthony s School Hampstead
 St Anthony s School Hampstead Travel Information Pack Version 1.1 Welcome......to St Anthony s School St. Anthony's aims to provide high quality education in a caring, supportive and Catholic environment.
WELCOME. City of Greater Sudbury. Transportation Demand Management Plan
 WELCOME City of Greater Sudbury Transportation Demand Management Plan Public Consultation Session St. Andrew s Place, Activity Hall 111 Larch Street Wednesday September 13, 2017 6:00 to 8:00 pm Welcome
WALK- AND bike-friendly TURLOCK
 WALK- AND bike-friendly TURLOCK Ideas to Encourage Walking and Biking Benefits to the COMMUNITY Get Connected People who walk and bike have many more opportunities for casual interactions with friends
Our journey a 20 year Transport Manifesto for the North East
 Our journey a 20 year Transport Manifesto for the North East Sustrans submission to North East Combined Authority (NECA). March 2016 Summary Sustrans is a leading UK charity enabling people to travel by
BUS BUS PASSENGER SURVEY Cornwall RESULTS FOR:
 BUS BUS PASSENGER SURVEY Cornwall RESULTS FOR: Cornwall Council November 2009 area July 2010 Contacts Ian Wright Passenger Focus 2nd Floor, One Drummond Gate, Pimlico, London SW1V 2QY Tel: 0300 123 0860
HIGH STREET & ROYAL AVENUE TRAFFIC SURVEY
 HIGH STREET & ROYAL AVENUE TRAFFIC SURVEY On Behalf of Belfast City Centre Management 27 th March 2012 0 High Street & Royal Avenue Traffic Report Cover Image Courtesy of David Lloyd AECOM Design & Planning
Public survey summary Helmet policy review 1. Mandatory helmet law public survey summary
 Public survey summary Helmet policy review 1 Mandatory helmet law public survey summary November 2017 1. Executive summary In September 2017 Australia s biggest bike riding organisation, Bicycle Network,
CSRM Modelling Summary Report for Cambridge and South Cambridgeshire Local Plans July 2013
 CSRM Modelling Summary Report for Cambridge and South Cambridgeshire Local Plans July 2013 Prepared by WSP Group and Atkins EXECUTIVE SUMMARY This Summary Report outlines the work undertaken by WSP Group
A Guide to Your Travel Options. Chester Campuses and Buildings
 A Guide to Your Travel Options Campuses and Buildings Introduction and Background Contents 03 Introduction and Background 04 Travel by ublic Transport Introduction and Background 06 Travelling to the University
University of Leicester Travel Survey January
 University of Leicester University of Leicester Travel Survey January 2010 colinbuchanan.com Project No: 17554-01-1 January 2010 10 Eastbourne Terrace, London, W2 6LG Email : London@cbuchanan.co.uk Prepared
Arriva in Medway July 2010 (Kent) Council area
 Council area") BUS BUS PASSENGER SURVEY RESULTS ARRIVA FOR: Arriva in Medway July 2010 (Kent) Council area July 2010 Contacts Ian Wright Passenger Focus 2nd Floor, One Drummond Gate, Pimlico, London SW1V 2QY Tel: 0300
BUS BUS PASSENGER SURVEY RESULTS ARRIVA FOR: Arriva in Medway July 2010 (Kent) Council area July 2010 Contacts Ian Wright Passenger Focus 2nd Floor, One Drummond Gate, Pimlico, London SW1V 2QY Tel: 0300
Road Improvement Consultations Huntingdon Road
 Road Improvement Consultations Huntingdon Road General Summary: About You In total, 828 people responded to this consultation. 33.1% indicated they were a resident of Girton. 18.6% stated they were a resident
BUS PASSENGER SURVEY Merseyside BUS PASSENGER SURVEY RESULTS FOR: November 2009
 BUS PASSENGER SURVEY Merseyside BUS PASSENGER SURVEY RESULTS FOR: November 2009 Merseyside PTE area (Merseytravel) July 2010 Contacts Ian Wright Passenger Focus 2nd Floor, One Drummond Gate, Pimlico, London
Nottingham Cycle City Frequently Asked Questions
 Nottingham Cycle City Frequently Asked Questions About the scheme How much money is to be spent on cycling? And where is the money from? We have 6.1 million in Growth Fund which we will be investing directly
LEEDS BECKETT UNIVERSITY. Transport Strategy
 LEEDS BECKETT UNIVERSITY Transport Strategy 2016-2021 2 3 Contents 1. Introduction 1. Introduction...3 Scope of the Document...3 Vision...3 Key Successes...3 2. Our Travel Behaviour...4 Staff and Student
University of Leeds Travel Plan
 University of Leeds Travel Plan 2015-2018 Contents 1: Introduction 1.1 What is a Travel Plan? 1.2 Why do we need one? 1.3 Sustainability Strategy 2: Overview 2.1 The bigger picture 2.2 The City scale 2.3
Healthy and Environmental Friendly Transport in the City Region
 Healthy and Environmental Friendly Transport in the City Region Reindert Augustijn Team manager traffic and transport Arnhem Nijmegen City Region www.polisnetwork.eu/2014conference #polis14 Fact and figures
Help your staff get to work with the Business Travel Pack
 Help your staff get to work with the Business Travel Pack The way to go 1 Welcome to the Business Travel Pack This pack aims to give you the tools to help encourage more employees to consider walking,
Transportation 2040 Update: Eudora Public Input As of June 1, 2017
 Transportation 2040 Update: Eudora Public Input As of June 1, 2017 Overview... 1 Survey Responses... 2 Overview The Lawrence Douglas County Metropolitan Planning Organization (MPO) is updating our long
Road to the future What road users want from Highways England s Route Strategies Summary report November 2016
 Road to the future What road users want from Highways England s 2020-25 Route Strategies Summary report November 2016 Road to the future Summary report Foreword Guy Dangerfield Transport Focus aims to
Developing a Safer Cycling Strategy for the ACT ACRS Conference August 2012
 Developing a Safer Cycling Strategy for the ACT ACRS Conference 2012 Peter Strang Canberra Manager Sarah Court Transport Consultant 10 August 2012 Presentation Outline Background Data Analysis (Stage 1)
2016 Capital Bikeshare Member Survey Report
 2016 Capital Bikeshare Member Survey Report Prepared by: LDA Consulting Washington, DC 20015 (202) 548-0205 February 24, 2017 EXECUTIVE SUMMARY Overview This report presents the results of the November
RIVER CROSSINGS: EAST OF SILVERTOWN CROSSINGS
 TRANSPORT FOR LONDON RIVER CROSSINGS: EAST OF SILVERTOWN CROSSINGS SUPPORTING TECHNICAL DOCUMENTATION TRAFFIC IMPACT REPORT Neil Georgeson July 2014 This report examines the traffic impacts that potential
Life Transitions and Travel Behaviour Study. Job changes and home moves disrupt established commuting patterns
 Life Transitions and Travel Behaviour Study Evidence Summary 2 Drivers of change to commuting mode Job changes and home moves disrupt established commuting patterns This leaflet summarises new analysis
City of Perth Cycle Plan 2029
 Bicycling Western Australia s response City of Perth Cycle Plan 2029 2012-2021 More People Cycling More Often ABOUT BICYCLING WESTERN AUSTRALIA Bicycling Western Australia is a community based, not-for-profit
University of Birmingham Staff and Student Travel Survey
 2016 University of Birmingham Staff and Student Travel Survey Executive Summary The University of Birmingham has been conducting a travel survey amongst staff and students since 2008. The aim of the survey
Travel Costs...in more ways than one! Sara Brook: West Yorkshire Travel Plan Network (WYTPN)
") Travel Costs...in more ways than one! Sara Brook: West Yorkshire Travel Plan Network (WYTPN) Content What is the What are the real costs of travel to employers, society and the environment? What are the
Travel Costs...in more ways than one! Sara Brook: West Yorkshire Travel Plan Network (WYTPN) Content What is the What are the real costs of travel to employers, society and the environment? What are the
Key objectives of the survey were to gain a better understanding of:
 3 COMMUNITY INPUT Community input is an essential part of corridor studies. For the SR 87 corridor study, VTA staff conducted an extensive online survey of people living and commuting along the corridor.
WEST HATCH HIGH SCHOOL THE BEST THAT I CAN BE. School Travel Plan
 WEST HATCH HIGH SCHOOL THE BEST THAT I CAN BE School Travel Plan Policy reviewed June 2017 TABLE OF CONTENTS Context... 3 Purpose... 3 Scope... 3 1.0 Introduction... 4 2.0 Existing Conditions... 4 3.0