SAS Quality Scorecard August 2011
|
|
|
- Marianna Dawson
- 5 years ago
- Views:
Transcription
1 SAS Quality Scorecard August 2011 Access & Referral Unscheduled AR1: Cat A Performance AR2: Cat A Cardiac Arrest Performance AR3: Cat B Performance AR4: Islands Emergency Performance AR5: 1Hr Urgents In Performance Scheduled AR8: PTS Punctuality for Appointment AR9: PTS Punctuality for Pickup After Appointment AR10: PTS Journeys Cancelled by SAS Air Ambulance AR11: Time from Take Off to Land on Scene < 60mins Clinical Excellence CE1: ROSC CE2: Hyper Acute Stroke To Hospital < 60 mins CE3: SEWS Scores >= 4 Taken to Hospital Engaging with Partners EP3: PTS Aborts and Cancels EP6: Emergency Incidents Treated at Scene Organisational Development OD3: Sickness Absence OD4: Meet Financial Targets ( 000) OD5: Meet Cash Efficiency Targets ( 000) Heat Target Measure YTD Apr May Jun Jul Aug Sep Oct Nov Dec Jan Feb Mar Q1 Q2 Q3 Q4 On Target Of Concern SAS H3 75% 73.8% 75.1% 73.7% 73.1% 73.0% 74.4% 73.9% 73.6% >=75% 72-75% <=72% SAS H2 80% 78.6% 79.7% 80.8% 79.8% 73.5% 79.1% 80.1% 76.3% >=80% 76-80% <=76% SAS H4 95% 93.2% 93.1% 93.7% 92.6% 92.7% 94.0% 93.1% 93.3% >=95% 91-95% <=91% SAS H5 55% 56.2% 55.0% 57.0% 55.7% 54.6% 58.5% 55.9% 56.6% >=55% 52-55% <=52% SAS A1 91% 85.1% 86.0% 86.1% 84.1% 83.9% 85.5% 85.4% 84.7% >=91% 88-91% <=88% Action Required SAS A2 72% 71.1% This 71.7% indicator 70.5% is reported quarterly >=72% 70-72% <=70% SAS A3 90% 80.6% This 80.5% indicator 80.7% is reported quarterly >=90% 87-90% <=87% SAS A4 <0.5% 0.4% 0.3% 0.4% 0.6% 0.3% 0.4% 0.5% 0.3% <0.5% % >=0.8% Heat Target April June 95% 95.5% 96.9% 94.7% 96.0% 94.8% 93.6% 95.9% 94.5% >=95% 91-95% <=91% Measure YTD Apr May Jun Jul Aug Sep Oct Nov Dec Jan Feb Mar Q1 Q2 Q3 Q4 On Target Of Concern SAS H % 17.3% 21.7% 15.9% 15.5% 15.0% 15.2% 17.7% 15.7% >=12% 10-12% <=10% SAS T5 80% 80.7% 78.2% 86.7% 83.6% 75.2% 78.9% 83.3% 77.3% >=80% 76-80% <=76% SAS T % 96.2% 97.0% 97.1% 95.0% 96.0% 95.4% 96.3% 95.7% >=95% 91-95% <=91% Heat Target Measure YTD Apr May Jun Jul Aug Sep Oct Nov Dec Jan Feb Mar Q1 Q2 Q3 Q4 On Target Of Concern 18wks <18% 15.6% 16.5% 15.8% 15.5% 14.6% 15.1% 15.9% 14.9% <=18% 18-20% >=20% SAS T3 12% 12.5% 12.4% 12.3% 12.7% 12.6% 12.4% 12.5% 12.5% >=12% 11-12% <11% Heat Target Measure YTD Apr May Jun Jul Aug Sep Oct Nov Dec Jan Feb Mar Q1 Q2 Q3 Q4 On Target Of Concern SAS E1 <5% 5.0% 4.9% 4.5% 5.4% 5.4% 5.0% 4.9% 5.2% <=5% 5-5.5% >=5.5% Action Required Action Required Action Required NHSS E5-971 n/a >= 0-100k- 0 <=- 100k NHSS E6 6,525 4,745 n/a 4, , >=3% 2.5-3% <=2.5%
2 Summary Clinical performance remains strong in July and August, with the year to date position above target. Despite higher levels of sickness absence, response times improved in August and PTS cancellation rates remained within tolerance limits. The higher than expected sickness absence, together with late notification and non recurring cost pressures has resulted in a worsening financial balance of a 970k overspend.
3 Highlight/Exception Report SAS AR1 (HEAT SAS H3) % of Cat A within 8 minutes 100.0% Scotland Total - Cat A % Met 8 Minutes Performance against this indicator increased in the past month, narrowly missing the 75% target with a performance of 74.4%. 90.0% 80.0% 70.0% 60.0% In August of the 5 divisions exceeded the target of 75% for the month. North and West Central Divisions both achieved over 75% in August with 76.3% and 77.2% respectively. East Central and South East, whilst below target improved on the July position and South West fell below target for the month of August. 50.0% Sep-10 Oct-10 Nov-10 Dec-10 Jan-11 Feb-11 Mar-11 Apr-11 May-11 Jun-11 Jul-11 Aug-11 % Met 8 Mins 73.4% 74.3% 70.6% 58.6% 68.4% 71.1% 73.4% 75.1% 73.7% 73.1% 73.0% 74.4% Target 75.0% 75.0% 75.0% 75.0% 75.0% 75.0% 75.0% 75.0% 75.0% 75.0% 75.0% 75.0% Cat A % performance by Division 78.0% 76.0% 74.0% 72.0% 70.0% In August Scotland as a whole struggled to maintain performance over weekends and on Mondays, the 3 days in which emergency and urgent demand is at its highest. Throughout August Sundays had the lowest performance with 70.8% and Tuesdays had the highest with an average of 77.6%. Scotland as a whole is currently sitting 1.2% behind the 75% target for the year to date with North and West Central being the 2 divisions which are meeting the target at 76.1% and 75.1% respectively. Now that the Optima Software has been procured, shift reviews are progressing in divisions to refine the matching of resourcing to demand patterns. 68.0% 66.0% East Central North South East South West West Central Scotland MTD 73.6% 76.3% 70.3% 74.3% 77.2% 74.4% YTD 73.4% 76.1% 70.8% 74.6% 75.1% 73.8% Target 75% 75% 75% 75% 75% 75%
4 SAS AR2 (HEAT SAS H2) % of cardiac arrest incidents responded to within 8 minutes %Category A Calls 100.0% Cardiac Arrests Responded To Within 8 Minutes - Scotland 100.0% 90.0% 80.0% 70.0% 60.0% 50.0% 40.0% 30.0% 20.0% 10.0% 0.0% Sep- 10 Oct- 10 Nov- 10 Dec- 10 All Cat A % Met 73.4% 74.3% 70.6% 58.6% 68.4% 71.1% 73.4% 75.1% 73.7% 73.1% 73.0% 74.4% Cardiac Arrest Cat A % Met 81.0% 78.9% 75.2% 61.7% 70.4% 79.7% 80.1% 79.7% 80.8% 79.8% 73.5% 79.1% Target 75% 75% 75% 75% 75% 75% 75% 75% 80% 80% 80% 80% Jan- 11 Feb- 11 Mar- 11 Apr- 11 May- 11 Jun- 11 Jul- 11 Aug- 11 Sep-10 Oct-10 Nov-10 Dec-10 Jan-11 Feb-11 Mar-11 Apr-11 May-11 Jun-11 Jul-11 Aug-11 H2 Cardiac arrest patients responded to within 8 mins Performance against this indicator marginally fell short of the 80% target in August at 79.1%. The performance in August was an improvement on July s number which was 73.5%. In Scotland as a whole there was a 1.3% fall in the number of cardiac arrest incidents in August when compared to August South East and West Central were the 2 divisions which achieved the target with 82.5% and 82.1% respectively. East Central, North and South West divisions all fell below target in August. Two of these divisions had a rise in the number of cardiac arrest incidents, East Central by 20.8% and North by 6.0%. Year to date Scotland is slightly behind target by 1.4% with only West Central exceeding the target for the year with 83.9%. The position for 2010/11 was 77.4%. 90.0% 80.0% Cat A%met within8mins 70.0% 60.0% 50.0% 40.0% 30.0% 20.0% 10.0% 0.0% East Central North South East South West West Central Scotland MTD 76.3% 79.2% 82.5% 76.3% 82.1% 79.1% YTD 76.5% 76.6% 77.7% 75.8% 83.9% 78.6% Target 80% 80% 80% 80% 80% 80%
5 SAS AR3 (HEAT SAS H4) % of Cat B incidents responded to within 14,19,21 minutes 100.0% Scotland Total - Cat B % Met 14,19 and 21 Minutes Performance against this indicator rose in August to the highest level this year at 94.0%. Overall emergency demand is 3.8% higher than the same 5 months last year. 90.0% 80.0% East Central and South West achieved the target in August with 95.5% and 95.1% respectively. 70.0% 60.0% 50.0% Sep-10 Oct-10 Nov-10 Dec-10 Jan-11 Feb-11 Mar-11 Apr-11 May-11 Jun-11 Jul-11 Aug-11 % Met 14,19 or 21 Mins 94.4% 93.6% 91.5% 84.7% 91.2% 91.5% 93.2% 93.1% 93.7% 92.6% 92.7% 94.0% Target 95.0% 95.0% 95.0% 95.0% 95.0% 95.0% 95.0% 95.0% 95.0% 95.0% 95.0% 95.0% Although an improvement on previous month s performance, West Central division accounted for the bulk of the shortfall in performance due to the 14 minute response time target in Glasgow which is the only area where the 14 minute target applies, due to historical reasons (the rest of the country has Category B targets of 19 or 21 minutes). The development of indicators more closely aligned to clinically safe and effective care continues. Cat B % Performance by Division 96.0% 95.0% 94.0% 93.0% 92.0% 91.0% 90.0% 89.0% 88.0% 87.0% East Central North South East South West West Central Scotland MTD 95.5% 93.8% 93.8% 95.1% 92.8% 94.0% YTD 94.8% 93.9% 94.8% 94.3% 90.4% 93.2% Target 95% 95% 95% 95% 95% 95%
6 SAS AR5 (HEAT SAS A1) % of 1 hour urgents responded to within 1 hour 100.0% 95.0% 90.0% % of 1 Hour Urgents responded to within 1 Hour Performance against this indicator improved slightly in August when compared with July to 85.5%. The demand for 1 hour urgent journeys decreased by 8.1% in August when compared to August % 80.0% In August 2011 the North was the only division which reached the target of 91% with a performance of 93.8%. 75.0% 70.0% 65.0% 60.0% Aug-10 Sep-10 Oct-10 Nov-10 Dec-10 Jan-11 Feb-11 Mar-11 Apr-11 May-11 Jun-11 Jul-11 Aug-11 YTD Performance 93.5% 92.7% 92.7% 91.4% 87.1% 91.7% 88.3% 82.8% 86.0% 86.1% 84.1% 83.9% 85.5% 85.1% Target 91% 91% 91% 91% 91% 91% 91% 91% 91% 91% 91% 91% 91% 91% % of 1 Hour Urgents Responded to within 1 Hour by Division 100.0% A significant focus has been placed on improving responses to doctors urgents requests, particularly those with a response within 1 hour, as these are often very ill patients. Over the last few months, standards, definitions and reporting arrangements have been refined, together with real time exception arrangements for breaches. As a result the number and waiting times of outliers has significantly reduced. 90.0% 80.0% 70.0% 60.0% 50.0% 40.0% 30.0% 20.0% 10.0% 0.0% East Central North South East South West West Central Scotland MTD 89.0% 93.8% 81.2% 83.5% 82.5% 85.5% YTD 89.0% 95.5% 83.9% 82.3% 80.4% 85.1% Target 91% 91% 91% 91% 91% 91%
7 SAS AR8 (HEAT SAS A2) P1 patients PTS punctuality for appointment 100.0% 90.0% 80.0% Scotland Total - PTS Appointment Punctuality Performance against this indicator showed a fall in the second quarter of 2011/12 when compared against the previous quarter (2011/12 Q1). The performance in Q2 2011/12 was 1.5% below target at 70.5% and was also lower than the same time last year when it was 72.6%. 70.0% 60.0% 50.0% 2010/11 Q2 2010/11 Q3 2010/11 Q4 2011/12 Q1 2011/12 Q2 % Punctuality 72.6% 72.6% 70.1% 71.7% 70.5% Target 72.0% 72.0% 72.0% 72.0% 72.0% PTS A2 Appointment Punctuality 100% 80% Three of the 5 divisions exceeded the 72% target, these were North, South East and South West with East Central and West Central falling short at 69.0% and 64.8% respectively. East Central currently has nine whole time equivalent ACA vacancies, which with widespread use of part time working equates to more than nine posts. In addition, use of the Volunteer Ambulance Car Service is being curtailed. This will impact on quality standards until Scheduled Care Review implementation takes effect and reduces excess demand. 60% 40% 20% It is worth noting that these figures are based on a 1 week sample of PTS activity which means a small sample of information is used to calculate an average for the quarter. By the end of this financial year it is planned to introduce PTS mobile data into the Data Warehouse. This will make the measuring of this indicator more robust and timely. 0% East Central North South East South West West Central Scotland Q1 2011/ % 80.6% 75.1% 78.2% 63.9% 71.7% Q2 2011/ % 78.8% 73.2% 74.0% 64.8% 70.5% 2011/12 YTD 69.4% 79.6% 74.2% 76.1% 64.4% 71.1%
8 SAS AR9 (HEAT SAS A3) P1 patients PTS punctuality for pickup after appointment 100.0% 90.0% 80.0% Scotland Total - PTS Pick up Punctuality Although showing a slight improvement compared to the previous quarter, performance against this indicator continues to fall short of the target of 90% at 80.7%. Despite the small rise in performance against last quarter it fell when compared to the same time last year (81.8%). 70.0% 60.0% All 5 divisions fell short of the 90% target in Q2 2011/12. East Central and West Central had the lowest performance with West Central again recording a performance below 80%. 50.0% 2010/11 Q2 2010/11 Q3 2010/11 Q4 2011/12 Q1 2011/12 Q2 % Punctuality 81.8% 79.9% 80.3% 80.5% 80.7% Target 90.0% 90.0% 90.0% 90.0% 90.0% PTS A3 Pick-up Punctuality 100% 80% Again, it is worth noting that these figures are based on a 1 week sample of PTS activity which means a small sample of information is used to calculate an average for the quarter. By the end of this financial year it is planned to introduce PTS mobile data into the Data Warehouse. This will make the measuring of this indicator more robust and timely. 60% 40% 20% 0% East Central North South East South West West Central Scotland Q1 2011/ % 88.4% 89.7% 84.3% 74.2% 80.5% Q2 2011/ % 86.7% 85.6% 85.3% 71.2% 80.7% 2011/12 YTD 78.8% 87.5% 87.9% 84.8% 72.8% 80.6%
9 SAS OD3 (HEAT SAS E1) Sickness Absence 10.0% 9.0% 8.0% 7.0% 6.0% 5.0% 4.0% 3.0% 2.0% 1.0% HEAT Target E1 - Reducing Sickness Absence Scotland Total Sickness Absence Aug-10 Sep-10 Oct-10 Nov-10 Dec-10 Jan-11 Feb-11 Mar-11 Apr-11 May-11 Jun-11 Jul-11 Aug-11 YTD Performance 4.6% 4.8% 4.9% 5.6% 6.3% 6.1% 5.8% 5.1% 4.9% 4.5% 5.4% 5.4% 5.0% 5.0% Target 5% 5% 5% 5% 5% 5% 5% 5% 5% 5% 5% 5% 5% 5% 12.0% 10.0% 8.0% 6.0% 4.0% 2.0% 0.0% East Central EMDC - East HEAT Target E1 - Reducing Sickness Absence EMDC - North EMDC - West NHQ North East North & West South East MTD 5.9% 6.0% 6.7% 11.3% 2.9% 4.6% 3.7% 4.6% 3.2% 6.4% 5.0% YTD 5.9% 3.8% 3.6% 8.4% 3.2% 5.1% 4.3% 4.9% 2.8% 7.1% 5.0% Target Lower 5% 5% 5% 5% 5% 5% 5% 5% 5% 5% 5% South West West Central Scotland Performance against this target narrowly missed the <5% target in August with a figure of 5%. The performance in August improved compared to June and July 2011 where the performance in both months was 5.4%. In August East Central, West Central and all the EMDCs were outwith the target of 5% with the West EMDC recording the highest rate at 11.3%. This is a rise from the previous 2 months where the rate was 6.3% in June and 10.5% in July. The remaining 2 EMDCs and West Central both recorded sickness absence of over 6%. The high rates seen in August are unusual for these 2 EMDCs as both have been below 5% in every other month this year and remain below 5% for the year to date. Scotland as a whole is slightly above the <5% target for the year to date at 5%. Four divisions, East Central, West EMDC, North East and West Central are also above the <5% target. Again the West EMDC has recorded the highest year to date rate at 8.4%.
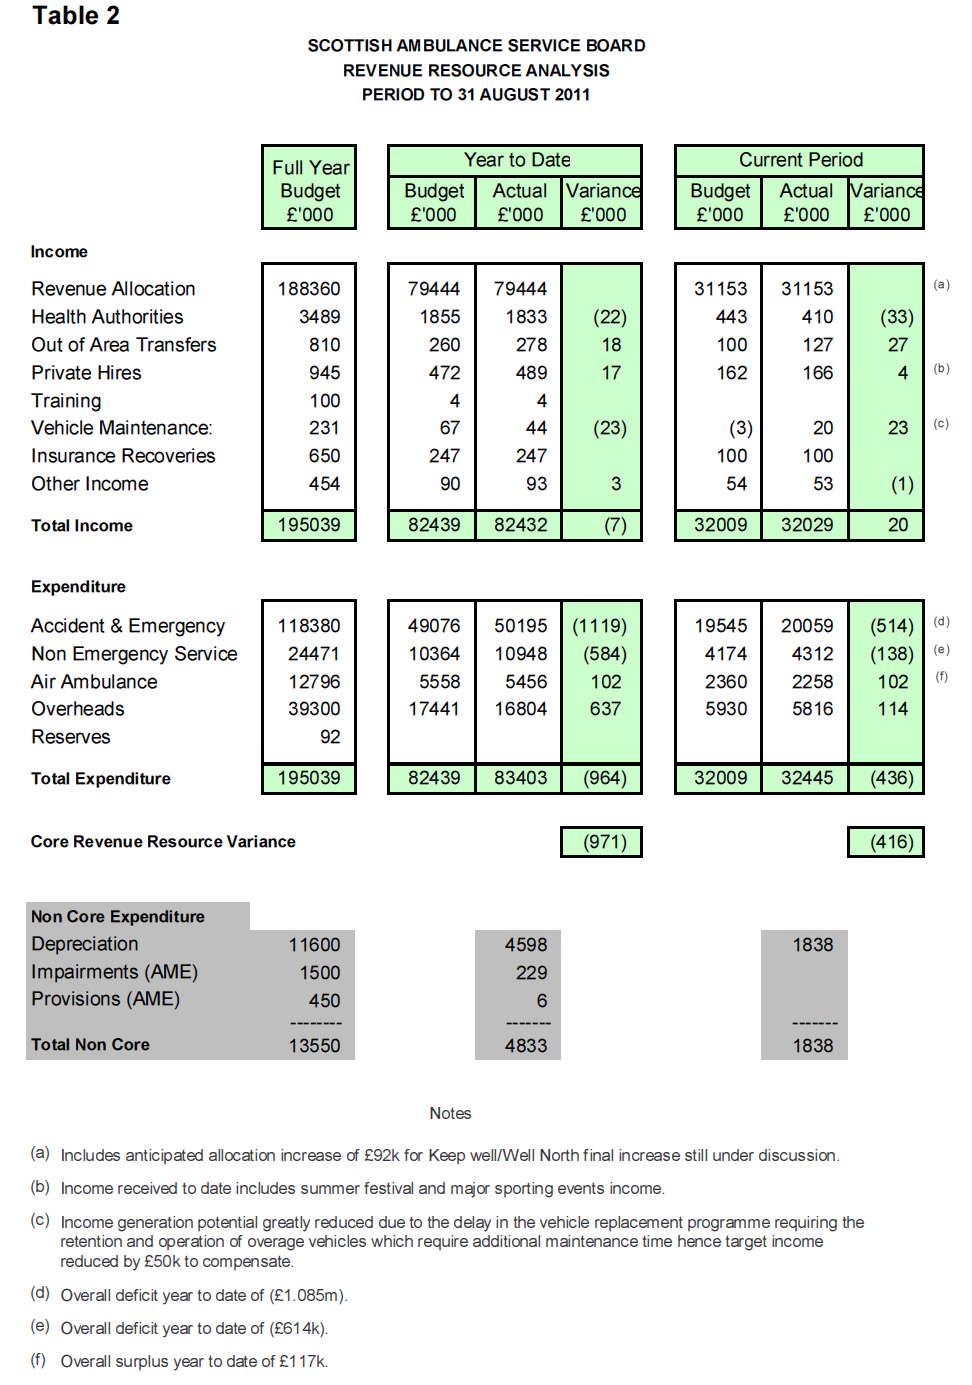
10 HEAT TARGET E5: MEET FINANCIAL TARGETS (OD4 and OD5) REPORT TO SCOTTISH AMBULANCE SERVICE BOARD BY PAMELA McLAUCHLAN, DIRECTOR OF FINANCE AND LOGISTICS FINANCIAL PERFORMANCE TO 31 AUGUST 2011 Introduction This paper sets out the financial position at 31 August 2011 for the Scottish Ambulance Service in terms of the three financial targets. The paper also covers related targets such as the Cash Releasing Efficiencies. Summary The summary outturn figures are shown in Table 1 below. Table 1 Summary performance against financial targets Limit Under/(over)spend 000 Core Revenue Resource (971) Capital Resource 0 Cash balance 382 Core Revenue Resource Analysis The 31 August 2011 position reflects a very significant overspend position for the first five months of the year of 971k against the core Revenue Resource limit. This position has been impacted by: the additional public holiday in April which has a total cost of 600k; additional resourcing for the Royal wedding in July of 50k; the additional cost pressures from diesel pricing of 195k year to date; and the additional payments to volunteer drivers per the government CEL of 205k. All of these cost pressures materialised after the Board had
11 established its current year budget. Whilst 650k will be non-recurring, this will have to be recovered within the current financial year. Income is under-recovered by 7k, in the main through reduced income from repairs and servicing within the Fleet department. Total Pay is overspent by 973k, having worsened by 431k from June Basic pay is slightly overspent by 4k However, overtime is significantly overspent by 954k. 650k of this is due to the additional public holiday and additional cover in Edinburgh in July. The graphs showing divisional overspend by month are shown below. From these, it can be seen that West Central and North Divisions had higher overtime expenditure in July and August than in the previous 17 months. The North has a high number of vacancies - 18WTE - which accounts for some of the overtime used. West Central had high levels of sickness in June and July of 7.1% and 7.4%, impacting the overtime used. However, the dependence on overtime is not sustainable in the short or medium term. All of the Divisions have prepared financial recovery plans which are being updated to incorporate the Workforce Planning Learn and Improve findings. The key areas of action thus are focused on annual leave planning and management; relief management, authorisation and management of overtime. A summary of actions is included in Appendix 1. 11
12 Overtime Spend by Division 250, , , ,000 50,000 0 April 2010 May 2010 June 2010 July 2010 August 2010 September 2010 October 2010 November 2010 December 2010 January 2011 February 2011 March 2011 April 2011 May 2011 June 2011 July 2011 August 2011 Month North Division East Central Division West Central Division South East Division South West Division In relation to non-pay, the overall position is an underspend of 8k. Ambulance Car service is overspent by 77k. This is due to government guidance to increase the amount paid to volunteers by 5p a mile up to the first 10,000 miles. This will create a cost pressure of 205k in a full year. Consumables are overspent by 65k due to additional items purchased to ensure compliance with infection control standards. Fleet maintenance is also of concern with a 60k overspend. However, this can be explained as being due to the older vehicles still being maintained. This is expected to reduce considerably from October as the new vehicles are now operational in parts of Scotland, with five per week coming on stream.. 12
13 The key areas of significant underspend are: Air Ambulance is currently underspent by 64k due to a rebate on last year s contract of 75k Cleaning consumables are underspent by 20k Printing and Stationery are underspent by 20k Hire of vehicles is underspent by 20k Radio repairs are also underspent by 32k. This relates to the old radio system and may be funding that is not required this year. The high level organisational position is shown in Table 2. This indicates that the A&E service is 1.1 million overspent. This compares with 960k at the same time last year. 13
14 14

15 Table 3 shows the high level outturn for each Division. From this, it should be noted that all Divisions are overspent, mainly due to their usage of overtime - and there have been supplies movements in, due to diesel and ambulance car. 15

16 BALANCE SHEET Table 4 shows the Balance Sheet, with a cash balance of 382k, which is the level of cash that should be held as the year progresses. 16
17 CAPITAL Table 5 shows the capital position, with Cumbernauld and Helensburgh stations completed during June. Kirkcaldy completed in August. The final accounts for these three projects will go through in September. The Shock boxes (AEDs) have been delivered and the roll out programme is almost complete. Evaluation of the vehicle safes is progressing during the autumn. 17
18 FINANCE TARGETS - CONCLUSION The financial position is of significant concern given the revenue overspend of 971k. Each of the Divisions has a financial recovery plan and areas of non- pay have been examined to put on hold non-essential expenditure until the organisation is in a more financially balanced position. EFFICIENCY TARGET The Scottish Government has set a 3% efficiency target on the Territorial Boards and direct patient care Special Health Boards. This represents a figure of 5.8 million for the Scottish Ambulance Service. However, the requirement to internally fund the additional public holiday means that a further 600k was required for 2011/12. Also other cost pressures have increased the target to 7.07 million. To the end of August 4.7 million has been achieved - or 67% of the annual requirement. Table 1 summarises the cash-releasing savings position at the end of August TARGET DIVISION/DEPT/BUDGET March 2012 '000 REALISED TO DATE August VARIANCE at August '000 '000 Clinical Productivity 2,662 2, Workforce 1, ,247 1, Estates and Facilities Unidentified Savings TOTAL 7,077 4,745 2,332 SAS Target 7,077 SGHD Target 5,850 Drugs and Prescribing Procurement Support Services 18 1,227
19 APPENDIX 1 Areas of Action in Divisional Recovery Plans Whilst there are some specific actions unique to certain Operational Divisions the key areas of action are around the following: Overtime authorisation is at Head of Service level with weekly prospective reviews of resourcing availability and retrospective analysis of cover provided in each area Advancement of shift reviews in line with the demand and resourcing modelling tool Robust application of annual leave policies Implementation of the Workforce Learn and Improve recommendations Consolidation of meetings involving staff side representation Robust monitoring of sickness absence procedures Review of non-frontline posts from the administration Learn and Improve and other work streams Examination of non-pay areas such as: consumables; uniforms; fuel; and equipment replacement to ensure best practice in replacement is being followed Robust monitoring of vehicle accident trends and appropriate action 19
2018 HR & PAYROLL Deadlines
 th (by payment date) EPAF 3rd PARTY FEEDS WTE Approval 2018 HR & PAYROLL s Normal Payroll day s 2017 B1-26 3 * 13-Dec-17 15-Dec-17 n/a n/a n/a 28-Dec-17 29-Dec-17 11:00 AM 16-Dec-2017 29-Dec-2017 JAN 2018
Utility Debt Securitization Authority 2013 T/TE Billed Revenues Tracking Report
 Utility Debt Securitization Authority 2013 T/TE Billed Revenues Tracking Report Billing Budgeted Billed Dollar Percent Month Revenues Revenues Variance Variance Jan 2018 11,943,180.68 12,697,662.47 754,481.79
MPTS Committee meeting, 19 September Annex A: MPTS Performance Dashboard
 Annex A: MPTS Performance Dashboard MPTS Performance Dashboard KPIs Jan Feb Mar Apr May Jun Jul Aug Sep Oct Nov Dec To commence 100% of Interim Orders Tribunal (IOT) hearings within 3 weeks of referral
DEC DASHBOARD. Positive Response Compliance DEC. Compliant Tickets : On-Time Performance Analysis. December % Late.
 Positive Response Compliance 215 Compliant 215 Non-Compliant 216 Compliant 216 Non-Compliant 1% 87% 96% 86% 96% 88% 97% 89% 97% 89% 98% 88% 97% 86% 96% 92% 97% 93% 97% 94% 97% 96% 97% 94% 97% 8% 6% 4%
JAN DASHBOARD. Positive Response Compliance JAN. Compliant Tickets : On-Time Performance Analysis. January % Late.
 Positive Response Compliance 216 Compliant 216 Non-Compliant 217 Compliant 217 Non-Compliant 1% 96% 97% 8% 6% 4% 2% 4% 3% FEB MAR APR MAY JUN JUL AUG SEP OCT NOV DEC 8% Late Compliant Tickets : On-Time
Company A Company A. Company A Board Meeting Presentation 12 th May 20XX
 Board Meeting Presentation 12 th May 20XX Table of Contents CEO Overview Business Dashboard Quarterly Financials & forecasts Sales and Marketing Quarter specific items Strategic update: D2C Risk and Underwriting
January 2019 FY Key Performance Report
 January 2019 FY 2019 - Key Performance Report Management Notes: The information in this report is based on the FY 2019 Operating Budget, adopted by the Board on June 11, 20. RT s farebox recovery ratio
A review of 2015 fatal collision statistics as of 31 December 2015
 A review of fatal collision statistics as of 31 December This report summarises the main trends in road fatalities that have emerged in. This has been prepared by the Road Safety Authority following analysis
Wisconsin 511 Traveler Information Annual Usage Summary January 3, Wisconsin 511 Phone Usage ( )
") Wisconsin 511 Traveler Information 211 Annual Usage Summary January 3, 212 Overall to-date Summary 36 months of operation 1,16,63 total calls the 1 Million mark was passed on December 3, 212 3,627,527
Wisconsin 511 Traveler Information 211 Annual Usage Summary January 3, 212 Overall to-date Summary 36 months of operation 1,16,63 total calls the 1 Million mark was passed on December 3, 212 3,627,527
September 2018 FY Key Performance Report
 September 20 FY 2019 - Key Performance Report Management Notes: The information in this report is based on the FY 2019 Operating Budget, adopted by the Board on June 11, 20. RT s farebox recovery ratio
MAR DASHBOARD MAR. Compliant % Breakdown Mar % Late % On-time MAR APR MAY JUN JUL AUG SEP OCT NOV DEC
 Positive Response Compliance 215 Compliant 215 Non-Compliant 216 Compliant 216 Non-Compliant 1% 87% 96% 86% 96% 88% 97% 89% 89% 88% 86% 92% 93% 94% 96% 94% 8% 6% 4% 2% 13% JAN 4% 14% FEB 4% 12% 3% 11%
Performance Measures Year End 2018
 Performance Measures Year End 2018 Priorities 1. Earn and Retain the Community s Trust 2. Provide Excellent Customer Service 3. Exemplify Financial Stewardship 4. Ensure Safety 5. Enable Organizational
September 2016 Financial Results
 September 2016 Financial Results Unaudited financial results for the one months ending 30 September 2016 Contents Executive Summary......... 1 Statement of Activities (Budget).. 3 Statement of Activities
COMPARISON OF FIXED & VARIABLE RATES (25 YEARS) CHARTERED BANK ADMINISTERED INTEREST RATES - PRIME BUSINESS*
 CHARTERED BANK ADMINISTERED INTEREST RATES - PRIME BUSINESS*") COMPARISON OF FIXED & VARIABLE RATES (25 YEARS) Fixed Rates Variable Rates FIXED RATES OF THE PAST 25 YEARS AVERAGE RESIDENTIAL MORTGAGE LENDING RATE - 5 YEAR* (Per cent) Year Jan Feb Mar Apr May Jun Jul
COMPARISON OF FIXED & VARIABLE RATES (25 YEARS) Fixed Rates Variable Rates FIXED RATES OF THE PAST 25 YEARS AVERAGE RESIDENTIAL MORTGAGE LENDING RATE - 5 YEAR* (Per cent) Year Jan Feb Mar Apr May Jun Jul
Goldman Sachs Agricultural Biotech Forum New York, NY. March 7, 2012
 1 Goldman Sachs Agricultural Biotech Forum New York, NY March 7, 2012 2 Forward Looking Statement Warning This presentation contains forward-looking statements about the business, financial condition and
May 2018 FY Key Performance Report
 May 20 FY 20 - Key Performance Report Management Notes: The information in this report is based on the FY 20 Operating Budget, Amendment 2, adopted by the Board on January 22, 20. RT s farebox recovery
NEVADA SLOT MACHINES: HISTORICAL HOLD PERCENTAGE VARIATIONS ANNUAL AND MONTHLY HOLD PERCENTAGES, CENTER FOR GAMING RESEARCH, NOVEMBER 2017
 NEVADA SLOT MACHINES: HISTORICAL HOLD PERCENTAGE VARIATIONS ANNUAL AND MONTHLY HOLD PERCENTAGES, 2004-2017 CENTER FOR GAMING RESEARCH, NOVEMBER 2017 Executive Summary Hold percentage the portion of money
Order No. 55/18 CENTRA GAS MANITOBA INC.: PRIMARY GAS RATE APPLICATION, EFFECTIVE MAY 1, April 26, 2018
 CENTRA GAS MANITOBA INC.: PRIMARY GAS RATE APPLICATION, EFFECTIVE MAY 1, 2018 BEFORE: Larry Ring, Q.C., Panel Chair Marilyn Kapitany, B.Sc.(Hon), M.Sc., Vice Chair Carol Hainsworth, C.B.A., Member Susan
Instances of 1 Minute or Less Between Buses 4 5% 55% 3.9% 3.5% 3.5% 3.5% 2.9% 2.8% Sep- Sep 07 Oct-07 Nov-07 Dec-07 Jan- Jan 08 Feb- Feb 08 Mar-08
 President s Report Monthly Performance Matrix Meeting or exceeding target Within 10% of target Missing target by more than 10% Measure does not have target RIDERSHIP Total Ridership p( (in millions) Rail
Conference Welcome and Introduction
 Conference 2013 Welcome and Introduction Housing stock Present day Owner occupation Private renting 17.5m 4m 66% 15.1% Housing associations Council housing 2.8m 2.2m 26.5m 10.6% 8.3% > 2.8m Social Housing
Performance Measures Year End 2015
 Performance Measures Year End 2015 Priorities and Objectives 1. Earn and Retain the Community s Trust 2. Provide Excellent Customer Service 3. Enable Organizational Success 4. Exemplify Financial Stewardship
FINANCIAL ANALYSIS. Stoby
 FINANCIAL ANALYSIS Stoby INVESTMENTS AND FINANCING Investments planned over the period : Investments 2018 2019 2020 2021 Intangible assets Company creation 1 500 Web platform development 8 290 Accounting
Farmland Booms and Busts: Will the Cycle be Broken?
 Farmland Booms and Busts: Will the Cycle be Broken? Kansas Society of Farm Managers and Rural Appraisers Salina, KS February 23 rd, 2012 Brian C. Briggeman Associate Professor and Director of the Arthur
Auckland Transport Monthly Indicators Report 2018/19
 Attachment 1 Auckland Transport Monthly Indicators Report 218/19 August 218 Table of Contents Page 2. 1. Summary of indicators 1.1 SOI performance measures 1.2 AT Metro patronage breakdown 2. Monthly indicators
JULY 2013 RIDERSHIP REPORT MTA METRO-NORTH RAILROAD EXECUTIVE SUMMARY
 Ridership Report JULY 2013 RIDERSHIP REPORT MTA METRO-NORTH RAILROAD EXECUTIVE SUMMARY July July 2013 Total MNR System Ridership was 7.346 million vs. 7.439 million in July 2012, a decrease of 92,959 passengers
REVENUE & RIDERSHIP REPORT SEPTEMBER 2018
 REVENUE & RIDERSHIP REPORT SEPTEMBER 2018 Year-to-date passenger revenue 1.3% above last year Year-to-date ridership 2.1% below last year 1,500 SEPTA RIDERSHIP PERFORMANCE Average Daily Rides in 000's
Economic Overview. Melissa K. Peralta Senior Economist April 27, 2017
 Economic Overview Melissa K. Peralta Senior Economist April 27, 2017 TTX Overview TTX functions as the industry s railcar cooperative, operating under pooling authority granted by the Surface Transportation
County of Orange Resources and Development Management Department Harbors, Beaches and Parks. Strategic Plan. HBP Strategic Plan Workshop 1.
 County of Orange Resources and Development Management Department Harbors, Beaches and Parks Strategic Plan HBP Strategic Plan Workshop 1 v18 PRESENTATION OUTLINE Harbors, Beaches & Parks (HBP) History
Real Estate and Economic Outlook
 Real Estate and Economic Outlook Lawrence Yun, Ph.D. Chief Economist NATIONAL ASSOCIATION OF REALTORS Presentation at Inforum Outlook Conference University of Maryland College Park, MD December 12, 2013
M A N I T O B A ) Order No. 123/13 ) THE PUBLIC UTILITIES BOARD ACT ) October 22, 2013
 Order No. 123/13 ) THE PUBLIC UTILITIES BOARD ACT ) October 22, 2013") M A N I T O B A ) Order No. 123/13 ) THE PUBLIC UTILITIES BOARD ACT ) BEFORE: Régis Gosselin, B ès Arts, MBA, CGA, Chair Larry Soldier, Member Marilyn Kapitany, B.Sc. (Hon), M.Sc., Member CENTRA GAS MANITOBA
M A N I T O B A ) Order No. 123/13 ) THE PUBLIC UTILITIES BOARD ACT ) BEFORE: Régis Gosselin, B ès Arts, MBA, CGA, Chair Larry Soldier, Member Marilyn Kapitany, B.Sc. (Hon), M.Sc., Member CENTRA GAS MANITOBA
BMO Capital Markets 2013 Farm to Market Conference New York, New York. May 14, 2013
 0 BMO Capital Markets 2013 Farm to Market Conference New York, New York May 14, 2013 1 Forward Looking Statement Warning This presentation contains forward-looking statements about the business, financial
Riverside Rising Economic Outlook for the Region April 2015
 Analysis. Answers Riverside Rising Economic Outlook for the Region April 2015 Beacon Economics, LLC California fact versus fiction Looking back a few years (2009 / 2010) everyone was saying that CA would
REVENUE & RIDERSHIP REPORT NOVEMBER 2017
 REVENUE & RIDERSHIP REPORT NOVEMBER 2017 November ridership and revenue 1.9% and 2.2% below budget Depressed ridership last November from a six-day City Transit strike Year-to-date revenue 3.2% and ridership
The 2019 Economic Outlook Forum The Outlook for MS
 The 2019 Economic Outlook Forum The Outlook for MS February 2019 Mississippi University Research Center Mississippi Institutions of Higher Learning Darrin Webb, State Economist dwebb@mississippi.edu (601)432-6556
BMO Capital Markets New York Road Show New York, New York. December 5, 2013
 0 BMO Capital Markets New York Road Show New York, New York December 5, 2013 1 Forward Looking Statement Warning This presentation contains forward-looking statements about the business, financial condition
KC Scout Kansas City s Bi-State Transportation Management Center
 KC Scout Kansas City s Bi-State Transportation Management Center Operations Report May 216 This report contains statistical and operational data of activities at the Scout TMC for the period Sunday, May
How customer behaviour is changing
 DIANE WEHRLE Marketing & Insights Director How customer behaviour is changing www.spring-board.info www. spring-board.info SPRINGBOARD Data and insights on customer activity, and store and retail destination
Environmental Health & Safety
 Environmental Health & Safety Oklahoma State University AUTOMATED EXTERNAL DEFIBRILLATOR (AED) MANAGEMENT PROGRAM Environmental Health and Safety University Health Services Suite 002 Stillwater, OK 74078
CYCLING SCOTLAND SCOTTISH CHARITY NO.SCO Annual Cycling Monitoring Report
 CYCLING SCOTLAND SCOTTISH CHARITY NO.SCO29760 Annual Cycling Monitoring Report 2018 Annual Cycling Monitoring Report 2018 4 CYCLING SCOTLAND Annual Cycling Monitoring Report 2018 National cycling.scot
Goldman Sachs Eighteenth Annual Agribusiness Conference New York, New York. March 12, 2014
 0 Goldman Sachs Eighteenth Annual Agribusiness Conference New York, New York March 12, 2014 1 Forward Looking Statement Warning This presentation contains forward-looking statements about the business,
b Number issued 200,000 (marked with * in the attached appendix) Exercise price is as set out in the appendix
 Exercise price is as set out in the appendix") www.sli-systems.com Level 1, EPIC 78 106 Manchester Street Christchurch New Zealand Phone: 0800 754 797 Fax:03 961 3262 22 May 2018 Client Market Services NZX Limited WELLINGTON By NZ MAP NOTIFICATION
www.sli-systems.com Level 1, EPIC 78 106 Manchester Street Christchurch New Zealand Phone: 0800 754 797 Fax:03 961 3262 22 May 2018 Client Market Services NZX Limited WELLINGTON By NZ MAP NOTIFICATION
Commercial real estate sales down from robust 2017 activity
 News Release Commercial real estate sales down from robust 2017 activity Vancouver, B.C. June 21, 2018 Commercial real estate sales in the Lower Mainland declined in the first quarter (Q1) of 2018 compared
The expenditure exceeds the income generated, creating an annual shortfall of around 17,447 per annum.
 Dear Parents, 24th January 2018 It is with a heavy heart that we have to inform you that the swimming pool, based at Mundesley Infant school will close at the end of this term (March 28th 2018). Throughout
Overview of tuna fisheries in the Western and Central Pacific Ocean, including economic conditions 2015 (WCPFC-SC /GN WP-1)
") Overview of tuna fisheries in the Western and Central Pacific Ocean, including economic conditions 2015 (WCPFC-SC12-2016/GN WP-1) Peter Williams1 and Peter Terawasi2 Co-presented by Dr Chris Reid Twelfth
Overview of tuna fisheries in the Western and Central Pacific Ocean, including economic conditions 2015 (WCPFC-SC12-2016/GN WP-1) Peter Williams1 and Peter Terawasi2 Co-presented by Dr Chris Reid Twelfth
Bob Costello Chief Economist & Vice President American Trucking Associations. Economic & Motor Carrier Industry Trends. September 10, 2013
 Bob Costello Chief Economist & Vice President American Trucking Associations Economic & Motor Carrier Industry Trends September 10, 2013 The Freight Economy Washington continues to be a headwind on economic
RTC TRANSIT OPERATING STATISTICS RTC RIDE RTC RAPID RTC INTERCITY SIERRA SPIRIT
 RTC TRANSIT OPERATING STATISTICS RTC RIDE RTC RAPID RTC INTERCITY SIERRA SPIRIT September 218 RTC TRANSIT OPERATING STATISTICS REPORT TABLE OF CONTENTS RTC Transit Highlights... Page ii RTC Transit Summary...
STAFF REPORT ACTION REQUIRED. Public Works and Infrastructure Committee. General Manager, Transportation Services
 STAFF REPORT ACTION REQUIRED Revised PW9.13 Street Sweeper Evaluation Results and Operational Considerations Date: October 21, 2015 To: From: Wards: Reference Number: Public Works and Infrastructure Committee
US Economic Activity
 US Economic Activity GDP has been in positive territory for seven consecutive quarters, and the advance estimate shows the US economy grew at a 1.0% rate in the fourth quarter 2015. US Economic Activity
2018 Annual Economic Forecast Dragas Center for Economic Analysis and Policy
 2018 Annual Economic Forecast Dragas Center for Economic Analysis and Policy PRESENTING SPONSOR EVENT PARTNERS 2 The forecasts and commentary do not constitute an official viewpoint of Old Dominion University,
NHS SPENDING ENGLAND Question 1. a) What is the Annual net expenditure on the NHS from 1997/98 to 2007/08 in England?
 What is the Annual net expenditure on the NHS from 1997/98 to 2007/08 in England?") NHS SPENDING ENGLAND Question 1. a) What is the Annual net expenditure on the NHS from 1997/98 to 2007/08 in England? Net NHS Expenditure in England in bn bn 100 80 60 40 20 0 1997/98 1998/99 1999/00 2000/01
NHS SPENDING ENGLAND Question 1. a) What is the Annual net expenditure on the NHS from 1997/98 to 2007/08 in England? Net NHS Expenditure in England in bn bn 100 80 60 40 20 0 1997/98 1998/99 1999/00 2000/01
UNIVERSITY OF CALIFORNIA Economics 134 DEPARTMENT OF ECONOMICS Spring 2018 Professor David Romer
 UNIVERSITY OF CALIFORNIA Economics 134 DEPARTMENT OF ECONOMICS Spring 2018 Professor David Romer LECTURE 2 OVERVIEW OF THE GREAT DEPRESSION January 22, 2018 I. THE 1920S A. GDP growth and inflation B.
Traffic Safety Plan Traffic Safety Plan 2015
 Traffic Safety Plan 2015 Purpose Airdrie s last Traffic Safety Plan was created in 2011. The 2015 Traffic Safety Plan is a revised model of the traffic operations for the City of Airdrie. The purpose of
August 2018 Las Vegas Strip Gaming Revenue Analysis
 August 2018 Las Vegas Strip Gaming Revenue Analysis Brent Pirosch Director of Gaming Consulting CBRE T: 702.369.4803 brent.pirosch@cbre.com GGG has completed market studies and feasibility studies for
Danish gambling market statistics Third quarter, 2017
 Danish gambling market statistics Third quarter, Third Quarter, 7. december Third Quarter, Danish gambling market statistics 1 Indhold A. Introduction... 2 B. Quarterly market statistics for the Danish
Auckland Transport Monthly Indicators Report 2018/19
 Attachment 1 Auckland Transport Monthly Indicators Report 218/19 October 218 Table of Contents Page 2. 1. Summary of indicators 1.1 SOI performance measures 1.2 AT Metro patronage breakdown 2. Monthly
The Cairns Economy Recent Trends and Prospects
 MINING, AGRICULTURE, TOURISM, TRANSPORT, CONSTRUCTION, MANUFACTURING, DEFENCE, EDUCATION, ADMINISTRATION, SERVICES The Cairns Economy Recent Trends and Prospects WS (Bill) Cummings PRESENTATION TO Ref:
Sidoti & Company, LLC West Coast Road Show. San Francisco, California
 Sidoti & Company, LLC West Coast Road Show San Francisco, California February 4, 2015 Forward Looking Statement Warning This presentation contains forward-looking statements about the business, financial
Connecting Knowledge. Key Green: achieved Amber: partly achieved Red: not achieved Grey: in development/not applicable. Organisational Effectiveness
 Connectivity Catalogue coverage Enquiries Visitors and Outreach Reading Room visits Media Profile Use of website Use of Collections Connecting Knowledge Key Green: achieved Amber: partly achieved Red:
Goldman Sachs U.S. Emerging/SMID Cap Growth Conference. New York, New York
 Goldman Sachs U.S. Emerging/SMID Cap Growth Conference New York, New York November 20, 2014 Forward Looking Statement Warning This presentation contains forward-looking statements about the business, financial
Manufacturers continue capacity expansion as technology orders grow
 Contact: Penny Brown, AMT, 703-827-5275 pbrown@amtonline.org For Release: September 10, 2018 Manufacturers continue capacity expansion as technology orders grow Manufacturing technology orders for July
RTC TRANSIT OPERATING STATISTICS RTC RIDE RTC RAPID RTC INTERCITY SIERRA SPIRIT
 RTC TRANSIT OPERATING STATISTICS RTC RIDE RTC RAPID RTC INTERCITY SIERRA SPIRIT April 2016 RTC TRANSIT OPERATING STATISTICS REPORT TABLE OF CONTENTS RTC Transit Highlights... Page ii RTC Transit Summary...
Cargo Theft IN ASIA 2013 SUPPLY CHAIN INTELLIGENCE CENTER:
 SUPPLY CHAIN INTELLIGENCE CENTER: Cargo Theft IN ASIA 213 FreightWatch International 51 Capital of Texas Hwy, Suite A2 Austin, Texas 78731 512.225.649 www.freightwatchintl.com INTRODUCTION FreightWatch
State of American Trucking
 State of American Trucking October 11, 2018 Rod Suarez Economic Analyst American Trucking Associations rsuarez@trucking.org Business Cycles U.S. Expansions Duration October 1949 - July 1953 May 1954 -
SOLTRANS BOARD MEETING SUPPLEMENTAL REPORTS / HANDOUTS January 15, 2015 MEETING HANDOUTS
 SOLTRANS BOARD MEETING SUPPLEMENTAL REPORTS / HANDOUTS January 15, 2015 MEETING HANDOUTS Agenda Item 10 January 2015 System Improvements Update - PowerPoint Presentation Agenda Item 12 Construction Projects
Contents. Long term trend in footfall. Black Friday. High Street Footfall. Footfall influences and drivers. Shopping Centre Footfall.
 2015 Footfall Review Contents 01 Long term trend in footfall 05 High Street Footfall 09 Black Friday 02 Footfall influences and drivers 06 Shopping Centre Footfall 10 Christmas Review 03 Vacancy Rates
RF Timeline for July 2018
 RF Timeline for July 2018 Jul 04 2018 Independence Day Jul 11 2018 Info session RF Report send date Jul 16 2018 Application period opens Jul 15 2018 990 Disclosure due date Jul 19 2018 RF Overview/ New
Preston s Edmond Market Report
 Preston s Edmond arket Report July 2 Prepared By Brian Preston RE/AX Associates obile: 45-826-5725 Office: 45-359-87 bpreston88@sbcglobal.net www.edmond4sale.com Realtor of the Year 1995 & 22 Lifetime
SWISS Traffic Figures May 2004
 SWISS Traffic Figures May 2004 SWISS continues seat load factor improvement in May SWISS s load factor for May was 4.8 percentage points better than for the same period last year. Seat load factor for
Key statistics from the National Cardiac Arrest Audit 2016/17
 Key statistics from the National Cardiac Arrest Audit 216/17 Supported by Resuscitation Council (UK) and Intensive Care National Audit & Research Centre (ICNARC) Data collection scope (NCAA Version 1.3)
GIVING GEORGIANS A CHOICE TO KEEP MOVING
 GIVING GEORGIANS A CHOICE TO KEEP MOVING I-85 Express Lanes Annual Performance Report FISCAL YEAR 2014 (JULY 1, 2013 JUNE 30, 2014) EEP OVING VISION AND MISSION Enhancing mobility in Georgia by providing
Mr. Joseph J. Lhota Chairman Metropolitan Transportation Authority 2 Broadway New York, NY Re: Train On-Time Performance Report 2017-F-8
 September 27, 2017 Mr. Joseph J. Lhota Chairman Metropolitan Transportation Authority 2 Broadway New York, NY 10004 Re: Train On-Time Performance Report 2017-F-8 Dear Mr. Lhota: Pursuant to the State Comptroller
Scottish Hyperbaric Medical Service Strategic Context and Overview
 Meeting: NoSPG Date: 19 th June 2013 Item: 16/13 (ii) Scottish Hyperbaric Medical Service Strategic Context and Overview Background & Aim of the paper The provision of hyperbaric medicine has been discussed
2009 Forecast for the Chicago CBD
 TR Mandigo & Company 2009 Forecast for the Chicago CBD Presented to: Council of Chicago Hotel General Managers By Ted Mandigo Director of TR Mandigo & Company 8/4/2009 Let s cut to the chase. There s a
ANNEX1 The investment required to achieve the Government s ambition to double cycling activity by 2025
 ANNEX1 The investment required to achieve the Government s ambition to double cycling activity by 2025 May 2016 About Sustrans Sustrans makes smarter travel choices possible, desirable and inevitable.
2010 Credit Suisse Holiday Conference December 7, 2010
 2010 Credit Suisse Holiday Conference December 7, 2010 Forward Looking Statements The Company claims the protection of the safe-harbor for forward-looking statements within the meaning of the Private Securities
PUBLIC AGENDA STREET ACTIVITY STEERING COMMITTEE
 PUBLIC AGENDA STREET ACTIVITY STEERING COMMITTEE Wednesday, March 16, 2016, 12:00 p.m. Committee Room E, Ground Floor, City Hall Members Ms. S. Marchildon, Chair Ms. V. Charles Inspector R. Friesen Mr.
2018 Annual Economic Forecast Dragas Center for Economic Analysis and Policy
 2018 Annual Economic Forecast Dragas Center for Economic Analysis and Policy PRESENTING SPONSOR EVENT PARTNERS 2 The forecasts and commentary do not constitute an official viewpoint of Old Dominion University,
The Onychomycosis Market (2018 Edition) September 2018
 September 2018") The Onychomycosis Market (2018 Edition) September 2018 The US Onychomycosis Market:Coverage Executive Summary and Scope Introduction/Market Overview Global Market Analysis The US Market Analysis Competitive
The Onychomycosis Market (2018 Edition) September 2018 The US Onychomycosis Market:Coverage Executive Summary and Scope Introduction/Market Overview Global Market Analysis The US Market Analysis Competitive
ENERGY BILL ORGANIZATION
 1,2, 1,, 8, 6, 4, 2, 4 4 4 6, 5, 4, 3, 2, 1, 1 Why bother? any facilities don t ever see their bills 6, 4, 2, Disconnect between plant and corporate offices Disconnect between operations and accounting
Principles of Planning. F.P.Furniss
 Principles of Planning Learning Outcomes Understand the principals in why Planning and Periodization is important to deliver successful performances Understand the concept of Macro/ Meso and Micro cycle
MARKET AND CAPACITY UPDATE. Matthew Marsh September 2016
 MARKET AND CAPACITY UPDATE Matthew Marsh September 2016 1980 1981 1982 1983 1984 1985 1986 1987 1988 1989 1990 1991 1992 1993 1994 1995 1996 1997 1998 1999 2000 2001 2002 2003 2004 2005 2006 2007 2008
Nasdaq Dubai AED TRADING HOLIDAYS AND SETTLEMENT CALENDAR 2018 For Equities Outsourced to the DFM (T+2)
") NasdaqDubai Circular No: 14 /2018 Date of Issue: 13 March 2018 Date of Expiry : Upon issue of replacement Circular Nasdaq Dubai AED TRADING HOLIDAYS AND SETTLEMENT CALENDAR 2018 For Equities Outsourced
NasdaqDubai Circular No: 14 /2018 Date of Issue: 13 March 2018 Date of Expiry : Upon issue of replacement Circular Nasdaq Dubai AED TRADING HOLIDAYS AND SETTLEMENT CALENDAR 2018 For Equities Outsourced
The Herzliya Conference The Economic Dimension Prof. Rafi Melnick Provost, Interdisciplinary Center (IDC) Herzliya
 Herzliya") The Herzliya Conference The Economic Dimension 2009 Provost, Interdisciplinary Center (IDC) Herzliya The Big Issues The broken crystal ball A crisis that happens once in 100 years From a country oriented
The Herzliya Conference The Economic Dimension 2009 Provost, Interdisciplinary Center (IDC) Herzliya The Big Issues The broken crystal ball A crisis that happens once in 100 years From a country oriented
A comment on recent events, and...
 A comment on recent events, and... where we are in the current economic cycle November 15, 2016 Mark Schniepp Director Likely Trump Policies $4 to $5 Trillion in tax cuts over 10 years to corporations,
Mayor Mike T. Huether March 31, 2016
 Mayor Mike T. Huether March 31, 2016 Sioux Falls Is Very Strong Financially General Revenues $160 $140 $120 $107.9 $112.1 $110.9 $115.4 $118.9 $125.3 $139.9* $138.0 $143.9 $100 $97.2 Millions $80 $60 $40
Kevin Thorpe Financial Economist & Principal Cassidy Turley
 Kevin Thorpe Financial Economist & Principal Cassidy Turley Economic & Commercial Real Estate Outlook Kevin Thorpe, Chief Economist 2012 Another Year Of Modest Improvement 2006Q1 2006Q3 2007Q1 2007Q3 2008Q1
Ventura County Grand Jury
 Ventura County Grand Jury 2016-2017 May 25, 2017 This page intentionally blank Summary The 2016-2017 Ventura County Grand Jury (Grand Jury) received a complaint regarding the operation of the red light
BMO Capital Markets 2014 Farm to Market Conference New York, New York. May 21, 2014
 0 BMO Capital Markets 2014 Farm to Market Conference New York, New York May 21, 2014 1 Forward Looking Statement Warning This presentation contains forward-looking statements about the business, financial
6 th Meeting of the Scientific Committee Puerto Varas, Chile, 9-14 September 2018
 6 th Meeting of the Scientific Committee Puerto Varas, Chile, 9-14 September 218 SC6-Doc24 China s Annual Report, part II (Jumbo squid) Gang Li, Bilin Liu, Luoliang Xu & Xinjun Chen Annual Report of China
Annual results Accell Group 2016
 Annual results Accell Group 2016 Amsterdam, 10 March 2017 René J. Takens, CEO Hielke H. Sybesma, CFO Agenda 1. Key results 2016 2. Strategy 3. Outlook 10 March 2017 Accell Group N.V. presentation annual
INDUSTRY OVERVIEW F I N A N C I A L C O M M U N I T Y P R E S E N T A T I O N M A Y 2 2,
 INDUSTRY OVERVIEW BOB WELLS SENIOR VICE PRESIDENT, CORPORATE COMMUNICATIONS & PUBLIC AFFAIRS Forward-Looking Statement The presentations today will contain certain forward-looking statements," within the
INTERIM RESULTS. December 2017 WINTER OLYMPICS. Pae 1 Photosport.nz
 INTERIM RESULTS December 2017 WINTER OLYMPICS Pae 1 Photosport.nz NET PROFIT 70.0 66.7 60.0 Millions 59.5 50.0 40.0 30.0 20.0 10.0 - Dec-16 Dec-17 WINTER OLYMPICS Page 2 Photosport.nz PROGRAMMING COSTS
Economy On The Rebound
 Economy On The Rebound Robert Johnson Associate Director of Economic Analysis November 17, 2009 robert.johnson@morningstar.com (312) 696-6103 2009, Morningstar, Inc. All rights reserved. Executive
Properties. terc.ucdavis.edu 8
 Physical Properties 8 Lake surface level Daily since 1900 The lowest lake level on record was 6,220.26 feet on Nov. 30, 1992. Since 1900, lake level has varied by more than 10 feet. Lake level typically
Commercial real estate sales decline and price activity varies across the Lower Mainland
 News Release Commercial real estate sales decline and price activity varies across the Lower Mainland VANCOUVER, BC December 7, 2018 Commercial real estate sales in the Lower Mainland declined in the third
Encouraging Taxi Drivers to Behave: Grafton Bridge Taxi and Bus Lane Trial. Rob Douglas-Jones Tim Segedin, Edin Ltd.
 Encouraging Taxi Drivers to Behave: Grafton Bridge Taxi and Bus Lane Trial Rob Douglas-Jones Tim Segedin, Edin Ltd. 2.1km 12 mins Hospital 1.5km 9 mins To Newmarket 5 500 bikes per day 500 pedestrians
Hotel Industry Update. Stephen Hennis, CHA, ISHC
 Hotel Industry Update Stephen Hennis, CHA, ISHC 1 Through Aug 2012: Strong Results Despite Headwinds % Change Room Supply* 1.2 bn 0.4% Room Demand* 741 mm 3.3% Occupancy 63% 2.9% A.D.R. $106 4.3% RevPAR
CAPE TOWN MARATHON 2013 SUB 4 HOUR TRAINING PROGRAMME
 CAPE TOWN MARATHON 2013 SUB 4 HOUR TRAINING PROGRAMME This marathon plan is designed for runners who currently run 30 to 40 kilometers and whose goal is to complete the marathon distance in under 4 hours.
Southwest Ohio Regional Economy in Context. Richard Stock, PhD. Business Research Group
 Southwest Ohio Regional Economy in Context Richard Stock, PhD. Business Research Group State of the Metro Area (in January Each Year) Total Employment has slowly increased in the last three years after
Dr. James P. Gaines Research Economist recenter.tamu.edu
 Texas Uncertain Economy in a World of Uncertain Oil Prices Dr. James P. Gaines Research Economist recenter.tamu.edu National Economic Recovery still Going 2 U.S. Outlook Expected GDP growth still modest: