Non-motorized Transportation Planning Resource Book Mayor s Task Force on Walking and Bicycling City of Lansing, Michigan Spring 2007 pg.
|
|
|
- Alan Booker
- 5 years ago
- Views:
Transcription
1 Non-motorized Transportation Planning Resource Book pg. 105 of 158
2 Non-motorized Transportation Planning Resource Book pg. 106 of 158
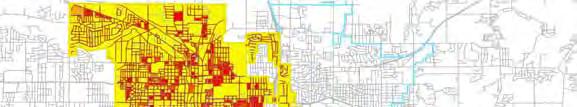
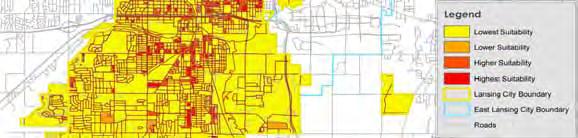
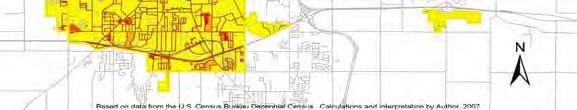
3 Non-motorized Transportation Planning Resource Book pg. 107 of 158 It should be noted that this pattern does not develop in a set of strictly geometric concentric circles or rings: higher density blocks and neighborhoods also appear to cluster around major automobile thoroughfares especially Grand River, Saginaw, Michigan, Pennsylvania, Cedar, and Martin Luther King Jr. Land use diversity, the final land use component considered in this report, adds another layer of description to these observations. Land uses within the city appear to be quite segregated from one another. Even within many higher density, high connectivity neighborhoods or districts, individual blocks tend have few land uses: they are either residential or commercial. In fact, the mode for the distribution of land use diversity values was 1. This value is not an index it represents the actual number of land uses indicated on the City zoning map within a given census block. Looking at the Land Use Diversity map confirms this statistic. Although land uses within and across Lansing s neighborhoods do not appear to be very integrated on a citywide scale, it is important to acknowledge the types of places where they are integrated. Census blocks exhibiting greater land use diversity do seem to cluster around major arterials like Cedar on Lansing s south side or Grand River on the city s north side. The Land Use Diversity close up map of Lansing s Old Town neighborhood confirms this observation: land uses along Grand River tend to be more integrated as demonstrated by a higher number of land uses present in a given census block. Moving away from the thoroughfare, however, the number of land uses/census block drops.

4 Non-motorized Transportation Planning Resource Book pg. 108 of 158

5 Non-motorized Transportation Planning Resource Book pg. 109 of 158
6 Non-motorized Transportation Planning Resource Book pg. 110 of 158 These three land use features have been compiled in several maps including Pedestrian/Bicycle Suitability and TCRPC Proposed Facilities, Pedestrian/Bicycle Suitability, Pedestrian/Bicycle Suitability (North), and Pedestrian/Bicycle Suitability (South). These maps show the results of a compositing process in which the three land use variables (Connectivity, Population Density, and Land Use Diversity) are added together and ranked. The (very few) census blocks in red are those possessing higher than average scores in all three categories. Subsequent categories scored above average in fewer of these categories and have been ranked lower to reflect this. The utility of these maps may be constrained by the limitations imposed by the nature of underlying data and methods used to derive meaningful information, but they do raise several important issues. Despite the paucity of highest and higher suitability blocks, there are some areas where land uses appear to be more suitable for NMT. These areas tend to cluster around larger thoroughfares. Higher suitability areas seem to correspond with NMT components proposed by the TCRPC for future construction/enhancement. Judging by the information on average block size presented above, Lansing s older, gridded street pattern seems to be conducive to greater NMT activity.
7 Non-motorized Transportation Planning Resource Book pg. 111 of 158


8 Non-motorized Transportation Planning Resource Book pg. 112 of 158


9 Non-motorized Transportation Planning Resource Book pg. 113 of 158

10 Non-motorized Transportation Planning Resource Book pg. 114 of 158
11 Non-motorized Transportation Planning Resource Book pg. 115 of E. Conclusions Taken together, land use and the features of the built environment strongly affect the prospects of NMT systems in communities throughout the United States. Although the task may seem daunting, and the time horizon for progress in this area may appear much longer term, thoughtful planning now can do much to guide Lansing toward land use patterns conducive to walking and bicycling. For an NMT plan to be successful in Lansing, a strong commitment must be made to address these big issues. Several important lessons for communities who are in the process of planning for NMT can be drawn from the findings of the research discussed above: 1. Traditional neighborhoods generate more pedestrian trips for utilitarian purposes than do modern neighborhoods. Whether this is a matter of self-selection (pedestrians choosing to locate in traditional neighborhoods because they better facilitate pedestrian travel) or directional causality (walkable neighborhoods encourage walking), pedestrian facilities need to be planned for and maintained in traditional neighborhoods. The Pedestrian/Bicycle Suitability and TCRPC Proposed Facilities Map provides a sketch of where some of these neighborhoods might be. 2. Communities interested in long term, permanent modal shift away from privately owned automobiles should seriously consider the type of development they are encouraging through there land use regulations and development programs. Higher density, infill development is preferred. 3. Higher density infill alone does not guarantee NMT friendly urban environments. Communities should be mindful of the quality of such environments and strive to ensure that development is visually pleasing and offers real opportunities for spontaneous social interaction and convenient pedestrian and bicycle travel between broad ranges of destinations. High quality, accessible public space is highly desirable. This is where local knowledge is indispensable, and the Team strongly encourages the Task Force to seek the advice of local residents in defining NMT needs and desires. 4. Because land use patterns in the city of Lansing are shaped by its receding past in heavy industry, closer observation of land use patterns within individual neighborhoods should be performed in order to gain a richer and more accurate understanding of connectivity, population density, and land use diversity and potential consequences for walkability/bikeability.
12 Non-motorized Transportation Planning Resource Book pg. 116 of 158 (3.4) Schools As mentioned in several places above, the presence of school aged children is an important consideration for non-motorized transportation planning. In a time when children attended schools near their homes and fewer families owned fewer automobiles, they relied on buses, walking, and bicycles to get their children to school. Frank, Engelke, and Schmid (2003) have found that children s use of NMT has declined by 40 percent from 1977 to Instigated by a variety of factors, the national average count per person of total hours of traffic delay rose from 0.7 billion in 1982 to 3.6 billion in 2002, representing over a 500% increase (Schrank & Lomax, 2005). Included in these numbers, children are now driven to nearly all their activities, and most now also find other ways to commute to school besides walking or biking. The tables below (See Table 4, next page) is the data collected by students with funding by the Michigan Department of Transportation representing the number of students walking, biking, riding the bus, or being dropped off or picked up by a parent or guardian. 103 Frank, D., P. Engelke, and T. Schmid. (2003). Health and Community Design. Washington D.C.: Island Press.

13 Non-motorized Transportation Planning Resource Book pg. 117 of 158 Table 4
14 Non-motorized Transportation Planning Resource Book pg. 118 of 158 The use of automobiles for transportation to/from school has increased from 16% in 1969 to 46% in 2001 (unpublished data from NPTS and NHTS). The number of cars on the road between 7:15 and 8:15 a.m. increases 30% during the school year (Travel and Environmental Implications of School Siting, 2003) % of morning traffic during the school year is parents driving kids to school (Kallins, SR2S). The distance to school for youth 5-18 years of age in 1969 versus the distance to school for youth 5-18 years of age in 2000 (See Figure 29, next page).104 A smaller percentage of now children live within 1 mile (34% compared to 21%) and 2 miles (52% compared to 35%) of school. This could account for a correlation in the decline of non-motorized transportation to school. In addition, the figure also offers no explanation for the fall in active transportation to school by children who live less than 1 or 2 miles from school. 104 Kids Walk to School: Then and Now. Barriers and Solutions Center for Disease Control. Online.
15 Non-motorized Transportation Planning Resource Book pg. 119 of 158 Figure 29 Youth Distance to School Percent of Youth (Age 5-18) < 1 mile mile mile 3 + miles Distance (Miles) The reason for this is mainly that the journey from home and school has become longer and is often perceived to be not as safe due auto-oriented suburbanization. Consider the following statistics 0% of children hit by cars near schools are hit by cars driven by parents of students (Kallins, SR2S) In 1999, a national Safe Kids Campaign survey found 2/3 of drivers exceeded the posted speed limit in school zones during the 30-minute period before and after school. (National Safe Kids Campaign, 2002) A national observational survey found that many motorists at intersections in school zones and residential neighborhoods violated stop signs (pedestrian injury fact sheet, 2004): 45% by not coming to a complete stop, 37% by rolling through, 7% by not even slowing down.
16 Non-motorized Transportation Planning Resource Book pg. 120 of 158 Considering the customary barriers that have been highlighted, and keeping in mind the concerns of parents, it is important to establish ways to increase the number of children that participate in safe alternatives to motorized transportation. Safe Routes to School is federal program that encourages and gives the opportunity to children, including those with disabilities, to walk and bike to school. The program is promising because it facilitates the planning and developing aspects as well as the implementation of projects that will add to the community s safety. SRTS works simply; schools form local teams, which consists of school administrators, teachers, parents, students, local law enforcement officers and really anyone who is interested in the health and safety of children. The teams work together to address the behaviors of both parents and students and how they get to and from school. The teams than create specific recommendations as they pertain to a particular school districts that eventually lead to plans for making improvements. Each state is responsible to administrating its own SRTS, in Michigan the Safe Routes to School Program is managed by the Michigan Department of Transportation with training, logistical, administrative and technical support from the Governor s Council on Physical Fitness, Health and Sports located in Lansing. As of January 2007, there are 121 Michigan schools registered for Safe Routes to School. Bingham Elementary School (K-5) is the Lansing School Districts lone representative. At this current time Bingham Elementary SRTS program is in its pilot stage, as they are currently putting together a team of school officials, parents, students and volunteers. They hope to program have the implemented by August of Across the country and around Michigan there are a number of comparable and complimentary programs to that of SRTS that are showing signs of great success. I walk or the international Walk to School Day and Week, is a partnership for a Walkable America that started in the U.S in The first National Walk Our Children to School Day was set in Chicago and was modeled after the United Kingdom s success. It started as a day to bring community leaders and kids together and create a sense of awareness for the communities and its need to be walkable. In 2002 just 5 years after it introduction to the U.S, all 50 states have
17 Non-motorized Transportation Planning Resource Book pg. 121 of 158 bought into the program in some degree and the I Walk program has just under 3 million walkers around the world. 105 Another program that is generating a lot of attention for its success is the Walking School Bus program, which works hand in hand with SR2S. A walking school bus is a group of children walking to school with one or more adults. It is simple and it is practical. It can be as informal as a couple of neighborhood families taking turns escorting their children to school or as structured as a set daily route with timed pick-up points and a regular rotated schedule of parents and caretakers. This program is also a great starting point for a community in developing and implementing non-motorized transportation because it is so simple and it is ideal for a city like Lansing. And besides the obvious health benefits of walking for the students and the environment, there could also be a financial benefit to Lansing School District. There would be a real potential for a good cost savings with the elimination of just one bus and one route. A spin off of this great program is the Bicycle Train. The Bicycle Train is parallel to the Walking School Bus, but with children riding their bikes to school and still escorted by a parent or trained volunteers. As mentioned previously, 15% of Lansing residents live at or below the federal poverty level (see section 3.1.C). Of the nine schools identified in the map above, four (Reo, Bingham, Willow, Sheridan) are located in areas that have an above average poverty level. Two of these schools (Reo, Bingham) are also located within areas that have below average levels of access to at least one vehicle (see map Schools with >=80% Non-Bused Students Over Vehicle Access map). Although the data for the percentage of Lansing School District students who walk or bike to school was not obtainable, the available data gathered suggests; above average poverty levels along with low vehicle access in areas where at least 80% of students are not bused, leads to a greater need for the usage of NMT to and from school. 105 National Center for Safe Routes to School
18 Non-motorized Transportation Planning Resource Book pg. 122 of 158 Figure 30
19 Non-motorized Transportation Planning Resource Book pg. 123 of 158
20 Non-motorized Transportation Planning Resource Book pg. 124 of 158
How Policy Drives Mode Choice in Children s Transportation to School
 How Policy Drives Mode Choice in Children s Transportation to School Physical Activity through Active Transportation Ruth L. Steiner 2011 Technical Conference and Exhibit Lake Buena Vista, FL April 3-6,
(3.2) Facilities and Infrastructure
 Facilities and Infrastructure") pg. 79 of 158 (3.2) Facilities and Infrastructure Pedestrian Facilities. At present, the City of Lansing does not maintain a comprehensive GIS inventory of the primary implementation of pedestrian facilities
pg. 79 of 158 (3.2) Facilities and Infrastructure Pedestrian Facilities. At present, the City of Lansing does not maintain a comprehensive GIS inventory of the primary implementation of pedestrian facilities
NASHUA REGIONAL PLANNING COMMISSION REGIONAL BICYCLE AND PEDESTRIAN PLAN
 NASHUA REGIONAL PLANNING COMMISSION REGIONAL BICYCLE AND PEDESTRIAN PLAN June, 2005 Prepared by the Nashua Regional Planning Commission 2005 NRPC Regional Bicycle and Pedestrian Plan- JUNE 2005 ACKNOWLEDGEMENTS
Improve the livability of our streets by
 Pedestrian and Traffic Calming Policy March 2018 2 of 6 Neighborhood Traffic Calming Policy The City of Aspen continually strives to protect multimodal function while maintaining a high standard of safety.
o n - m o t o r i z e d transportation is an overlooked element that can greatly enhance the overall quality of life for the community s residents.
 N o n - m o t o r i z e d transportation is an overlooked element that can greatly enhance the overall quality of life for the community s residents. 84 Transportation CHAPTER 11 INTRODUCTION Transportation
Approaches. Livable Neighborhood Design. Examples. Traditional neighborhood development. CE 594 University of Wisconsin- Milwaukee
 Approaches Livable Neighborhood Design CE 594 University of Wisconsin- Milwaukee Traditional neighborhood design (TND), new urbanism, transit friendly design, transit oriented development and walkable
2016 APS Go! Surveys Summary Results for Oakridge Elementary School
 2016 APS Go! Surveys Summary Results for Oakridge Elementary School This report summarizes results from the 2016 APS Go! surveys for Oakridge Elementary School. Student, parent/caregiver and staff surveys
Agenda. Overview PRINCE GEORGE S PLAZA METRO AREA PEDESTRIAN PLAN
 PRINCE GEORGE S PLAZA METRO AREA PEDESTRIAN PLAN May 28, 2008 Agenda Welcome and introductions Project overview and issue identification Planning context and strengths Design challenges and initial recommendations
PRINCE GEORGE S PLAZA METRO AREA PEDESTRIAN PLAN
 PRINCE GEORGE S PLAZA METRO AREA PEDESTRIAN PLAN May 28, 2008 Agenda Welcome and introductions Project overview and issue identification Planning context and strengths Design challenges and initial recommendations
Madison Urban Area and Dane County. Bicycle Transportation Plan Summary. September Introduction. Bicycle Plan Scope and Planning Process
 Bicycle Transportation Plan Summary Madison Urban Area and Dane County Introduction September 2000 Bicycling is an important mode of transportation in the Madison urban area and countywide that is available
NM-POLICY 1: Improve service levels, participation, and options for non-motorized transportation modes throughout the County.
 Transportation PRINCE WILLIAM COUNTY 2008 COMPREHENSIVE PLAN NON-MOTORIZED PLAN CONTENTS Goals, Policies, and Action Strategies Table 4 (Bike Facility Classifications and Descriptions) Table 5 (Bike Facility
Chapter 2. Bellingham Bicycle Master Plan Chapter 2: Policies and Actions
 Chapter 2 Bellingham Bicycle Master Plan Chapter 2: Policies and Actions Chapter 2: Policies and Actions The Bicycle Master Plan provides a road map for making bicycling in Bellingham a viable transportation
Introduction.
 2307-1.0. Introduction. Delaware s Safe Routes to School (SRTS) Program was established September 10, 2002 when Governor Ruth Ann Minner signed Senate Bill 353 of the 141st General Assembly of Delaware
CITY OF COCOA BEACH 2025 COMPREHENSIVE PLAN. Section VIII Mobility Element Goals, Objectives, and Policies
 CITY OF COCOA BEACH 2025 COMPREHENSIVE PLAN Section VIII Mobility Element Goals, Objectives, and Policies Adopted August 6, 2015 by Ordinance No. 1591 VIII MOBILITY ELEMENT Table of Contents Page Number
Safe Routes to School in New Jersey
 Safe Routes to School in New Jersey The need for Safe Routes to School 1. Fewer kids today walk and bike to school 2. Unintended consequences have resulted 3. SRTS programs can be part of the solution
2016 APS Go! Surveys Summary Results for Arlington Traditional School
 2016 APS Go! Surveys Summary Results for Arlington Traditional School This report summarizes results from the 2016 APS Go! surveys for Arlington Traditional School. Student, parent/caregiver and staff
City of Cape Coral Traffic Calming. City Council May 16,
 City of Cape Coral Traffic Calming City Council May 16, 2016 1 In This Presentation Why Traffic Calming? What is Traffic Calming? Examples Traffic Calming in the City of Cape Coral How to develop a Traffic
TOWN OF PAYSON TRAFFIC CALMING MANUAL
 TOWN OF PAYSON TRAFFIC CALMING MANUAL APPROVED BY THE PAYSON TOWN COUNCIL SEPTEMBER 6, 2007 TOWN OF PAYSON TRAFFIC CALMING POLICY 1.0 Introduction Traffic Calming involves retrofitting physical devices
Why Zone In on Speed Reduction?
 Learn it. Do it. Live it! SPEED REDUCTION IN THE ZONE Why Zone In on Speed Reduction? Speeding is a serious issue that plays a major role in the risk of serious injury and pedestrian fatality in a crash.
County of Spartanburg South Carolina
 County of Spartanburg South Carolina Traffic Calming Program June 2012 (Revised/Program on Hold) PURPOSE The potential negative impacts from vehicular traffic on residential roads have been a longstanding
2010 Pedestrian and Bicyclist Special Districts Study Update
 2010 Pedestrian and Bicyclist Special Districts Study Update Pedestrian and Bicyclist Special Districts Program Overview H-GAC s Special Districts Program aims to provide strategic investments in pedestrian
THESE DAYS IT S HARD TO MISS the story that Americans spend
 WHICH COMES FIRST: THE NEIGHBORHOOD OR THE WALKING? BY SUSAN HANDY AND PATRICIA MOKHTARIAN THESE DAYS IT S HARD TO MISS the story that Americans spend more time stuck in traffic than ever, that they re
City of Elizabeth City Neighborhood Traffic Calming Policy and Guidelines
 City of Elizabeth City Neighborhood Traffic Calming Policy and Guidelines I. Purpose: The City of Elizabeth City is committed to ensure the overall safety and livability of residential neighborhoods. One
2. Context. Existing framework. The context. The challenge. Transport Strategy
 Transport Strategy Providing quality connections Contents 1. Introduction 2. Context 3. Long-term direction 4. Three-year priorities 5. Strategy tree Wellington City Council July 2006 1. Introduction Wellington
Understanding the Pattern of Work Travel in India using the Census Data
 Understanding the Pattern of Work Travel in India using the Census Data Presented at Urban Mobility India Hyderabad (India), November 5 th 2017 Nishant Singh Research Scholar Department of Civil Engineering
Speed Limits Study and Proposal. Public Input Session: 8/14/13
 Speed Limits Study and Proposal Public Input Session: 8/14/13 Why is Decatur a unique place for this project? First Community Transportation Plan in the nation with a Health Impact Assessment. Strong sense
Traffic Safety Barriers to Walking and Bicycling Analysis of CA Add-On Responses to the 2009 NHTS
 Traffic Safety Barriers to Walking and Bicycling Analysis of CA Add-On Responses to the 2009 NHTS NHTS Users Conference June 2011 Robert Schneider, Swati Pande, & John Bigham, University of California
Safe Routes to School Guide
 Safe Routes to School Guide Steps to Creating a Safe Routes to School Program Created February 2007 SafeRoutes National Center for Safe Routes to School This guide was developed by the Pedestrian and Bicycle
CONNECTING PEOPLE TO PLACES
 CONNECTING PEOPLE TO PLACES 82 EAST BENCH MASTER PLAN 07 Introduction The East Bench transportation system is a collection of slow moving, treelined residential streets and major arteries that are the
Pedestrian Survey Report
 Pedestrian Survey Report The City of Albany conducted a Pedestrian Survey in 2007 with the purpose of identifying resident s concerns about barriers to walking and accessibility in the City. The survey
Pocatello Regional Transit Master Transit Plan Draft Recommendations
 Pocatello Regional Transit Master Transit Plan Draft Recommendations Presentation Outline 1. 2. 3. 4. What is the Master Transit Plan? An overview of the study Where Are We Today? Key take-aways from existing
How to Develop a Pedestrian Safety Action Plan
 How to Develop a Pedestrian Safety Action Plan Course Introduction Presented by: Peter Eun FHWA RC Safety Engineer Ryan Snyder President, Ryan Snyder Associates, LLC Paul Zykofsky Director, Land Use and
FACTS AND FIGURES: MAKING THE CASE FOR COMPLETE STREETS IN LEE COUNTY
 FACTS AND FIGURES: MAKING THE CASE FOR COMPLETE STREETS IN LEE COUNTY Safety: Close to 5,000 pedestrians and bicyclists die each year on U.S. roads, and more than 70,000 are injured. [Mean Streets, Surface
Chapter 5. Complete Streets and Walkable Communities.
 Chapter 5. Complete Streets and Walkable Communities. 5.1 Description of Complete Streets. Cities throughout the world, and specifically the United States, are coming to embrace a new transportation and
About the Active Transportation Alliance
 About the Active Transportation Alliance Chicagoland s voice for better biking, walking and transit Founded 1985 7,000 members, ~33 full time staff Serve Chicago metro region 1 More Cars, More Driving
City of Novi Non-Motorized Master Plan 2011 Executive Summary
 City of Novi Non-Motorized Master Plan 2011 Executive Summary Prepared by: February 28, 2011 Why Plan? Encouraging healthy, active lifestyles through pathway and sidewalk connectivity has been a focus
Key objectives of the survey were to gain a better understanding of:
 3 COMMUNITY INPUT Community input is an essential part of corridor studies. For the SR 87 corridor study, VTA staff conducted an extensive online survey of people living and commuting along the corridor.
Society for Behavioral Medicine, New Orleans, LA. April 12, 2012
 The Impact of the Built Environment and Safe Routes to School-Related Policies on Youth Active Travel in a National Sample of Public Elementary Schools Society for Behavioral Medicine, New Orleans, LA
Integrated Corridor Approach to Urban Transport. O.P. Agarwal World Bank Presentation at CODATU XV Addis Ababa, 25 th October 2012
 Integrated Corridor Approach to Urban Transport O.P. Agarwal World Bank Presentation at CODATU XV Addis Ababa, 25 th October 2012 What is the Integrated Corridor Approach for Urban Transport Public? Why
CHAIR AND MEMBERS CIVIC WORKS COMMITTEE MEETING ON APRIL 25, 2016
 TO: FROM: SUBJECT: CHAIR AND MEMBERS CIVIC WORKS COMMITTEE MEETING ON APRIL 25, 2016 JOHN BRAAM, P. ENG. MANAGING DIRECTOR, ENVIRONMENTAL & ENGINEERING SERVICES AND CITY ENGINEER SCHOOL ZONE SPEED LIMIT
Lisa Quinn Executive Director
 Transforming Injury and Violence Prevention: Innovations in Policy, Practice, and Partnerships Advocating for Prevention: Enacting and Reacting to Legislation Lisa Quinn Executive Director Feet First works
COMMUNITY PEDESTRAIN SAFETY TRAINING. Long Beach June 5 th, 2010
 COMMUNITY PEDESTRAIN SAFETY TRAINING Long Beach June 5 th, 2010 Long Beach The City of Long Beach is located in Los Angeles County, Southern California. Long Beach is currently home to 462,604 persons
Connecting Sacramento: A Trip-Making and Accessibility Study
 Connecting Sacramento: A Trip-Making and Accessibility Study Study Overview and Highlights July 2017 Purpose of this study Local governments and transportation agencies often make challenging decisions
Urban planners have invested a lot of energy in the idea of transit-oriented
 DOES TRANSIT-ORIENTED DEVELOPMENT NEED THE TRANSIT? D A N I E L G. C H AT M A N Urban planners have invested a lot of energy in the idea of transit-oriented developments (TODs). Developing dense housing
EXECUTIVE SUMMARY. Vision
 Vision Walking and bicycling in Salt Lake City will be safe, convenient, comfortable, and viable transportation options that connect people to places, foster recreational and economic development opportunities,
INTRODUCTION THOROUGHFARE SYSTEM CLASSIFICATIONS
 INTRODUCTION The thoroughfare plan will assist public officials in the development of a specialized system for efficient and safe movement of vehicular traffic while minimizing potential conflicts with
RESOLUTION NO ?? A RESOLUTION OF THE CITY OF NEPTUNE BEACH ADOPTING A COMPLETE STREETS POLICY
 RESOLUTION NO. 2018-?? A RESOLUTION OF THE CITY OF NEPTUNE BEACH ADOPTING A COMPLETE STREETS POLICY WHEREAS, safe, convenient, and accessible transportation for all users is a priority of the City of Neptune
Active Travel and Exposure to Air Pollution: Implications for Transportation and Land Use Planning
 Active Travel and Exposure to Air Pollution: Implications for Transportation and Land Use Planning Steve Hankey School of Public and International Affairs, Virginia Tech, 140 Otey Street, Blacksburg, VA
ADOT Statewide Bicycle and Pedestrian Program Summary of Phase IV Activities APPENDIX B PEDESTRIAN DEMAND INDEX
 ADOT Statewide Bicycle and Pedestrian Program Summary of Activities APPENDIX B PEDESTRIAN DEMAND INDEX May 24, 2009 Pedestrian Demand Index for State Highway Facilities Revised: May 29, 2007 Introduction
National Safe Routes to School Program: Initial Results
 National Safe Routes to School Program: Initial Results Lauren Marchetti National Center for Safe Routes to School 9 th Annual New Partners for Smart Growth Thursday, February 4, 2010 Seattle, WA August
WALK- AND bike-friendly TURLOCK
 WALK- AND bike-friendly TURLOCK Ideas to Encourage Walking and Biking Benefits to the COMMUNITY Get Connected People who walk and bike have many more opportunities for casual interactions with friends
Bikeway action plan. Bicycle Friendly Community Workshop March 5, 2007 Rochester, MN
 Bikeway action plan Summary The was held on March 5, 2007 at the Rochester Mayo Civic Center. The workshop was hosted by Rochester-Olmsted County Planning Department in collaboration with the League of
1999 On-Board Sacramento Regional Transit District Survey
 SACOG-00-009 1999 On-Board Sacramento Regional Transit District Survey June 2000 Sacramento Area Council of Governments 1999 On-Board Sacramento Regional Transit District Survey June 2000 Table of Contents
Solana Beach Comprehensive Active Transportation Strategy (CATS)
") Solana Beach Comprehensive Active Transportation Strategy (CATS) 3.0 Goals & Policies The Solana Beach CATS goals and objectives outlined below were largely drawn from the Solana Beach Circulation Element
Solana Beach Comprehensive Active Transportation Strategy (CATS) 3.0 Goals & Policies The Solana Beach CATS goals and objectives outlined below were largely drawn from the Solana Beach Circulation Element
NYC Pedestrian Safety Study & Action Plan. Research, Implementation & Safety Division of Traffic Operations
 NYC Pedestrian Safety Study & Action Plan Research, Implementation & Safety Division of Traffic Operations 1 Introduction DOT Safety GOAL Strategic Plan: Reduce Fatalities by 50% by 2030 From 274 (2007)
A Selection Approach for BRT Parking Lots Nicolls Road Corridor Parking Study
 A Selection Approach for BRT Parking Lots Nicolls Road Corridor Parking Study Chirantan Kansara, P.E. Engineering Construction Design Planning 2018 ITE Northeastern District Annual Meeting Lake George,
The North Shore Transportation Improvement Strategy and Western Richmond Terrace 1 : The Forgotten Corridor
 Elm Park Civic Association Island Voice Do Me A Faber The North Shore Transportation Improvement Strategy and Western Richmond Terrace 1 : The Forgotten Corridor Introduction Richmond Terrace is the northernmost
Mayor s Pedestrian Advisory Council. Wednesday, February 15
 Mayor s Pedestrian Advisory Council Wednesday, February 15 Annual Pedestrian Fatalities 2005-2016 Year-End Pedestrian Fatalities, 2016 (CPD): 44 Year-End Pedestrian Fatalities, 2015 (CPD): 46 Year-End
Walkable Communities and Adolescent Weight
 Walkable Communities and Adolescent Weight Sandy Slater, PhD Assistant Professor, University of Illinois at Chicago, School of Public Health Research Scientist, UIC Institute for Health Research and Policy
Bringing together community and health. Physical Activity and Nutrition Unit Office of Statewide Health Improvement Initiatives
 Bringing together community and health. Physical Activity and Nutrition Unit Office of Statewide Health Improvement Initiatives Physical Activity and Nutrition Unit Office of Statewide Health Improvement
SRTS Programs That Increase Walking and Bicycling to School
 Getting Results: SRTS Programs That Increase Walking and Bicycling to School SafeRoutes National Center for Safe Routes to School Communities initiate Safe Routes to School (SRTS) programs for a variety
POLICY STATEMENT: VISION ZERO
 Overview of APBP Policy Statements POLICY STATEMENT: VISION ZERO The Association of Pedestrian and Bicycle Professionals (APBP) supports the community of professionals working to create more walkable,
Minneapolis Bicycle Master Plan Chapter 4 - Goals, Objectives, and Benchmarks
 Chapter Overview Purpose This chapter presents new bicycle policies in addition to goals, objectives, and benchmarks that represent the 6 E s. Definitions The Minneapolis Bicycle Master Plan creates goals,
EXECUTIVE SUMMARY: TRANSIT-ORIENTED DEVELOPMENT IN SMITHS FALLS, ONTARIO; A COMPARISON BETWEEN TWO SITES
 EECUTIVE SUMMARY: TRANSIT-ORIENTED DEVELOPMENT IN SMITHS FALLS, ONTARIO; A COMPARISON BETWEEN TWO SITES Topic and Purpose In 2007, the Mayor of Ottawa s Task Force on Transportation suggested adding a
4 Goals, Objectives & Actions
 Chapter4 4 This chapter presents goals, objectives, and recommended actions to support the vision of making Overland Park a safer and easier place to ride a bicycle. 35 4.1 Recommendations Structure The
NEIGHBORHOOD TRAFFIC CALMING POLICY
 NEIGHBORHOOD TRAFFIC CALMING POLICY I. PURPOSE The City of Kent continually strives to strengthen and protect its neighborhoods by improving the quality of life in residential areas. Traffic conditions
6.0 PEDESTRIAN AND BICYCLE FACILITIES 6.1 INTRODUCTION 6.2 BICYCLE DEMAND AND SUITABILITY Bicycle Demand
 6.0 PEDESTRIAN AND BICYCLE FACILITIES 6.1 INTRODUCTION Bicycle and pedestrian travel along and in the vicinity of the corridor is part of the vision of Somerset and Hunterdon counties and the integrated
RE: Minor Betterments Projects near William Walker Elementary
 Washington County Department of Land Use and Transportation Operations & Maintenance Division Attn: Minor Betterments Program Coordinator 1400 SW Walnut Street, MS 51 Hillsboro, OR 97123 lutops@co.washington.or.us
The Corporation of the City of Sarnia. School Crossing Guard Warrant Policy
 The Corporation of the City of Sarnia School Crossing Guard Warrant Policy Table of Contents Overview And Description... 2 Role of the School Crossing Guard... 2 Definition of a Designated School Crossing...
Designing for Pedestrian Safety
 Designing for Pedestrian Safety Introduction to Pedestrian Safety Design and Planning Principles Presented by: Craig Allred FHWA Resource Center Technical Specialist and Michael Ronkin Owner, Designing
Mayor s Pedestrian Advisory Council. Wednesday, November 8 th
 Mayor s Pedestrian Advisory Council Wednesday, November 8 th Year-to-Date Pedestrian Fatalities, 2017 (CPD): 39 Year-to-Date Pedestrian Fatalities, 2016 (CPD): 38 Year-to-Date Pedestrian Fatalities, 2010-2014
Prioritizing Schools for Safe Routes to School Infrastructure Projects
 Prioritizing Schools for Safe Routes to School Infrastructure Projects Determining the most effective use of limited infrastructure funds is a challenging task. It is especially demanding for local transportation
Monterey Road Complete Streets
 Monterey Road Complete Streets Complete Street Objectives Improve livability and economic vitality Enhance pedestrian environment Accommodate bicyclists safely Reduce noise and air pollution Create attractive,
Measuring Transportation: Traffic, Mobility and Accessibility
 Measuring Transportation: Traffic, Mobility and Accessibility THIS FEATURE COMPARES THREE APPROACHES TO MEASURING TRANSPORTATION SYSTEM PERFORMANCE. TRAFFIC-BASED MEASUREMENTS EVALUATE MOTOR VEHICLE MOVEMENT;
Cultivating Senior Advocacy for Healthy & Walkable Neighborhoods. Jaime Fearer, AICP Planning & Policy Manager
 Cultivating Senior Advocacy for Healthy & Walkable Neighborhoods Jaime Fearer, AICP Planning & Policy Manager www.californiawalks.org @CaliforniaWalks Presenter Disclosures Jaime Fearer The following personal
Hedgepeth Williams Middle School and Paul Robeson Elementary School Trenton, NJ. School Travel Plan
 Hedgepeth Williams Middle School and Paul Robeson Elementary School Trenton, NJ School Travel Plan Hedgepeth Williams Middle School Description: Hedgepeth-Williams Middle School is located at 301 Gladstone
MOBILITY RESULTS AREA. Budgeting For Outcomes Council Presentation January 12, 2007
 MOBILITY RESULTS AREA Budgeting For Outcomes Council Presentation January 12, 2007 Mobility Results Team Members 2 Hammond Perot, OED, Co-Team Leader Bonnie Meeder, DEV (returning), Co-Team Leader Peer
RE-CYCLING A CITY: EXAMINING THE GROWTH OF CYCLING IN DUBLIN
 Proceedings ITRN2013 5-6th September, Caulfield: Re-cycling a city: Examining the growth of cycling in Dublin RE-CYCLING A CITY: EXAMINING THE GROWTH OF CYCLING IN DUBLIN Brian Caulfield Abstract In the
Effective Pedestrian & Bicycle Safety Enforcement
 Effective Pedestrian & Bicycle Safety Enforcement October 20, 2011 George Branyan Pedestrian Program Coordinator District Department of Transportation Increasingly multi-modal region Change in Daily Trip
Data Analysis February to March Identified safety needs from reported collisions and existing travel patterns.
 Welcome! Thank you for participating in today s Valencia Bikeway Improvements workshop. Data Analysis February to March Identified safety needs from reported collisions and existing travel patterns. Initial
What future for mid-sized cities? Prof. Emer. Antony Stathopoulos National Technical University of Athens
 What future for mid-sized cities? Prof. Emer. Antony Stathopoulos National Technical University of Athens These cities can range in size from 50,000 to 250,000 in population. Street in Larnaca in 1878
Characteristics from these programs were used to compare to and evaluate existing conditions in Howard County.
 EXECUTIVE SUMMARY Bike share is a mobility option that allows users to access a fleet of public bicycles throughout a community. Bike share systems have successfully been implemented in communities throughout
Measuring and Communicating Mobility:
 Measuring and Communicating Mobility: The District Mobility Project Stephanie Dock, District Department of Transportation TRB Transportation Issues in Major Cities Committee May 2, 2017 Deconstructing
CHAPTER 7.0 IMPLEMENTATION
 CHAPTER 7.0 IMPLEMENTATION Achieving the vision of the Better Streets Plan will rely on the ability to effectively fund, build and maintain improvements, and to sustain improvements over time. CHAPTER
Rochester Area Bike Sharing Program Study
 roc bike share Rochester Area Bike Sharing Program Study Executive Summary ~ January 2015 JANUARY 2015 8484 Georgia Avenue, Suite 800 Silver Spring, MD 20910 3495 Winton Pl., Bldg E, Suite 110 Rochester,
Background and Goals of SRTS
 Safe Routes to School Background and Goals of SRTS Oklahoma Kick-off May 4, 2011 The Good, the Bad, and the Ugly Fewer kids are biking and walking More parents are driving 1969 2009 48% walked or biked
Complete Streets Policy and Practice
 Complete Streets Policy and Practice presented by Leslie Phemister, Nancy Wagner and Kasey Holloway Active Transportation Alliance 1 Learning Objectives Understand the connection between public health
Safe Routes to School: Neighborhood Assessment Guide
 Safe Routes to School: Neighborhood Assessment Guide September 2012 Safe Routes to School Program Minnesota Department of Transportation 395 John Ireland Blvd., Mail Stop 430 St. Paul, MN 55155 Phone:
Location Matters: Where America Is Moving
 Location Matters: Where America Is Moving Nearly half of all American households plan to move at some point in the future. While some will move for a larger or nicer home, or perhaps to purchase a home
Chapter 14 PARLIER RELATIONSHIP TO CITY PLANS AND POLICIES. Recommendations to Improve Pedestrian Safety in the City of Parlier (2014)
") Chapter 14 PARLIER This chapter describes the current status and future plans for biking and walking in the City of Parlier. RELATIONSHIP TO CITY PLANS AND POLICIES The Parlier General Plan is the primary
Chapter 14 PARLIER This chapter describes the current status and future plans for biking and walking in the City of Parlier. RELATIONSHIP TO CITY PLANS AND POLICIES The Parlier General Plan is the primary
City of SeaTac 2013 Joint APA-PAW Awards Program Nomination Draft Safe & Complete Streets Plan. Transportation Category
 City of SeaTac 2013 Joint APA-PAW Awards Program Nomination Draft Safe & Complete Streets Plan Transportation Category May 31, 2013 City of SeaTac Draft Safe & Complete Streets Plan 2013 Joint APA-PAW
The Bicycle Coalition of Greater Philadelphia
 The Bicycle Coalition of Greater Philadelphia Makes bicycling better through advocacy and education by promoting biking as a healthy, low-cost, and environmentally-friendly form of transportation and recreation.
Getting Your SRTS Project Funded. Ryan Snyder
 Getting Your SRTS Project Funded Ryan Snyder Steps in Submitting a Successful Application 1. Stakeholder outreach: create a SRTS coalition 2. Develop a comprehensive plan and program with all 5 Es 3. Conceive
NACTO Designing Cities Conference Project Evaluation: Tools for Measuring Success and Building Support. October 29, 2015
 NACTO Designing Cities Conference Project Evaluation: Tools for Measuring Success and Building Support October 29, 2015 The case for evaluation: Have a social contract with City Council, staff and community
Complete Streets 101: The Basics
 Complete Streets 101: The Basics Michigan Municipal League - Capital Conference March 21, 2017 Chip Smith, AICP - Senior Planner - Wade Trim Inc. and City Council member City of Ann Arbor 2017 MML Capital
Monroe Street Reconstruction Business Focus Group Notes July 18, 2016, HotelRED
 Monroe Street Reconstruction Business Focus Group Notes July 18, 2016, HotelRED Total participants: 31 Focus Group Conversation #1: During this exercise, participants talked in small table groups in response
Market Factors and Demand Analysis. World Bank
 Market Factors and Demand Analysis Bank Workshop and Training on Urban Transport Planning and Reform. Baku, April 14-16, 2009 Market Factors The market for Public Transport is affected by a variety of
WALKNBIKE DRAFT PLAN NASHVILLE, TENNESSEE EXECUTIVE SUMMARY NASHVILLE, TENNESSEE
 NASHVILLE, TENNESSEE EXECUTIVE SUMMARY Executive Summary A world-class multi-modal transportation system is essential to a vibrant city and better quality of life. -Mayor Barry The WalknBike plan aims
Planning Regionally With Transit
 Planning Regionally With Transit Nathan Coats Director of Operations CTAA Expo 2015 Tampa Began 1992. Serves eastern Cache County to Preston, ID. Population- 115,000 34 bus fleet, 26 fixed route buses;
5/31/2016 VIA . Arwen Wacht City of Sacramento Community Development Department 300 Richards Blvd., 3 rd Floor Sacramento, CA 95811
 5/31/2016 VIA EMAIL Arwen Wacht City of Sacramento Community Development Department 300 Richards Blvd., 3 rd Floor Sacramento, CA 95811 RE: El Pollo Loco (P16-028) Dear Ms. Wacht: WALKSacramento has reviewed