THRIVE! WALK. BIKE. A regional vision for a more walkable, bikeable, and livable metropolitan Atlanta PART 2
|
|
|
- Lewis Wilkins
- 5 years ago
- Views:
Transcription

1 PART 2 ASSESSMENT OF REGIONAL TRAVEL PATTERNS AND EXISTING CONDITIONS WALK. BIKE. THRIVE! Photo: Christopher A regional vision for a more walkable, bikeable, and livable metropolitan Atlanta PART 2: ASSESSMENT OF REGIONAL TRAVEL PATTERNS AND EXISTING CONDITIONS 1


2 2
3 TABLE OF CONTENTS Executive Summary Community Profiles Mobility Safety Economic Competitiveness Regional Trail Assessment PART 2: ASSESSMENT OF REGIONAL TRAVEL PATTERNS AND EXISTING CONDITIONS

4 Photo: Christopher
5 EXECUTIVE SUMMARY The story of walking and biking in the Atlanta region can be summarized as increasing demand and substantial need, but modest investment and gradual growth. Walking and bicycling are foundational forms of transportation. They can be inexpensive, healthy, and fun, but need to be seen as desirable and safe. Public transit both rail and bus as well as emerging forms of on-demand travel expands the reach of these two active modes to form a regional system. Together active transportation and public transit increase the mobility of individuals of all ages and abilities and the economic competitiveness of communities across the region. The Atlanta region s historical development patterns and transportation infrastructure investments have created a region where the majority of trips are by car. These patterns are deeply ingrained but are not immutable. Changing demographics, shifting development trends, and an increasing investment in walking, biking, and transit infrastructure can lead to significant increases in walking, biking, and transit use. And recently, as regional patterns have changed, walking and bicycling rates have increased. Transportation is crucial for quality-oflife. Distance, schedule, safety concerns, and financial resources all contribute to individuals transportation decisions. Many households in the region rely on walking or bicycling as low-cost options or public transit to reach a distant job. Many more individuals choose active transportation to save money or improve their health. And employers recognize that active transportation options attract, retain, and support employees. But lack of safe or convenient access hinders peoples abilities to walk, bicycle, or ride transit. Lack of transportation mobility hinders economic mobility. Expanding transit service, filling gaps in the bikeway and sidewalk network, and concentrating development patterns help individuals travel more easily and strengthens communities. A particular focus for regional walking and bicycling travel are greenway trails and multi-use paths. When well-integrated into local walking and bicycling networks, trails can function as active transportation highways for direct, fast, safe, and comfortable travel that connect cities and bridge barriers. In the last few decades communities across the Atlanta region have built trail segments that have driven new private development and provided safe and accessible places for people of all ages and ability to be more physically active and socialize. Linked together these segments can become a regional trail network. This regional travel pattern assessment provides an overview of the trends, needs, and opportunities related to walking and biking combined with public transit in the region. The sections are organized around Mobility, Safety, and Economic Competitiveness as well as a focus on current trail distribution and opportunities for a regional trail network. These perspectives provide the building blocks for continued growth of walking and bicycling in the region. PART 2: ASSESSMENT OF REGIONAL TRAVEL PATTERNS AND EXISTING CONDITIONS 1

6 EXECUTIVE SUMMARY 2015 ATLANTA REGION WALKING, BIKING, AND TRANSIT BY THE NUMBERS MOBILITY SAFETY Mode Share 1.4% % of workers who commute by walking 2 0.2% % of workers who commute by biking 2 3.1% % of workers who commute by transit 2 5.3% % of all trips in the region that are by bike or walking 3 1.7% % of all trips in the region that are by transit % % of transit trips that start or end with a walking trip Injuries 1 1,582 Annual average # of pedestrians injured in traffic crashes ( ) 4.8% % of all traffic injuries sustained by people walking 633 Average annual pedestrian injuries per 100 million miles walked ( ) 346 Annual average # of bicyclists injured in traffic crashes ( ) 1% % of all traffic injuries sustained by people biking 457 Average annual bicyclists injuries per 100 million miles biked ( ) Proximity 4 12% % of people that live within a 5-minute walk of an activity center 23% % of people that live within a 5-minute bike ride of an activity center 16% % of people that live within a 5-minute walk of a transit stop 33% % of people that live within a 5-minute bike ride of transit stop 1 Georgia Electronic Accident Reporting System; Georgia Department of Transportation 2 US Cenus Bureau 2013 American Community Survey 1-year estimates for the Atlanta-Sandy Springs-Roswell MSA 3 ARC PLAN 2040 Travel Demand Model US Census Fatalities 1 85 Average annual # of pedestrians killed in traffic crashes ( ) 17% % of all traffic fatalities that are pedestrians 34 Average annual pedestrian fatalities per 100 million miles walked ( ) 8 Average annual bicyclist fatalities per 100 million miles biked ( ) 6 Average annual # of bicyclists killed in traffic crashes ( ) 1.2% % of all traffic fatalities that are bicyclists 2

7 ECONOMIC COMPETITIVENESS Federal Funding 7% % of federal transportation funds spent on walking and bicycling in the Atlanta Regional Commission Transportation Improvement Plan Public Health % % of residents that do not meeting minimum recommended physical activity guidelines Walk Friendly & Bicycle Friendly Communities and Universities 2 # of Walk Friendly 6 Communties 3 # of Bicycle Friendly 7 Communities 26.4% % of residents who are obese 2 # of Bicycle Friendly Universities 7 4 # of Bicycle Friendly Businesses 7 5 US Census American Community Survey 2013, Behavioral Risk Factors Surveillance System 6 UNC Highway Safety Research Center s Pedestrian and Bicycle Information Center Equity 22.1% % of people that live within Equitable Target Areas % % of people that work within Equitable Target Areas 9 TRAILS 397 # of miles of existing paved, multi-use trails 11 Proximity to Trails 8 5% % of people that live within a 5-minute walk of a trail 21% % of people that live within a 5-minute bike ride of a trail 37% % of bike crashes that occur within Equitable Target Areas 10 42% % of pedestrian crashes that occur within Equitable Target Areas 10 10% % of people that work within a 5-minute walk of a trail 42% % of people that work within a 5-minute bike ride of a trail 7 The League of American Bicyclists US Census, Atlanta Regional Commission 9 US LEHD State Crash Database 11 Atlanta Regional Commission PART 2: ASSESSMENT OF REGIONAL TRAVEL PATTERNS AND EXISTING CONDITIONS 3


8
9 COMMUNITY PROFILES The Community Profiles section summarizes the geographic, demographic, and government and agency context for the Atlanta Region. This section also provides a summary of how the region compares to other peer metro areas in terms of size, population, and rates of walking, biking, and transit. Geography The Atlanta metropolitan region is located in north-central Georgia amongst the piedmont foothills of the southern Appalachian Mountains. The region includes all or part of 20 counties and covers over 8,376 square miles. The City of Atlanta forms the primary urban core surrounded by largely suburban counties dotted with historic small towns. The region contains several prominent job centers, often at the junction of interstate highways, surrounded by extensive residential suburbs. Historically, the region was an agricultural area with scattered industrial factories. At its core the City of Atlanta was founded as a rail junction and the region remains a hub for rail, highways, and air travel. Major roads have historically radiated out from town centers and were often built along ridge lines. These historic and geographic features still impact walking and biking, resulting in often hilly and circuitous routes both within and between cities. The region is often noted for having abundant tree cover and many streams, creeks, and rivers. These natural resources provide opportunities for linear parks and trails, but also present barriers between jurisdictions. Where streams, creeks, and rivers separate destinations in the region they can impact route choices and increase distances to destinations. The region is as large and as diverse as some states. The size of metropolitan Atlanta places the region between New Jersey and Delaware in square miles. PART 2: ASSESSMENT OF REGIONAL TRAVEL PATTERNS AND EXISTING CONDITIONS 5
 Low High January 33 52 5.03 March 44 65 5.38 May 59 80 3.95 July 71 89 5.12 September 64 82 4.09 November 44 63 4.")
10 COMMUNITY PROFILES The region s rolling hills are sometimes cited as a barrier to bicycling, although they can also be attractive to those looking for a workout. SEASONAL TEMPERATURES FOR THE ATLANTA REGION Month Average temperature (0F) Low High January March May July September November Source: Intellicast Average precipitation Weather Weather is often cited as a significant barrier to walking and biking. While extreme hot or cold temperatures may deter some, it should be noted that some of the cities with the highest rates of walking and biking in the country are in areas with temperature extremes. Of the 50 largest cities in the country, Boston and Washington, DC have the highest rates of commuting by walking or bicycling in the US. Both of the cities experience extreme hot and cold weather. New Orleans, a southern city with hot temperatures and high humidity, has the 10th highest rate of commuting by walking and bicycling in the US. 1 1 Alliance for Walking and Biking Benchmarking Report: Bicycling and Walking in the United States. (2014). By comparison, Atlanta has a relatively temperate climate with four distinct seasons. The region experiences mild winters and hot summers, with average highs in the mid 50s and upper 80s respectively. The mild winters help increase the number of days people can walk and bike comfortably compared to many major cities in the US. High heat and humidity in the summer can be a potential barrier, but one that can be lessened by the installation of end-oftrip facilities like changing areas and showers, and by increasing shade along active transportation corridors. 6


11 67 % years old 1 % 85 years old and over 9 % years old 23 % Under 16 years old ATLANTA REGION BY AGE Source: US Census 2013 American Community Survey 1-year estimate Population The Atlanta Regional Commission s MPO boundary currently covers all or part of 20 counties and includes a population of 4,824,522 people. Roughly half of the State of Georgia s population lives in the 20-county Atlanta region. The Atlanta region s population falls between the States of Alabama and South Carolina the 23rd and 24th most populous states in the US respectively. The Atlanta metropolitan region has for several decades been defined by booming population growth. The region s population grew by over one million people between 2000 and and several of the region s counties were 1 Source: 2000 and 2010 Population Estimates for the 28 county Atlanta Metropolitan Statistical Area, US Census Bureau routinely ranked as the fastest growing in the United States. The region s growth has been primarily focused in suburban counties, most prominently to the north and east of the region. Incorporated cities in the region contain approximately forty percent of the region s population. Recent trends indicate that movement to the urban core and suburban towns, as well as newly incorporated areas, may be increasing cities percentage of overall regional growth. The Atlanta metropolitan region is becoming an increasingly diverse place. From 2000 to 2010, the Atlanta region decreased from 63% to 55% white with 32% black, 10% Hispanic or Latino, and 5% Asian residents. As minority populations increase, especially in suburban counties, these numbers indicate a strong trend towards an increasingly diverse region. An important demographic perspective is the distribution of the population by age. Roughly twenty-five percent of people in the region are under the age of 16 and thus cannot legally drive. Ten percent of the population is between the age of and one percent is over the age of 85. Together, over one-third of individuals may be unable or less willing to drive and thus more dependent on others to travel to daily destinations. Additionally, 6.3% of people in the Atlanta region live in households without cars. For a significant portion of the population, walking, bicycling, and transit are vital forms of transportation. PART 2: ASSESSMENT OF REGIONAL TRAVEL PATTERNS AND EXISTING CONDITIONS 7

12 8 STUDY AREA
13 COMMUNITY PROFILES JURISDICTIONS IN THE ATLANTA METROPOLITAN TRANSPORTATION PLANNING AREA Counties Cities Governance Context The study area for this plan is the Atlanta Metropolitan Transportation Planning Area, which contains all or part of 20 counties, 81 cities, 17 towns, and 15 census designated places (CDPs). Because of the large number of jurisdictions and relatively small counties, regional issues such as transportation require a great deal of coordination and negotiation amongst the various government bodies. Additionally, the number of jurisdictions that make up the region means that transportation decision-making is dispersed. As the region grows, the role of local jurisdictions and the MPO is changing. The MPO is increasingly responsible for coordination and technical assistance while local governments are increasingly responsible for policy, program, and infrastructure decision-making at the local level. Barrow Carroll Cherokee Clayton Cobb Coweta Dawson DeKalb Douglas Fayette Forsyth Fulton Gwinnett Henry Newton Paulding Pike Rockdale Spalding Walton Towns Bethlehem Between Braselton Brooks Carl Clermont Haralson Moreland Newborn Orchard Hill Porterdale Rest Haven Sharpsburg Taylorsville Turin Tyrone Woolsey As of 2015 Acworth Alpharetta Atlanta Auburn Austell Avondale Estates Ball Ground Berkeley Lake Braswell Brookhaven Buford Canton Centerville Chamblee Chattahoochee Hills Clarkston College Park Conyers Covington CDPs Belvedere Park Bonanza Candler-McAfee Conley Druid Hills Irondale Lakeview Estates Mableton Mountain Park North Decatur North Druid Hills Panthersville Redan Tucker Vinings Cumming Dacula Dallas Decatur Doraville Douglasville Duluth Dunwoody East Point Fairburn Fayetteville Forest Park Grantville Grayson Griffin Hampton Hapeville Hiram Holly Springs Johns Creek Jonesboro Kennesaw Lake City Lawrenceville Lilburn Lithonia Locust Grove Loganville Lovejoy Marietta McDonough Milton Morrow Mountain Park Nelson Newnan Norcross Oxford Palmetto Peachtree City Municipal Context 20 Counties 81 Cities 17 Towns Peachtree Corners Pine Lake Powder Springs Riverdale Roswell Sandy Springs Senoia Smyrna Snellville Statham Stockbridge Stone Mountain Sugar Hill Sunny Side Suwanee Union City Villa Rica Waleska Walnut Grove Winder Woodstock 15 Census Designated Places (CDPs) PART 2: ASSESSMENT OF REGIONAL TRAVEL PATTERNS AND EXISTING CONDITIONS 9

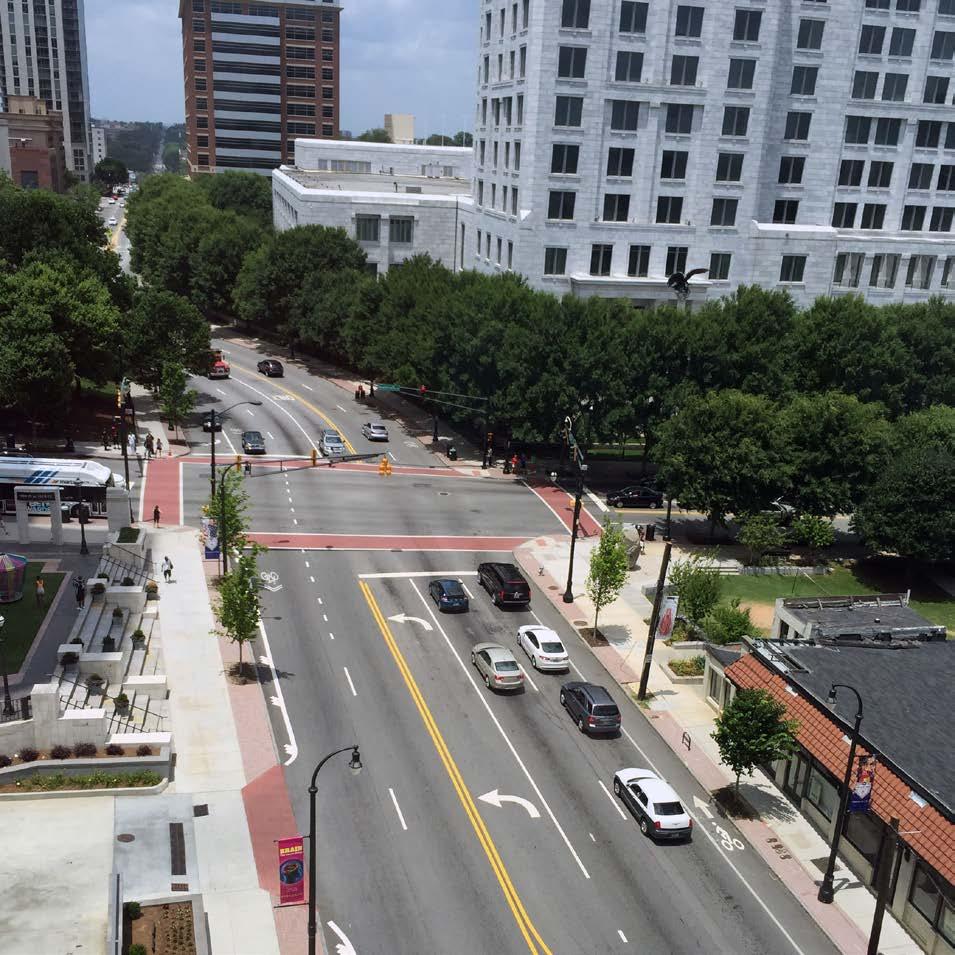
14 COMMUNITY PROFILES Community Improvement Districts Buckhead CID Atlanta Downtown Improvement District (ADID) Midtown Improvement District Cumberland Community Improvement District East Metro DeKalb CID Gwinnett Place CID Gwinnett Village CID Perimeter CID Airport West CID Boulevard CID Braselton CID Evermore CID Highway 278 Improvement District Lilburn CID North Fulton CID Stone Mountain CID South Fulton CID Town Center Area CID Tucker-Northlake CID Community Improvement Districts are important areas for jobs, housing options, and economic development growth in the region. They are also areas of significant walking and biking activity too. Community Improvement Districts The Atlanta Metropolitan Transportation Planning Area also contains 19 Community Improvement Districts (CIDs), self-taxing business districts that pool funds to reinvest in the public realm. Typical responsibilities of CIDs include street and road projects, trails, parks and recreation, stormwater and sewage, and public transit. These organizations have made strides toward supporting pedestrian and bike activity within their districts, demonstrating recognition of the significant benefits provided by high walking and biking commute mode shares. For example, the Buckhead CID has undertaken the transformation of Peachtree Street from a caroriented road to a complete street with buffered sidewalks, bike lanes, new signals, a landscaped median, transit enhancements, and more visible crosswalks. CIDs can serve as stewards for walking and biking improvements in the region and as stakeholders in improving the walking and biking environment in the region s activity centers. 10
15 BIKE/PED FUNDING VS OVERALL TIP TIP FUNDING BY PROJECT TYPE BILLIONS $15 $10 $5 TIP Total Bike & Ped (%) 10% 8% 6% 4% 100% 80% 60% 40% Bike & Ped Transit Road 2% 20% $0 MOBILITY 2030 (Adopted 2004) ENVISION6 (Adopted 2007) PLAN 2040 (Adopted 2011) PLAN 2040 UPDATE (Adopted 2014) 0% 0% MOBILITY 2030 (Adopted 2004) ENVISION6 (Adopted 2007) PLAN 2040 (Adopted 2011) PLAN 2040 UPDATE (Adopted 2014) Source: Atlanta Regional Commission Funding Trends for Walking and Biking Federal transportation funds are an important source of funding for infrastructure in Georgia and the Atlanta region. Federal funds can be used for a variety of modes, including walking, biking, and transit infrastructure. Federal funds also help local jurisdictions stretch the return on investment with their local dollars. Depending on the funding source and requirements, local jurisdictions typically have to pay a match from 1% to 20% of the total budget for a particular transportation project that uses federal funds. Federal transportation funds are typically allocated to the states and then are distributed to local jurisdictions either by a state s department of transportation or a federally-designated Metropolitan Planning Organization. The Atlanta Regional Commission helps facilitate the prioritization and funding of transportation projects in the region. According to the 2014 Benchmarking Report: Bicycling and Walking the United States, states spent an average of 2.1% of federal transportation dollars on walking and biking between 2009 and Over that same time period, Georgia had the 10th highest spending of states in the US on walking and biking projects, or 2.9% of all federal transportation dollars allocated to the state. For the Atlanta region, federal funding trends for walking and biking is mixed. Over the last four Transportation Improvement Programs (TIP), total federal funds for the TIP have decreased. However, over the same period, the share of federal funds in each TIP for walking and biking projects increased. This is a positive trend. However, funding for walking and biking projects with federal funds is still low relative to the overall TIP budget. For the most recent TIP, walking and biking projects account for just over 5% of the overall TIP. Federal transportation dollars are not the only source of funding for walking and biking infrastructure. Local capital and maintenance budgets, as well as private funding, are used to build and maintain the region s transportation infrastructure. Regardless of funding source, continued investment in the expansion, maintenance, and gap closure of the walkway and bikeway networks is needed in the region to create complete, connected, convenient, and safe infrastructure for people to walk and bike. PART 2: ASSESSMENT OF REGIONAL TRAVEL PATTERNS AND EXISTING CONDITIONS 11
16 COMMUNITY PROFILES Atlanta Region Dallas Region ACTIVE COMMUTE + TRANSIT RATES: ATLANTA VS. OTHER METROS 2.8 % 4.7 % Atlanta Region Dallas Region Charlotte Region Phoenix Region Minneapolis Region Seattle Region Washington DC Region Boston Region 3.1 % 0% 5% 10% 15% TRANSIT COMMUTING Charlotte Region 3.6 % 4.9 % Atlanta Region 1.4 % Phoenix Region Minneapolis Region Seattle Region Washington DC Region Boston Region 7.9 % 13.9 % 0 5% 10% 15% 18.4 % 18.6 % Dallas Region Charlotte Region Phoenix Region Minneapolis Region Seattle Region Washington DC Region Boston Region 0% 5% 10% 15% PEDESTRIAN COMMUTING Source: US Census American Community Survey 1-year estimates, Table B Charlotte data is from 2009, Boston data is from 2012, others are from Atlanta Region 0.2 % Dallas Region Charlotte Region Phoenix Region Minneapolis Region Seattle Region Washington DC Region Boston Region 0% 5% 10% 15% BIKE COMMUTING 12
17 SCALE COMPARISONS AND POPULATION DENSITY: ATLANTA VS. OTHER METROS PHOENIX 4.26 M people 292 people/sq mi CHARLOTTE 2.26 M people 354 people/sq mi MINNEAPOLIS 3.46 M people 426 people/sq mi SEATTLE 3.61 M people 602 people/sq mi ATLANTA 5.38 M people 623 people/sq mi DALLAS 6.56 M people 682 people/sq mi WASHINGTON DC 5.76 M people 883 people/sq mi BOSTON 4.64 M people 1,283 people/sq mi Source: Land area from US Census Population data from US Census 2013 American Community Survey 1-year estimates. Commute Rates: A Comparison with Peer Regions In the Atlanta region, 1.4% of commuters walk to work, and 0.2% bike to work. 3.1% of commuters take public transit to work, and the vast majority or these commutes also involve walking for one or more segment. Combined, these three modes account for 4.7% of the total commute mode share. Rates of walking and biking to work in the Atlanta region are similar to or below those of selected peer regions. The Atlanta region s walk commute mode share is very comparable to the Dallas, Phoenix, and Charlotte regions, but only about a quarter that of the Boston region. The Dallas and Charlotte regions also have very similar rates of bike commuting to the Atlanta region, but a larger share of people in the Phoenix and Washington DC regions bike to work. The Atlanta region s transit commute mode share is higher than the Dallas, Charlotte, and Phoenix regions, but significantly lower than the Washington DC region. When the Atlanta region is compared to the most walkable, bikeable, and transitserved regions in the country, Atlanta lags behind significantly. More than twice as many people walk or bike to work in the Seattle, Boston, and Minneapolis regions relative to the Atlanta region. The fact that a greater proportion of people walk, bike, and use transit in the Seattle, Boston, and Minneapolis regions than in the Atlanta region is not altogether surprising. These regions have devoted significant resources to the planning, design, and implementation of high quality infrastructure that supports active transportation and public transit use. While funding data is not available at the regional level, there is a strong positive correlation at the state and large city levels between investments in active transportation and higher active commute mode shares. 1 Development patterns and density are important but not the only determinants of walkable, bikeable, and transit-served regions. Seattle and Minneapolis have roughly the same or lower population densities than Atlanta, and yet have significantly higher active transportation commute rates. Likewise, the Phoenix region has a significantly lower population density than the Atlanta region, yet has similar levels of active transportation commuting. Density and proximity are important factors in deciding to walk, bike, or take transit, but so too is the availability of walking, biking, and transit infrastructure. 1 Source: Bicycling and Walking in the United States: 2014 Benchmarking Report. The Alliance for Biking and Walking. PART 2: ASSESSMENT OF REGIONAL TRAVEL PATTERNS AND EXISTING CONDITIONS 13
18 TOTAL WALKING TRIPS Source: ARC Activity-Based Travel Demand Model, year
19 TOTAL BIKING TRIPS Source: ARC Activity-Based Travel Demand Model, year 2015 PART 2: ASSESSMENT OF REGIONAL TRAVEL PATTERNS AND EXISTING CONDITIONS 15

20 COMMUNITY PROFILES 5.9 % Worked at home 10.5 % Carpool 3.1 % Public transit 1.4 % Walked 0.2 % Bicycle 77.6 % Car (drive alone) 1.3 % Taxicab, motorcycle or other means 20-COUNTY AREA COMMUTE MODE SHARE 1 1 County-level ACS data is for 3-year periods. Commute mode data is per Table B Commute Rates: A Comparison of Atlanta Region Jurisdictions Across the Atlanta region, the predominant travel mode for commuting is driving alone, which represents about 77.6% of daily commute trips. Of the remaining commuter trips, 10.5% drive or ride in a car with others, 5.9% work at home, 3.1% take public transit, 1.4% walk, 0.2% bike and 1.3% use other means. On average, Atlanta region cities and CDPs have higher public transit, walk and bike commute mode shares (5.2%, 2.3% and 0.4% respectively) than the average county rates. These areas tend to be more accommodating to these modes, as they are more densely populated, destinations are in closer proximity, and many are served by transit. The cities, towns, and CDPs of the region have an average population density of 1,718 people per square mile, compared to the 20-county population density of 965 people per square mile. What follows is a summary of the places in the region with the highest rates of active transportation and transit commuting. College Park has the highest combined active transportation and transit commute rate (walking, biking, and transit) as well as the highest transit commute rate in the region. Oxford has the highest walk commute rate in the region, and Forest Park has the highest bike commute rate in the region. The top 20 jurisdictions in the region with the highest active transportation and 10.0% 8.0% 6.0% 4.0% 2.0% 0.0% 4.7% 7.8% transit commute mode share have one or more of these characteristics: MARTA service A Main Street, regional activity center, or Community Improvement District A university A population that is heavily dependent on transit, walking, and biking to get to daily destinations LOCAL VS. REGIONAL DISTRIBUTION OF WALK, BIKE, AND TRANSIT COMMUTING 8.6% REGION CITIES CENSUS DESIGNATED PLACES Source: US Census American Community Survey 3-Year Estimate. Table B (SUCH AS VININGS OR TUCKER) 16
21 TOP 20 JURISDICTIONS IN THE ATLANTA REGION WITH THE HIGHEST ACTIVE TRANSPORTATION + TRANSIT COMMUTE MODE SHARE Rank City Walk + BIke + Transit Walk Bike Transit 1 College Park 31.3% 6.4% 0.0% 24.9% 2 Oxford 25.9% 25.3% 0.6% 0.0% 3 Waleska 18.9% 18.9% 0.0% 0.0% 4 Doraville 18.0% 4.8% 0.0% 13.2% 5 Sunny Side 17.5% 17.5% 0.0% 0.0% 6 East Point 16.6% 1.4% 0.5% 14.6% 7 Chamblee 16.1% 2.6% 0.0% 13.5% 8 Atlanta 15.8% 4.7% 0.8% 10.3% 9 Lithonia 14.8% 1.8% 0.0% 13.0% 10 Brookhaven 13.0% 1.5% 0.0% 11.5% 11 Forest Park 12.0% 5.4% 5.0% 1.6% 12 Clarkston 11.8% 2.5% 0.6% 8.7% 13 Stone Mountain 11.1% 0.0% 0.0% 11.1% 14 Decatur 11.0% 3.9% 0.5% 6.6% 15 Sandy Springs 9.6% 0.7% 0.0% 8.9% 16 Conyers 9.0% 3.9% 2.9% 2.2% 17 Fairburn 8.5% 0.6% 0.0% 7.9% 18 Hapeville 7.4% 1.5% 0.0% 6.0% 19 Marietta 6.7% 3.4% 0.4% 2.9% 20 Pine Lake 6.4% 1.3% 0.0% 5.1% Highest combined walk + bike + transit and highest transit rate Highest walk rate Highest bike rate Source: US Census American Community Survey 1-year estimates, Table B08301 (2013) College Park: 31.3% of commuters choose to walk, bike, or take transit 24.9% of commuters choose transit The jurisdiction with the highest active transportation commute mode share is College Park, which is located just south of Atlanta across Fulton and Clayton counties. Proximity to MARTA and the airport (a significant source of employment for College Park residents), has many residents actively commuting by walking, biking, transit, or a combination of these modes. College Park also has the highest share of commuters traveling via public transit. Home to roughly 14,000 residents and with a population density of 1,377 people per square mile, it has more than double the average population density for the region as a whole. The College Park MARTA station, served by the Red and Gold Lines, is about a 20-minute subway ride to Five Points Station, with 5-minute headways at rush hour. The College Park MARTA station is also served by seven buses. These factors contribute to the high use of public transit. Oxford: 25.3% of commuters choose to walk The City of Oxford has the highest proportion of commutes made on foot. Oxford is a relatively small city located in Newton County along I-20. Oxford is also home to Emory University s historic campus, now known as Oxford College. Oxford has a population density of 1,148 people per square mile, which is almost double the average population density for the region as a whole. The city has a wellpreserved historic character and a mix of land uses that supports frequent pedestrian activity. Forest Park: 5% of commuters choose to bike Forest Park has the area s highest bike mode share, with 5%. The largest city in Clayton County, it has a population of roughly 19,000 and a density of 2,019 people per square mile, which is more than double the population density for the region as a whole. There are several major employers in transportation and warehousing located in Forest Park, which provides opportunities for residents to work near their homes. PART 2: ASSESSMENT OF REGIONAL TRAVEL PATTERNS AND EXISTING CONDITIONS 17
22 COMMUNITY PROFILES Commute Rates: Atlanta Region Active Transportation Trends Over the past few years, the rates of walking, biking, and transit have remained relatively consistent, both in terms of the actual number of people walking, biking, and taking transit, and the percentage of all commuters walking, biking, and taking transit. Additionally, the rates of walking, biking, and transit seem to have been impacted by the recession. The rates for commuting by walking and biking actually dipped during the recession and have not returned to prerecession levels as of 2013 (the most current commute information available for the MSA from the US Census). This dip may be the result of those in the region most dependent on walking and transit to get to work, such as service sector workers and households that cannot afford a vehicle, commuting less due to unemployment or under employment. 36,000 34,000 32,000 30,000 28,000 8,000 6,000 4,000 2,000 WALKING COMMUTE MODE SHARE TRENDS IN THE ATLANTA REGION BIKING COMMUTE MODE SHARE TRENDS IN THE ATLANTA REGION Count Rate Count Rate 1.4% 1.3% 1.2% 1.1% 0.3% 0.2% 0.1% The exception to this trend is bike commuting. Bike commuting actually spiked during the recession, and while it has gone down since the recession ended, the rate and total number of people biking is still higher than prerecession levels. The spike during the recession may have been a result of people opting to bike to save money. Anecdotal evidence also suggests that the loss of transit service in Clayton County between 2010 and 2015 led many who were previously dependent on transit to commute by bike instead ,000 80,000 60,000 40, PUBLIC TRANSIT COMMUTE MODE SHARE TRENDS IN THE ATLANTA REGION Count Rate 0.0% 4.0% 3.0% 2.0% 20, % % Source: US Census 2013 American Community Survey 1-year estimates, Table B
23 ALL COMMUTES DROVE ALONE WALKED PUBLIC TRANSPORTATION TAXICAB, MOTORCYCLE, BICYCLE, OR OTHER MEANS ALL COMMUTES DROVE ALONE WALKED PUBLIC TRANSPORTATION RACE AND ETHNICITY OF TRAVELERS BY COMMUTE MODE 0% 10% 20% 30% 40% 50% 60% Source: US Census 2013 American Community Survey 1-year estimates, Table S0201 for the Atlanta-Sandy Springs-Roswell MSA. INCOME OF TRAVELERS BY COMMUTE MODE Two or more races Some other race alone Asian alone Black or African American alone White alone $50,000 or more $35,000 to $49,999 $25,000 to $34,999 $15,000 to $24,999 $14,999 or less Commuting Trends: Race, Ethnicity, and Income The Atlanta region is diverse in terms of race, ethnicity, and income. The differences in background and socioeconomic status influence the travel choices people make. Non-white workers are more likely to walk, take transit, or travel to work by some means other than driving. For example, African-Americans represent 31% of the workforce in the Atlanta region, but 61% of those that commute by public transit. Similarly, Asian-Americans represent 5% of the workforce in the region but 12% of those that walk to work. Income also has an impact on the way people get to work. Workers in the region that have lower incomes are more likely to walk, bike, or travel to work by some means other than driving. Workers making $15,000 or less account for 20% of the workforce but 45% of those that walk to work and 32% of those that take public transit. The percentages are similar for those making between $15,000 and $25,000. It is also worth noting that 49% of the workforce in the Atlanta region make less than $35,000. Transportation costs are a significant consideration for those in the region and will continue to influence access to job opportunities and economic growth. TAXICAB, MOTORCYCLE, BICYCLE, OR OTHER MEANS 0% 10% 20% 30% 40% 50% 60% PART 2: ASSESSMENT OF REGIONAL TRAVEL PATTERNS AND EXISTING CONDITIONS 19

24
25 MOBILITY Walking, biking, and taking transit is part of daily transit patterns in the Atlanta region. This section describes how people in the region walk, bike, and take transit. Current trends, choices, and travel behavior in the region related to walking, biking, and taking transit service are summarized. Topics related to demand, proximity, travel patterns, and travel distances are covered. Walking and Biking Opportunities Near Home and Work From a trip distance perpective, walking or biking to destinations in the region is more viable than generally perceived, particularly when it comes to bikeable distances. 12% of people live within a five-minute walk of an activity center and a quarter of all people in the region live within a five-minute bike ride of an activity center. In terms of proximity to jobs, over 4 out of 10 people work within a five-minute walk of an activity center and almost 6 out of 10 people work within a five-minute bike ride of an activity center. These proximity facts highlight the opportunity to increase commuting by walking and biking by increasing housing options within and near activity centers. Roughly half of the region s employees work in an activity center or within a five-minute walk or bike ride of an activity center. Mode Choice and Types of Trips Walking, biking, and transit account for roughly 7% of all trips in the Atlanta region. Walking and biking trips account PROXIMITY TO ACTIVITY CENTERS 60% 40% 20% 0% 5 Minute Walk 5 Minute Bike Ride 12% LIVE 23% 44% WORK 58% Source: 2010 US Census; Atlanta Regional Commission for approximately 5% of all trips, and transit trips account for approximately 2% of all trips. When looking only at commute trips, more people take transit (5%) than walk or bike (2%). The reverse is true for non-commute trips: more people walk and bike (about 6% to 7%) than take transit (about 1%). The fact that, regardless of trip purpose, the total mode share for walking, biking, and transit is static around 7% suggests that the existing transportation system 2 % TRANSIT TRIPS OF ALL TRIPS IN 5 % OF ALL TRIPS IN THE REGION ARE THE REGION ARE EITHER WALKING OR BIKING TRIPS Source: ARC PLAN2040 Travel Demand Model PART 2: ASSESSMENT OF REGIONAL TRAVEL PATTERNS AND EXISTING CONDITIONS 21
26 MOBILITY and land use patterns limit the ability of people to meet their daily travel needs by walking, biking, and transit. The region s current level of transit service is helpful for work trips but less so for running errands or other daily trips. Likewise, walking and biking are helpful for some trips not related to commuting, but getting around the region for longer trips still requires driving alone, transit, or sharing a car. Enhancing transit service, expanding walkway and bikeway networks, and changing development patterns to create destinations in closer proximity to populations can help increase the convenience of walking, biking, or taking transit more frequently regardless of trip purpose. Trip Distance Patterns by Mode Within the Atlanta region, mode choice is influenced by trip length. When looking at all modes, 25% of all trips are less than 2 miles and 50% of all trips are less than 4.5 miles. Creating communities where destinations are closer and there are bikeway, walkway, and transit networks that are connected and convenient will help encourage more walking and biking in the region. Roughly 10% of current car trips in the region are under one mile, which is a reasonable distance to walk or bike. If half of those car trips were switched to walking, biking, or transit, there would be a 5% reduction in the number of car trips in the region. Such a reduction could have a significant impact on local roadway networks and congestion on interstates. MODE CHOICE AND TYPES OF TRIPS IN THE ATLANTA REGION 5 % HOME TO WORK OUT AND ABOUT TRIPS (Trips not starting at home) MODE SHARE BY TRIP DISTANCE TRIP DISTANCES BY MODE Transit Trips 2 % Walking and Biking Trips 13 % High Occupancy Vehicle Trips 80 % Single Occupancy Vehicle Trips 1 % Transit Trips 6 % Walking and Biking Trips 36 % High Occupancy Vehicle Trips 57 % Single Occupancy Vehicle Trips Source: ARC PLAN 2040 Travel Demand Model, estimates for Trip Distance (mi) Bike share of total trips Walk share of total trips Source: ARC PLAN 2040 Travel Demand Model, estimates for HOME TO NON-WORK DESTINATIONS ALL TRIPS Transit share of total trips 1 % Transit Trips 6 % Walking and Biking Trips 47 % High Occupancy Vehicle Trips 46 % Single Occupancy Vehicle Trips 2 % Transit Trips 5 % Walking and Biking Trips 36 % High Occupancy Vehicle Trips 57 % Single Occupancy Vehicle Trips Up to 1/2 mile 0.7% 34.7% 0.2% 64.4% Up to 1 mile 0.8% 23.8% 0.3% 75.0% Up to 2 miles 0.8% 16.8% 0.5% 81.9% Up to 3 miles 0.8% 12.8% 0.6% 85.9% Up to 4 miles 0.8% 10.1% 0.6% 88.5% Over 4 miles 0.2% 0.00% 1.54% 98.3% Auto share of total trips Trip Distance (mi) Bike Trips Waling Trips Transit Trips Auto Trips Up to 1/2 mile 6.7% 31.3% 0.7% 2.9% Up to 1 mile 23.5% 67.1% 4.1% 10.6% Up to 2 miles 43.7% 91.2% 12.5% 22.3% Up to 3 miles 60.1% 99.9% 19.0% 33.7% Up to 4 miles 76.0% 0.0% 25.5% 43.7% Over 4 miles 24.0% 0.0% 74.53% 56.28% 22
27 MODE SHARE BY TRIP DISTANCE Mode Share by Trip Distance MODE SHARE 100% 80% 60% 40% 20% 0% 25% OF ALL TRIPS ARE LESS THAN 1.95 MI 50% OF ALL TRIPS ARE LESS THAN 4.46 MI Bike share of total trips Ped share of total trips Transit share of total trips Auto share of total trips 0 to 1/2 1/2 to 1 1 to 3 3 to 5 5 to to to 50 Over 50 At short distances, active transportation trips account for a significant number of trips in the region. Walking trips account for almost half of all trips less than a quarter mile. Even at trip distances of 2 miles or less, which account for 25% of all trips in the region, almost 1 in 10 trips in the region are by walking, biking, or transit. Conversely, 50% of all trips in the region are longer than 4.5 miles. At trip distances over 4.5 miles, more than 95% are by car. These factors highlight the relationship between distance and mode choice. To increase rates of walking, biking and transit, the focus should be on creating opportunities for short trips. TRIP DISTANCE IN MILES Source: Atlanta Regional Commission Activity-Based Travel Demand Model TRIP DISTANCES DISTRIBUTION BY MODE SHARE Trip Distance Distribution by Mode SHARE OF TRIPS FOR EACH MODE 30% 25% 20% 15% 10% 5% 50% OF WALKING TRIPS ARE LESS THAN 0.7 MI 50% OF BIKING TRIPS ARE LESS THAN 2.4 MI 50% OF CAR TRIPS ARE LESS THAN 4.5 MILES 50% OF TRANSIT TRIPS ARE LESS THAN 8.7 MI Bike share of total bike trips Ped share of total ped trips Transit share of total transi Auto share of total auto trips When looking at the trip distance by each mode, several trends stand out. First, and most importantly, walking and biking trips are relatively short. About two-thirds of walking trips are less than one mile, and 90% of walking trips are less than 2 miles. Bike trips tend to be somewhat longer, but 75% of bike trips are still under 4 miles. Secondly, transit and auto trips tend to have relatively longer average trip lengths. 75% of transit trips are longer than 4 miles, and more than half of all auto trips are over 4 miles. 0% 0 to 1/2 1/2 to 1 1 to 3 3 to 5 5 to to to 50 Over 50 TRIP DISTANCE IN MILES Source: Atlanta Regional Commission Activity-Based Travel Demand Model PART 2: ASSESSMENT OF REGIONAL TRAVEL PATTERNS AND EXISTING CONDITIONS 23
28 24 WALKING AND BIKING PROPENSITY IN THE ATLANTA REGION
29 Walking and Biking Propensity in the Region Propensity for walking and biking in the region is not evenly distributed. Density, proximity to certain destinations, like schools, or availability of infrastructure influence how and where people walk and bike. A composite analysis of location-based characteristics identifies areas with high propensity for walking and biking. To the right is a summary of the inputs associated with potential walking and biking propensity: LIVE Areas with higher population density have higher rates of walking and biking. Population density was analyzed at the census block level to identify areas of high and low population density. WORK Like population density, higher densities of workers translates to higher propensity for people to walk and bike. Employee density was analyzed at the block level to identify areas for high and low population density. PLAY Trails and parks are attractors and generators of walking and biking activity. Proximity to trails and parks was analyzed. TRANSIT More than 3/4 of all transit trips start or end with a walking trip LEARN Schools are a significant source of walking and biking by populations that either can t drive because they are not old enough or are more likely to walk or bike for economic reasons. Proximity to elementary, middle, and high schools, as well as universities, was analyzed. SHOP Retail shopping areas are also attractors for walking and biking trips. Density of retail jobs, which can be used as a proximity for density of stores, was used to analyze areas with higher retail density. SUMMARY OF FINDINGS The highest propensity for walking and biking in the region is clustered in the core of Atlanta, roughly defined by the Atlanta BeltLine in Midtown and Downtown Atlanta. This area has the highest concentration and density of places to live, work, play, learn, shop, and take transit. Other major areas of the region with high walking and biking demand are the major activity centers, such as Perimeter, and traditional Main Street communities, like Downtown Fayetteville. PART 2: ASSESSMENT OF REGIONAL TRAVEL PATTERNS AND EXISTING CONDITIONS 25

30 26 WALKING AND BIKING PROPENSITY RELATIVE TO NEED
31 Equity and Propensity for Walking, Biking, and Transit For many in the region, walking, biking, and taking transit to get to work or daily destinations is a matter of economic need rather than choice. As noted in the Community Profile section of this report, 49% of individuals in the regional workforce make less than $35,000. For those taking public transit to work, 69% make less than $35,000. For those that walk to work, 75% of them make less than $35,000. For those that bike or take some other means of travel such as taxi, 59% of them make less than $35,000. As noted in the Safety section of this report, the Atlanta Regional Commission has created ETAs to identify areas and populations with economic and social needs. Social equity and environmental justice policy exists to ensure that harmful effects and underinvestment from public monies do not disproportionately impact children and low income, minority, elderly, or disabled people within the community. 22% of Atlanta region residents live in Equitable Target Areas (ETAs) yet 37% of all bicycle crashes and 42% of pedestrian crashes occur within the ETAs. Not only are many in the region walking, biking, and taking transit because they don t have an economic option, their chance of being injured or killed while walking, biking, or getting to transit is significantly higher too. When the ETAs are overlaid on the Walking and Biking Propensity map layer, a clear theme emerges. The majority of ETAs cover areas with moderate to low propensity for walking, biking, and transit. This means that the place-based characteristics of ETAs are less likely to encourage walking, bicycling, and transit when people are given a choice. The propensity model does not consider demographic characteristics other than population and employment density, so a designation of lower propensity does not mean that the people who live in these areas are less likely to actually walk, bike, or take transit. It just means that the environment is less supportive of active transportation modes. In other words, those in the region with the greatest need to walk, bike, and take transit are living in areas that are less walkable, bikeable, and transit-served. This theme highlights several trends to consider for future planning. First, the areas with the highest demand, or propensity, for walking, biking, and transit are also the least affordable places to live in the region. Second, the areas with the highest propensity for walking, biking, and transit are also where most of the jobs are located in the region. These trends can be addressed in two ways. In terms of housing policy, increasing affordable housing options in THOSE IN THE REGION WITH THE GREATEST NEED TO WALK, BIKE, AND TAKE TRANSIT ARE LIVING IN AREAS THAT ARE LESS WALKABLE, BIKEABLE, AND TRANSIT-SERVED areas with a high propensity for walking, biking, and transit areas can improve access to jobs for many in the region. In terms of transportation, enhancing transit service and walking and biking infrastructure around transit stops in ETAs can improve the safety and convenience of traveling for those that rely on these modes the most. As noted in the Economic Compteitiveness section of this report, a recent study by Harvard researchers found that the effect of commuting time on social mobility was stronger than any other factor, including school quality, income inequality, segregation, rates of two-parent households, and crime rates. Transportation policy, particularly for walking, biking, and transit, is a significant factor in improving economic prosperity and opportunity for those that live in the region, particularly for those that need it most. PART 2: ASSESSMENT OF REGIONAL TRAVEL PATTERNS AND EXISTING CONDITIONS 27
32 28 ATLANTA REGION TRANSIT SERVICE BY CATEGORY


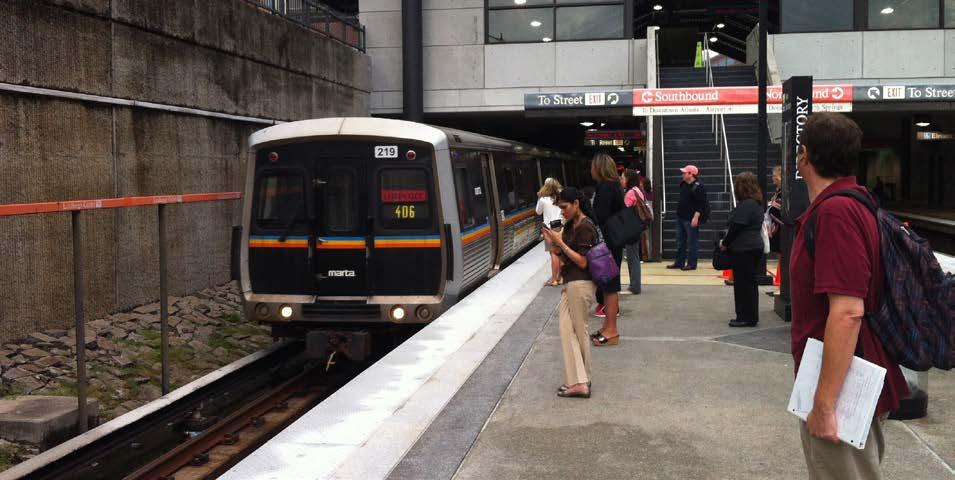
33 Transit Access Transit is a key component of the Atlanta region s mobility, facilitating over a quarter-million one-way trips per day and serving approximately one half-million residents of the region for at least some of their travel needs. It is a key contributor to a regional transportation system that offers true choice, particularly when combined with walking and biking. Transit service in the metro region can be divided into four primary categories: Proximity to Transit Just over 1 in 10 people in the region live within a five-minute walk of transit. Almost 1 in 4 people in the region live within a five-minute bike ride of transit. Similarly, 4 in 10 people in the region work within a five-minute walk of transit and over 6 in 10 people in the region work within a five-minute bike ride of transit. Comparatively, transit accounts for 2% of all trips in the region and 7% of all trips in the region are by walking, biking, or transit. This proximity analysis suggests even though transit service is close to where many people live or work, the convenience of walking or biking to a transit stop, or the transit service are not sufficient to encourage transit use. Expanding walkway and bikeway networks around transit stops as well as enhancing transit service has the potential to increase transit ridership, even with current development patterns. High capacity rapid transit, or MARTA s heavy rail service Commuter express bus service, such as GRTA s Xpress routes or CCT and GCT express services to downtown and midtown Atlanta Fixed-route local bus service Private operator circulator shuttles, such as the Atlantic Station shuttle or Georgia Tech Trolley Paratransit service providing transit connectivity to eligible customers The subsections that follow describe how and where people in the region access and use transit service. POPULATION AND EMPLOYMENT PROXIMITY TO TRANSIT 60% 40% 20% 0% 5 Minute Walk 5 Minute Bike Ride 16% LIVE 33% Source: 2010 US Census and ARC 41% WORK 62% 2 % TRANSIT TRIPS OF ALL TRIPS IN 5 % OF ALL TRIPS IN THE REGION ARE THE REGION ARE EITHER WALKING OR BIKING TRIPS Source: ARC PLAN2040 Travel Demand Model 16% of people live and 41% of people work within a five minute walk of a transit stop. PART 2: ASSESSMENT OF REGIONAL TRAVEL PATTERNS AND EXISTING CONDITIONS 29
34 MOBILITY IN THE ATLANTA REGION, 53 % 44 OF ARE ALL ON BOARDINGS LOCAL BUS OF ALL BOARDINGS % ARE ON RAIL ACCESS TO TRANSIT BY MODE Mode of Access to Transit To Transit From Transit Walked 72.4% 80.6% Dropped off 14.0% 8.6% Drove alone 10.6% 8.6% Rode in vehicle then walked or biked 1.8% 1.1% Carpool or vanpool 0.9% 0.9% Bicycle 0.3% 0.3% Source: Regional On-Board Transit Survey Final Report (2010) WALKING DISTANCE TO TRANSIT IN THE ATLANTA REGION Distance Rate From Transit Less than 1/8 of a mile 53% 80.6% 1/8 to 1/4 of a mile 27% 8.6% 1/4 to 1/2 mile 11% 8.6% Greater than 1/2 mile 9% 1.1% Source: Regional On-Board Transit Survey Final Report (2010) How Do People Get to and from Transit? Recent On-Board Travel Surveys conducted by ARC (2010) and GRTA (2010) indicate the majority of transit trips begin or end with a walking trip. Some form of driving represents the next most used mode, with the bicycle representing less than 1% of trips to and from a transit stop in the region. How Far Do People Travel to Get to Transit? The vast majority (83%) of walking trips to transit, which account for roughly 70 to 80% of all trips to and from transit stops, were a five-minute walk or less from their transit stop. Conversely, 9% of walking trips to transit stop were greater than a 10-minute walk, or roughly one-half mile or longer. In other words, the majority of people in the Atlanta region access transit by walking and the majority of those walking trips are less than a five-minute walk. To increase transit ridership, service needs to be provided in close proximity to either their origin or destination. Origins and Destinations of Transit Service in the Region Because the majority of the region s transit activity is carried by MARTA, the vast majority of transit trips begin and end in Fulton and DeKalb County. MARTA expanded into Clayton County in 2015, but ridership data associated with new routes is not yet available. Additionally, the City of Atlanta accounts for over half of the region s transit boardings, with around 57% of linked trips originating in the city. The MARTA-serviced cities of Decatur, Sandy Springs, College Park, East Point, and Stone Mountain account for over 10% of the origins of regional linked trips. Beyond the City of Atlanta, a great majority of transit trips still originate and end within Fulton and DeKalb Counties. This underscores the major employment concentrations in these two counties, with six of the region s primary jobs centers served directly by MARTA. It also underscores the predominance of transit use for commuting rather than non-work related trips. 30
35 ATLANTA REGION TRANSIT RIDER ORIGINS AND DESTINATIONS Place Trip Origin Home 51.7% 37.1% Trip Destination Work 22.2% 28.3% School/Daycare 4.7% 6.5% College/University 4.4% 5.8% Store/Retail 3.9% 5.6% Medical 2.7% 4.8% Another Home 2.1% 3.8% Restaurant 1.1% 2.5% Bank/Other Office 1.0% 1.4% Airport 0.9% 1.3% Hotel 0.5% 1.3% Recreation 0.4% 0.7% Place of Worship 0.2% 0.4% Other 4.2% 0.4% TRANSIT RIDER ACCESS TO HOUSEHOLD VEHICLES 41 % No Vehicles Source: Regional On-Board Transit Survey Final Report (2010) 27 % Two or more Vehicles 32 % One Vehicle Looking at types of places transit riders are traveling to, the majority of trips are commute trips. Schools and universities account for about 10% of origins and destinations for transit riders, which highlights the fact they are trip generators for walking, biking, and transit trips. The origin and distribution of transit trips reinforces a simple fact: transit is still largely used for commuting in the region and is not a significant travel choice to make daily, noncommute trips. Transit Need Some in the region use transit because they have no other option, while others use transit by choice because of convenience or other reasons. The ARC On-Board Survey found that roughly 4 out of every 10 transit riders have no access to a vehicle in their household and roughly 7 in 10 transit riders have one or no vehicles in their household. These facts underscore the need for transit in the region and the role it plays in providing economical options for households that cannot afford to drive. While the majority of transit riders are taking transit because of need, there is still a significant portion of the population that is taking transit by choice. 1 in 4 transit riders have access to two or more vehicles in their household, and 36% of respondents to the ARC On-Board Survey said they did have access to a vehicle on the day of the survey. PART 2: ASSESSMENT OF REGIONAL TRAVEL PATTERNS AND EXISTING CONDITIONS 31
36 32 TRANSIT PROPENSITY IN THE ATLANTA REGION

37 Quality and Geography of Transit Service in the Region The Atlanta region s transit services collectively reach many of the counties in the region, though the type and level of transit service varies. Currently, heavy rail service is only available in Fulton and DeKalb Counties. Fixed-route buses serve these two counties as well as Clayton, Cobb, Gwinnett, Cherokee, and Hall Counties. The Georgia Regional Transportation Authority (GRTA) administers express commuter bus service to 12 counties in the Atlanta region, and many of its routes are operated by the aforementioned local providers under contract. The transit propensity map on the previous page illustrates how transit service, as a function of frequency and travel speed, might impact propensity to walk or bike to a bus or rail stop. These do not reflect actual transit need based on demographic information for different parts of the region, although they do reflect the extensive levels of service planning and coordination that each of the region s transit providers has undertaken in determining routes and schedules. To determine this geographic distribution of transit service quality, current transit service data from MARTA, GRTA, CCT and GCT was used to analyze transit-readiness of the overall metro region. In the map, transit sheds represent areas where walking and biking to transit stops is relatively convenient. The areas with potential were determined by Rail stations are a significant source of pedestrian activity in the region, with 44% of all transit boardings in the region at rail stations. service frequency and consistency, and drawn using buffers along the roadway network based on estimated willingness to walk or bike to reach a given level of transit service. This notion is based on the assumption that travelers in the region are more likely to walk or bike to transit and are thus considered transit-accessible when transit service is frequent, is available in the early morning and late evening, and is relatively consistent at all times of service. See the table on the following page for more information about how the transit propensity map was created. The map highlights the fact that transit service is concentrated in the center of the region, For areas outside Fulton and DeKalb County, transit service is PART 2: ASSESSMENT OF REGIONAL TRAVEL PATTERNS AND EXISTING CONDITIONS 33

38 MOBILITY concentrated along select major corridors or at strategic locations with park-and-ride stations for commuters. Those in the outlying counties that wish to use transit have to drive to commuter bus stops, live along a major corridor, or drive to a MARTA station. This geographic distribution of service propensity illustrates that the region has strong transit service in its central urbanized counties but offers transit service inconsistently outside of these counties. TRANSIT SERVICE PROPENSITY FACTORS IN THE ATLANTA REGION Transit Type/Service Level Transit-Readiness Area Distance MARTA Rail 1 mile along the street network from the station 37.1% Fixed-Route Local Bus with peak-hour service headways of less than 15 minutes Fixed-Route Local Bus with peakhour service headways of at least 15 but less than 30 minutes Fixed-Route Local Bus with peak-hour service headways of 30 minutes or more Commuter Bus access points Service Frequency Premium Trip Destination 0.75 miles along the street network from stops 28.3% 0.5 miles along the street network from stops 6.5% 0.25 miles along the street network from stops 5.8% 0.5 mile radius from access points (park-and-ride stations or destination stops) radius used to account for limited street network around many outer stops 0.25-mile distance was added to transit sheds for routes where the ratio between Saturday service and weekday peak-hour service frequency was 1.5 or less. For example, a route where weekday peak hour headways are 15 minutes and Saturdays are 20 minutes would have a ratio of 1.33 between the two. This bonus was intended to recognize transit routes of relatively consistent service, suggesting that nearby travelers might be more inclined to rely on transit knowing that service levels are relatively even at all times. Any routes with a ratio of more than 1.5 did not have their sheds reduced, but simply did not include this premium distance. 5.6% 4.8% Proximity to transit stops and service frequency is an important factor that influences whether people use transit or other modes to get to daily destinations. 34

39 Managing Transportation Demand and Mode Choice Since the mid-1980s, Atlanta-area Employer Service Organizations (ESOs) have used Transportation Demand Management (TDM) strategies to reduce the number of single-occupancy vehicle trips by encouraging walking, biking, and transit use. Traditional TDM focuses on employer-based ridesharing, but many have expanded their efforts to include marketing and outreach, incentive programs such as transit fare subsidies, promotion of more compact development patterns, performance measurement, and development of traveler information systems. There are currently eight such organizations in the Atlanta region: ASAP+ Buckhead Area Transportation Management Association Central Atlanta Progress Clifton Corridor Transportation Management Association Commuter Club Midtown Transportation Solutions Perimeter Transportation and Sustainability Coalition Clean Air Campaign. Most of the Atlanta area ESOs are Transportation Management Associations that receive funding from an affiliated business within a Community Improvement District. The Clean Air Campaign, on the other hand, is a statewide ESO that receives state program funding and other resources that are not as readily available to the local ESOs. In addition, the MPO s regional transportation plan allocates additional funds for projects that support the TDM efforts. COMMUTING IS BETTER ON TWO WHEELS. OR TWO FEET. More than half of the U.S. population lives within five miles of their workplace, making bicycling or walking a feasible, fun, and healthy way to get to work. Cycling is a great way to get in a workout when you just don t have time to get to the gym. You stay healthy and get where you need to go. Log your biking or walking trips to work to be entered into the drawing to win $25, even if it s just part of the way. 1 in 10 win! Human-powered commuting means better health and no air pollution. Try out these zero emission commute modes to earn up to $100. Organizations around the region work together to promote these modes. Find the one closest to you at GaCommuteOptions.com. Visit GaCommuteOptions.com to learn how you can improve your commute by biking or walking to work, and earn cash and win prizes in the process. The Georgia Commute Options program provides incentives and resources to encourage commuters in the Atlanta region to travel to work by walking, biking, taking transit, carpooling, or teleworking. PART 2: ASSESSMENT OF REGIONAL TRAVEL PATTERNS AND EXISTING CONDITIONS 35


40 Photo: Caroline
41 SAFETY Safety is an important aspect of quality of life in the Atlanta Region. Accessing destinations and being able to travel comfortably, conveniently, and safely is a right shared by everyone. According to the 2014 Benchmarking Report by the Alliance for Walking and Biking, walking and biking fatalities account for almost 15% of US roadway fatalities, yet account for less than 12% of all trips in the US. Georgia ranks third to last among all states in terms of walking and biking rates yet has the seventh highest rate of walking and biking fatalities in the country. Georgia is designated one of 15 states designated as an FHWA Pedestrian Safety Focus Area and Atlanta as one of 29 cities in the US designated as an FHWA Pedestrian Safety Focus Area. This section highlights some of the safety trends in the region related to walking and biking. Crash Distribution in the Atlanta Region Walking and biking crashes are not distributed evenly throughout the Atlanta region. The pattern of pedestrian crash risk by census tract suggests that walking is generally safer in parts of the region that were designed with pedestrians in mind, and in areas where there are higher rates of walking, such as downtowns and pedestrian-friendly activity centers. Walking is generally less safe in areas that prioritize high-speed automobile travel. Walking safety also appears to be influenced by the fact that auto-oriented places in the region tend to have more affordable housing, which attracts residents that are more likely to rely on walking, to access transit, jobs, and meet their daily needs. The result is a mismatch between need and walkability that creates dangerous conditions for walking. Every county in the region has pockets of higher risk areas for walking. Dekalb, Fulton, Gwinnett, and Clayton Counties contain census tracts with the highest pedestrian crash rates. See map on next page: Pedestrian Crash Risk by Census Tract Bicycle crashes are more evenly distributed than pedestrian crashes. However like pedestrian crashes, there are pockets of higher-risk areas for bicyclists. Clayton, Cobb, DeKalb, Fayette, and Gwinnett contain census tracts with the highest bicycle crash rates in the region. Crash risk for both walking and bicycling was assessed based on the rate of crashes relative to estimated distance traveled on foot and by bike in each census tract. 1 Using a rate is a more accurate measure of safety, and allows for comparison between transportation modes and geographies. When looking at bicycling risk, it is notable that the areas that have the highest number of bicycle-involved crashes overall such as downtown Atlanta and the Georgia Institute of Technology tend to be safer than many other parts of the region on a miles-pedaled basis. This finding lends support to the commonly-cited safety in numbers thesis. See Map on next page: Bicycle Crash Risk by Census Tract 1 Estimated distances walked and biked by census tract were generated from ARC s Activity Based Travel Model. PART 2: ASSESSMENT OF REGIONAL TRAVEL PATTERNS AND EXISTING CONDITIONS 37
42 WALKING CRASH RISK BY CENSUS TRACT crashes relative to estimated miles walked* *Miles biked based on ARC s Activity-Based Travel Demand Model 38
43 BICYCLING CRASH RISK BY CENSUS TRACT crashes relative to estimated miles biked* *Miles biked based on ARC s Activity-Based Travel Demand Model PART 2: ASSESSMENT OF REGIONAL TRAVEL PATTERNS AND EXISTING CONDITIONS 39
44 SAFETY TOTAL WALKING AND BIKING CRASHES IN THE ATLANTA REGION PEDESTRIAN INJURIES & FATALITIES ,631 BICYCLE INJURIES & FATALITIES % Bicycle , % , Pedestrian Source: Georgia Electronic Accident Reporting System ( ) WALKING & BIKING TRIPS MAKE UP 5.3 % OF ALL TRIPS BUT 18 % OF ALL ROADWAY CRASH FATALITIES How Safe is Walking and Biking in the Atlanta Region? Drivers and passengers traveling in motor vehicles make up make up 94% of all people injured or killed on public roads in the region. Conversely, bicyclists and pedestrians make up just 6% off all crashes that result in an injury or a fatality. However, relative to the amount of trips people take by bike or foot in the region, fatality rates are significantly higher for people walking and biking. Walking and biking crashes account for about 18% of all transportation fatalities in the region, yet walking and biking trips account for just 5.3% of all trips. What: Number of Pedestrian and Bicycle Crashes resulting in an Injury or Fatality Pedestrian crashes accounted for 83% of all walking and biking crashes between 2012 and During the same period, bicycle crashes that resulted in an injury or fatality accounted for 17% of all walking and biking crashes that resulted in an injury or fatality. Injuries and fatalities involving people walking and bicycling increased slightly between 2012 and 2013 before dropping in Overall, between 2012 and 2014, pedestrian crashes increased by 1.5% and bicycle crashes increased by 0.6%. 40
45 BICYCLE AND PEDESTRIAN INJURY TRENDS What: Bicycle and Pedestrian Injury Trends Pedestrians account for the majority of active transportation injuries in the region. From 2012 to 2014, pedestrian injuries increased by 1.8%, and bicycle injuries increased by 1.5% BICYCLE AND PEDESTRIAN FATALITY TRENDS What: Bicycle and Pedestrian Fatality Trends Pedestrians account for the majority of active transportation fatalities in the region. Pedestrian fatalities rose sharply in 2013 but fell below 2012 levels in Bicycle fatalities exhibit a similar pattern, more than doubling between 2012 and 2013 and then dropping to 2 during Source: Georgia Electronic Accident Reporting System A 3 year period was selected for safety trend analysis due to data quality improvements introduced in 2012 PART 2: ASSESSMENT OF REGIONAL TRAVEL PATTERNS AND EXISTING CONDITIONS 41
46 SAFETY What: Injury Rates Between 2012 and 2014, injury rates for people walking, biking, and traveling in a motor vehicle remained relatively flat. What stands out is the fact that on a per-mile basis, both walking and biking are statistically more dangerous than driving or riding as a passenger in a motor vehicle. People biking are about 6 times more likely to be injured than people traveling in motor vehicles, and people walking are about 8 times mores likely to be injured than people traveling in a motor vehicle. INJURY RATES Injuries per 100 Million Miles Walked Injuries per 100 Million Miles Biked Injuries per 100 Million Miles Traveled in a Motor Vehicle What: Fatality Rates FATALITY RATES Fatality rates for walking and bicycling between 2012 and 2014 exhibit more volatility than fatality rates for motor vehicles. The most striking trend, however, is the not the variation within transportation modes but between them. Fatalities for motor vehicles hover around 1 per 100 million miles traveled. For bicyclists, the average fatality rate between 2012 and 2014 was 8 per 100 million miles pedaled, indicating that the risk of being involved in a fatal crash while bicycling is about 8 times higher than driving or riding in a motor vehicle. For pedestrians, the average fatality rate was 34 per 100 million miles walked. That means that on a per-mile basis, people walking are about 34 times more likely to be killed while walking compared to traveling in a motor vehicle Source: Georgia Electronic Accident Reporting System Fatalities per 100 Million Miles Walked Fatalities per 100 Million Miles Biked Fatalities per 100 Million Miles Traveled in a Motor Vehicle 42
47 Where: Roadway Type The majority of bicycle and pedestrian crashes occur on neighborhood and connector roadways. The second highest occurence is on major arterials. HIGHWAY/ HIGHWAY RAMP PEDESTRIAN AND BICYCLE CRASHES BY ROADWAY TYPE % of All Bicycle Crashes % of All Pedestrian Crashes % of All Regional Roadway Miles When compared to roadway miles by type in the region, a different trend emerges. Major arterials account for just 7% of all roadway miles, yet 22% of all bicycle crashes and 28% of all pedestrian crashes occur along major arterials. The rate of crashes relative to roadway miles is disproportionate on these major roadways and highlight the safety improvements needed along major corridors in the region. NEIGHBORHOOD/ CONNECTOR MAJOR ARTERIAL 0% 20% 40% 60% 80% 100% Source: Georgia Electronic Accident Reporting System; Atlanta Regional Commission Where: Development Context By land use type, the majority of bicycle and pedestrian crashes occur adjacent to commercial or institutional land uses. For pedestrians, almost 1 out of 2 crashes occur adjacent to commercial or institutional land uses. For bicycles, just over 4 out of every 10 crashes occur adjacent to commercial or institutional land uses. Commercial and institutional land uses account for just 7% of the land area in the region, yet nearly half of all pedestrian crashes and over 40% of bicycle crashes occur adjacent to these land uses. In other words, roadways through commercial and institutional areas are the most unsafe for bicyclists and pedestrians in the region. OTHER INDUSTRIAL NATURAL AREAS COMMERCIAL/ INSTITUTIONAL RESIDENTIAL PEDESTRIAN AND BICYCLE CRASHES BY DEVELOPMENT CONTEXT % of All Bicycle Crashes % of All Pedestrian Crashes % of Regional Land Area 0% 20% 40% 60% 80% 100% Source: Georgia Electronic Accident Reporting System; Atlanta Regional Commission AN ANALYSIS OF CRASHES BY ROADWAY TYPE AND DEVELOPMENT CONTEXT STRONGLY SUGGESTS THAT MULTI-LANE COMMERCIAL ARTERIALS ARE THE MOST DANGEROUS PLACE IN THE REGION TO WALK AND BIKE. PART 2: ASSESSMENT OF REGIONAL TRAVEL PATTERNS AND EXISTING CONDITIONS 43


48 SAFETY Equity and Walking and Biking Safety WALKING AND BIKING SAFETY IN EQUITABLE TARGET AREAS (ETA) The Atlanta Regional Commission has developed a tool called Equitable Target Areas, or ETAs, to identify areas and populations with economic and social needs. Social equity and environmental justice policy exists to ensure that harmful effects and underinvestment from public monies do not disproportionately impact children and low income, minority, elderly, or disabled people within the community. The ETAs were used for this plan to analyze whether walking and biking crashes disproportionately occur within these ETAs. Just over 2 out of 10 residents in the region live within an ETA and just over 3 out of 10 workers in the region work within an ETA. Yet about 4 out of 10 bicycle and pedestrian crashes in the region occurred within ETAs. The rate of bicycle and pedestrian crashes is higher in ETAs relative to the percentage of the regional population that lives and works there. Those that live within ETAs are less likely to own or have access to a household car, leading to a greater propensity and need to walk, bike, or take transit to get to work and other daily destinations. Targeting investment in walking and biking safety improvements within ETAs can help address this discrepancy in transportation safety. 40% 30% 20% 10% 0% 22.1% % OF RESIDENTS IN THE REGION THAT LIVE WITHIN AN ETA 31.2% % OF WORKERS IN THE REGION THAT WORK WITHIN AN ETA 37% % OF BICYCLE CRASHES IN THE REGION THAT OCCUR WITHIN AN ETA Source: Georgia Electronic Accident Reporting System; Atlanta Regional Commission 42% % OF PEDESTRIAN CRASHES IN THE REGION THAT OCCUR WITHIN AN ETA High speeds, high vehicle volumes, and the absence of adequate walkway and bikeway infrastructure creates an environment that is often dangerous and stressful for those walking and biking along commercial corridors in the region. 44
49 THIS PAGE INTENTIONALLY LEFT BLANK PART 2: ASSESSMENT OF REGIONAL TRAVEL PATTERNS AND EXISTING CONDITIONS 45

50
51 ECONOMIC COMPETITIVENESS The Atlanta region is in competition with other major metro areas around the country, and the economic health of the region is tied strongly to quality of life, access to jobs, and business opportunities. Transportation infrastructure and transportation choices play a key role in connecting people and places. Businesses are increasingly locating in areas with skilled and educated workforces. Activity centers in the region, particularly those connected to transit, provide the greatest diversity of business opportunities and workers. Schools and universities also create opportunities by providing the skills and training employees need to succeed in business. Likewise, workers are increasingly making decisions about where they work based on quality of life. Education and technology advances have shifted the way businesses operate. An internet connection and access to an airport is frequently sufficient to help businesses connect with customers and clients. With businesses and employees tied less to geography, quality of life factors like commute options, access to parks and social activities, and educational opportunities are driving decisions about where people decide to work. Quality of life is an important economic development tool to recruit and retain businesses and a competitive workforce. Economic competitiveness is also tied to topics like social mobility and public health. A workforce that spends excessively on transportation and health care needs can be a drag on economic growth and personal wellbeing. It can also negatively impact the ability to provide for others and create opportunities for the next generation in a community. This section highlights some of the economic competitiveness trends in the region related to walking, biking, and transit, and how demographic and economic trends are increasingly prioritizing walkable, bikable, and transit-serviced places as a means to economic opportunity. Real Estate Investment and Economic Performance Trends in real estate development in the Atlanta region reflect broader national demographic shifts and shifting housing preferences within two large cohorts: Millenials (ages 18-36) and Baby Boomers (ages 50-68). As Millenials enter the workforce in larger numbers and Baby Boomers retire, demand for housing in walkable areas near urban amenities is expected to continue to increase. 1 1 Urban Land Institute. (2015). America in 2015: A ULI survey of view on housing, transportation, and community. Retrieved from: centers-initiatives/terwilliger-center-for-housing/ research/community-survey/ PART 2: ASSESSMENT OF REGIONAL TRAVEL PATTERNS AND EXISTING CONDITIONS 47
52 ECONOMIC COMPETITIVENESS WALKUPS VS. DRIVABLE SUB-URBAN Comparing Average Rents per Sq.Ft. WalkUPs The Atlanta Regional Commission and George Washington University School of Business published The 2013 WalkUP Wake-Up Call: Atlanta, which defines WalkUPs, or walkable urban places, as areas with higher development densities, mixed land uses, integrated real estate products, multiple transportation options including rail and bus transit, biking, and highways, and a place where every destination is walkable. The research found that there are relationships between development patterns, real estate investment, and economic performance, and that real estate development in the Atlanta region is undergoing a fundamental shift away from low-density greenfield development. Walkable urban projects now make up the majority of real estate development in the Atlanta region. Among the relevant findings: $25 $20 $15 $10 $5 $0 OFFICE RETAIL RENTAL FOR-SALE HOUSING HOUSING WalkUPs Driveable Sub-Urban Source: The WalkUP Wake Up Call: Atlanta Regional Commission OVERALL 46 WalkUPs were identified and divided into three categories: Established WalkUps, Emerging WalkUPs, and Potential WalkUPs. The WalkUps were also classified by type: Downtown Examples include GSU-Government Center and Peachtree Center Downtown Adjacent Examples include Castleberry Hill and Midtown Urban Commercial Examples include Arts Center and Inman Park Urban University Examples include Atlanta University Center, Emory, and Georgia Tech Suburban Town Center Examples include Downtown Decatur and Downtown Marietta Drivable Sub-Urban Commercial Redevelopment Examples include Buckhead and Cumberland Core Greenfield and Brownfield Examples include Atlantic Station The study found that two factors explain 70% of the variation in economic performance among the 24 metro WalkUPs. The first factor is educational attainment and the second is share of jobs concentrated in knowledge industries. Established WalkUPs account for just 0.55% of total land in the metro area but contain 19% of all jobs. Average rent for all development types in current WalkUPs is 112 percent higher than in drivable suburban areas. 60% of established WalkUPs are served by rail transit. Multifamily rental housing was the most significant driver of real estate growth in regionally significant WalkUPs, which is consistent with national trends. In the 1990s, less than 9% of income-producing real estate captured by Established WalkUPs was multifamily rental housing. In the early 2000s, this rose to 28% and has skyrocketed to 88% in this real estate cycle. 74% of Established WalkUPs in the region are within the city of Atlanta. However, all nine Emerging WalkUPs are in the suburbs and eight of the ten Potential WalkUPs are outside of the city. Stronger economic performance by metro Atlanta WalkUPs was associated with lower measures of social equity. 48
 The Livable Centers Initiatives is a program developed by the")
53 Livable Centers Initiative DESIGNATED LCI AREAS MAKE UP ONLY 69 % OFFICE DEVELOPMENT (sq ft) 4 % BUT ACCOUNT FOR 29 % 7 % COMMERCIAL DEVELOPMENT (sq ft) IN THE ATLANTA REGION Source: Atlanta Regional Commission Livable Initiative 2015 Report OF THE REGION S LAND AREA, RESIDENTIAL DEVELOPMENT (units) The Livable Centers Initiatives is a program developed by the Atlanta Regional Commission to tie land use and development decisions to transportation infrastructure investments. Since 1999, LCI has assisted 112 communities with more than $194 million in planning and implementation grants to devise strategies that reduce traffic congestion and improve air quality by better connecting homes, shops, and offices. The program has been successful at generating re-investment in established activity centers and corridors in the Atlanta region and creating new town centers in growing communities outside of the region s core. The designated LCI areas account for 4% of the land area, yet account for 69% of the office development, 29% of the commercial development, and 7% of the residential development. LCI areas, which encompass the most walkable, bikable, and transit-service areas of the region, account for a significant amount of development and economic activity in the region. Business Location With workers and businesses increasingly prioritizing quality of life and access to transit, many companies are relocating to denser, more walkable, and better served transit activity centers. The trend is highlighted by growth in both city populations and jobs. Students walk to shops near Duluth Town Green, a mixed use town center created as a result of an LCI planning study. PART 2: ASSESSMENT OF REGIONAL TRAVEL PATTERNS AND EXISTING CONDITIONS 49
54 ECONOMIC COMPETITIVENESS CITY AND SUBURBAN GROWTH FOR US METROPOLITAN AREAS OVER 1 MILLION POPULATION 1.6% 1.2% 0.8% 0.4% 0% ANNUAL AVG GROWTH Source: Brookings Institute CORE AND PERIPHERY JOB GROWTH AND FOR US METROPOLITAN AREAS OVER 1 MILLION POPULATION 1.5% 1.0% 0.5% 0.0% -0.5% -1.0% 0.1% -0.2% CITY CENTER % 1.6% PERIPHERY % -0.5% Primary City Growth Suburban Growth US Metro areas over 1 million population Atlanta metro area CITY CENTER Source: Cortwright, J. (2015) Surging City Center Job Growth. City Observatory. -0.1% -0.8% PERIPHERY Population Growth The Atlanta region added about 1 million new residents from 2000 to 2010, which represents an average annual growth rate of 2.1%. 1 The majority of this growth occurred in suburban areas. Since 2010, however, population growth within three miles of downtown Atlanta, and in US central cities overall, has been stronger than in suburban and exurban areas. 2 This marks a sharp reversal in the decades-long national trend of suburban population growth and central city population decline. Job Growth As more people have moved from the suburbs to cities, employers have responded by locating closer to workers. From , the majority of both population and job growth in the largest metro regions occurred outside a threemile radius of downtown cores. From , however, the trend flipped. During the recession and initial recovery, there was less job growth overall, but the growth that did occur happened primarily in city centers. The Atlanta region followed a similar trend with the city center lagging behind periphery job growth from Employment in both the center and periphery declined between 2007 and 2011; however, the rate of decline was higher in periphery areas. 3 1 The Atlanta Regional Commission. (2013). Plan Frey, W. (2015, May 21). New Census Data: Selective city slowdowns and the city-suburb growth gap. [Web log post] The Avenue: Rethinking Metropolitan America, A Brookings Institute Blog. Retrieved from: brookings.edu/blogs/the-avenue/posts/2015/05/21- new-census-data-city-slowdowns-city-suburbgrowth-gap-frey 3 Cortwright, J. (2015) Surging City Center Job Growth. City Observatory. Retrieved from: cityobservatory.org/wp-content/uploads/2015/02/ Surging-City-Center-Jobs.pdf 50
55 This [TOD] project will provide State Farm s work force a continued platform for success with direct access to a true live-work-play environment and a MARTA station. When Kaiser Permanente was looking for a site for its new innovation and information technology hub for 900 new employees, the company sought public transit and a walkable community. Business Testimonials Between 2010 and 2015, hundreds of US companies moved from autooriented suburban campuses to walkable, bikeable, mixed-use locations well served by transit. 1 A recent study looked at the motivations behind these relocation decisions, and found that employers valued locations that were easily accessible by a range of transportation options. Companies across the country reported that locating in vibrant urban neighborhoods, where people want to both live and work, helped them attract educated workers. In Atlanta, several large corporations have recently moved to mixed-use transit-served places that facilitate walking and bicycling. Following are some testimonials from corporations in the Atlanta region. STATE FARM This [TOD] project will provide State Farm s work force a continued platform for success with direct access to a true live-work-play environment and a MARTA station. 2 MERCEDES-BENZ We re living in an environment where it s all about talent, Cannon said. Offering the best quality of life attracts the best talent. 3 Talent and access to mass transit also drove Mercedes site selection in Atlanta. The Central Perimeter offers an appealing balance of suburban and urban living environments, located in between the family-friendly northern suburbs and the Millennial-rich in-town neighborhoods. Folks concerned with houses and schools can locate north and commute south, Cannon said. The Gen-Yers who want that urban living... can take a short MARTA ride (to work). KAISER PERMANENTE It was important to have a great location with an ability to walk to restaurants and shops and a location that was close to public transportation. When Kaiser Permanente was looking for a site for its new innovation and information technology hub for 900 new employees, the company sought public transit and a walkable community. 4 ATHENA HEALTH Our people are our most precious resource. Selecting strategic sites in key urban markets across the country opens up possibilities and helps us attract exciting new talent and resources. 5 1 Smart Growth America and Cushman & Wakefield. (2015). Core Values: Why American Companies are Moving Downtown. Retrieved at: smartgrowthamerica.org/documents/core-values.pdf 2 talk/2014/02/state-farm-kdc-announce-massive. html?page=all 3 mercedes-benz-to-invest-100m-in-atlanta.html 4 transit-walkability-key-factors-in-kaiser.html 5 Source: idusngnx5kydq+e4+gnw PART 2: ASSESSMENT OF REGIONAL TRAVEL PATTERNS AND EXISTING CONDITIONS 51
56 ECONOMIC COMPETITIVENESS Universities Universities play a significant role in the regional economy. They are also tend to have a student and faculty population that is more inclined to walk, bike, and take transit. Some of the direct economic benefits of universities include: Direct spending by students, staff, and faculty. Higher wages associated with educational attainment. Science and technology research conducted at universities results in innovation, which is particularly important with knowledge economies. Universities have walking and biking commute rates that are higher than city and regional averages. The Atlanta region is home to 48 accredited degree-granting colleges and universities serving over 176,000 AMONG THE 50 LARGEST METRO REGIONS IN THE COUNTRY, RESEARCHERS FOUND THAT THE ATLANTA REGION RANKS 49TH IN UPWARD MOBILITY, MEASURED BY THE AVERAGE INCOMES OF PEOPLE BORN TO PARENTS EARNING LESS THAN THE AREA S MEDIAN INCOME. PLACES WITH HIGHER SOCIAL MOBILITY HAVE LESS RESIDENTIAL SEGREGATION, LESS INCOME INEQUALITY, BETTER PRIMARY SCHOOLS, GREATER SOCIAL CAPITAL, AND GREATER FAMILY STABILITY. students. Some of the largest colleges and universities include Georgia State University, Kennesaw State University, the Georgia Institute of Technology, Emory University, Clark Atlanta University, Morehouse College, and Spellman College. These institutions provide a boost to the region s economy and also increase demand for high-quality, connected walking and bicycling infrastructure. Universities tend to have higher than average rates of walking and bicycling than other destinations, due in part to space constraints on campus that make car ownership and parking expensive. The municipality in the Atlanta region with the highest walking commute mode share is Oxford, home to Oxford College. Many area universities also run Transportation Demand Management (TDM) programs designed to encourage people to take transit, walk, or bike to campus. Examples of such programs include bike share programs, discounted Georgia Regional Transportation Authority (GRTA) bus passes, and free shuttle service around campus and to popular student destinations, such as the Georgia Tech and Emory shuttles. Social Mobility, Commute Times, and the Economy Social mobility is defined by the ability of individuals and families to move out of poverty. Job access and commute times play important roles in determining the level of social mobility, which in turn has an impact on income inequality and the strength and stability of the economy. 1 1 Boushey, H. & Price, C. (2014) How are Economic Inequality an Growth Connected? A review of recent research. Washington Center for Equitable Growth. Two recent studies from Harvard University s Equality of Opportunity Project highlight the facts that the Atlanta region faces serious challenges with regard to social mobility, and that low social mobility is linked to transportation and land use patterns. Among the 50 largest metro regions in the country, researchers found that the Atlanta region ranks 49th in upward mobility, measured by the average incomes of people born to parents earning less than the area s median income. 2 Places with higher social mobility have less residential segregation, less income inequality, better primary schools, greater social capital, and greater family stability. In a separate but related study, researchers found that the effect of commuting time on social mobility was stronger than any other factor, including school quality, income inequality, segregation, rates of twoparent households, and crime rates. 3 The impact of transportation on the ability of low-income families to escape poverty was most striking in areas with high degrees of segregation, income inequality, and sprawl, such as the Atlanta region. The authors point out that the strength of the commute-time effect is unlikely to be only the direct result of poor access to jobs. Instead, the relationship is more likely to be the result 2 Chetty et. al. (2014). Where is the Land of Opportunity? The Geography of Intergenerational Mobility in the United States. Harvard University Equality of Opportunity Project. Retrieved from: equality-of-opportunity.org/index.php/papers on June 20, Chetty, R. & Hendren, N. (2015). The Impacts of Neighborhoods on Intergenerational Mobility: Childhood Exposure Effects and County-Level Estimates. Harvard University Equality of Opportunity Project.. Retrieved from: on June 20,
57 of some characteristic(s) of the place that is highly correlated with long commute times. Low-income households are also increasingly located in suburban, autooriented parts of the region that are not well served by transit and where walking and bicycling may not perceived as safe or convenient options. 1 This leads to some families spending up to 37% of their income on transportation to access employment opportunities and meet daily needs. 2 Making lowercost forms of transportation such as walking, bicycling, and transit available and attractive to low-income people can reduce the overall cost of transportation and contribute to social mobility. In the long run, increased social mobility is likely to lead to a more prosperous and economically competitive region. Public Health ADULT OBESITY RATE IN GEORGIA % 30% 25% 20% 15% 10% 10% 5% 0% 14% 21% 25% 25% 26% 26% 26% 28% 28% 29% 28% Source: Trust for America s Health and Robert Wood Johnson Foundation. The State of Obesity 2014 [PDF]. Washington, D.C.: % 30% How people travel impacts their level of physical activity and their personal health. According to the CDC, 4 out of 5 adults and 7 out of 10 high school students in the US do not get their recommended weekly physical activity. Physical activity can help with weight control and also lower the risk for heart disease, stroke, type 2 diabetes, depression, and some cancers. Additionally, obesity-related conditions are some of the leading causes of preventable death. In the US, more than one third of adults are obese and it is estimated that the medical costs for people who are obese are $1,429 higher than those of normal weight. 1 The Atlanta Regional Commission. (2015, January 12). Suburbanization of Poverty in Metro Atlanta: An Update. Retrieved at: 2 The Center for Neighborhood Technology. Housing and Transportation (H+T) Affordability Index. Accessed at: housing-and-transportation-affordability-index As of 2013, Georgia has the 18th highest obesity rate in the country overall and the 17th highest obesity rate in the country for children between the ages of years of age according to The State of Obesity: Better Policies for a Healthier America, which is a report published annually by the Robert Wood Johnson Foundation and the Trust for America s Health. These trends have significant impacts on personal health, economic development, and quality of life. Obesity increases healthcare costs and negatively impacts daily life. Conversely, providing opportunities to integrate physical activity into daily life can help reverse these trends. Investing in walking and biking infrastructure and programs for transportation and recreation is a key way that ARC can have a positive impact. In 2012, the Center for Quality Growth and the Atlanta Regional Commission conducted a Health Impact Assessment (HIA) of the Atlanta Regional Commission s Plan HIAs are a tool and method of analysis to identify the health impacts of public policy and decision-making. The HIA for Plan 2040 found that a shift in transportation would likely generate improvements in safety, access and equity, economic stability, physical activity, environmental quality, and civic and social participation. Two important topics related to health and transportation include Health Risk and Physical Activity Risk. The HIA mapped both of these factors and found that health impacts are not evenly distributed in the region. The maps on the following pages illustrate the geographic variation in health and physical activity risks in the Atlanta region. PART 2: ASSESSMENT OF REGIONAL TRAVEL PATTERNS AND EXISTING CONDITIONS 53
58 54 PHYSICAL ACTIVITY RISK IN THE ATLANTA REGION
59 HEALTH RISK RANKING IN ATLANTA REGION PART 2: ASSESSMENT OF REGIONAL TRAVEL PATTERNS AND EXISTING CONDITIONS 55
60 ECONOMIC COMPETITIVENESS Health Risk in the Region For health risk in the region, the HIA scored the region using an index measuring a variety of social, economic, and demographic factors. The factors include the proportion of residents or households: BY 2030, 1 OUT OF EVERY 5 RESIDENTS WILL BE OVER THE AGE OF 60 Under age 18 Over age 65 Headed by a single female Color or ethnic identity Less than a high-school degree (or equivalent) after age 25 Unemployed Employed in a blue collar job Below the federal poverty level The results indicate that overall health risk is higher in the southern portion of the region. The highest overall health risk occurs in selected parts of Fulton, Dekalb, Clayton, and Spalding Counties. Physical Activity Risk in the Region The HIA also estimated areas of the region at risk for low rates of physical activity using the following metrics: Share of commuters who carpool or drive alone Travel time to work Population density Rates of heart disease, stroke, and diabetes This analysis found that the highest risk for activity-related chronic disease was in outlying and suburban counties (with the exception of some inner-ring northern suburbs). The lowest physical activity risk was found in central city areas, especially northeast Atlanta. Lifelong Communities and Aging in Place The Atlanta region is experiencing an unprecedented demographic shift. By 2030, 1 out of every 5 residents will be over the age of 60. This change includes not only a dramatic growth in the number of older adults who call Atlanta home, but also the relatively new phenomenon of longevity people living longer than ever before. The Atlanta Regional Commission has developed a program called Lifelong Communities focused on meeting the needs of a growing and aging demographic. By focusing on topics such as transportation, affordable housing, access to health care services, and other opportunities for public life, the region is working towards developing communities that allow individuals to have a high quality of life throughout t heir lifetime. Tourism Those who live and work in the region are not the only ones that walk, bike, and take transit in the region. Visitors for business, pleasure, or other reasons often arrive in the region without a car and find themselves walking, biking, or taking transit for at least a portion of their trips. By the numbers, tourism and conventions draw over 42 million annual visitors to the region, supporting a $12 billion hospitality industry that employs over 230,000 people in Metro Atlanta. Enhancing access to transit and alternative travel options can enhance the experience of visiting Atlanta while reducing traffic congestion for those that live in the region. Innovation in Transportation Mobility The proliferation of new transportation services built on mobile computing applications such as car sharing, bike share, and ridesharing are changing the way people think about mobility. These services promote more flexibility in multi-modal trip chaining, reduce the need for car ownership, and contribute to increasing demand for a more balanced transportation system. In addition to national companies such as Zipcar and Uber, smartphone applications such as CycleAtlanta and One Bus Away mobile apps or the soon-to-be-launched bike share system in the City of Atlanta are examples of local innovations that are challenging the idea that car ownership is an essential component of living in the Atlanta region. 56
.")
61 Public spaces and outside seating provide places for people to socialize, linger, and interact. Quality of Life, Art, and Placemaking Since 2012, the Atlanta Regional Commission has continued the work of the Metro Atlanta Art and Culture Coalition (MAACC). As part of ARC s effort to nurture the relationships between art and economy, ARC developed the Arts and Culture Report. The most recent report in 2015 identified six initiatives key to fostering the arts and cultural community: Building participation Fostering innovation Creating a sustainable workforce Supporting and developing leadership Visualizing data Placemaking The report also found that successful placemaking attracts people to a place by providing them with a sense of community and belonging. Inevitably, when people are in a place, they engage in its economy. The Atlanta region competes with other metropolitan areas in the Southeast and throughout the country for educated workers that value the amenities of urban living. Institutions like museums and concert halls provide anchors for arts and culture, but bringing art into the public spaces of the city can help activate and energize the pedestrian environment. Murals created by Living Walls in Atlanta and the annual Art on the Beltline exhibit are examples of successful public art installations that add visual interest, contribute to a sense of place, and promote healthy activity. Public plazas, gathering spaces, and outdoor events are also essential components of a successful urban environment that fosters walkability and social interaction. Farmers markets, food trucks, and neighborhood festivals are popular throughout the region. These temporary and informal installations bring life to public spaces, attract pedestrian activity, and create connections between people and places. PART 2: ASSESSMENT OF REGIONAL TRAVEL PATTERNS AND EXISTING CONDITIONS 57


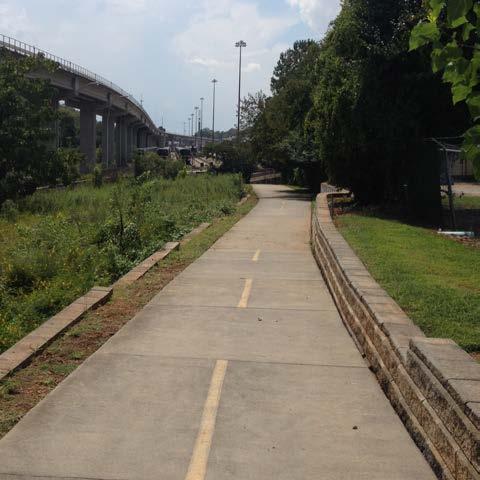

62
63 REGIONAL TRAIL ASSESSMENT Trails provide opportunities for people of all ages and abilities to walk and bike in a comfortable off-street environment. In addition to expanding active transportation options and recreational opportunities, trails can generate economic benefits, enhance sense of place, and help connect people to nature. For the purposes of this assessment, a trail is defined as a paved path that is physically separated from highspeed motor vehicle traffic by open space or a landscaped buffer. This includes paths parallel to roadways (sometimes called sidepaths ) and paths within an independent right-of-way (sometimes called greenways ). Trails can accommodate a range of users in addition to people walking and bicycling, including runners, skaters, equestrians, and even low-speed electric vehicles. The Atlanta Regional Commission, along with many cities and counties in the region, have made significant investments in trails over the past two decades. The PATH Foundation, an Atlanta-based non-profit organization, has also been collaborating with multiple jurisdictions to steadily increase trail mileage in the region and is working to connect many of the trails they have helped fund, which include the Silver Comet Trail, the Stone Mountain Trail, and Arabia Mountain Trail, among others. The Georgia Department of Transportation (GDOT) has also been an active partner in regional trail development, most recently with the Path400 project. The sections that follow describe the current network of trails in the region as well as identify areas of need and opportunity for trail network expansion and gap closure. Local Trails vs. Trails of Regional Significance For the purposes of this plan, trails in the Atlanta region can be classified as local trails or trails of regional significance. Local trails facilitate short recreational or utilitarian trips within and between neighborhoods, and are primarily used by people that live or work within a few miles. Peachtree City s shared use path system is an example of a mature trail network that effectively serves local destinations. Trails of regional significance, by contrast: May cross jurisdictional boundaries to connect cities, regional activity centers, parks, and other trails Can be a destination in their own right such as the scenic Arabia Mountain Trail or a heavily-traveled commuter corridor like the Atlanta Beltline Have the potential to be a key link connecting the regional trail network PART 2: ASSESSMENT OF REGIONAL TRAVEL PATTERNS AND EXISTING CONDITIONS 59
64 REGIONAL TRAIL ASSESSMENT EXISTING TRAILS: LOCAL AND REGIONALLY SIGNIFICANT 60
65 Currently, there are almost 400 miles of trails in the region. Local trails account for about 60% of the existing trails in the region. Conversely, trails of regional significance account for about 40% of the existing trails in the region. The trails of regional significance could also form a regional hub-and-spoke type system that, when completed, will connect all four quadrants of the region to the core of the region. See the Closing the Gaps in the Trails of Regional Significance section of this chapter for more details on this effort to effectively create a highway system for active transportation in the region. PROXIMTY TO TRAILS FROM HOME AND WORK 50% 40% Live 30% 20% 10% Work 22% 11% 6% 43% 0% 5 MINUTE WALK 5 MINUTE BIKE Source: Atlanta Regional Commission EXISTING TRAIL MILEAGE Miles Local Trails* % Trails of Regional Significance % % of Total Trails Total % * Note: Includes 94 miles of multi-use paths shared with golf carts in Peachtree City Source: Atlanta Regional Commission Where are Trails in the Region? Trails can be found in all four quadrants of the region, but the number of trails and their location are not evenly distributed. With the exception of Peachtree City s extensive local shared use path network and the Arabia Mountain/Rockdale River Trail, existing trails are disproportionately concentrated in the central and northern parts of the region. Additionally, Fulton, Dekalb, Cobb, Gwinnett, and Paulding Counties together contain nearly all of the region s trails of regional significance. Several counties, including Barrow, Coweta, Henry, Spalding, and Walton, do not contain any trails. Proximity to Trails in the Region For many in the region, access to a trail requires a drive or longer-distance travel by walking, biking, or transit. Enhancing access to trails with walkways and bikeways can increase the likelihood someone can walk or bike to a trail for recreation or transportation. Additionally, expanding the trail network in the region will also increase opportunities to be physically active, socialize, and connect with nature or to daily destinations. Currently, just 6% of the region s population lives within a five-minute walk of a trail. A five-minute bike ride nearly doubles the number of people that live close to a trail. The variance is more dramatic relative to where people work. Currently, just over 1 in 10 workers in the region live within a five-minute walk of a trail in the region. A five-minute bike ride increases the number to just over 4 in 10 workers, or a four-fold increase. Expanding local trail networks can improve access to trails for many residents and workers. They can also help connect where people live to jobs and activity centers, increasing opportunities to commute by walking, biking, or other active travel modes. PART 2: ASSESSMENT OF REGIONAL TRAVEL PATTERNS AND EXISTING CONDITIONS 61
66 REGIONAL TRAIL ASSESSMENT EXISTING TRAILS WITH EQUITABLE TARGET AREAS 62
 to identify areas in the region with greater social needs.")
67 Trail Access and Equity Trails are not distributed evenly in the region, particularly for those that have a greater need for active transportation and recreation opportunities. The ARC has created Equitable Target Areas (ETAs) to identify areas in the region with greater social needs. ETAs are a geographic index based on age, educational attainment, median housing values, poverty rates, and race used to identify areas of concern. Currently, 22% of residents and 31% of workers in the region are within an ETA, yet 18% of existing trails are within an ETA. People living and working in ETAs have slightly lower access to trails relative to other areas of the region. The ETAs and Existing Trail Map highlights the geographic distribution of trails relative to ETAs in the region. Notable clusters of ETAs whose residents lack convenient access to trails include: West and southeastern sections of the City of Atlanta Central and northern Clayton County Buford Highway corridor from Brookhaven to Norcross, including Chamblee, Doraville, and parts of unincorporated Dekalb and Gwinnett County Central and southern Spalding County Expanding trail networks in ETAs can create more equitable opportunities to walk, bike, and be active for recreation and transportation in the region. TRAIL ACCESS AND EQUITY 35% 30% 25% 20% 15% 10% 5% 0% 22% % OF RESIDENTS IN REGION THAT LIVE WITHIN AN ETA Source: Atlanta Regional Commission 31% % OF WORKERS IN THE REGION THAT WORK WITHIN AN ETA Local trails, such as this Dillard Street Trail Connector to the Silver Comet Trail, can expand access to trails of regional significance in the region. 18% % OF EXISTING TRAILS THAT ARE WITHIN AN ETA PART 2: ASSESSMENT OF REGIONAL TRAVEL PATTERNS AND EXISTING CONDITIONS 63
68 REGIONAL TRAIL ASSESSMENT EXISTING TRAILS WITH DEMAND 64

69 Demand for Trails The project team estimated propensity for walking and biking based on a composite model described in more detail in the Mobility section of this report. This analysis resulted in a regional heat map that displays relative demand and propensity for walking and biking. When existing trails are overlaid with this demand layer, three key observations stand out. One, many of the existing trails in the region, particularly those north of Interstate 20, are located in areas that have the highest levels of demand for walking and biking infrastructure. This is a good thing, because it means these trails are more likely to be used for recreation as well as transportation. Two, there are many areas with moderate to high demand for walking and bicycling that are not currently wellserved by trails. Large swaths of Dekalb County stand out most clearly, along with portions of Clayton, Douglas, and Gwinnett Counties. Three, the region s most remarkable and well-used trails the Silver Comet and Arabia Mountain Trials are not located in areas where overall demand for walking and bicycling is particularly high. This highlights the fact that scenic trails can be regional draws and destinations in their own right. They also highlight the value people place on being able to connect with nature and rural areas. Trails provide an opportunity for all ages to exercise, connect with nature, and socialize. PART 2: ASSESSMENT OF REGIONAL TRAVEL PATTERNS AND EXISTING CONDITIONS 65
70 REGIONAL TRAIL ASSESSMENT EXISTING TRAILS WITH ACTIVITY CENTERS 66


71 Trails and Activity Centers There are many benefits of trails connecting to or within activity centers. Trails that connect to activity centers from surrounding neighborhoods provide an opportunity to access jobs and other daily destinations by walking or biking. Within activity centers, trails provide workers, visitors, and residents a place to visit, socialize, travel, and be active. The existing trails and activity center map highlights some of the current connections and opportunities with trails. Some of the region s activity centers have trails within their boundaries, but many do not. In terms of connection to activity centers, many of the trails in the region connect to at least one, and sometimes more than one, activity center. As an example, the Stone Mountain Trail connects to several of the activity centers in Dekalb County. Expanding trails to and within activity centers in the region can increase the opportunity to walk and bike as part of daily life. Trails can and do connect people to jobs and other destinations, such as along the Atlanta BeltLine Eastside Trail. PART 2: ASSESSMENT OF REGIONAL TRAVEL PATTERNS AND EXISTING CONDITIONS 67
72 NW Corridor Trail REGIONAL TRAIL GAPS Existing Trails of Regional Significance (152 miles) Trails of Regional Significance Network Gaps (70 miles) Silver Comet Trail Big Creek Greenway Western Gwinnett Trail Atlanta BeltLine Path 400 I-285 Stone Mountain Trail Arabia Mountain PATH Rockdale River Trail This diagram is an analysis of gaps between existing Trails of Regional Significance. Please see the recommendations chapter for an analysis of network expansion opportunities. 68

73 The Stone Mountain Trail has long been a trail of regional significance, extending from Downtown Atlanta to Stone Mountain Park and connecting neighborhoods, natural areas, and several cities along the way. Gaps in the Regional Trail Network Despite considerable investment in selected parts of the region, existing trails do not yet form a complete and connected regional network. As mentioned earlier in this chapter, the trails of regional significance form a regional hub-and-spoke type of system BUILDING 70 MILES OF TRAILS TO CLOSE KEY GAPS IN THE NETWORK OF REGIONALLY SIGNIFICANT TRAILS WILL INCREASE THE REGIONALLY SIGNIFICANT TRAIL NETWORK BY 46 % that, when completed, will connect all four quadrants of the region to the core. When completed, this connected network of regionally significant trails will form a walking and biking highway system for active transportation. An analysis of the gaps in the trails of regional significance network determined that filling about 70 miles of key gaps would create an approximately 225 mile connected regional trail network. Additionally, closing these key gaps would represent a 46% increase in the mileage for the network. Many of these trails gaps are in various stages of planning, with the PATH Foundation leading and supporting many of the efforts to build and close these key regional gaps. Continued investment and coordination from public and private partners will help the region work towards closing these gaps and having a truly regional trail network. PART 2: ASSESSMENT OF REGIONAL TRAVEL PATTERNS AND EXISTING CONDITIONS 69
Appendix T 1: Additional Supporting Data
 Appendix T 1: Additional Supporting Data Project Delivery Delays with the implementation of the 2000 TIP became apparent early in the decade. In response to direction among policy officials, ARC began
Tulsa Metropolitan Area LONG RANGE TRANSPORTATION PLAN
 Tulsa Metropolitan Area LONG RANGE TRANSPORTATION PLAN Indian Nations Council of Governments August 2005 CONTACTING INCOG In developing the Destination 2030 Long Range Transportation Plan, INCOG s Transportation
Appendix T-2: Transportation Facilities Inventory
 Appendix T-2: Transportation Facilities Inventory Roads, Highways and Bridges The Georgia Department of Transportation (GDOT) maintains centerline mile measures for all counties in Georgia based on functional
CITY OF ALPHARETTA DOWNTOWN MASTER PLAN TRAFFIC EVALUATION
 CITY OF ALPHARETTA DOWNTOWN MASTER PLAN TRAFFIC EVALUATION June 2015 CITY OF ALPHARETTA DOWNTOWN MASTER PLAN TRAFFIC EVALUATION Introduction The Alpharetta Downtown Master Plan was developed in the fall
DEKALB COUNTY. 22. Priority Projects for DeKalb County
 DEKALB COUNTY 2 0 1 4 T R A N S P O R T A T I O N P L A N 22. Priority s for DeKalb County Following the completion of the project prioritization metrics, each project was able to be compared to other
Proposed. City of Grand Junction Complete Streets Policy. Exhibit 10
 Proposed City of Grand Junction Complete Streets Policy Exhibit 10 1 City of Grand Junction Complete Streets Policy Vision: The Complete Streets Vision is to develop a safe, efficient, and reliable travel
RESOLUTION NO ?? A RESOLUTION OF THE CITY OF NEPTUNE BEACH ADOPTING A COMPLETE STREETS POLICY
 RESOLUTION NO. 2018-?? A RESOLUTION OF THE CITY OF NEPTUNE BEACH ADOPTING A COMPLETE STREETS POLICY WHEREAS, safe, convenient, and accessible transportation for all users is a priority of the City of Neptune
I-20 East Transit Initiative. Stakeholder Advisory Committee Meeting September 9, :00-6:00 PM
 I-20 East Transit Initiative Stakeholder Advisory Committee Meeting September 9, 2010 4:00-6:00 PM Meeting Agenda Introductions Project Background Study Overview Role of the SAC Initial Study Findings
FACTS AND FIGURES: MAKING THE CASE FOR COMPLETE STREETS IN LEE COUNTY
 FACTS AND FIGURES: MAKING THE CASE FOR COMPLETE STREETS IN LEE COUNTY Safety: Close to 5,000 pedestrians and bicyclists die each year on U.S. roads, and more than 70,000 are injured. [Mean Streets, Surface
2010 Pedestrian and Bicyclist Special Districts Study Update
 2010 Pedestrian and Bicyclist Special Districts Study Update Pedestrian and Bicyclist Special Districts Program Overview H-GAC s Special Districts Program aims to provide strategic investments in pedestrian
Chapter 14 PARLIER RELATIONSHIP TO CITY PLANS AND POLICIES. Recommendations to Improve Pedestrian Safety in the City of Parlier (2014)
") Chapter 14 PARLIER This chapter describes the current status and future plans for biking and walking in the City of Parlier. RELATIONSHIP TO CITY PLANS AND POLICIES The Parlier General Plan is the primary
Chapter 14 PARLIER This chapter describes the current status and future plans for biking and walking in the City of Parlier. RELATIONSHIP TO CITY PLANS AND POLICIES The Parlier General Plan is the primary
CITY OF COCOA BEACH 2025 COMPREHENSIVE PLAN. Section VIII Mobility Element Goals, Objectives, and Policies
 CITY OF COCOA BEACH 2025 COMPREHENSIVE PLAN Section VIII Mobility Element Goals, Objectives, and Policies Adopted August 6, 2015 by Ordinance No. 1591 VIII MOBILITY ELEMENT Table of Contents Page Number
About the Active Transportation Alliance
 About the Active Transportation Alliance Chicagoland s voice for better biking, walking and transit Founded 1985 7,000 members, ~33 full time staff Serve Chicago metro region 1 More Cars, More Driving
2015 Florida Main Street Annual Conference. Complete Streets Equal Stronger Main Streets
 WHAT ARE COMPLETE STREETS? CASE STUDIES COMPLETING YOUR MAIN STREET 2015 Florida Main Street Annual Conference St. Petersburg, Florida August 19, 2015 WHAT ARE COMPLETE STREETS? CASE STUDIES COMPLETING
Perryville TOD and Greenway Plan
 Perryville TOD and Greenway Plan Greenway Glossary Pathway: A bicycle and pedestrian path separated from motorized vehicular traffic by an open space, barrier or curb. Multi-use paths may be within the
Chapter 2. Bellingham Bicycle Master Plan Chapter 2: Policies and Actions
 Chapter 2 Bellingham Bicycle Master Plan Chapter 2: Policies and Actions Chapter 2: Policies and Actions The Bicycle Master Plan provides a road map for making bicycling in Bellingham a viable transportation
I-20 East Transit Initiative
 I-20 East Transit Initiative Public Meetings Tuesday, October 26 DeKalb Medical Center Hillandale Community Room 2801 DeKalb Medical Parkway Lithonia, GA 30058 6:00pm 8:00pm Wednesday, October 27 East
Transportation Trends, Conditions and Issues. Regional Transportation Plan 2030
 Transportation Trends, Conditions and Issues Regional Transportation Plan 2030 23 Regional Transportation Plan 2030 24 Travel Characteristics Why Do People Travel? Over one-half of trips taken in Dane
AMATS Complete Streets Policy
 AMATS Complete Streets Policy Table of Contents: Section 1. Definition of Complete Streets Section 2. Principles of Complete Streets Section 3. Complete Streets Policy Section 4. Consistency Section 5.
ADOT Statewide Bicycle and Pedestrian Program Summary of Phase IV Activities APPENDIX B PEDESTRIAN DEMAND INDEX
 ADOT Statewide Bicycle and Pedestrian Program Summary of Activities APPENDIX B PEDESTRIAN DEMAND INDEX May 24, 2009 Pedestrian Demand Index for State Highway Facilities Revised: May 29, 2007 Introduction
Plant City Walk-Bike Plan
 Plant City Walk-Bike Plan Plant City Commute Mode Share 2.2% 1.4% 2.9% Drove alone 10.2% Carpooled Public transportation (0.1%) Walked Used a Bike (0.4%) 82.9% Taxicab, motorcycle, or other means Worked
 Time of Change We Are Growing We Are An Attractive Place To Live We Are Age Diverse + Living Longer 50000 40000 30000 20000 10000 0 2010 Census Job Density Housing Sheds Transit Sheds The Project FUNDING
City of Novi Non-Motorized Master Plan 2011 Executive Summary
 City of Novi Non-Motorized Master Plan 2011 Executive Summary Prepared by: February 28, 2011 Why Plan? Encouraging healthy, active lifestyles through pathway and sidewalk connectivity has been a focus
CONNECTING PEOPLE TO PLACES
 CONNECTING PEOPLE TO PLACES 82 EAST BENCH MASTER PLAN 07 Introduction The East Bench transportation system is a collection of slow moving, treelined residential streets and major arteries that are the
PEDESTRIAN ACTION PLAN
 ATTACHMENT 2 CITY OF SANTA MONICA PEDESTRIAN ACTION PLAN CITY OF SANTA MONICA PEDESTRIAN ACTION PLAN This page intentionally left blank EXECUTIVE SUMMARY CHAPTER 1 EXECUTIVE SUMMARY Setting the Stage
Update on Regional Bicycle, Pedestrian, & Trail Planning. Presented to TCC November 21, 2014
 Update on Regional Bicycle, Pedestrian, & Trail Planning Presented to TCC November 21, 2014 Survey Measure Assess Focus Area Performance- Driven Process Policy Policy Implement Plan Criteria Criteria Criteria
CITY OF BLOOMINGTON COMPLETE STREETS POLICY
 CITY OF BLOOMINGTON COMPLETE STREETS POLICY POLICY OBJECTIVE: The City of Bloomington will enhance safety, mobility, accessibility and convenience for transportation network users of all ages and abilities,
5. Pedestrian System. Accomplishments Over the Past Five Years
 5. Pedestrian System Accomplishments Over the Past Five Years The Alamo Area Metropolitan Planning Organization (MPO) and its partner agencies recognize the importance of improving pedestrian mobility.
Active Transportation Infrastructure Investment A Business Case
 Active Transportation Infrastructure Investment A Business Case In 2016, the Real Estate Foundation awarded the Capital Regional District a $50,000 grant for Shifting Gears: Land Use Change through Active
ACTIVE TRANSPORTATION
 ACTIVE TRANSPORTATION Mobility 2040 Supported Goals Improve the availability of transportation options for people and goods. Support travel efficiency measures and system enhancements targeted at congestion
GRAHAM PEDESTRIAN TRANSPORTATION PLAN
 GRAHAM PEDESTRIAN TRANSPORTATION PLAN Chapter 1 I 1.1 Scope and Purpose n March of 2005, the City of Graham contracted with Greenways Incorporated (GWI) to create a Pedestrian Transportation Plan. The
WALKNBIKE DRAFT PLAN NASHVILLE, TENNESSEE EXECUTIVE SUMMARY NASHVILLE, TENNESSEE
 NASHVILLE, TENNESSEE EXECUTIVE SUMMARY Executive Summary A world-class multi-modal transportation system is essential to a vibrant city and better quality of life. -Mayor Barry The WalknBike plan aims
Berkeley Strategic Transportation Plan A-76
 Berkeley Strategic Transportation Plan A-76 Appendices 1. A Team Effort 2. Where We ve Been A-11 Berkeley Strategic Transportation Plan Alameda County Transportation Plan Alameda County will be served
Goal 3: Foster an environment of partnerships and collaboration to connect our communities and regions to one another.
 Non-Motorized Transportation Plan (NMTP) Draft Vision, Goal and,, Tri-County Regional Planning Commission (TCRPC) Purpose The purpose of the Tri-County Regional Planning Commission (TCRPC) Non-Motorized
Bike Share Social Equity and Inclusion Target Neighborhoods
 Bike Share Social Equity and Inclusion Target Neighborhoods Target Neighborhoods West End/Visitation Park/Academy/Hamilton Heights Wellsgoodfellow/Kingsway West The Ville/Greater Ville Kingsway East/Fountain
Executive Summary Route 30 Corridor Master Plan
 Route Corridor Master Plan Project Overview The Route Corridor Master Plan is a coordinated multimodal transportation and land use plan for the entire stretch of Route through East Whiteland Township,
Thank you for this opportunity to discuss with you how we can work together to make our streets more complete.
 Thank you for this opportunity to discuss with you how we can work together to make our streets more complete. 1 2 3 Thank you for this opportunity to discuss with you how we can work together to make
Hennepin County Bicycle and Pedestrian Planning
 Hennepin County Bicycle and Pedestrian Planning 1 Value of bicycle and sidewalk systems Safety Livability Mobility Health Personal Finances Economic Sustainability Clean Air Recreation Parking and congestion
Appendix C. Corridor Spacing Research
 Appendix C. Corridor Spacing Research Task 3 of the Twin Cities Bicycle Study called for the development of bicycle corridor spacing guidelines. This section summarizes research of the spacing of planned
2. Context. Existing framework. The context. The challenge. Transport Strategy
 Transport Strategy Providing quality connections Contents 1. Introduction 2. Context 3. Long-term direction 4. Three-year priorities 5. Strategy tree Wellington City Council July 2006 1. Introduction Wellington
Exceeding expectations: The growth of walking in Vancouver and creating a more walkable city in the future through EcoDensity
 Exceeding expectations: The growth of walking in Vancouver and creating a more walkable city in the future through EcoDensity Melina Scholefield, P. Eng. Manager, Sustainability Group, City of Vancouver
El Paso County 2040 Major Transportation Corridors Plan
 El Paso County 2040 Major Transportation Corridors Plan Connect-our-County Online Transportation User Survey Preliminary Results June 24, 2010 Years of Residence 2. How many years have you LIVED HERE?
Chapter 7. Transportation. Transportation Road Network Plan Transit Cyclists Pedestrians Multi-Use and Equestrian Trails
 Chapter 7 Transportation Transportation Road Network Plan Transit Cyclists Pedestrians Multi-Use and Equestrian Trails 7.1 TRANSPORTATION BACKGROUND The District of Maple Ridge faces a number of unique
WILMAPCO Public Opinion Survey Summary of Results
 Wilmington Area Planning Council WILMAPCO Public Opinion Survey Summary of Results Prepared by: 2955 Valmont Road, Suite 300 Boulder, Colorado 80301 t: 303-444-7863 f: 303-444-1145 www.n-r-c.com Table
Incorporating Health in Regional Transportation Planning
 Mayor Karl Dean, Chairman Incorporating Health in Regional Transportation Planning Leslie A. Meehan, AICP Center TRT Intervention Webinar January 29, 2013 Objectives for Today Background About the Nashville
Bicycle and Pedestrian Chapter TPP Update Overview. TAB September 20, 2017
 Bicycle and Pedestrian Chapter TPP Update Overview TAB September 20, 2017 Bicycling & Walking in the Twin Cities Where are we now? The Bike-Pedestrian system Current trends New developments Where are we
Active Travel and Exposure to Air Pollution: Implications for Transportation and Land Use Planning
 Active Travel and Exposure to Air Pollution: Implications for Transportation and Land Use Planning Steve Hankey School of Public and International Affairs, Virginia Tech, 140 Otey Street, Blacksburg, VA
THE I-79 CORRIDOR. I-79 provides motorists with connections to the following major highways: I-80, PA 358, PA 965 and PA 208.
 The I-79 Corridor Pittsburgh to Erie Regional Thruway I-79 was constructed through Mercer County in the early 1960s. The portion north of PA 965 opened in 1961 and the segment south of PA 965 the following
EXECUTIVE SUMMARY. Vision
 Vision Walking and bicycling in Salt Lake City will be safe, convenient, comfortable, and viable transportation options that connect people to places, foster recreational and economic development opportunities,
4 Ridership Growth Study
 Clause 4 in Report No. 15 of Committee of the Whole was adopted, without amendment, by the Council of The Regional Municipality of York at its meeting held on November 16, 2017. 4 Ridership Growth Study
Regional Alternatives Analysis. Downtown Corridor Tier 2 Evaluation
 Regional Alternatives Analysis Downtown Corridor Tier 2 Evaluation September 19, 2011 EVALUATION PROCESS REVIEW OF EVALUATION PROCESS Tier 1: Screen Seven Alignment Options into a Short List Tier 2: Evaluate
A Matter of Fairness: ROCOG s Environmental Justice Protocol. What is Mobility Limitation?
 No Person Left Behind What is Mobility Limitation? What is the Access Limitation? Environmental Justice population should be provided adequate mobility & access to meet their needs; Identify acceptable
Rail Station Fact Sheet CentrePort/DFW Airport Station
 Rail Station Fact Sheet CentrePort/DFW Airport Station Station Overview CentrePort/DFW Airport Station is located by Statler Boulevard at Breezewood Drive in Fort Worth. Free shuttles connect the station
A COMPREHENSIVE APPROACH TO TRANSPORTATION AT SUNTRUST PARK AND THE BATTERY ATLANTA
 A COMPREHENSIVE APPROACH TO TRANSPORTATION AT SUNTRUST PARK AND THE BATTERY ATLANTA Overview The Atlanta Braves strategically selected the location for SunTrust Park to provide an environment rich in transportation
Typical Rush Hour Commute. PennyforTransportation.com
 Typical Rush Hour Commute In the News Overview of the Plan Collaborative plan with projects in every community Prioritizing connectivity and congestion relief Dedicated transportation-specific funding;
METRO Light Rail: Changing Transit Markets in the Phoenix Metropolitan Area
 METRO Light Rail: Changing Transit Markets in the Phoenix Metropolitan Area Abhishek Dayal, AICP Planner III, METRO Light Rail Phoenix, AZ BACKGROUND Transit in the Phoenix Region Transit services in the
SANTA CLARA COUNTYWIDE BICYCLE PLAN August 2008
 SANTA CLARA COUNTYWIDE BICYCLE PLAN August 2008 To assist VTA and Member Agencies in the planning, development and programming of bicycle improvements in Santa Clara County. Vision Statement To establish,
Living Streets Policy
 Living Streets Policy Introduction Living streets balance the needs of motorists, bicyclists, pedestrians and transit riders in ways that promote safety and convenience, enhance community identity, create
Capital Bikeshare 2011 Member Survey Executive Summary
 Capital Bikeshare 2011 Member Survey Executive Summary Prepared by: LDA Consulting Washington, DC 20015 (202) 548-0205 June 14, 2012 EXECUTIVE SUMMARY Overview This report presents the results of the 2012
Incorporating Health in Regional Transportation Planning
 Mayor Karl Dean, Chairman Incorporating Health in Regional Transportation Planning Leslie A. Meehan, AICP Center TRT Intervention Webinar January 29, 2013 Objectives for Today Background About the Nashville
Non-Motorized Transportation 7-1
 Non-Motorized Transportation 7-1 Transportation facilities no longer mean just accommodating a vehicle powered by a combustion engine. Pedestrian and non-motorized facilities are important modes of travel
The Route 29 Corridor Study was initiated at the request of Virginia s Commonwealth
 CHAPTER 2: Study Background and approach The Route 29 Corridor Study was initiated at the request of Virginia s Commonwealth Transportation Board in response to requests from members of the General Assembly
2017 Northwest Arkansas Trail Usage Monitoring Report
 2017 Northwest Arkansas Trail Usage Monitoring Report Summary Findings: The study showed that average daily weekday bicycle volumes per study site increased by about 32% between 2015 and 2017, from 142
TOWN OF PORTLAND, CONNECTICUT COMPLETE STREETS POLICY
 TOWN OF PORTLAND, CONNECTICUT COMPLETE STREETS POLICY I. VISION, GOALS & PRINCIPLES VISION To improve the streets of Portland making them safer and more accessible for all users including pedestrians,
Cabrillo College Transportation Study
 Cabrillo College Transportation Study Planning and Research Office Terrence Willett, Research Analyst, Principle Author Jing Luan, Director of Planning and Research Judy Cassada, Research Specialist Shirley
Rochester Area Bike Sharing Program Study
 roc bike share Rochester Area Bike Sharing Program Study Executive Summary ~ January 2015 JANUARY 2015 8484 Georgia Avenue, Suite 800 Silver Spring, MD 20910 3495 Winton Pl., Bldg E, Suite 110 Rochester,
City of Decatur, GA. Speed Limits Study and Proposal
 City of Decatur, GA Speed Limits Study and Proposal Table of Contents SUMMARY 2 HEALTH IMPACTS 5 EXAMPLES 6 ASSESSMENT 7 Current Speed Limits 7 Safe Routes To School 9 Speed Limit Enforcement 11 Accidents
Corpus Christi Metropolitan Transportation Plan Fiscal Year Introduction:
 Introduction: The Safe, Accountable, Flexible, Efficient Transportation Equity Act: A Legacy for Users (SAFETEA-LU) has continued the efforts started through the Intermodal Surface Transportation Efficiency
Transportation Master Plan Advisory Task Force
 Transportation Master Plan Advisory Task Force Network Alternatives & Phasing Strategy February 2016 BACKGROUND Table of Contents BACKGROUND Purpose & Introduction 2 Linking the TMP to Key Council Approved
2014 peterborough city and county. active. transportation. & health. indicators primer
 2014 city and county active transportation & health indicators primer executive summary Walking, cycling and transit are good for our personal health, our local economies, and the environment. Understanding
TR NEWS. Public Health and Transportation. Innovation, Intervention, and Improvements NUMBER 299 SEPTEMBER OCTOBER 2015
 TR NEWS NUMBER 299 SEPTEMBER OCTOBER 2015 Public Health and Transportation Innovation, Intervention, and Improvements Public Health and Transportation Measuring the Health Benefits of Walking and Bicycling
WELCOME EXERCISE. Share your thoughts on the study area by: Placing a GREEN DOT on areas you like or where something good is happening and;
 WELCOME EXERCISE Share your thoughts on the study area by: Placing a GREEN DOT on areas you like or where something good is happening and; Placing a RED DOT on areas you don t like or where area needs
BUILDING THE CASE FOR TRAVEL OPTIONS IN WASHING TON COUNTY. Image: Steve Morgan. Image: Steve Morgan
 BUILDING THE CASE FOR TRAVEL OPTIONS IN WASHING TON COUNTY Image: Steve Morgan Image: Steve Morgan Image: TriMet Image: TriMet WHAT ARE TRAVEL OPTIONS PROGRAMS? Travel options programs encourage residents,
Highway 217 Corridor Study. Phase I Overview Report
 Highway 217 Corridor Study Phase I Overview Report November 3, 24 BACKGROUND AND OVERVIEW Study purpose The Highway 217 Corridor Study is developing multi-modal transportation solutions for traffic problems
Introduction Overview This document summarizes the Gateway Gold Line Bus Rapid Transit (Gold Line BRT) health impact assessment (HIA) process and reco
 health impact assessment (HIA) process and reco") Gateway Gold Line Bus Rapid Transit: A Closer Look at Health and Land Use Project Summary May 2016 Introduction Overview This document summarizes the Gateway Gold Line Bus Rapid Transit (Gold Line BRT)
Gateway Gold Line Bus Rapid Transit: A Closer Look at Health and Land Use Project Summary May 2016 Introduction Overview This document summarizes the Gateway Gold Line Bus Rapid Transit (Gold Line BRT)
Exhibit 1 PLANNING COMMISSION AGENDA ITEM
 Exhibit 1 PLANNING COMMISSION AGENDA ITEM Project Name: Grand Junction Circulation Plan Grand Junction Complete Streets Policy Applicant: City of Grand Junction Representative: David Thornton Address:
Title VI Fare Change Equity Analysis
 Title VI Fare Change Equity Analysis Evaluation Report Submitted to Dallas Area Rapid Transit Submitted by TranSystems June 2012 Title VI Fare Change Equity Analysis Introduction DART has proposed a schedule
WELCOME. City of Greater Sudbury. Transportation Demand Management Plan
 WELCOME City of Greater Sudbury Transportation Demand Management Plan Public Consultation Session St. Andrew s Place, Activity Hall 111 Larch Street Wednesday September 13, 2017 6:00 to 8:00 pm Welcome
Bicycle and Pedestrian Planning in a Historically Car-Centric Culture: A Focus on Connectivity, Safety, & Accessibility
 Bicycle and Pedestrian Planning in a Historically Car-Centric Culture: A Focus on Connectivity, Safety, & Accessibility Kate Horton and Zylavian Watley Transportation Planners Memphis MPO Date: October
Agenda. US-1 Corridor Study and HIA Update. Pathway Diagram / Primary Indicators. Research Questions. Linking Multimodal Improvements to Indicators
 Icebreaker Agenda US-1 Corridor Study and HIA Update Pathway Diagram / Primary Indicators Research Questions Linking Multimodal Improvements to Indicators Vulnerable Populations US-1 Corridor Study Vision
South King County High-Capacity Transit Corridor Study
 HIGH-CAPACITY TRANSIT CORRIDOR STUDY South King County Corridor South King County High-Capacity Transit Corridor Study Corridor Report August 2014 South King County High Capacity Transit Corridor Report
Washington Metropolitan Area Transit Authority Board Action/Information Summary
 Washington Metropolitan Area Transit Authority Board Action/Information Summary Action Information MEAD Number: 200242 Resolution: Yes No TITLE: MWCOG Strategic Investment Plan & TPB Priorities PRESENTATION
GIS Based Data Collection / Network Planning On a City Scale. Healthy Communities Active Transportation Workshop, Cleveland, Ohio May 10, 2011
 The Purpose of GIS Based Network Planning GIS Based Data Collection / Network Planning Healthy Communities Active Transportation Conference Tuesday, May 10, 2011 10:00 AM Norman Cox, LLA, ASLA. Ann Arbor,
City of Davenport CitiBus Public Transportation Study. April 2015
 City of Davenport CitiBus Public Transportation Study April 2015 Overview Project Background Key Findings CitiBus Service Allocation Policy Discussion 2 Project Background 3 About CitiBus Operates 17 routes
DON MILLS-EGLINTON Mobility Hub Profile
 Mobility Hub Profile Dundas Don Mills-Eglinton West-Bloor Anchor Hub Gateway Hub N MOBILITY HUBS: Places of connectivity between regional and rapid transit services, where different modes of transportation
DANGEROUS BY DESIGN MARYLAND. Solving the Epidemic of Preventable Pedestrian Deaths (And Making Great Neighborhoods)
") DANGEROUS BY DESIGN 2011 MARYLAND Solving the Epidemic of Preventable Pedestrian Deaths (And Making Great Neighborhoods) DANGEROUS BY DESIGN 2011 Maryland T4AMERICA.ORG Between 2000 and 2009, 1,057 people
DANGEROUS BY DESIGN 2011 MARYLAND Solving the Epidemic of Preventable Pedestrian Deaths (And Making Great Neighborhoods) DANGEROUS BY DESIGN 2011 Maryland T4AMERICA.ORG Between 2000 and 2009, 1,057 people
Access BART: TOD and Improved Connections. October 29, 2008
 Access BART: TOD and Improved Connections October 29, 2008 1 Access BART Study Goals Evaluate at the system-level land use and access scenarios to optimize ridership Identify station clusters that provide
Complete Streets Workshop Follow-up. April 27, 2011 Rockledge City Hall
 Complete Streets Workshop Follow-up April 27, 2011 Rockledge City Hall Agenda Complete Streets draft briefing presentation and sample policy language Share your Complete Streets projects and post workshop
Bicycle Master Plan Goals, Strategies, and Policies
 Bicycle Master Plan Goals, Strategies, and Policies Mobilizing 5 This chapter outlines the overarching goals, action statements, and action items Long Beach will take in order to achieve its vision of
City of Birmingham Draft Multi-modal Transportation Plan
 City of Birmingham Draft Multi-modal Transportation Plan City Commission Public Hearing Monday, November 25, 2013 7:30 pm Norman Cox, PLA, ASLA The Greenway Collaborative, Inc. Ann Arbor, Michigan The
Welcome! Public Open House on UBC s Transportation Plan
 1 Welcome! Public Open House on UBC s Transportation Plan Public open house hours: to When it comes to on-campus transportation, what do you think is working well and what are some opportunities for improvement?
City of Atlanta-MARTA Sales Tax Referendum Draft Project List. Atlanta City Council Work Session May 19, 2016
 1 City of Atlanta-MARTA Sales Tax Referendum Draft Project List Atlanta City Council Work Session May 19, 2016 2 SB 369 - MARTA Sales tax for up to 0.50% is allowed in the City of Atlanta for MARTA Purpose
PLAN 2040 Sustainability Framework, Regan Hammond (ARC)
") ARC BICYCLE & PEDESTRIAN TASK FORCE MEETING SUMMARY 04-21-2010 Item 1: PLAN 2040 Sustainability Framework, Regan Hammond (ARC) Regan Hammond provided an update on PLAN 2040 progress. Hammond explained
ARC BICYCLE & PEDESTRIAN TASK FORCE MEETING SUMMARY 04-21-2010 Item 1: PLAN 2040 Sustainability Framework, Regan Hammond (ARC) Regan Hammond provided an update on PLAN 2040 progress. Hammond explained
ATTACHMENT 4 - TDM Checklist. TDM Checklist Overview
 ATTACHMENT 4 - TDM Checklist TDM Checklist Overview The proposed checklist rates developments on the degree to which they are TDM and transit supportive. Points are assigned based on the level of transit
DRAFT MOVING FORWARD RHODE ISLAND BICYCLE MOBILITY PLAN 2018 PREPARED FOR PREPARED BY IN ASSOCIATION WITH
 RHODE ISLAND MOVING FORWARD BICYCLE MOBILITY PLAN 2018 PREPARED FOR PREPARED BY IN ASSOCIATION WITH T AF CHAPTER 1 D R INTRODUCTION CHAPTER 3 ARTICULATES VISION Bicycling is safe, fun and practical in
4. Action Plan & Projects
 4. Action Plan & Projects 45 46 ACTION PLAN AND PROJECTS The Action Plan organizes the list of transportation projects described in the Mobility Framework Plan section into short-term (0-5 years) and long-term
Prioritizing Transportation Policy and Funding for Active Transportation, Safety, Equity and Health
 Mayor Karl Dean, Chairman Prioritizing Transportation Policy and Funding for Active Transportation, Safety, Equity and Health Leslie A. Meehan, AICP Planning and Implementing the Active Community Webinar
TRANSIT & NON-MOTORIZED PLAN DRAFT FINAL REPORT Butte County Association of Governments
 1 INTRODUCTION Maintaining a high quality of life is the essence of this plan for transit and non-motorized transportation in Butte County. Curbing greenhouse gas emissions (GHG) by reducing congestion,
The best indicator of an individual s and expanding access to parks and open space.
 Health & Wellness Create a Safe and Healthy Built Environment Artist s rendering, 2014 Health is important to Loveland residents, and stakeholders see the many strong connections between quality of life,
1999 On-Board Sacramento Regional Transit District Survey
 SACOG-00-009 1999 On-Board Sacramento Regional Transit District Survey June 2000 Sacramento Area Council of Governments 1999 On-Board Sacramento Regional Transit District Survey June 2000 Table of Contents