Raymond HV Gallucci, PhD, PE;
|
|
|
- Martin Quinn
- 5 years ago
- Views:
Transcription
1 PROOF OF PRINCIPLE FOR SITUATIONAL UNDERLYING VALUE (SUV) A Statistic to Measure Clutch Performance by Individuals in the Team Sports of Major League Baseball, Professional Football (NFL) and NCAA Men s College Basketball Raymond HV Gallucci, PhD, PE; gallucci@localnet.com; r_gallucci@verizon.net NOTE: Due to size limitations, this has been published in three separate parts, with the abstract and references to all three parts included with each. This is Part 1, directed exclusively to Major League Baseball. In Situational Underlying Value for Baseball, Football and Basketball A Statistic (SUV) to Measure Individual Performance in Team Sports, an all-encompassing, overall statistic to measure clutch performance by individual players in the team sports of major league baseball, professional football (NFL), and NCAA men s college basketball was developed, called Situational Underlying Value (SUV). This work supplements and extends the development and initial demonstrations of the use of the SUV statistic for these three team sports by tracking the performance of three specific teams in these three sports over a significant portion of their most recent seasons: (1) for major league baseball, 54 of the 162 games played by the Seattle Mariners in 2017; (2) for professional football, five of the 16 games played by the Seattle Seahawks in 2017; and (3) for NCAA Men s College Basketball, the five games played by the Loyola of Chicago Ramblers in the 2018 NCAA Division I Men s Basketball Tournament. The SUV statistics for the players who participated in these games are tracked and accumulated for comparison among themselves and, for those who participated in a significant portion of these games, further compared against the traditional statistics for each team over the entire season (or, in the case of the Loyola of Chicago Ramblers, the complete five games of the Basketball Tournament). The goal is to examine the efficacy of this one overarching statistic, the SUV, in representing player performance in the clutch vs. more subjective interpretation of the myriad of different traditional statistics currently used. Anomalies between the SUV and traditional statistics results are examined and explained, to the extent practicable given the scope of the SUV analysis (partial seasons). Whether or not this effort proves successful is left to the reader s conclusion based on the results and comparisons performed.
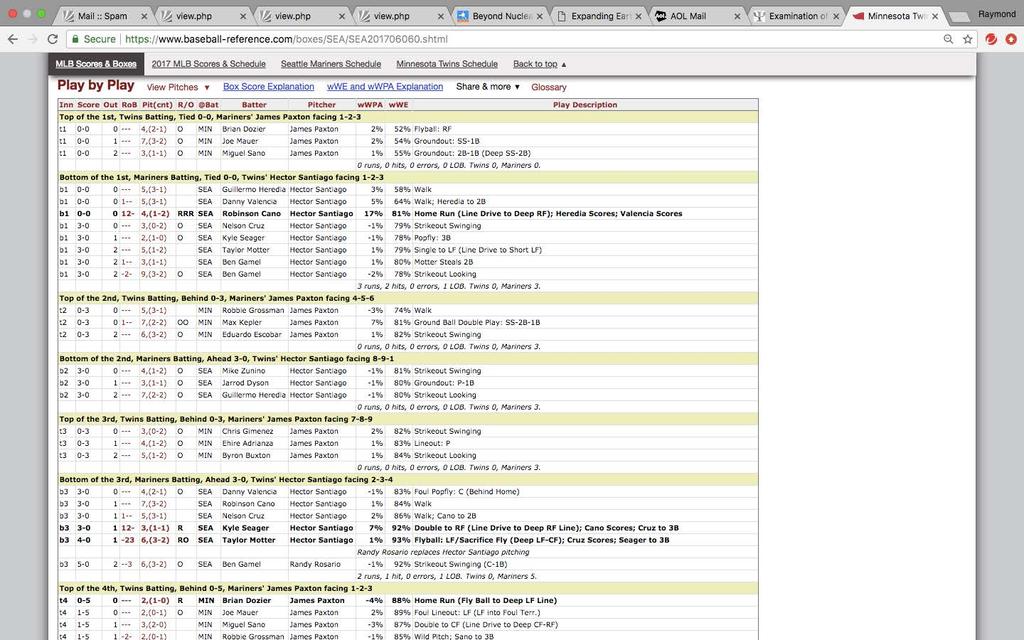
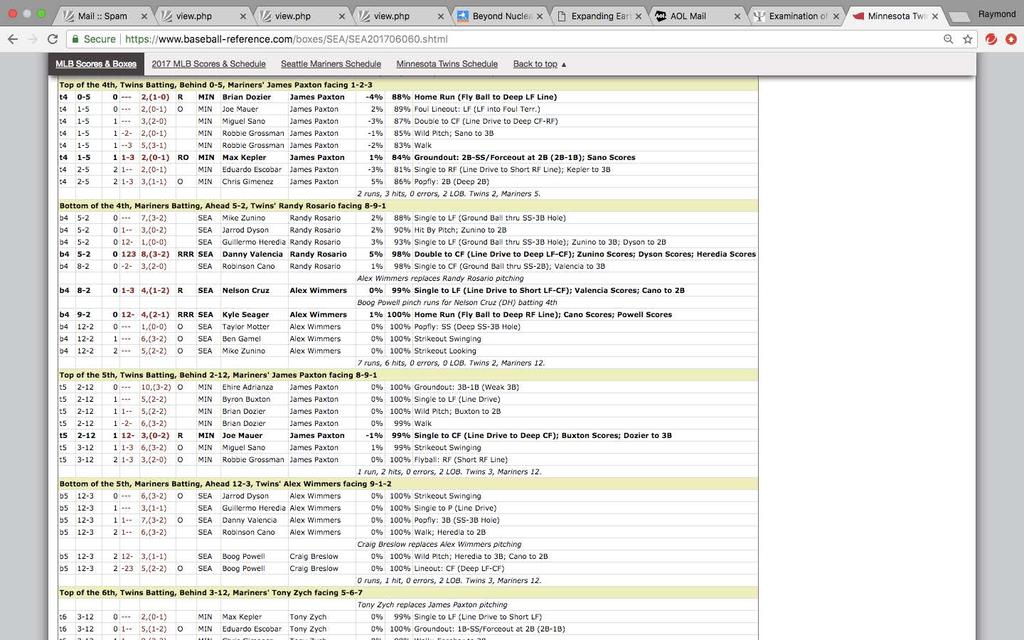
2 SITUATIONAL UNDERLYING VALUE (SUV) STATISTIC FOR MAJOR LEAGUE BASEBALL PROOF OF PRINCIPLE Raymond HV Gallucci, PhD, PE; In Situational Underlying Value for Baseball, Football and Basketball A Statistic (SUV) to Measure Individual Performance in Team Sports, an all-encompassing, overall statistic to measure clutch performance by individual players in the team sports of major league baseball, professional football, and NCAA men s college basketball was developed, called Situational Underlying Value (SUV). [1] Based on the concept of run expectancy, it assigns an SUV to each base as a function of the number of outs, including a negative value for making an out. It can be used for both hitters and pitchers, with the higher the SUV (i.e., the more positive or less negative) reflecting better productivity for hitters and the lower the SUV (i.e., the more negative or less positive) reflecting likewise for pitchers. Its derivation is explained in Reference 1; reproduced here is the SUV table for major league baseball (variations for the American and National League are also discussed there to reflect the use of the designated hitter by the former, but will not be addressed here). For example, a double is worth 0.63, 0.44, or 0.23, respectively, with none, one or two outs when it occurs. Making the first, second or third out deducts 0.23, 0.16, or 0.10, respectively. Advancing base runners without additional outs always improves the SUV, attributable to the hitter if a direct result of his action (e.g., another hit) or the runner (e.g., stolen base or wild pitch). Unearned plays, such as errors, passed balls, or catcher s interference, are tracked separately and the corresponding SUVs are not assigned to the individuals. Pinch runners also are not tracked unless they themselves are responsible for advancing (e.g., stolen base or wild pitch) or making an out (e.g., being picked off or thrown out trying to take an extra base). base outs Reference 1 provides two example games to show how the SUVs accrue for each team s hitters and pitchers. The goal of this work, the Proof of Principle, is to track the performance of an individual team over a substantial portion of an entire season. One-third of the 2017 season, i.e., 54 games, have been selected for the Seattle Mariners, starting with Game 002 and tracking every third game up through Game 161. The SUVs are based on the play-by-play descriptions provided in Baseball Reference, [2] While the SUV analyses for all 54 games are provided below, with a roll-up of cumulative SUVs every six games, the actual play-by-plays are only included for three particular games, particularly illustrative. For the rest, the reader should consult Reference 2. Below is an example of one such analysis, as follows: Each hitter from Segura through Valencia had the number of opportunities totaled in the Ops column, i.e., appearances at the plate as a hitter which resulted in an outcome for that hitter (or the rare case where a pinch runner made a direct change himself to the SUV). His total SUV for the game is shown in the SUV column, with his average SUV per Opportunity for the game calculated in the Avg column. For example, Cano had five opportunities with a total SUV of 2.10, for an Average of 2.10/5 = 0.420, indicating a
3 productive day where each appearance was worth on average. The next three columns are labeled similarly, but include a + symbol to indicate that these are cumulative for the season through this game. The row SUV shows the total per inning (always the number of runs minus 0.49, including the unearned SUV), followed by the totals for Ops and SUV for the game (42 and 1.42 in this example), the Average per Op for the team for the game (1.42/34 = for this example), and the cumulatives for these through this game (1909, 8.55, and 8.55/1909 = 0.004, respectively). Anything highlighted in yellow indicates an SUV attributable to an error, passed ball (PB), or catcher s interference (CI), which is tracked for the team and highlighted for that player who receives no credit toward his SUV due to the error and for whom the SUV is calculated as if the error had not occurred, i.e., he had made the out. For the Mariners in this game, there was an unearned SUV of 0.17 in the seventh inning, involving both Gamel and Heredia. The game and cumulative totals for these (0.17 and in this example) are also tracked. Finally, the total SUVs for the game (1.59, based on the Mariners scoring six runs over nine innings, i.e., 6 [9][0.49] = 1.59, equal to = 1.59) and cumulatively ( = 24.97) are highlighted in bold red. (In the rare case where a hitter batted twice in one inning, this is shown in a bolded box and included both Ops [e.g., see Game 059, June 6, Seattle-12; Zunino batted twice in the third inning, leading off with a single but also making last out for a total SUV over two Ops of = 0.29].) The SUVs are similarly tracked for the pitchers, although not by individual hitter faced unless the pitcher worked only part of an inning (Hernandez and Albers in the fifth, Albers and Lawrence in the sixth). Each pitcher s Innings Pitched ( IP column) are tracked for the game along with his SUV ( SUV column) and Average per inning pitched ( Avg column). For example, Hernandez pitched 3.33 innings, with a total SUV of 1.37 for an Average per IP of 1.37/3.33 = 0.411, not a very productive outing. The pitcher s cumulative totals for these are tracked in the last three columns with the + symbols. The SUV row shows the totals per inning, again amounting to the number of runs yielded, including the unearned SUV tracked below in yellow, minus The totals for IP and SUV follow, with the team s Average per IP next, and finally the cumulatives for these three. As can be seen, the fourth inning was particularly bad for the Mariners, yielding seven runs with an SUV of = 6.51, of which 1.27 was attributed to the unearned variety (while Hernandez was pitching, and not counted against him). The opponent scored
. Cumulatives for these follow (2.62 and 22.")
![43 [ unearned] for a total of 25.05, shown in bold red).](/docs-images/89/98128451/images/4-1.jpg "This is the pattern followed for each game (except the first, for which there is no cumulative shown).")
4 a total of eight runs, for a total SUV = 8 (9)(0.49) = 3.59, shown in bold red, of which 1.27 was unearned (equal to = 3.59). Cumulatives for these follow (2.62 and [ unearned] for a total of 25.05, shown in bold red). This is the pattern followed for each game (except the first, for which there is no cumulative shown). Below is a list of the 54 games analyzed, followed by the analyses for each of the 54 games (plus roll-ups for every six games).


5 GAME 002, APRIL 4, HOUSTON-2 GAME 005, APRIL 7, L.A. ANGELS-5 GAME 008, APRIL 10, SEATTLE-6

6 GAME 011, APRIL 14, SEATTLE-2 GAME 014, APRIL 17, SEATTLE-6 GAME 017, APRIL 20, OAKLAND-9


7 CUMULATIVES THROUGH 6 GAMES GAME 020, APRIL 23, OAKLAND-1 GAME 023, APRIL 26, DETROIT-1

8 GAME 026, APRIL 30, CLEVELAND-12 GAME 029, MAY 4, L.A. SEATTLE-11 GAME 032, MAY 7, SEATTLE-4

9 GAME 035, MAY 11, TORONTO-7 CUMULATIVES THROUGH 12 GAMES GAME 038, MAY 14, TORONTO-3 (WALK-OFF HOME RUN, 2 OUTS)


10 GAME 041, MAY 17, SEATTLE-4 GAME 044, MAY 20, CHICAGO WHITE SEATTLE-1 GAME 047, MAY 24, WASHINGTON-5


11 GAME 050, MAY 27, BOSTON-6 GAME 053, MAY 30, COLORADO-4 CUMULATIVES THROUGH 18 GAMES

12 GAME 056, JUNE 2, TAMPA SEATTLE-12 GAME 059, JUNE 6, SEATTLE-12 GAME 062, JUNE 9, SEATTLE-4


13 GAME 065, JUNE 12, MINNESOTA-3 GAME 068, JUNE 15, MINNESOTA-6 GAME 071, JUNE 18, TEXAS-3


14 CUMULATIVES THROUGH 24 GAMES GAME 074, JUNE 21, SEATTLE-7 GAME 077, JUNE 24, SEATTLE-2


15 GAME 080, JUNE 28, SEATTLE-4 GAME 083, JULY 2, L.A. ANGELS-3 GAME 086, JULY 5, KANSAS SEATTLE-6 (10 INNINGS)

16 GAME 089, JULY 8, SEATTLE-3 CUMULATIVES THROUGH 30 GAMES GAME 092, JULY 15, CHICAGO WHITE SOX-3
17 GAME 095, JULY 18, HOUSTON-6 GAME 098, JULY 21, N.Y. SEATTLE-1 GAME 101, JULY 24, SEATTLE-4


18 GAME 104, JULY 28, N.Y. SEATTLE-5 GAME 107, JULY 31, TEXAS-4 CUMULATIVES THROUGH 36 GAMES


19 GAME 110, AUGUST 3, KANSAS CITY-6 GAME 113, AUGUST 6, KANSAS CITY-9 GAME 116, AUGUST 10, L.A. SEATTLE-3
20 GAME 119, AUGUST 13, L.A. SEATTLE-2 GAME 122, AUGUST 16, SEATTLE-7 GAME 125, AUGUST 20, TAMPA BAY-3


21 CUMULATIVES THROUGH 42 GAMES GAME 128, AUGUST 23, ATLANTA-6

22 GAME 131, AUGUST 27, N.Y. YANKEES-10 GAME 134, AUGUST 30, BALTIMORE-8 GAME 137, SEPTEMBER 3, SEATTLE-10
23 GAME 140, SEPTEMBER 6, SEATTLE-3 GAME 143, SEPTEMBER 10, L.A. SEATTLE-3


24 CUMULATIVES THROUGH 48 GAMES GAME 146, SEPTEMBER 13, TEXAS-1

25 GAME 149, SEPTEMBER 16, HOUSTON-8 GAME 152, SEPTEMBER 20, SEATTLE-6 GAME 155, SEPTEMBER 23, SEATTLE-4


26 GAME 158, SEPTEMBER 26, OAKLAND-3 GAME 161, SEPTEMBER 30, L.A. ANGELS-4


27 CUMULATIVES THROUGH 54 GAMES AS ABOVE, BUT RANKED BY MOST OPPORTUNITIES & INNINGS PITCHED


28 COMPLETE MARINER BATTING STATISTICS FOR 2017 SEASON* *WAR not shown.

 From")

29 COMPLETE MARINER PITCHING STATISTICS FOR 2017 SEASON* *WAR not shown. SUV BATTING & PITCHING STATISTICS FOR TOP 10 PLAYERS BASED ON MOST OPPORTUNITIES & INNINGS PITCHED (54 GAMES) From Reference 2 the complete season batting and pitching statistics for all the Mariner players are shown above (except for WAR, discussed below). These are followed by the 54-game SUV
30 statistics for batting and pitching for the top 10 players with the most Opportunities and Innings Pitched, using a lower limit of 124 Opportunities (Dyson) and Innings Pitched (Vincent). No contribution from Error/PB/CI is included here. The totals for each group of 10 players, along with the mean and standard deviation, in each category, +SUV and +Avg are calculated to enable a normalization of the statistics for each of the 10 players per group as follows: 1 Normalized Statistic +SUV or + Avg = σ 2π e; ;D where μ = mean and σ = standard deviation. = These normalized statistics, representing the percentiles of the normal distribution where the statistics occur, are calculated for both +SUV and +Avg for the players in each group. Within each group, these two normalized statistics for each player are then averaged ( Both column) and used to rank the players from first through tenth. Note that, for batters, higher values are desirable. For pitchers, the lower values are desirable. The reason for considering both +SUV and +Avg is that the former reflects longevity (most Opportunities or Innings Pitched) over a season while the second reflects expected performance per Opportunity or Inning Pitched. Combined, both aspects are reflected. This is akin to giving additional weight to the hitter who had 150 hits in 500 at-bats over the one with 30 hits in 100 at-bats. As an example calculation, consider Seager, who has a +SUV = and +Avg = When normalized to the mean +SUV = 2.81 and mean +Avg = (with respective standard deviations of 7.41 and 0.042), his normalized +SUV and +Avg become as follows: dx Normalized + SUV = KL.MN ;D 1 (7.41) 2π e; dx = Normalized + Avg = M.MNO ;D 1 (0.042) 2π e; dx = These indicate that his +SUV occurs at the 93.6%ile and +Avg at the 91.5%ile, both the highest among the 10 batters. The average of the two is 0.925, which ranks him first overall among the batters, just slightly above Cruz at Since lower values are optimal for pitchers, Bergman ranks first with 0.033, significantly ahead of the next pitcher, Vincent, at Given his lowest +SUV = and lowest +Avg = among the 10 pitchers with at least Innings Pitched, this comes as no surprise. What is especially interesting, and the goal of developing the SUV statistic, are insights into players performance in the clutch that may not be readily indicated by the myriad of other statistics currently being used. 1 Below are the season statistics (now including WAR) for the top 1 Since only 54 of the total 162 games have been analyzed for SUV, all the following insights regarding individual players should be taken with a grain of salt as merely illustrative as if the entire season had been analyzed for SUV. As will be shown below for Ramirez, if the selected games happened to correspond to atypically better or poorer performances by the player than what transpired over the entire season, the insights may be biased by the limited selection. While 1/3 of the season is considered to be a significant sample for analysis, it remains possible that atypical player performance has been highlighted. All subsequent insights are
31 10 batters and pitchers from the SUV lists based on the compilations shown above from Reference 2. To characterize player performance based on such multiple statistics, the approach taken is similar to that for the two SUV statistics, +SUV and +Avg, i.e., the players are ranked by normalization of the statistics for selected categories, then these normalized values are averaged to yield one overall result, used to rank the players. For batting, a combination of longevity (Runs, Hits, RBIs, and WAR [Wins Against Replacement]) and expected performance per at-bat (AB) statistics (Runs/AB, Hits/AB [Batting Average], OBP [On-Base Percentage] and SLG [Slugging Percentage]), i.e., a total of eight statistics, are used. For pitching, four longevity (Hits, Earned Runs, Bases-on-Ball + Hits-By-Pitch, and WAR) and two expected performance per Inning Pitched statistics (Earned Run Average and Walks+Hit-Batters per IP), i.e., a total of six statistics, are used. Note that, for pitchers, all but the WAR statistic indicate better performance with lower values. Therefore, to incorporate WAR consistently with the rest, its normalized value is subtracted from 1.00 (since we are dealing with probabilities), such that the lower value ( 1- WAR ) represents better performance. Within the constraints of the comparison (SUV analysis is based on only one-third, i.e., 54 games, of the season vs. Reference 2 s complete season; and the subjectivity of which statistics to select for the comparison and use of normalization and subsequent averaging to yield a performance measure that can be compared to the SUV), the results provide insights that might not readily be found from the current myriad of statistics. Among the batters, Seager and Cruz stood out as the top performers, with a fairly wide margin over the next lower player (Cano); while Zunino and Heredia were the poorest, significantly below the next higher player (Dyson). When the full season traditional statistics are used, Cruz stands out at the top and Heredia at the bottom, similar to the SUV results, with Seager and Zunino falling in the middle. Again, this comparison is arbitrary, and the SUV analysis uses only 54 of the 162 games, but if one envisions the SUV results to be representative of a full-season performance, they indicate that Seager performed well in the clutch, much better than his traditional statistics would seem to indicate. Meanwhile, Zunino did not perform well in the clutch, despite fairly good traditional statistics. Such insight could be quite valuable to an owner, general manager, and manager (and hitting coach) when assembling a roster and line-up. For pitchers based on their SUV, Bergman stood out at the top, with Vincent and Paxton next and well above the rest of the group; while Ramirez and Miranda were the poorest, well below the next higher player (Gallardo). Based on the full season s traditional statistics, Vincent comes out on top, followed by Diaz and Ramirez (the bottom performer based on the SUV), with Bergman and Paxton in the middle. Gallardo and Miranda are at the bottom, consistent with their SUV ranks. However, there is quite a discrepancy for Ramirez a good performer according to the traditional statistics, but a poor one according to SUV. Ignoring the possibility (likelihood [see footnote]) that this discrepancy is the result of Ramirez games included for the SUV just happening to be his worst, this suggests that he does not perform well in the clutch despite good traditional statistics. 2 Meanwhile, Bergman performs much better in the clutch than his 2 intended to be illustrative only, not necessarily reflecting deviations from any individual player s overall performance, either better or worse. In fact, review of the four games where Ramirez pitched (#s 113, 128, 143 and 149) among the 54 selected for the SUV analysis indicates that he performed quite poorly relative to what would have been expected if all of his games were included. Over those four games, he pitched innings, yielding 27 hits, 16 earned runs, and six walks (no-hit batters), corresponding to an ERA = 6.65 and WHBIP = 1.52 (WAR was not tracked). If his season statistics were apportioned by the ratio of innings to his total of 62 innings, the expected hits, earned runs, walks (plus hit-batters), ERA and WHBIP would have been 19.92, 9.44, 5.59, 3.92 and 1.18, respectively. All but the walks (plus hit-batters) over those four games were at least 29% higher than would have been expected,


32 traditional statistics would seem to indicate. Again, to the extent the SUV results for 54 games are representative for an entire season, such insight could be quite valuable to an owner, general manager, and manager (and pitching coach). COMPLETE SEASON BATTER STATISTICS FOR TOP 10 MARINERS FROM SUV LIST COMPLETE SEASON PITCHER STATISTICS FOR TOP 10 MARINERS FROM SUV LIST especially the earned runs and ERA (70% higher). Therefore, it appears the four games out of the 54 selected for the SUV analysis just happened to be poor ones for Ramirez, atypical of his overall performance. Analysis of all 162 games for SUV would be expected to bring these into better alignment.
 one with several unearned SUVs (Game 131, August 27, Seattle-1 @ N.Y.")
33 Finally, while Reference 1 analyzes two games in detail for both teams to illustrate how the SUV is calculated and used, it should be helpful to do so here for three selected games from the list of 54. The games chosen represent (1) one with several unearned SUVs (Game 131, August 27, N.Y. Yankees-10); (2) one where the Mariners batted around (10 men in one inning - Game 059, June 6, Seattle-12); and (3) a ninth-inning walk-off (Game 038, May 14, Toronto-3). For each of these, the complete play-by-play from Reference 2 is provided. Innings of especial interest are described in detail, with the remainder left to the reader to calculate as desired given the complete play-by-play. GAME 131, AUGUST 27, N.Y. YANKEES-10
. Alonso singles (SUV = 0.")
, advancing Alonso to third (SUV = 0.68 0.44 = 0.24), giving Cano a total of 0.46. Cruz doubles (SUV = 0.")
, leaving Cano at third, now with two outs (SUV = 0.")
34 The first inning, with errors involved in the scoring for both teams, is of primary interest for illustration here. Seattle s inning goes as follows. Segura makes the first out (SUV = -0.23). Alonso singles (SUV = 0.22) and advance to second on an error (unearned SUV = = 0.22). Cano singles (SUV = 0.22), advancing Alonso to third (SUV = = 0.24), giving Cano a total of Cruz doubles (SUV = 0.44) scoring Alonso (SUV = = 0.32) and advancing Cano to third base (SUV = = 0.46), giving Cruz a total of With runners on second and third, Seager strikes out (SUV = -0.16), leaving Cano at third, now with two outs (SUV = = -0.39), and Cruz at second (SUV = = -0.21), giving Seager at
35 total of Finally, Haniger ends the inning with the third out (SUV = -0.10), stranding both runners (SUV = for stranding Cano, plus SUV = for stranding Cano), giving Haniger a total of Therefore, when the six players SUVs ( = 0.29) are combined with the unearned SUV due to the error (0.22), the total SUV becomes the expected = 0.51 for one run scored. The Yankees first inning is even more interesting, including three errors, and is likely as complicated as any SUV calculation can get. However, since only the pitcher s SUV is of interest, the individuals SUVs are not separately tracked. Here is how Albers SUV is calculated. Hicks makes the first out (Albers SUV = -0.23). Castro doubles (Albers SUV = 0.44, cumulative = = 0.21). Sanchez singles in Castro (Albers SUV = = 0.56 for scoring Castro, plus SUV = 0.22 for the single) and advances to second on an error (unearned SUV = = 0.22), but this is not charged to Albers. Therefore, Albers cumulative SUV = = 0.99, with 0.22 unearned being tracked separately. Judge walks, adding 0.22 to Albers SUV, now at Gregorius reaches first on an error (unearned SUV = 0.22), advancing Sanchez to third (unearned SUV = = 0.24) and Judge to second (unearned SUV = = 0.22). Without the error, a second out (SUV = -0.16) would have been recorded, with Sanchez remaining at second (SUV = = -0.21) and Judge at first (SUV = = -0.10). Therefore, without the error, Albers would have recorded an SUV = = -0.47, bringing his total to = The error receives an SUV = (-0.47) = 1.15, which brings the cumulative unearned SUV now to = Headley next grounds into what would have been a force out at second, but instead is an error, allowing Sanchez to score (unearned SUV = = 0.32), Judge to reach third (unearned SUV = = 0.24), Gregorius to reach second (unearned SUV = = 0.22), and Headley to reach first (unearned SUV = 0.22). Without the error, a second out (SUV = -0.16) would have been recorded, with Sanchez scoring (SUV = = 0.32), Judge reaching third (SUV = = -0.15), Gregorius erased (SUV = -0.22) and Headley reaching first (SUV = 0.12). The aggregate of this for Albers is = -0.09, bringing his total to = The cumulative unearned SUV now rises to (-0.09)= Frazier strikes out for the second out (Albers SUV = = for keeping Judge at third, plus = for doing likewise with Gregorius at second, plus = for keeping Headley at first, plus SUV = for the second out). Albers cumulative SUV is now = Next, Ellsbury doubles (Albers SUV = 0.23), driving in Judge and Gregorius (Albers SUV = = 0.71 for Judge, plus = 0.77 for Gregorius), and advancing Headley to third (Albers SUV = = 0.17). However, an error allows Headley to score (unearned SUV = = 0.71) and Ellsbury to advance to third (unearned SUV = = 0.06), neither of which would have occurred without the error. Totaling up Albers SUV now yields = The unearned SUV now rises to = Torreyes next singles (Albers SUV = 0.12), driving in Ellsbury from third (Albers SUV = = 0.71), raising Albers cumulative SUV to = Finally, Hicks makes the third out (Albers SUV = for stranding Torreyes, plus for the third out). Albers cumulative SUV for this inning becomes = Adding this to the total unearned SUV = 3.23 yields 5.51, which corresponds to = 5.51 for six runs scored in the inning. Since Albers experienced no more errors over the remaining five innings he pitched, his total SUV acquired the generic for each inning without a score and = 0.51 for each of the two innings where he yielded an additional run, bringing his total for the game to (3)(-0.49) + (2)(0.51) = Seattle made no more errors, so the total unearned SUV for the game remains at
36 3.23. Reliever Altavilla yielded two runs in the seventh and none in the eighth for a cumulative SUV = = Thus, the total SUV for the two Seattle pitchers becomes = 2.85 which, when combined with the unearned SUV = 3.23, equals 6.08, consistent with an eight-inning game SUV (Yankees were home) of 10 (8)(0.49) = Seattle never scored again, so each of their remaining eight innings had SUVs = -0.49, with innings two, seven, eight and nine having the simplest three up and three down SUV = = Scoring only one run for the game, the total SUV is 1 (9)(0.49) = -3.41, consistent with the total for all the players SUVs (-4.25) plus the total unearned SUV (0.84), i.e., = The Yankees made an error in the sixth, so the SUV calculation for that inning went as follows: Cruz reaches first on an error (SUV = for Cruz since he should have been out, with an unearned SUV = 0.39 [-0.23] = 0.62); Seager strikes out for first out (SUV = = for leaving Cruz at first, plus for making the first out, giving Seager a total of -0.40); Haniger strikes out for the second out (SUV = = for leaving Cruz at first, plus for making the second out, giving Haniger a total of -0.26); finally Gamel makes out number three (SUV = for stranding Cruz, plus for the third out, giving Gamel a total of -0.22); total SUV for inning = 0.62 (unearned) = The reader is left to calculate the SUVs for the other innings based on the play-by-play provided. GAME 059, JUNE 6, SEATTLE-12
37
, advancing Zunino to second (SUV = 0.63 0.39 = 0.24), giving Dyson a total SUV of 0.63. Next, Heredia singled (SUV = 0.39), advancing each runner one base (SUV = 0.87 0.63 + 0.63 0.39 = 0.48), giving Heredia a total SUV of 0.")
, advancing Valencia to third (SUV = 0.87 0.63 = 0.24), giving Cano a total SUV of 0.63. After a pitching change, Cruz singled (SUV = 0.39), scoring Valencia (SUV = 1 0.87 = 0.")
38 From this game, it is the Mariners fourth inning that is of interest, with them having batted around to score seven runs. Zunino led off with a single (SUV = 0.39). Dyson was hit by a pitch (SUV = 0.39), advancing Zunino to second (SUV = = 0.24), giving Dyson a total SUV of Next, Heredia singled (SUV = 0.39), advancing each runner one base (SUV = = 0.48), giving Heredia a total SUV of Valencia followed with a double (SUV = 0.63), scoring all three runners (SUV = = 1.11), giving Valencia a total SUV of Cano singled (SUV = 0.39), advancing Valencia to third (SUV = = 0.24), giving Cano a total SUV of After a pitching change, Cruz singled (SUV = 0.39), scoring Valencia (SUV = = 0.13) and advancing Cano to second (SUV = = 0.24), giving Cruz a total SUV of Powell came in to pinch run for Cruz; however, as he subsequently did not directly advance on his own or make an out on his own, he was not tracked in this inning (but tracked in later innings since he remained in the game and subsequently batted). Seager next scored everyone with a home run (SUV = = 1.98). Finally, the next three batters made outs (Motter s SUV = -0.23, Gamel s SUV = -0.16, Zunino s SUV = ). Since Zunino batted twice in the inning, he had two opportunities and a net SUV = = This is indicated by the bolded outline around his entry in the fourth inning. The Mariners total SUV for the inning is the expected = 6.51, as shown by the sum of the individual SUVs for the inning. Seattle s total game SUV = 12 (8)(0.49) = 8.08 (Seattle was home), while the Twins total was 3 (9)(0.49) =
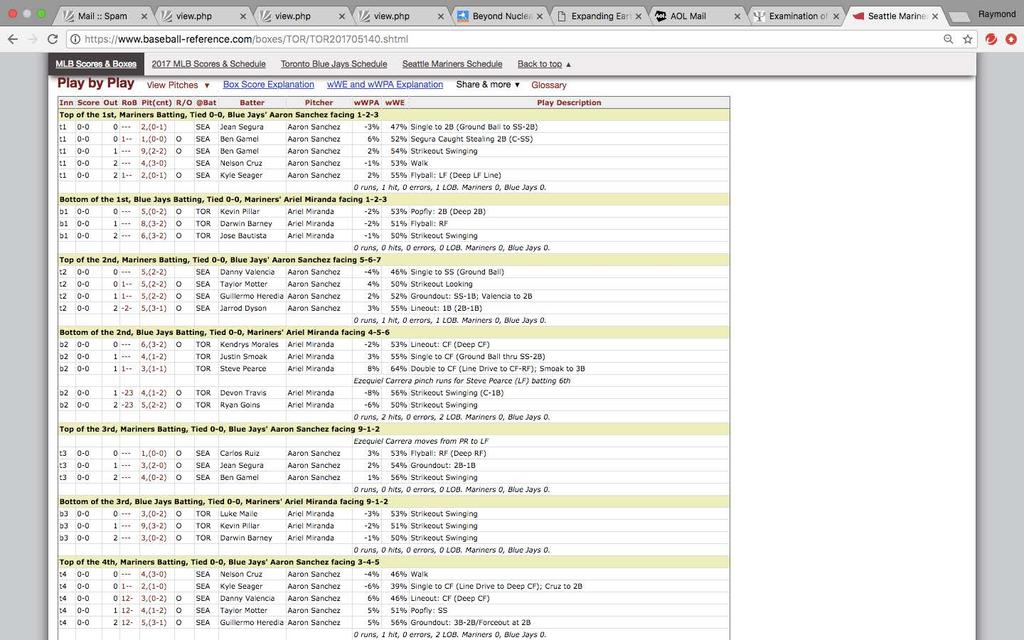
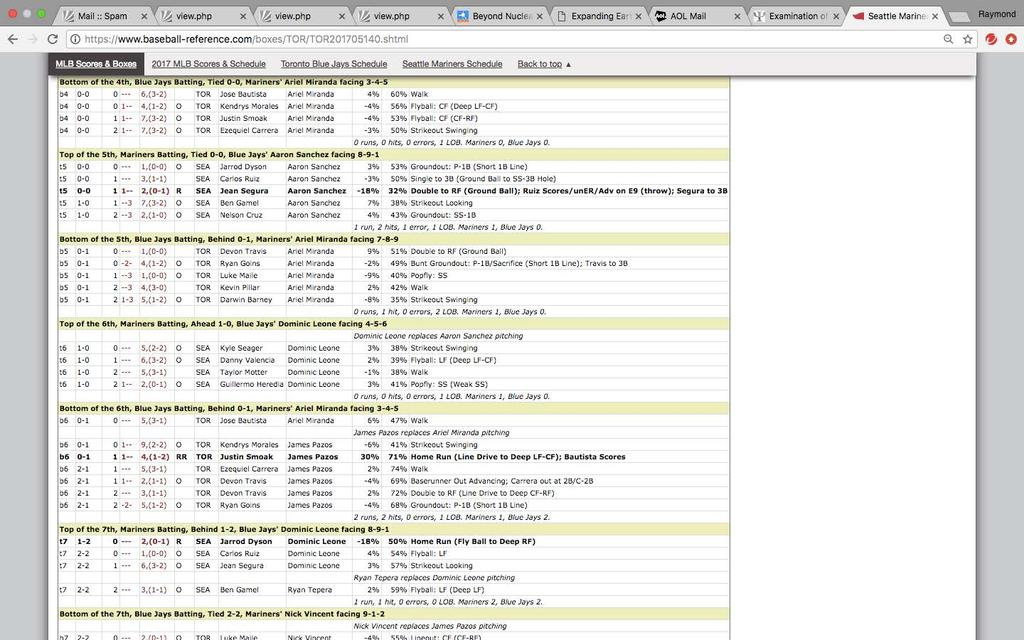
39 GAME 038, MAY 14, TORONTO-3 (WALK-OFF HOME RUN, 2 OUTS) The interesting aspect of this final game is Toronto s walk-off victory in the bottom of the ninth. After the first two batters made outs (SUV = = -0.39), Pillar homers to win the game (SUV = 1.00), giving Diaz an SUV = = 0.61 for the inning, which exceeds the usual = 0.51 typical for an inning with one run and three outs. Toronto s game total SUV is thus 3 (9)(0.49) 0.10 = instead of the expected because the final out, with an SUV = -0.10, never occurs. Seattle s run in the fifth is also of interest, since it involved an error. After Dyson made the first out (SUV = -0.23), Ruiz singled (SUV = 0.22), followed by Segura s double (SUV = 0.44), which advanced Ruiz to third (SUV = = 0.46), who scored on an error (unearned SUV = = 0.32), with Segura advancing to third on the same error (unearned SUV = = 0.24). Therefore, Segura s total SUV = = 0.90 and the total unearned SUV = = Gamel and Cruz made the next two outs without advancing Segura, for SUVs of = and = -0.39, respectively. The inning s total SUV, with the unearned portion included, is the expected = 0.51.
40
 to Measure Individual Performance in Team Sports, Lambert Academic Publishing, Saarbrücken, Germany (ISBN")
41 References 1. Gallucci, R Situational Underlying Value for Baseball, Football and Basketball A Statistic (SUV) to Measure Individual Performance in Team Sports, Lambert Academic Publishing, Saarbrücken, Germany (ISBN ); also: 2. Baseball Reference, 3. NFL Football Scores NFL Scoreboard ESPN, 4. NCAA Division 1 Men s Basketball Game Center,
42
43
Descriptive Statistics Project Is there a home field advantage in major league baseball?
 Descriptive Statistics Project Is there a home field advantage in major league baseball? DUE at the start of class on date posted on website (in the first 5 minutes of class) There may be other due dates
Paul M. Sommers. March 2010 MIDDLEBURY COLLEGE ECONOMICS DISCUSSION PAPER NO
 IS THERE HOME-FIELD ADVANTAGE IN INTERLEAGUE PLAY? by Paul M. Sommers March 2010 MIDDLEBURY COLLEGE ECONOMICS DISCUSSION PAPER NO. 10-12 DEPARTMENT OF ECONOMICS MIDDLEBURY COLLEGE MIDDLEBURY, VERMONT 05753
Figure 1. Winning percentage when leading by indicated margin after each inning,
 The 7 th Inning Is The Key By David W. Smith Presented June, 7 SABR47, New York, New York It is now nearly universal for teams with a 9 th inning lead of three runs or fewer (the definition of a save situation
2014 MAJOR LEAGUE LEAGUE BASEBALL ATTENDANCE NOTES
 2014 MAJOR LEAGUE LEAGUE BASEBALL ATTENDANCE NOTES This is a brief summary of 2014 Major League Baseball attendance. It includes league and team attendance in the pages that follow the notes below. The
KANSAS CITY ROYALS POSTGAME NOTES
 KANSAS CITY ROYALS POSTGAME NOTES MINNESOTA TWINS (57-102) AT KANSAS CITY ROYALS (81-78) - THURSDAY, SEPTEMBER 29, 2016 1 2 3 4 5 6 7 8 9 R H E LOB TWINS 0 0 0 0 0 1 3 0 3 7 13 0 8 ROYALS 0 2 0 0 0 0 2
2014 Tulane Baseball Arbitration Competition Eric Hosmer v. Kansas City Royals (MLB)
") 2014 Tulane Baseball Arbitration Competition Eric Hosmer v. Kansas City Royals (MLB) Submission on behalf of Kansas City Royals Team 15 TABLE OF CONTENTS I. INTRODUCTION AND REQUEST FOR HEARING DECISION...
2014 Tulane Baseball Arbitration Competition Eric Hosmer v. Kansas City Royals (MLB) Submission on behalf of Kansas City Royals Team 15 TABLE OF CONTENTS I. INTRODUCTION AND REQUEST FOR HEARING DECISION...
2014 National Baseball Arbitration Competition
 2014 National Baseball Arbitration Competition Eric Hosmer v. Kansas City Royals Submission on Behalf of Eric Hosmer Midpoint: $3.65 million Submission by: Team 26 Table of Contents I. Introduction and
Lesson 3 Pre-Visit Teams & Players by the Numbers
 Lesson 3 Pre-Visit Teams & Players by the Numbers Objective: Students will be able to: Review how to find the mean, median and mode of a data set. Calculate the standard deviation of a data set. Evaluate
Lorenzo Cain v. Kansas City Royals. Submission on Behalf of the Kansas City Royals. Team 14
 Lorenzo Cain v. Kansas City Royals Submission on Behalf of the Kansas City Royals Team 14 Table of Contents I. Introduction and Request for Hearing Decision... 1 II. Quality of the Player s Contributions
Additional On-base Worth 3x Additional Slugging?
 Additional On-base Worth 3x Additional Slugging? Mark Pankin SABR 36 July 1, 2006 Seattle, Washington Notes provide additional information and were reminders during the presentation. They are not supposed
Table 1. Average runs in each inning for home and road teams,
 Effect of Batting Order (not Lineup) on Scoring By David W. Smith Presented July 1, 2006 at SABR36, Seattle, Washington The study I am presenting today is an outgrowth of my presentation in Cincinnati
1988 Graphics Section Poster Session. Displaying Analysis of Baseball Salaries
 1988 Graphics Section Poster Session Displaying Analysis of Baseball Salaries The Statistical Graphics Section of the American Statistical Association is sponsoring a special poster session titled "Why
Oakland Athletics Baseball Company 7000 Coliseum Way Oakland, CA A s PR on Alerts
 O AKLAND A THLETICS Game Information Oakland Athletics Baseball Company 7000 Coliseum Way Oakland, CA 94621 510-638-4900 www.athletics.com A s PR on Twitter @AsMedia Alerts OAKLAND ATHLETICS (58-75) VS.
OAKLAND ATHLETICS GAME INFORMATION
 OAKLAND ATHLETICS GAME INFORMATION Oakland Athletics Baseball Company 510-638-4900 athletics.com A s PR @AsMediaAlerts Get the latest A s notes, full stat packets, clips, press releases, roster, updated
2014 National Baseball Arbitration Competition
 2014 National Baseball Arbitration Competition Jeff Samardzija v. Chicago Cubs Submission on Behalf of Chicago Cubs Midpoint: $4.9 million Submission by: Team 26 Table of Contents I. Introduction and Request
The Rise in Infield Hits
 The Rise in Infield Hits Parker Phillips Harry Simon December 10, 2014 Abstract For the project, we looked at infield hits in major league baseball. Our first question was whether or not infield hits have
SAP Predictive Analysis and the MLB Post Season
 SAP Predictive Analysis and the MLB Post Season Since September is drawing to a close and October is rapidly approaching, I decided to hunt down some baseball data and see if we can draw any insights on
2014 Tulane Baseball Arbitration Competition Josh Reddick v. Oakland Athletics (MLB)
") 2014 Tulane Baseball Arbitration Competition Josh Reddick v. Oakland Athletics (MLB) Submission on Behalf of the Oakland Athletics Team 15 Table of Contents I. INTRODUCTION AND REQUEST FOR HEARING DECISION...
2014 Tulane Baseball Arbitration Competition Josh Reddick v. Oakland Athletics (MLB) Submission on Behalf of the Oakland Athletics Team 15 Table of Contents I. INTRODUCTION AND REQUEST FOR HEARING DECISION...
2016 MAJOR LEAGUE BASEBALL ATTENDANCE HIGHLIGHTS
 2016 MAJOR LEAGUE BASEBALL ATTENDANCE HIGHLIGHTS This is a brief summary of 2016 Major League Baseball attendance. It includes league and team attendance totals in the pages that follow the notes below.
Oakland Athletics Baseball Company 7000 Coliseum Way Oakland, CA A s PR on Alerts
 ABOUT THE A S: Have won each of the last three games, which is the A s longest winning streak since May 18-20 when they also won three in a row have won more than three straight just once this year and
2014 NATIONAL BASEBALL ARBITRATION COMPETITION ERIC HOSMER V. KANSAS CITY ROYALS (MLB) SUBMISSION ON BEHALF OF THE CLUB KANSAS CITY ROYALS
 SUBMISSION ON BEHALF OF THE CLUB KANSAS CITY ROYALS") 2014 NATIONAL BASEBALL ARBITRATION COMPETITION ERIC HOSMER V. KANSAS CITY ROYALS (MLB) SUBMISSION ON BEHALF OF THE CLUB KANSAS CITY ROYALS Player Demand: $4.00 Million Club Offer: $3.30 Million Midpoint:
2014 NATIONAL BASEBALL ARBITRATION COMPETITION ERIC HOSMER V. KANSAS CITY ROYALS (MLB) SUBMISSION ON BEHALF OF THE CLUB KANSAS CITY ROYALS Player Demand: $4.00 Million Club Offer: $3.30 Million Midpoint:
(56.3%) AL (60%) (62%) (69%) (+4149) 7* 9-5 (64%) +450 (400% ROI
 AL (60%) (62%) (69%) (+4149) 7* 9-5 (64%) +450 (400% ROI") Season: 107-83 (56.3%) for +3924 AL System: 27-18 (60%) June: 18-11 (62%) and +1005 May: 22-10 (69%) (+4149) 7* and Higher: 9-5 (64%) Playoffs: +450 (400% ROI for Playoff purchasers) By Game Season To
Season: 107-83 (56.3%) for +3924 AL System: 27-18 (60%) June: 18-11 (62%) and +1005 May: 22-10 (69%) (+4149) 7* and Higher: 9-5 (64%) Playoffs: +450 (400% ROI for Playoff purchasers) By Game Season To
2013 Tulane National Baseball Arbitration Competition
 2013 Tulane National Baseball Arbitration Competition Dexter Fowler vs. Colorado Rockies Submission on Behalf of Mr. Dexter Fowler Midpoint: $4.3 million Submission by Team 38 Table of Contents I. Introduction
Oakland Athletics Baseball Company 7000 Coliseum Way Oakland, CA A s PR on Alerts
 O AKLAND A THLETICS Game Information Oakland Athletics Baseball Company 7000 Coliseum Way Oakland, CA 94621 510-68-4900 www.athletics.com A s PR on Twitter @AsMedia Alerts OAKLAND ATHLETICS (16-21) VS.
Should pitchers bat 9th?
 Should pitchers bat 9th? Mark Pankin SABR 37 July 26, 2007 St. Louis, Missouri Notes provide additional information and were reminders during the presentation. They are not supposed to be anything close
Lesson 5 Post-Visit Do Big League Salaries Equal Big Wins?
 Lesson 5 Post-Visit Do Big League Salaries Equal Big Wins? Objective: Students will be able to: Determine the average salary of a Major League Baseball player. Use charts to locate information. Compare
Oakland Athletics Baseball Company 7000 Coliseum Way Oakland, CA A s PR on Alerts
 O AKLAND A THLETICS Game Information Oakland Athletics Baseball Company 7000 Coliseum Way Oakland, CA 94621 510-638-4900 www.athletics.com A s PR on Twitter @AsMedia Alerts OAKLAND ATHLETICS (38-48) VS.
Oakland Athletics Baseball Company 7000 Coliseum Way Oakland, CA A s PR on Alerts
 O AKLAND A THLETICS Game Information Oakland Athletics Baseball Company 7000 Coliseum Way Oakland, CA 94621 510-638-4900 www.athletics.com A s PR on Twitter @AsMedia Alerts OAKLAND ATHLETICS (26-33) VS.
Matt Halper 12/10/14 Stats 50. The Batting Pitcher:
 Matt Halper 12/10/14 Stats 50 The Batting Pitcher: A Statistical Analysis based on NL vs. AL Pitchers Batting Statistics in the World Series and the Implications on their Team s Success in the Series Matt
Oakland Athletics Baseball Company 7000 Coliseum Way Oakland, CA A s PR on Alerts
 O AKLAND A THLETICS Game Information Oakland Athletics Baseball Company 7000 Coliseum Way Oakland, CA 94621 510-638-4900 www.athletics.com A s PR on Twitter @AsMedia Alerts OAKLAND ATHLETICS (22-29) VS.
Do Clutch Hitters Exist?
 Do Clutch Hitters Exist? David Grabiner SABRBoston Presents Sabermetrics May 20, 2006 http://remarque.org/~grabiner/bosclutch.pdf (Includes some slides skipped in the original presentation) 1 Two possible
Oakland Athletics Baseball Company 7000 Coliseum Way Oakland, CA A s PR on Alerts
 O AKLAND A THLETICS Game Information Oakland Athletics Baseball Company 7000 Coliseum Way Oakland, CA 94621 510-638-4900 www.athletics.com A s PR on Twitter @AsMedia Alerts OAKLAND ATHLETICS (21-25) VS.
Salary correlations with batting performance
 Salary correlations with batting performance By: Jaime Craig, Avery Heilbron, Kasey Kirschner, Luke Rector, Will Kunin Introduction Many teams pay very high prices to acquire the players needed to make
A LOOK BACK AT A brief recap of the 2013 campaign follows.
 The Flames celebrate their 2013 Big South Championship. A week later, Liberty appeared in its first NCAA Regional Final at the Columbia, S.C. Regional. For the first time in the program s 40 years, the
2013 National Baseball Arbitration Competition. Tommy Hanson v. Atlanta Braves. Submission on behalf of Atlanta Braves. Submitted by Team 28
 2013 National Baseball Arbitration Competition Tommy Hanson v. Atlanta Braves Submission on behalf of Atlanta Braves Submitted by Team 28 1 TABLE OF CONTENTS I. INTRODUCTION AND REQUEST FOR DECISION...
JEFF SAMARDZIJA CHICAGO CUBS BRIEF FOR THE CHICAGO CUBS TEAM 4
 JEFF SAMARDZIJA V. CHICAGO CUBS BRIEF FOR THE CHICAGO CUBS TEAM 4 Table of Contents I. Introduction...1 II. III. IV. Performance and Failure to Meet Expectations...2 Recent Performance of the Chicago Cubs...4
The MLB Language. Figure 1.
 Chia-Yen Wu chiayen@avaya.com June 6, 2006 The MLB Language 1. Introduction The MLB (Major League Baseball) language is designed to help an interested party determine certain characteristics of a baseball
2015 NATIONAL BASEBALL ARBITRATION COMPETITION
 2015 NATIONAL BASEBALL ARBITRATION COMPETITION Arizona Diamondbacks v. Mark Trumbo Submission on Behalf of Arizona Diamondbacks Midpoint: $5,900,000 Submission by Team: 5 Table of Contents I. Introduction
2014 National Baseball Arbitration Competition
 2014 National Baseball Arbitration Competition Eric Hosmer v. Kansas City Royals Submission on Behalf of Eric Hosmer Midpoint: $3,650,000 Submission by Team 2 Table of Contents I. Introduction and Request
#35 CODY BELLINGER #58 EDWARD PAREDES
 #35 CODY BELLINGER #58 EDWARD PAREDES CODY BELLINGER // Infielder/Outfielder NON-ROSTER INVITEE 35 BATS: Left THROWS: Left HEIGHT: 6-4 WEIGHT: 213 OPENING DAY AGE: 21 ML SERVICE: 0.000 BORN: July 13, 1995
Oakland Athletics Baseball Company 7000 Coliseum Way Oakland, CA A s PR on Alerts
 O AKLAND A THLETICS Game Information Oakland Athletics Baseball Company 7000 Coliseum Way Oakland, CA 94621 510-638-4900 www.athletics.com A s PR on Twitter @AsMedia Alerts OAKLAND ATHLETICS (22-26) VS.
Major League Baseball Offensive Production in the Designated Hitter Era (1973 Present)
") Major League Baseball Offensive Production in the Designated Hitter Era (1973 Present) Jonathan Tung University of California, Riverside tung.jonathanee@gmail.com Abstract In Major League Baseball, there
Major League Baseball Offensive Production in the Designated Hitter Era (1973 Present) Jonathan Tung University of California, Riverside tung.jonathanee@gmail.com Abstract In Major League Baseball, there
ISDS 4141 Sample Data Mining Work. Tool Used: SAS Enterprise Guide
 ISDS 4141 Sample Data Mining Work Taylor C. Veillon Tool Used: SAS Enterprise Guide You may have seen the movie, Moneyball, about the Oakland A s baseball team and general manager, Billy Beane, who focused
Oakland Athletics Baseball Company 7000 Coliseum Way Oakland, CA A s PR on Alerts
 ABOUT THE A S: Have lost two straight after winning four in a row and are now 5-5 over the last 10 games are 31-40 (.437) for the season, which is the worst record in the American League and fifth worst
BABE: THE SULTAN OF PITCHING STATS? by. August 2010 MIDDLEBURY COLLEGE ECONOMICS DISCUSSION PAPER NO
 BABE: THE SULTAN OF PITCHING STATS? by Matthew H. LoRusso Paul M. Sommers August 2010 MIDDLEBURY COLLEGE ECONOMICS DISCUSSION PAPER NO. 10-30 DEPARTMENT OF ECONOMICS MIDDLEBURY COLLEGE MIDDLEBURY, VERMONT
OAKLAND ATHLETICS GAME INFORMATION
 OAKLAND ATHLETICS GAME INFORMATION Oakland Athletics Baseball Company 510-638-4900 athletics.com A s PR @AsMediaAlerts Get the latest A s notes, full stat packets, clips, press releases, roster, updated
Oakland Athletics Baseball Company 7000 Coliseum Way Oakland, CA A s PR on Alerts
 O AKLAND A THLETICS Game Information Oakland Athletics Baseball Company 7000 Coliseum Way Oakland, CA 94621 510-638-4900 www.athletics.com A s PR on Twitter @AsMedia Alerts OAKLAND ATHLETICS (67-83) VS.
Draft - 4/17/2004. A Batting Average: Does It Represent Ability or Luck?
 A Batting Average: Does It Represent Ability or Luck? Jim Albert Department of Mathematics and Statistics Bowling Green State University albert@bgnet.bgsu.edu ABSTRACT Recently Bickel and Stotz (2003)
Stats in Algebra, Oh My!
 Stats in Algebra, Oh My! The Curtis Center s Mathematics and Teaching Conference March 7, 2015 Kyle Atkin Kern High School District kyle_atkin@kernhigh.org Standards for Mathematical Practice 1. Make sense
Oakland Athletics Baseball Company 7000 Coliseum Way Oakland, CA A s PR on Alerts
 O AKLAND A THLETICS Game Information Oakland Athletics Baseball Company 7000 Coliseum Way Oakland, CA 94621 510-638-4900 www.athletics.com A s PR on Twitter @AsMedia Alerts OAKLAND ATHLETICS (31-39) VS.
Oakland Athletics Baseball Company 7000 Coliseum Way Oakland, CA A s PR on Alerts
 ABOUT THE A S: Won two of three from Houston to start the homestand after losing five of the last six games on the last road trip are now 13-13, which marks the seventh time this year the A s have been
2018 Oakland A s. Expanded Game Notes
 2018 Oakland A s Expanded Game Notes includes: Traditional Game Notes Full Upcoming Probable Pitcher Pages Expanded Game Notes Complete Transactions Spring Training Statistics Monthly Statistics Please
Simulating Major League Baseball Games
 ABSTRACT Paper 2875-2018 Simulating Major League Baseball Games Justin Long, Slippery Rock University; Brad Schweitzer, Slippery Rock University; Christy Crute Ph.D, Slippery Rock University The game of
2017 B.L. DRAFT and RULES PACKET
 2017 B.L. DRAFT and RULES PACKET Welcome to Scoresheet Baseball. The following information gives the rules and procedures for Scoresheet leagues that draft both AL and NL players. Included is information
Oakland Athletics Baseball Company 7000 Coliseum Way Oakland, CA A s PR on Alerts
 O AKLAND A THLETICS Game Information Oakland Athletics Baseball Company 7000 Coliseum Way Oakland, CA 94621 510-638-4900 www.athletics.com A s PR on Twitter @AsMedia Alerts OAKLAND ATHLETICS (24-32) VS.
Oakland Athletics Baseball Company 7000 Coliseum Way Oakland, CA A s PR on Alerts
 O AKLAND A THLETICS Game Information Oakland Athletics Baseball Company 7000 Coliseum Way Oakland, CA 94621 510-638-4900 www.athletics.com A s PR on Twitter @AsMedia Alerts OAKLAND ATHLETICS (4-6) VS.
Oakland Athletics Baseball Company 7000 Coliseum Way Oakland, CA A s PR on Alerts
 O AKLAND A THLETICS Game Information Oakland Athletics Baseball Company 7000 Coliseum Way Oakland, CA 94621 510-638-4900 www.athletics.com A s PR on Twitter @AsMedia Alerts OAKLAND ATHLETICS (35-44) VS.
Oakland Athletics Baseball Company 7000 Coliseum Way Oakland, CA A s PR on Alerts
 O AKLAND A THLETICS Game Information Oakland Athletics Baseball Company 7000 Coliseum Way Oakland, CA 94621 510-638-4900 www.athletics.com A s PR on Twitter @AsMedia Alerts OAKLAND ATHLETICS (47-58) VS.
Internet Technology Fundamentals. To use a passing score at the percentiles listed below:
 Internet Technology Fundamentals To use a passing score at the percentiles listed below: PASS candidates with this score or HIGHER: 2.90 High Scores Medium Scores Low Scores Percentile Rank Proficiency
2018 Oakland A s. Expanded Game Notes
 2018 Oakland A s Expanded Game Notes includes: Traditional Game Notes Full Upcoming Probable Pitcher Pages Expanded Game Notes Complete Transactions Spring Training Statistics Monthly Statistics Please
Boston wins 1912 World Series Red Sox come from behind to win in six
 Boston wins 1912 World Series Red Sox come from behind to win in six Five of six games decided by one run World Series MV P Joe Wood Edged Christy Mathewson 2-1 in Game 4; recorded final out in Game 6,
The SUV Statistic for Baseball and Football Situational Underlying Value SUV Baseball Expected Runs/Chance of Scoring Table
 SUV Baseball The SUV Statistic for Baseball and Football Situational Underlying Value Raymond H.V. Gallucci, PhD., P.E., gallucci@localnet.com, r_gallucci@verizon.net SUV Situational Underlying Value for
An average pitcher's PG = 50. Higher numbers are worse, and lower are better. Great seasons will have negative PG ratings.
 Fastball 1-2-3! This simple game gives quick results on the outcome of a baseball game in under 5 minutes. You roll 3 ten-sided dice (10d) of different colors. If the die has a 10 on it, count it as 0.
Oakland Athletics Baseball Company 7000 Coliseum Way Oakland, CA A s PR on Alerts
 ABOUT THE A S: Have won three straight for the first time this year after losing a season-high four consecutive games it marks the first time the A s have won three straight home games since Aug. 8-10
Oakland Athletics Baseball Company 7000 Coliseum Way Oakland, CA A s PR on Alerts
 O AKLAND A THLETICS Game Information Oakland Athletics Baseball Company 7000 Coliseum Way Oakland, CA 94621 510-638-4900 www.athletics.com A s PR on Twitter @AsMedia Alerts OAKLAND ATHLETICS (19-25) VS.
Oakland Athletics Baseball Company 7000 Coliseum Way Oakland, CA A s PR on Alerts
 O AKLAND A THLETICS Game Information Oakland Athletics Baseball Company 7000 Coliseum Way Oakland, CA 94621 510-638-4900 www.athletics.com A s PR on Twitter @AsMedia Alerts OAKLAND ATHLETICS (38-49) VS.
Lesson 2 Pre-Visit Big Business of the Big Leagues
 Lesson 2 Pre-Visit Big Business of the Big Leagues Objective: Students will be able to: Identify several sources of revenue for Major League Baseball teams. Use math skills to estimate team revenue from
2014 National Baseball Arbitration Competition
 2014 National Baseball Arbitration Competition Jeff Samardzija v. Chicago Cubs Submission on Behalf of Jeff Samardzija Midpoint: $4.9 million Submission by: Team 18 i Table of Contents I. Introduction
Oakland Athletics Baseball Company 7000 Coliseum Way Oakland, CA A s PR on Alerts
 ABOUT THE A S: Have won two straight and three of the last four games after losing each of the previous four contests are 8-7 over the last 15 games but are 19-23 (.452) for the season, which is the fourth
MAJOR LEAGUE BASEBALL 2014 ATTENDANCE ANALYSIS. Compiled and Written by David P. Kronheim.
 MAJOR LEAGUE BASEBALL 2014 ATTENDANCE ANALYSIS Compiled and Written by David P. Kronheim d.kronheim@verizon.net 2015 MAJOR LEAGUE BASEBALL 2014 ATTENDANCE ANALYSIS TABLE OF CONTENTS PAGES Attendance Reporting
Double Play System 1.0
 Double Play System 1.0 A step-by-step system for the MLB 2011 Season By James Jones The DPS 1.0 System is a very simple and effective system. There are two steps you must follow. 1) How to detect when
2018 MAJOR LEAGUE AND MINOR LEAGUE BASEBALL ATTENDANCE HIGHLIGHTS
 2018 MAJOR LEAGUE AND MINOR LEAGUE BASEBALL ATTENDANCE HIGHLIGHTS This is a brief summary of 2018 Major League and Minor League Baseball attendance. It includes league and team attendance totals in the
2011 COMBINED LEAGUE (with a DH) DRAFT / RULES PACKET
 DRAFT / RULES PACKET") 2011 COMBINED LEAGUE (with a DH) DRAFT / RULES PACKET Welcome to Scoresheet Baseball. Here is the rules packet, for a Combined League (drafting both National and American League players), a description
2011 COMBINED LEAGUE (with a DH) DRAFT / RULES PACKET Welcome to Scoresheet Baseball. Here is the rules packet, for a Combined League (drafting both National and American League players), a description
Oakland Athletics Baseball Company 7000 Coliseum Way Oakland, CA A s PR on Alerts
 O AKLAND A THLETICS Game Information Oakland Athletics Baseball Company 7000 Coliseum Way Oakland, CA 94621 510-638-4900 www.athletics.com A s PR on Twitter @AsMedia Alerts OAKLAND ATHLETICS (4-3) VS.
Oakland Athletics Baseball Company 7000 Coliseum Way Oakland, CA A s PR on Alerts
 O AKLAND A THLETICS Game Information Oakland Athletics Baseball Company 7000 Coliseum Way Oakland, CA 94621 510-638-4900 www.athletics.com A s PR on Twitter @AsMedia Alerts OAKLAND ATHLETICS (35-46) VS.
George F. Will, Men at Work
 Part of baseball s charm is the illusion it offers that all aspects of it can be completely reduced to numerical expressions and printed in agate type in the sport section. George F. Will, Men at Work
2018 Oakland A s. Expanded Game Notes
 2018 Oakland A s Expanded Game Notes includes: Traditional Game Notes Roster Supplemental Bios Full Upcoming Probable Pitcher Pages Expanded Game Notes Complete Transactions Spring Training Statistics
Oakland Athletics Baseball Company 7000 Coliseum Way Oakland, CA A s PR on Alerts
 ABOUT THE A S: Have lost five of the last six games after winning five of the previous six games are a season-high tying seven games under.500 for the fourth time this year at 20-27 (.426) that is the
MAJOR LEAGUE BASEBALL 2010 ATTENDANCE ANALYSIS. Compiled and Written by David P. Kronheim
 MAJOR LEAGUE BASEBALL 2010 ATTENDANCE ANALYSIS Compiled and Written by David P. Kronheim 2011 MAJOR LEAGUE BASEBALL 2010 ATTENDANCE ANALYSIS TABLE OF CONTENTS PAGES Attendance Reporting Guidelines and
Chapter 1 The official score-sheet
 Chapter 1 The official score-sheet - Symbols and abbreviations - The official score-sheet - Substitutions - Insufficient space on score-sheet 13 Symbols and abbreviations Symbols and abbreviations Numbers
Average Runs per inning,
 Home Team Scoring Advantage in the First Inning Largely Due to Time By David W. Smith Presented June 26, 2015 SABR45, Chicago, Illinois Throughout baseball history, the home team has scored significantly
OAKLAND ATHLETICS GAME INFORMATION
 OAKLAND ATHLETICS GAME INFORMATION Oakland Athletics Baseball Company 510-638-4900 athletics.com A s PR @AsMediaAlerts Get the latest A s notes, full stat packets, clips, press releases, roster, updated
Part A: Changes in Distance between Major League Baseball Franchises and their Triple-A Affiliates
 Five Themes of Geography: Movement Major and Minor League Baseball Team Affiliations, 1998 & 2011 Ezra Zeitler University of Wisconsin-Eau Claire Department of Geography & Anthropology Purpose: This exercise
Scotty s Spring Training
 Scotty s Spring Training A Reading A Z Level O Leveled Book Word Count: 761 LEVELED BOOK O Scotty s Spring Training 1982-2001 TONY GWYNN Right Field San Diego Padres Written by Blane Jeffries Illustrated
MAJOR LEAGUE BASEBALL 2013 ATTENDANCE ANALYSIS. Compiled and Written by David P. Kronheim.
 MAJOR LEAGUE BASEBALL 2013 ATTENDANCE ANALYSIS Compiled and Written by David P. Kronheim d.kronheim@verizon.net 2014 MAJOR LEAGUE BASEBALL 2013 ATTENDANCE ANALYSIS TABLE OF CONTENTS PAGES Attendance Reporting
to the Kansas City Royals for the purposes of an arbitration hearing governed by the Major
 I. Introduction and Request for Hearing Decision This brief identifies and analyzes the contributions made by center fielder Lorenzo Cain to the Kansas City Royals for the purposes of an arbitration hearing
Oakland Athletics Baseball Company 7000 Coliseum Way Oakland, CA A s PR on Alerts
 O AKLAND A THLETICS Game Information Oakland Athletics Baseball Company 7000 Coliseum Way Oakland, CA 94621 510-638-4900 www.athletics.com A s PR on Twitter @AsMedia Alerts OAKLAND ATHLETICS (12-16) VS.
Relative Value of On-Base Pct. and Slugging Avg.
 Relative Value of On-Base Pct. and Slugging Avg. Mark Pankin SABR 34 July 16, 2004 Cincinnati, OH Notes provide additional information and were reminders during the presentation. They are not supposed
Oakland Athletics Baseball Company 7000 Coliseum Way Oakland, CA A s PR on Alerts
 ABOUT THE A S: The A s were swept in a three-game series at Los Angeles (AL) to start the trip and that clinched a last place finish in the American League West for the second consecutive season this is
OAKLAND ATHLETICS GAME INFORMATION
 OAKLAND ATHLETICS GAME INFORMATION Oakland Athletics Baseball Company 510-638-4900 athletics.com A s PR @AsMediaAlerts Get the latest A s notes, full stat packets, clips, press releases, roster, updated
KANSAS CITY ROYALS POSTGAME NOTES
 KANSAS CITY ROYALS POSTGAME NOTES CLEVELAND INDIANS (92-67) AT KANSAS CITY ROYALS (81-79) - FRIDAY, SEPTEMBER 30, 2016 1 2 3 4 5 6 7 8 9 R H E LOB INDIANS 0 0 4 0 0 0 3 0 0 7 10 0 6 ROYALS 1 0 0 0 0 0
Oakland Athletics Baseball Company 7000 Coliseum Way Oakland, CA A s PR on Alerts
 ABOUT THE A S: Have a season-high three game losing streak and have started the season 5-7 for the second consecutive year with a loss tonight, the A s would match their worst record after 13 games over
Quantitative Literacy: Thinking Between the Lines
 Quantitative Literacy: Thinking Between the Lines Crauder, Noell, Evans, Johnson Chapter 6: Statistics 2013 W. H. Freeman and Company 1 Chapter 6: Statistics Lesson Plan Data summary and presentation:
Oakland Athletics Baseball Company 7000 Coliseum Way Oakland, CA A s PR on Alerts
 O AKLAND A THLETICS Game Information Oakland Athletics Baseball Company 7000 Coliseum Way Oakland, CA 94621 510-638-4900 www.athletics.com A s PR on Twitter @AsMedia Alerts OAKLAND ATHLETICS (5-5) VS.
MONEYBALL. The Power of Sports Analytics The Analytics Edge
 MONEYBALL The Power of Sports Analytics 15.071 The Analytics Edge The Story Moneyball tells the story of the Oakland A s in 2002 One of the poorest teams in baseball New ownership and budget cuts in 1995
OAKLAND ATHLETICS GAME INFORMATION
 OAKLAND ATHLETICS GAME INFORMATION Oakland Athletics Baseball Company 510-638-4900 athletics.com A s PR @AsMediaAlerts Get the latest A s notes, full stat packets, clips, press releases, roster, updated
Seattle Mariners (42-49) 4, New York Yankees (49-41) 3 July 18, 2015
 4, New York Yankees (49-41) 3 July 18, 2015") Seattle Mariners (42-49) 4, New York Yankees (49-41) 3 1 2 3 4 5 6 7 8 9 R H E Seattle 2 0 0 0 0 2 0 0 0 4 7 0 NY Yankees 0 0 0 2 0 0 0 0 1 3 7 0 Seattle AVG AB R H 2B 3B HR RBI BB SO PO A Miller, B, SS.243
Seattle Mariners (42-49) 4, New York Yankees (49-41) 3 1 2 3 4 5 6 7 8 9 R H E Seattle 2 0 0 0 0 2 0 0 0 4 7 0 NY Yankees 0 0 0 2 0 0 0 0 1 3 7 0 Seattle AVG AB R H 2B 3B HR RBI BB SO PO A Miller, B, SS.243
OAKLAND ATHLETICS GAME INFORMATION
 OAKLAND ATHLETICS GAME INFORMATION Oakland Athletics Baseball Company 510-638-4900 athletics.com A s PR @AsMediaAlerts Get the latest A s notes, full stat packets, clips, press releases, roster, updated
NFL SCHEDULE SAMPLE. Green Bay
 Scott Kellen NFL SCHEDULE SAMPLE Thursday game Monday night Green Bay DATE HA OPPONENT 7 9/11/2016 A Jacksonville Jaguars 7.33 9/18/2016 7 A Minnesota Vikings 9.55 9/25/2016 7 H Detroit Lions 7.24 BYE
Oakland Athletics Baseball Company 7000 Coliseum Way Oakland, CA A s PR on Alerts
 O AKLAND A THLETICS Game Information Oakland Athletics Baseball Company 7000 Coliseum Way Oakland, CA 94621 510-638-4900 www.athletics.com A s PR on Twitter @AsMedia Alerts OAKLAND ATHLETICS (27-35) VS.