Impact of Kokomo Bypass From 1950 to 1964
|
|
|
- Junior Flowers
- 5 years ago
- Views:
Transcription


1 Impact of Kokomo Bypass From 1950 to 1964 E ugene G. Evans Research Assistant and H arold L. M ichael Associate Director Joint Highway Research Project Purdue University Introduction The tremendous increase in population and vehicle registration within the United States in recent years has created traffic snarls which are threatening to strangle many urban areas. An attempt to alleviate this congestion problem in the central portion of small to medium sized cities frequently has included the construction of bypass routes which skirt the periphery of a city. Kokomo, Indiana was faced with this congestion problem, and in 1950 a bypass facility east of the city was opened to traffic (see Figure 1). Initially the U.S. 31 Bypass satisfactorily served its intended purpose of conveniently and safely routing the through traffic around Kokomo, but the long-range usefulness of the bypass for this purpose appears to be decreasing because of increased travel times and a large increase in accidents. The Kokomo Bypass, unfortunately, was constructed with little or no control of access. The purpose of the investigation, which served as the basis for this paper, was to study the long-range effects of a bypass with little or no control of access. The study included an analysis of traffic volumes, travel times, accidents, land use, land value, and an investigation of the properties which were partially taken for the right-of-way of the improvement. The primary purpose of the investigation was to provide information which could profitably be used when planning other bypass facilities. The Study Area Kokomo, as a city by that name, has a history dating back to Population increases within Kokomo and Howard County have been 242

2 243 Fig. 1. Diagram showing construction stages of the U.S. 31 Bypass.


3 244 Fig. 2. Population growth of Kokomo and Howard County. relatively steady (see Figure 2) and greater than the prevailing trend in Indiana. Kokomo is situated in north central Indiana on a major north-south highway, U.S. 31. U.S. 35 connects the city to other metropolitan areas to the northwest and southeast while Indiana 22 passes in an east-west direction through the city (see Figure 3 ). Three railroad lines provide service to Kokomo of which two are the property of the Nickel Plate Railroad, and the other is owned by the Pennsylvania Railroad. Both passenger and freight service are available with ten freight trains and two passenger trains passing through the city daily. Faster passenger service is available at the Municipal Airport which is served by one commercial airline. Kokomo is also served by three bus lines of which one is local, one offers service in Indiana, and the third provides passenger service to all segments of the nation. Thirteen trucking agencies which are located in Kokomo offer their services to the inhabitants and to the industrial and commercial establishments in the greater Kokomo area. A study of selected statistics for the ten year period from 1950 to 1960 for Howard County and the State of Indiana showed that population, income, labor, housing, and bank deposits for Howard Countv increased at a faster rate than the state averaere while the

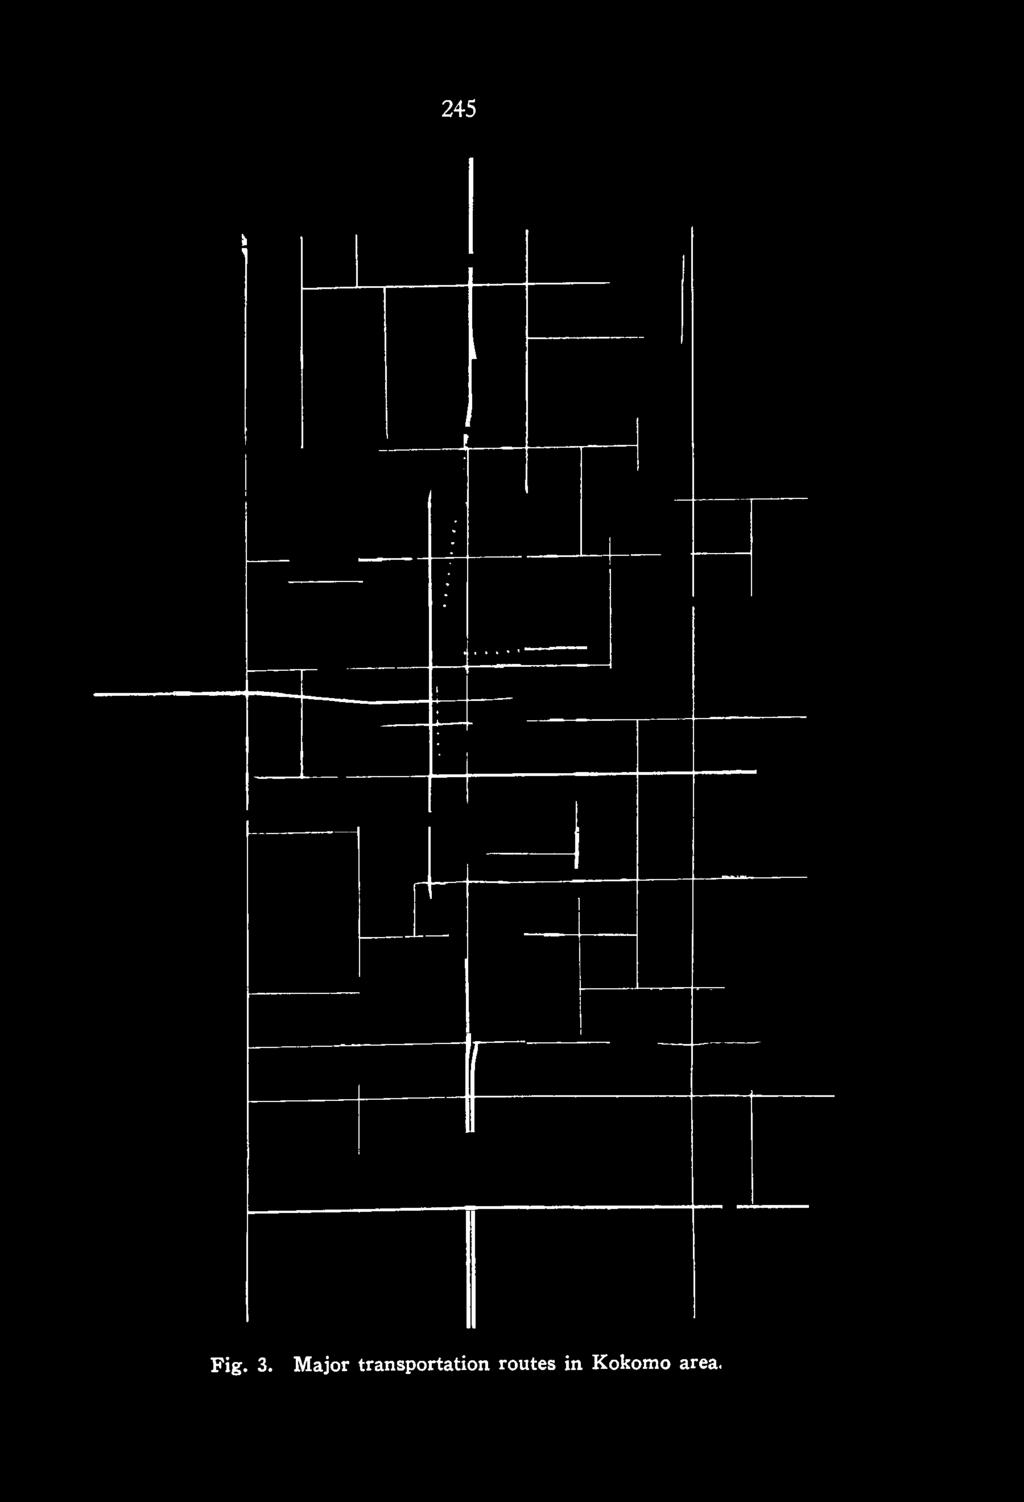
4 245 Fig. 3. Major transportation routes in Kokomo area.
 Traffic Volume Traffic volume data are necessary in many phases of highway planning and engineering.")

5 246 changes in retail trade, wholesale trade, and manufacturing were comparable to the state averages. (1) Traffic Volume Traffic volume data are necessary in many phases of highway planning and engineering. These data are used in the geometric design of both new and old facilities, in determining appropriate traffic control devices, and in determining the degree of congestion at a given location. The growth of an area is reflected in traffic volume changes with time for the highway routes which serve it. Traffic volumes in 1951 for the Kokomo Bypass and major intersecting streets are shown in Figure 4. (4). When these are compared to the corresponding volumes in 1964 (see Figure 5) a sizeable increase in volumes is noted. W ith the large traffic volume increases have come traffic signals at several intersections, congestion, increased travel time, and an increase in accidents, all of which have reduced the operational efficiency of the bypass. Because of increases in traffic volumes and a rapid growth of establishments adjacent to the bypass, lower speed limits have necessarily been posted. W ith little imagination one can visualize the Kokomo Bypass as becoming a major bottleneck for traffic in the near future. W ith no access control provided a route often loses some of its capacity, and this is indeed an undesirable characteristic of a noncontrolled access facility. On the other hand, fully controlled access facilities have proved to be able to retain their original capacity. Another factor which is significant is that both local and through traffic utilize the bypass in heavy volumes. These incompatible uses were found to be a primary contributor to vehicular accidents and delay on the Kokomo Bypass. (6) Travel Time The primary purpose of a bypass facility is to move traffic around a city in as short a period of time as practical. When the driver is given a choice of alternate facilities, he usually selects the route which minimizes travel time. Travel time comparisons for the Kokomo Bypass from 1951 through 1964 are shown in Figure 6. The time required to traverse the bypass has increased only slightly from 1957 through This small increase was possible only because of the construction of an additional two lanes in 1960 to provide a four-lane divided facility. A similar comparison

6 247 Fig. 4. Traffic volume on and near K okom o Bypass 1951.

7 248 Fig. 5. Traffic volume on and near Kokom o B yp a ss 1964.

8 249 Fig. 6. Bypass travel time comparisons. of the travel times on the U.S. 31 city route through Kokomo is shown in Figure 7. For an economic analysis the present Kokomo Bypass was compared with a fictitious Kokomo Bypass with full control of access. In the summer of 1964 the average speed in Indiana of free flowing passenger cars on four-lane divided facilities with full control of access was found to be 67.7 mph (2 ). Assuming that vehicles traveling on the Kokomo Bypass in 1964 would have traveled in the same volume on a fully controlled access facility and at this speed had the facility been


9 250 Fig. 7. City route travel time comparisons. of the freeway type, a net savings of approximately $270,000 would have been realized by motorists in This figure is based solely on time lost by the motorist traversing the bypass at values suggested by the American Association of State Highway Officials. (7 ) It does not include such losses as increased stopping costs, operating costs, idling costs, starting costs, etc.

10 251


11 252 Accidents The accident analysis which was conducted on the Kokomo Bypass indicates that many accidents can be related to a probable cause. An attempt was made to define areas with high accident rates and to determine those factors which contributed to the accident rate. An accident spot map for the bypass indicates that the majority of the accidents happen at intersections (see Figure 8 ). Accidents were most prevalent along the Kokomo Bypass at the following intersections: Markland, Sycamore, East Boulevard, Alto, and Southway Boulevard. The accident involvement rate was also high at the crossover at the north end of the bypass. A quality control analysis was one technique utilized to locate high accident sections along the bypass facility. (5) For this analysis the bypass was divided into six sections (see Figure 9 ). This method was used to isolate sections which were out of control because of measurable environmental factors. Because it was surmised that the northbound and southbound lanes had different involvement characteristics, an accident rate was computed for each direction. The northbound accident rate for the years per 100 million vehicle miles for the entire length of the bypass was 350 while the southbound accident rate was 270. Section 4-5 for northbound traffic was found to be out of control. Several factors contributed to high accident rate in this section. The most significant are sight distance, which is poor, and traffic speeds, which are high. Section 5-6 was also out of control but on the low side, a desirable finding. The major reason for the low accident rate in this section is the fact that little access is as yet necessary in this section of the bypass. Accidents would be reduced for southbound traffic on the bypass by providing improved warning or a more gradual crossover at the north end of the facility in section 6-7. Accidents would also be reduced in section 1-2 by providing a left turning lane at Alto Road. For the final phase of the accident analysis the accidents were classified by type as follows: (3) Type I Intersection accidents which occur at the crossing of two traffic streams. These accidents are typically right- angle, turning, and rear-end collisions. Type II Marginal accidents which occur along the moving edge of a traffic stream. These accidents result from vehicles attempting to enter or leave the traffic stream. Typical accidents are rear-end and access collisions.

12 253 Fig. 9. Bypass divided into six sections.


13 254 Type III Medial accidents which occur between vehicles moving in opposite directions. Head-on collisions and side-swipes are typical accidents of this type. Type IV Interstream accidents which occur among vehicles moving in the same direction. These include such miscellaneous accidents as running off the road, overturning, and some rear-end collisions. This type of accident will occur on any facility. Fig. 10. Number of accidents by type and year. Figure 10 illustrates the accident trend by type from 1957 through 1964 for the Kokomo Bypass. The most pronounced increase is in the type I accident. Type III accidents have decreased since the facility was reconstructed into a four-lane divided facility. Because types I and II accidents are virtually eliminated on a controlled access facility with grade separations, an economic analysis was conducted to determine the loss to the motorist because the facility was not of the controlled access type. Another way to visualize this approach is to ask: How much additional money could have been spent economically in 1950 for a controlled access facility which would have eliminated types I and II accidents. The assumptions and results are presented in Table 1. It is clear that at least an additional $469,000 could have been spent in 1950 for the purchase and construction of full access control.


14 255 Land Use With the variety of development that occurs along a new facility it is frequently difficult to determine which developments are a result of the new route and which would have been present had the facility not been constructed. Reasons for establishing along the Kokomo Bypass, however, seem to be more clearly defined. Most of the commercial and industrial developments in the vicinity of the bypass either serve the motoring public or are dependent on the accessibility provided by the bypass. Table 1. Present Worth Value for 1950 of Type I and II Accidents Assumptions: 1. Losses include property damage, personal injuries, and deaths attributed to vehicle accidents. 2. Yearly losses have been converted to 1950 present worth values. 3. Interest rate was assumed to be four percent. Year 1950 Present W orth Value 1953-June 1957* $192, (1/2 year) 15, , , , , , , ( 1/2 year) 20,208 Total $469,036 * From Reference 18 converted to 1950 present worth value. Values for each year were not available. Land use patterns were compiled from 1938 to 1964 to more clearly portray the land use changes within one mile of the bypass (see Figures 11 through 15). Prior to the construction of the bypass the area was predominantly agricultural. During and after the construction of the Kokomo Bypass, businessmen began exploiting the economic possibilities which the bypass was certain to provide. The development adjacent to the bypass includes industrial, commercial, and residential establishments. The growth of commercial establishments adjacent to the bypass from 1951 to 1964 has been especially significant and is presented in Table 2. Much of Kokomo s

15 256 Fig. 11. Land use of bypass area, Kokomo, Indiana 1938.

16 257 Fig. 12. Land use of bypass area, Kokomo, Indiana 1948.

17 258 Fig. 13. Land use of bypass area, Kokomo, Indiana 1951.

18 259 Fig. 14. Land use of bypass area, Kokomo, Indiana 1957.

19 260 Fig. 15. Land use of bypass area, Kokomo, Indiana 1964.


20 261 new development is continuing to occur east of the city in the vicinity of the bypass. Land Value After the location of a new highway has been determined, one of the first problems is that of purchasing right-of-way for the improvement. Many controversies naturally arise with respect to the degree of damage which a new highway will have on the surrounding area. Some have felt that the property owner often suffers a loss while others insist that the owner usually receives a substantial enhancement in property value. In order to provide information for answers to the above question, land value data were collected from the Auditor and Recorder Offices in the Howard County Courthouse. After the land value data were collected, it was stratified into five bands by location of the land with respect to the bypass. Each band was one mile in width (see Figure 16). Table 2. Establishments Adjacent to the Kokomo Bypass Motels and M otor Lodges Restaurants and Drive-ins Service Stations Used Car Lots Retail Outlets 1 3 Grocery and Fruit Stands 1 1 Garages 2 3 Mobile Home Sales Lots 2 Repair Shops Shopping Centers 1 Fire Stations 1 Office Buildings 3 Hospitals 1 Car-Washes 1 Laundries 1 Industries 2 5 Total Figure 17 shows the results of the land value analysis. Band 1 includes the land on the west side of Kokomo and is in a comparable location as is the bypass area on the east. It might reasonably be considered a control for suburban land values at Kokomo as it was not influenced by a highway improvement.

21 262 Fig. 16. Land value bands parallel to the bypass. Land in band II, which includes the central portion of Kokomo, did not increase in value in the period from 1951 to 1956 as much as land in band I, the suburban area, but the increase in value from 1957 through 1963 was much greater. This increase in land value in the central portion of the city after 1956 may have been due to improved


22 263 Fig. 17. Mean value per acre of land along Kokomo Bypass. economic conditions in the city and to exploitation by businessmen of areas along old U.S. 31. Land in band III has been in the highest demand. This illustrates the fact that in the period much of Kokomo s new development has located between the bypass and the city. The accessibility provided by the bypass and availability of utilities were, with little doubt, primary reasons for these developments. Band IV, the land east of and adjacent to the bypass, shows a less pronounced increase in property value from 1951 to the present than that experienced by land in band III. This is probably due to the necessarily higher costs of providing utilities to this area, and also because this area is not as accessible to the developed area of Kokomo. Band V, the land more than one mile east of the bypass shows the steady increase of rural land values in Howard County and possibly has not yet been affected by this highway improvement. From Figure 17 it is concluded that the bypass has had a positive economic effect on land values within one mile of the bypass. This economic impact is affected by the distance from the bypass and by the location of the already developed areas of the city. A study of nine selected properties which were partially taken for the right-of-way for the Kokomo Bypass revealed that the remainder parcels were usually enhanced in value. This study showed that the greatest enhancement of land occurred when it changed from one use


23 264 to another, as from agricultural to industrial. A further finding was that land value enhancement continued for many years following the completion of the highway improvement. Summary of Findings 1. Travel volumes on the Kokomo Bypass increased three to five fold from 1951 to In the years from 1951 to 1964 traffic volumes increased considerably on streets intersecting the Kokomo Bypass. This created considerable congestion and delay and increased the probability of accidents. 3. The number of accidents on the Kokomo Bypass has continually increased even after its reconstruction to a four-lane divided facility in 1960 for much of its length. 4. An accident spot map gives a poor measure of the degree of hazard at an intersection. The number of accidents at an intersection does not indicate hazard unless it is correlated with the traffic volume for that intersection. 5. Travel time required to traverse the city route (old U.S. 31) has increased only slightly from 1951 through Travel time required to traverse the U.S. 31 Bypass has increased slightly from 1951 through This slight increase in travel time, however, was possible only because the route was reconstructed to a 4-lane divided facility from the initial 2-lane road. 7. Delays on the bypass because of the four railroad crossings at grade were very minor. 8. T w o incompatible motorist groups travel on the bypass. These groups are local (Howard County) and non-local (non-howard County) drivers. An analysis showed that there was a significant difference in speeds driven by the two groups of drivers with the local drivers traveling at a significantly lower rate of speed. It is probable that this variability in speed is a major contributor to vehicular accidents. 9. If the bypass had been constructed as a controlled access facility with grade separations in 1950, an accident loss of $469,000 (1950 present worth value of accidents 1953-June 1954) probably would not have occurred. 10. The economic loss of travel time to motorists on the Kokomo Bypass was compared with a fictitious Kokomo Bypass of the freeway design. The value of the additional travel time required by motorists to traverse the bypass in one year, 1964,

 increased slowly following the construction of the Kokomo Bypass. After 1956, however, land values in the vicinity of the old city route increased substantially.")
24 265 was evaluated at $270,000 because the bypass facility was not of freeway design. 11. The Kokomo Bypass has had a pronounced effect on the location of new development at Kokomo. The major growth of Kokomo has been to the east in the vicinity of the bypass. 12. Land values adjacent to the bypass increased at a faster rate than land values in any other portion of the Kokomo area. 13. Land values along the city route (old U.S. 31) increased slowly following the construction of the Kokomo Bypass. After 1956, however, land values in the vicinity of the old city route increased substantially. It is therefore concluded that for the long term, the bypass did not have a detrimental effect on property values along the old city route. 14. From a remainder parcel analysis it was concluded that many of the property owners who had land taken for the right-of-way of the highway improvement received sizeable enhancements before they sold the remainder parcels. 15. Land adjacent to the bypass which was converted from one use to another showed the largest increases in value. 16. From several cases, studies, the land value of property adjacent References to the bypass was found to have increased significantly with time. 1. Bureau of Census, Indiana, United States Department of Commerce. 2. Evans, Eugene G., Traffic Speed Study, December, 1954, (Unpublished Report of Joint Highway Research Project). 3. Halsey, Maxwell, Highway Economics and Design Principles, American Road Builders Association, Bulletin 67, Chicago, Illinois, January, Michael, Harold L., Traffic and Engineering Report of the Before and After Surveys of the Kokomo Bypass, September, 1951, (Unpublished Report of Joint Highway Research Project). 5. Norden, Monroe, Orlansky, Jesse, and Jacob Herbert Application of Statistical Quality Control Techniques to Analysis of Highway Accident Data, Statistical Analysis of Highway Accidents, Highway Research Board, Bulletin 117, Prisk, Charles W., Can Highway Accidents Be Reduced? Proceedings of the Fiftieth Purdue Road School, American Association of State Highway Officials, Road User Benefit Analysis for Highway Improvement, 1960.
At-Grade Intersections versus Grade-Separated Interchanges (An Economic Analysis of Several Bypasses)
") Transportation Kentucky Transportation Center Research Report University of Kentucky Year 1975 At-Grade Intersections versus Grade-Separated Interchanges (An Economic Analysis of Several Bypasses) Kenneth
Transportation Kentucky Transportation Center Research Report University of Kentucky Year 1975 At-Grade Intersections versus Grade-Separated Interchanges (An Economic Analysis of Several Bypasses) Kenneth
Chapter 4 Traffic Analysis
 Chapter 4 Traffic Analysis PURPOSE The traffic analysis component of the K-68 Corridor Management Plan incorporates information on the existing transportation network, such as traffic volumes and intersection
JONESBORO HIGHWAY 63 HIGHWAY 18 CONNECTOR STUDY
 JONESBORO HIGHWAY 63 HIGHWAY 18 CONNECTOR STUDY Craighead County May 2007 JONESBORO HIGHWAY 63 HIGHWAY 18 CONNECTOR STUDY Craighead County May 2007 Prepared by Planning and Research Division Arkansas State
An Analysis of the Travel Conditions on the U. S. 52 Bypass. Bypass in Lafayette, Indiana.
 An Analysis of the Travel Conditions on the U. S. 52 Bypass in Lafayette, Indiana T. B. T readway Research Assistant J. C. O ppenlander Research Engineer Joint Highway Research Project Purdue University
91
 90 91 92 93 94 95 96 97 98 99 100 101 102 103 104 105 106 As previously depicted in Exhibit 4-J, vehicular accidents are shown along Forrester Road. The contributing factors may be due to its current two
M-58 HIGHWAY ACCESS MANAGEMENT STUDY Mullen Road to Bel-Ray Boulevard. Prepared for CITY OF BELTON. May 2016
 M-58 HIGHWAY ACCESS MANAGEMENT STUDY Prepared for CITY OF BELTON By May 2016 Introduction Missouri State Highway 58 (M-58 Highway) is a major commercial corridor in the City of Belton. As development has
Traffic Accident Data Processing
 Traffic Accident Data Processing D o n a l d F. P e t t y Engineer of Traffic Research and Surveys Indiana State Highway Commission The following is a portion of the Highway Safety Program Standards developed
CHAPTER 4: IDENTIFICATION OF ROAD SYSTEM DEFICIENCIES: TRANSPORTATION PLANNING MODEL
 CHAPTER 4: IDENTIFICATION OF ROAD SYSTEM DEFICIENCIES: TRANSPORTATION PLANNING MODEL I. INTRODUCTION Transportation planning models are the primary tools used to predict future travel conditions. With
Mobility and Congestion
 Technical Memorandum Mobility and Congestion Prepared for: Prepared by: September 25, 2013 1 Table of Contents 1. Introduction... 1 2. Congestion Forecasting Process... 1 2.1 Mobility and Congestion Terms...
Existing Conditions. Date: April 16 th, Dan Holderness; Coralville City Engineer Scott Larson; Coralville Assistant City Engineer
 Date: April 16 th, 2015 To: From: Re: Dan Holderness; Coralville City Engineer Scott Larson; Coralville Assistant City Engineer Darian Nagle-Gamm, Traffic Engineering Planner Highway 6 (2 nd Street) /
A plan for improved motor vehicle access on Railroad Avenue in Provincetown
 A plan for improved motor vehicle access on Railroad Avenue in Provincetown February 2011 A plan for improved motor vehicle access on Railroad Avenue in Provincetown INTRODUCTION AND PROBLEM IDENTIFICATION
An Analysis of Traffic Accidents on a High-Volume Highway
 An Analysis of Traffic Accidents on a High-Volume Highway A. O. P eterson Research Assistant and H. L. M ic h a e l Associate Director Joint Highway Research Project Purdue University IN T R O D U C T
1.3.4 CHARACTERISTICS OF CLASSIFICATIONS
 Geometric Design Guide for Canadian Roads 1.3.4 CHARACTERISTICS OF CLASSIFICATIONS The principal characteristics of each of the six groups of road classifications are described by the following figure
SETTINGS AND OPPORTUNITIES MOBILITY & ACCESS
 7 mobility & access how do people use el camino what is it like to drive on el camino/to park along el camino what is the pedestrian experience like what is the role of transit along the corridor what
#!! "$% ##! &! # '#! % $ #!
 Executive Summary US Highway 16 (US 16) is the primary corridor connecting Rapid City to the Black Hills region. It serves a growing population of commercial and residential traffic, as well as seasonal
Traffic Impact Analysis Chatham County Grocery Chatham County, NC
 Chatham County Grocery Chatham County, NC TABLE OF CONTENTS 1. INTRODUCTION... 1 1.1. Location and Study Area... 1 1.2. Proposed Land Use and Access... 2 1.3. Adjacent Land Uses... 2 1.4. Existing ways...
Access Location, Spacing, Turn Lanes, and Medians
 Design Manual Chapter 5 - Roadway Design 5L - Access Management 5L-3 Access Location, Spacing, Turn Lanes, and Medians This section addresses access location, spacing, turn lane and median needs, including
Regional Transportation Needs Within Southeastern Wisconsin
 Regional Transportation Needs Within Southeastern Wisconsin #118274 May 24, 2006 1 Introduction The Southeastern Wisconsin Regional Planning Commission (SEWRPC) is the official areawide planning agency
METHODOLOGY. Signalized Intersection Average Control Delay (sec/veh)
") Chapter 5 Traffic Analysis 5.1 SUMMARY US /West 6 th Street assumes a unique role in the Lawrence Douglas County transportation system. This principal arterial street currently conveys commuter traffic
Chapter 5 Traffic Analysis 5.1 SUMMARY US /West 6 th Street assumes a unique role in the Lawrence Douglas County transportation system. This principal arterial street currently conveys commuter traffic
Congestion Management Report
 Congestion Management Report F.E. EVERETT TURNPIKE (NORTH), MERRIMACK Segment Length: 7.0 miles Daily Traffic Volumes: 60,000-69,000 Analysis Period: May 2015 Number of Traffic Signals: 0 Number of travel
Crash Patterns in Western Australia. Kidd B., Main Roads Western Australia Willett P., Traffic Research Services
 Crash Patterns in Western Australia Kidd B., Main Roads Western Australia Willett P., Traffic Research Services Abstract Examination of crash patterns is one way of identifying key factors on which focus
An Analysis of High Accident Rates
 An Analysis of High Accident Rates H. H. B l in d a u e r, Graduate Assistant and H. L. M ic h a e l, Assistant Director Joint Highway Research Project Purdue University W ith the advent of the automobile
Highway 49, Highway 351 and Highway 91 Improvements Feasibility Study Craighead County
 Highway 49, Highway 351 and Highway 91 Improvements Feasibility Study Craighead County Executive Summary March 2015 Highway 49, Highway 351 and Highway 91 Improvements Feasibility Study Craighead County
MUTCD Part 6G: Type of Temporary Traffic Control Zone Activities
 MUTCD Part 6G: Type of Temporary Traffic Control Zone Activities 6G.01 Typical Applications Each temporary traffic control (TTC) zone is different. Many variables, such as location of work, highway type,
City of Wayzata Comprehensive Plan 2030 Transportation Chapter: Appendix A
 A1. Functional Classification Table A-1 illustrates the Metropolitan Council s detailed criteria established for the functional classification of roadways within the Twin Cities Metropolitan Area. Table
Recommended Roadway Plan Section 2 - Land Development and Roadway Access
 Recommended Roadway Plan Section 2 - Land Development and Roadway Access SECTION 2 Land Development and Roadway Access 2.1 Land Use and Access Management The Federal Highway Administration (FHWA) defines
Safety Impacts: Presentation Overview
 Safety Impacts: Presentation Overview The #1 Theme How Access Management Improves Safety Conflict Points The Science of Access Management By Treatment Studies Themes for Texas Access Management Improve
Parks Highway: MP Lucus Road to Big Lake Road
 2 Purpose and Need 2.1 Corridor History The Parks Highway is a 324-mile long Rural Interstate Highway that extends from its intersection with the Glenn Highway north to Fairbanks, Alaska. The Parks Highway
Deaths/injuries in motor vehicle crashes per million hours spent travelling, July 2007 June 2011 (All ages) Mode of travel
 Mode of travel") Cyclists CRASH STATISTICS FOR THE YEAR ENDED 31 DECEMBER 211 Prepared by the Ministry of Transport CRASH FACTSHEET 212 Cyclists have a number of risk factors that do not affect car drivers. The main risk
Cyclists CRASH STATISTICS FOR THE YEAR ENDED 31 DECEMBER 211 Prepared by the Ministry of Transport CRASH FACTSHEET 212 Cyclists have a number of risk factors that do not affect car drivers. The main risk
EXISTING (2006) CONDITIONS
 CONDITIONS") Section 2 EXISTING (2006) CONDITIONS This section provides a description of the existing transportation system in the study area and a comprehensive analysis of existing traffic operations and crash history.
Section 2 EXISTING (2006) CONDITIONS This section provides a description of the existing transportation system in the study area and a comprehensive analysis of existing traffic operations and crash history.
Welcome! San Jose Avenue Open House August 25, 2015
 Welcome! San Jose Avenue Open House August 25, 2015 Vision Zero The City and County of San Francisco adopted Vision Zero San Francisco Vision Zero High Injury Network as a policy in 2014, committing an
Northbound San Jose Avenue & I-280 Off-Ramp Road Diet Pilot Project
 Project Overview Fed by a two-lane Interstate-280 (I-280) off-ramp, high vehicular volumes and speeds are longstanding issues along San Jose Avenue. Residents in the surrounding neighborhoods have expressed
Corporate. Report COUNCIL DATE: May 25, 1998 NO: R1500 REGULAR COUNCIL. TO: Mayor & Council DATE: April 27, 1998
 R1500 : Traffic Safety at 25 Avenue and 128 Street Intersection Corporate NO: R1500 Report COUNCIL DATE: May 25, 1998 REGULAR COUNCIL TO: Mayor & Council DATE: April 27, 1998 FROM: General Manager, Engineering
ENHANCED PARKWAY STUDY: PHASE 2 CONTINUOUS FLOW INTERSECTIONS. Final Report
 Preparedby: ENHANCED PARKWAY STUDY: PHASE 2 CONTINUOUS FLOW INTERSECTIONS Final Report Prepared for Maricopa County Department of Transportation Prepared by TABLE OF CONTENTS Page EXECUTIVE SUMMARY ES-1
Use of Acceleration-Deceleration Lanes
 Use of Acceleration-Deceleration Lanes INTRODUCTION N eddy C. J ouzy, Graduate Assistant and Harold L. M ichael, Assistant Director Joint Highway Research Project Purdue University On the basis of various
A Study of School Crossing Protection
 A Study of School Crossing Protection F. D. M iller, Traffic Engineer St. Louis County, Missouri H. L. M ichael, Associate Director Joint Highway Research Project IN TR O D U C TIO N The problem of providing
New Seward and 36 th Avenue Intersection Conceptual Design
 University of Alaska Anchorage New Seward and 36 th Avenue Intersection Conceptual Design Prepared By: Zaid S. Hussein Dana Menendez Galen Jones Civil Engineering Department Prof. Osama Abaza CE A404 Highway
INTRODUCTION THOROUGHFARE SYSTEM CLASSIFICATIONS
 INTRODUCTION The thoroughfare plan will assist public officials in the development of a specialized system for efficient and safe movement of vehicular traffic while minimizing potential conflicts with
Unit 7 Speed, Travel Time and Delay Studies
 Unit 7 Speed, Travel Time and Delay Studies Introduction Speed, travel time and delay are all related measures that are common used as indicators of performance for traffic facilities Measure of Effectiveness
DEPARTMENT OF ENVIRONMENTAL SERVICES. North Harrison Street (Lee Highway to Little Falls Road) Comparative Analysis. Prepared for:
 Comparative Analysis. Prepared for:") DEPARTMENT OF ENVIRONMENTAL SERVICES North Harrison Street (Lee Highway to Little Falls Road) Comparative Analysis Prepared for: Arlington County Department of Environmental Services 2100 Clarendon Boulevard,
DEPARTMENT OF ENVIRONMENTAL SERVICES North Harrison Street (Lee Highway to Little Falls Road) Comparative Analysis Prepared for: Arlington County Department of Environmental Services 2100 Clarendon Boulevard,
3.0 Future Conditions
 3.0 Future Conditions In order to be able to recommend appropriate improvements to the transportation system of the Town, it is important to first understand the nature and volume of traffic that is expected
4.0 IDENTIFICATION OF DEFICIENCIES
 4.0 IDENTIFICATION OF DEFICIENCIES 4.1 PERFORMANCE MEASURES AND RESULTS OF ANALYSIS 4.1.1 Roadway Safety As documented in Chapter 3, there were four key factors that were used to analyze the occurrence
LYNNWOOD ROAD ARTERIAL STUDY The effect of intersection spacing on arterial operation
 LYNNWOOD ROAD ARTERIAL STUDY The effect of intersection spacing on arterial operation A J Joubert*, S L Burnett**, and T Ueckermann* *PWV Consortium, PO Box 1109, Sunninghill 2157 **Gautrans, Gauteng Department
CROSSING GUARD PLACEMENT CONSIDERATIONS AND GAP ASSESSMENT
 CROSSING GUARD PLACEMENT CONSIDERATIONS AND GAP ASSESSMENT Many factors contribute to the need for a Crossing Guard. General federal guidance, provided by the FHWA MUTCD, states that adult crossing guards
Defining Purpose and Need
 Advanced Design Flexibility Pilot Workshop Session 4 Jack Broz, PE, HR Green May 5-6, 2010 Defining Purpose and Need In your agency s project development process, when do design engineers typically get
EXECUTIVE SUMMARY OF CALEDON TRANSPORTATION NEEDS STUDY
 EXECUTIVE SUMMARY OF CALEDON TRANSPORTATION NEEDS STUDY The Caledon Transportation Needs Study has been undertaken as a joint project by the Town of Caledon and the Region of Peel to determine the existing
Overview. Existing Conditions. Corridor Description. Assessment
 Overview A study of the 23 rd Street corridor was undertaken to document the existing conditions, analyze traffic operations, and recommend remedies for deficient situations Although 23 rd Street is frequently
University Hill Transportation Study Technical Memorandum Alternatives Modeling and Analysis May 2007
 Technical Memorandum May 2007 Syracuse Metropolitan Transportation Council Edwards and Kelcey with Wallace Roberts and Todd Alta Planning and Design CONTENTS SECTION ONE- INTRODUCTION...1 SECTION TWO-
3 ROADWAYS 3.1 CMS ROADWAY NETWORK 3.2 TRAVEL-TIME-BASED PERFORMANCE MEASURES Roadway Travel Time Measures
 ROADWAYS Approximately 6 million trips are made in the Boston metropolitan region every day. The vast majority of these trips (80 to percent, depending on trip type) involve the use of the roadway network
Truck Climbing Lane Traffic Justification Report
 ROUTE 7 (HARRY BYRD HIGHWAY) WESTBOUND FROM WEST MARKET STREET TO ROUTE 9 (CHARLES TOWN PIKE) Truck Climbing Lane Traffic Justification Report Project No. 6007-053-133, P 101 Ι UPC No. 58599 Prepared by:
Evaluation of M-99 (Broad Street) Road Diet and Intersection Operational Investigation
 Road Diet and Intersection Operational Investigation") Evaluation of M-99 (Broad Street) Road Diet and Intersection Operational Investigation City of Hillsdale, Hillsdale County, Michigan June 16, 2016 Final Report Prepared for City of Hillsdale 97 North Broad
Evaluation of M-99 (Broad Street) Road Diet and Intersection Operational Investigation City of Hillsdale, Hillsdale County, Michigan June 16, 2016 Final Report Prepared for City of Hillsdale 97 North Broad
5858 N COLLEGE, LLC N College Avenue Traffic Impact Study
 5858 N COLLEGE, LLC nue Traffic Impact Study August 22, 2016 Contents Traffic Impact Study Page Preparer Qualifications... 1 Introduction... 2 Existing Roadway Conditions... 5 Existing Traffic Conditions...
CITY OF LUCAS 2014 MASTER THOROUGHFARE PLAN
 INTRODUCTION CITY OF LUCAS 2014 MASTER THOROUGHFARE PLAN A thoroughfare system is intended to provide an effective means of moving vehicles within and through a city. The thoroughfare plan will assist
Functional Classification of Roads and Streets
 Functional Classification of Roads and Streets J o h n E. B a e r w a ld Professor of Transportation and Traffic Engineering Director, Highway Traffic Safety Center University of Illinois, Urbana-Champaign
Focused Traffic Analysis for the 200 Nellen Avenue Project
 March 13, 2017 Mr. Phil Boyle Town of Corte Madera 300 Tamalpais Drive Corte Madera, CA 94976-0159 Focused Traffic Analysis for the 200 Nellen Avenue Project Dear Mr. Boyle; W-Trans has completed a focused
DRAFT BUENA VISTA 2020 TRANSPORTATION PLAN
 DRAFT BUENA VISTA 2020 TRANSPORTATION PLAN DEVELOPED BY THE TRANSPORTATION PLANNING DIVISION OF THE VIRGINIA DEPARTMENT OF TRANSPORTATION IN COOPERATION WITH THE U.S. DEPARTMENT OF TRANSPORTATION, FEDERAL
ORANGE COUNTY PUBLIC WORKS TRAFFIC INVESTIGATIONS
 ORANGE COUNTY PUBLIC WORKS TRAFFIC INVESTIGATIONS STAFF REPORT OF: January 6, 2019 SUPERVISORIAL DISTRICT: 5 SUBJECT: LOCATION: INVESTIGATOR: O Neill Drive at Roanoke Drive; Ladera Ranch; TB 922-E6 Clever
Cheyenne Metropolitan Planning Organization
 Dell Range Boulevard Corridor Study PHASE II SECTION 20 DRAFT Prepared for: Cheyenne Metropolitan Planning Organization November 20, 2015 (Section 20 is bordered by Powderhouse Road on the west, Storey
Traffic Impact Study. Westlake Elementary School Westlake, Ohio. TMS Engineers, Inc. June 5, 2017
 TMS Engineers, Inc. Traffic Impact Study Westlake Elementary School Westlake, Ohio June 5, 2017 Prepared for: Westlake City Schools - Board of Education 27200 Hilliard Boulevard Westlake, OH 44145 TRAFFIC
Roundabouts and Access Management
 Roundabouts and Access Management ABSTRACT This paper discusses the implementation of a series of four roundabouts on a suburban arterial serving a strip commercial area. The project is located on South
INTERSECTIONS AT GRADE INTERSECTIONS
 INTERSECTIONS 1 AT GRADE INTERSECTIONS INTERSECTIONS INTERSECTIONS = INTERRUPTED FACILITIES Definitions and key elements An intersection is defined as an area where two or more roadways join or cross.
Congestion Management Report
 Congestion Management Report DANIEL WEBSTER HIGHWAY, MERRIMACK Segment Length: 9.9 miles Daily Traffic Volumes: 13,000-21,000 Analysis Period: July August 2015 Number of Traffic Signals: 14 Number of travel
Highway 217 Corridor Study. Phase I Overview Report
 Highway 217 Corridor Study Phase I Overview Report November 3, 24 BACKGROUND AND OVERVIEW Study purpose The Highway 217 Corridor Study is developing multi-modal transportation solutions for traffic problems
25th Avenue Road Diet Project A One Year Evaluation. Transportation Fund for Clean Air Project #05R07
 25th Avenue Road Diet Project A One Year Evaluation Transportation Fund for Clean Air Project #05R07 Submitted by: The San Francisco Municipal Transportation Agency Dan Provence May 22, 2009 EXECUTIVE
CHAPTER 7 ACCESS MANAGEMENT. Background. Principles of Access Management. Hennepin County Transportation Systems Plan (HC-TSP)
") CHAPTER 7 ACCESS MANAGEMENT Background Principles of Access Management Hennepin County Transportation Systems Plan (HC-TSP) Chapter 7 Access Management 7.1 Background Access management has become an important
CHAPTER 7 ACCESS MANAGEMENT Background Principles of Access Management Hennepin County Transportation Systems Plan (HC-TSP) Chapter 7 Access Management 7.1 Background Access management has become an important
THE I-79 CORRIDOR. I-79 provides motorists with connections to the following major highways: I-80, PA 358, PA 965 and PA 208.
 The I-79 Corridor Pittsburgh to Erie Regional Thruway I-79 was constructed through Mercer County in the early 1960s. The portion north of PA 965 opened in 1961 and the segment south of PA 965 the following
City of Homewood Transportation Plan
 City of Homewood Transportation Plan Prepared for: City of Homewood, Alabama Prepared by: Skipper Consulting, Inc. May 2007 TABLE OF CONTENTS INTRODUCTION... 1 BACKGROUND INFORMATION... 1 EXISTING TRANSPORTATION
Congestion Evaluation Best Practices
 Congestion Evaluation Best Practices Todd Litman Victoria Transport Policy Institute Presented International Transportation and Economic Development Conference 10 April 2014 Congestion Indicators Indicator
CHAPTER 7 CIRCULATION
 CHAPTER 7 CIRCULATION A township s transportation network links its population with the surrounding communities. Transportation networks, including public and private, provide the means by which township
Bicycle - Motor Vehicle Collisions on Controlled Access Highways in Arizona
 Bicycle - Motor Vehicle Collisions on Controlled Access Highways in Arizona Analysis from January 1, 1991 to June 30, 2002 Richard C. Moeur, PE Traffic Design Manager, Northern Region Michelle N. Bina
ITARDA INFORMATION. No.128. Special feature
 ITARDA INFORMATION No.128 Special feature Special feature Accidents when four-wheel vehicles are reversing ~ Drivers must thoroughly check behind them, especially in parking lots! ~ Introduction You may
ANALYSIS OF SIGNALISED INTERSECTIONS ACCORDING TO THE HIGHWAY CAPACITY MANUAL FROM THE POINT OF VIEW OF THE PROCESSES APPLIED IN HUNGARY
 2nd Int. Symposium in Civil Engineering 1998 Budapest ANALYSIS OF SIGNALISED INTERSECTIONS ACCORDING TO THE HIGHWAY CAPACITY MANUAL FROM THE POINT OF VIEW OF THE PROCESSES APPLIED IN HUNGARY István Styevola
Traffic Impact Analysis Walton Acres at Riverwood Athletic Club Clayton, NC
 Traffic Impact Analysis Walton Acres at Riverwood Athletic Club Clayton, NC 1. TABLE OF CONTENTS INTRODUCTION...1 1.1. Site Location and Study Area...1 1.2. Proposed Land Use and Site Access...2 1.3.
3.0 ACCESS CONTROL PLAN - HARMONY ROAD (SH68)
") 3.0 ACCESS CONTROL PLAN - HARMONY ROAD (SH68) 3.1 Existing Conditions Roadway Physical Characteristics Typical Section The existing typical cross-section for SH68 is shown on Figure 3-1 and is comprised
3.0 ACCESS CONTROL PLAN - HARMONY ROAD (SH68) 3.1 Existing Conditions Roadway Physical Characteristics Typical Section The existing typical cross-section for SH68 is shown on Figure 3-1 and is comprised
Management of Multi-Lane Highways in Jordan (Case Study)
") Management of Multi-Lane Highways in Jordan (Case Study) Basim Jrew 1), Nidal Hussein 2) and Rami Al-Kouz 3) 1) Isra University, Jordan. E-Mail: basim.jrew@iu.edu.jo 2) Isra University, Jordan. E-Mail:
Management of Multi-Lane Highways in Jordan (Case Study) Basim Jrew 1), Nidal Hussein 2) and Rami Al-Kouz 3) 1) Isra University, Jordan. E-Mail: basim.jrew@iu.edu.jo 2) Isra University, Jordan. E-Mail:
MUNICIPALITY OF ANCHORAGE Traffic Department MEMORANDUM
 MUNICIPALITY OF ANCHORAGE DATE: MEMORANDUM TO: FROM: SUBJECT: Anchorage Contractors, Builders, Designers, and Land Owners Robert E. Kniefel, P.E., Municipal Traffic Engineer Municipal Driveway Standards
Purpose and Need. Chapter Introduction. 2.2 Project Purpose and Need Project Purpose Project Need
 Chapter 2 Purpose and Need 2.1 Introduction The El Camino Real Bus Rapid Transit (BRT) Project (Project) would make transit and other transportation improvements along a 17.6-mile segment of the El Camino
Grade Separated Intersection
 Grade Separated Intersection Lecture Notes in Transportation Systems Engineering Prof. Tom V. Mathew Contents 1 Overview 1 2 Classification of Intersection 2 2.1 Grade Separated Intersection...........................
Speed Reduction in School Zones
 Transportation Kentucky Transportation Center Research Report University of Kentucky Year 1976 Speed Reduction in School Zones Charles V. Zegeer James H. Havens Robert C. Deen Kentucky Department of Transportation
o n - m o t o r i z e d transportation is an overlooked element that can greatly enhance the overall quality of life for the community s residents.
 N o n - m o t o r i z e d transportation is an overlooked element that can greatly enhance the overall quality of life for the community s residents. 84 Transportation CHAPTER 11 INTRODUCTION Transportation
(HIGHWAY GEOMETRIC DESIGN -1)
") LECTURE HOUR-19 TE-1(10CV56) UNIT-3 (HIGHWAY GEOMETRIC DESIGN -1) Width of carriage way: Width of the carriage way or the width of the pavement depends on the width of the traffic lane and number of lanes.
LECTURE HOUR-19 TE-1(10CV56) UNIT-3 (HIGHWAY GEOMETRIC DESIGN -1) Width of carriage way: Width of the carriage way or the width of the pavement depends on the width of the traffic lane and number of lanes.
TRANSPORTATION ANALYSIS REPORT US Route 6 Huron, Erie County, Ohio
 TRANSPORTATION ANALYSIS REPORT US Route 6 Huron, Erie County, Ohio December 12, 2012 Prepared for: The City of Huron 417 Main Huron, OH 44839 Providing Practical Experience Technical Excellence and Client
the Ministry of Transport is attributed as the source of the material
 Cyclists 2015 Disclaimer All reasonable endeavours are made to ensure the accuracy of the information in this report. However, the information is provided without warranties of any kind including accuracy,
Geometric Categories as Intersection Safety Evaluation Tools
 Geometric Categories as Intersection Safety Evaluation Tools John R. Campbell Ayres Associates N19 W24075 Riverwood Drive, Suite 300 Waukesha, WI 53188 campbellj@ayresassociates.com Keith K. Knapp Engineering
Basalt Creek Transportation Refinement Plan Recommendations
 Basalt Creek Transportation Refinement Plan Recommendations Introduction The Basalt Creek transportation planning effort analyzed future transportation conditions and evaluated alternative strategies for
Washington St. Corridor Study
 FIGURE 7.17 Bridge Alternatives - Cross Sections 86 Discarded Alternative: Short-Term Bridge Repair Short-term repairs and west bridge span replacement were considered during analysis. Short-term repairs
TRASBURG RANSPORTATION
 TRASBURG RANSPORTATION LAN DEVELOPED BY THE TRANSPORTATION PLANNING DIVISION OF THE VIRGINIA DEPARTMENT OF TRANSPORTATION IN COOPERATION WITH THE U.S. DEPARTMENT OF TRANSPORTATION, FEDERAL HIGHWAY ADMINISTRATION
SELECTED ROADWAY CAPACITY ANALYSIS
 CHAPTERFOUR SELECTED ROADWAY CAPACITY ANALYSIS 4.1 SELECTED ROADWAY CAPACITY ANALYSIS Introduction Capacity analysis was performed on six selected roadways within the Dearborn County study area using the
Technical Memorandum TRAFFIC IMPACT STUDY. RIDLEY ROAD CONVENIENCE STORE Southampton County, VA. Prepared for: Mr. David Williams.
 Technical Memorandum TRFFIC IMPCT STUDY RIDLEY ROD CONVENIENCE STORE Southampton County, V Prepared for: Mr. David Williams By: Charles Smith, P.E., PTOE EPR Charlottesville, V July 2014 1 TBLE OF CONTENTS
Route 7 Corridor Study
 Route 7 Corridor Study Executive Summary Study Area The following report analyzes a segment of the Virginia State Route 7 corridor. The corridor study area, spanning over 5 miles in length, is a multi
Rural Intersection Investigation for the Purpose of Evaluating the General Motors Traffic-Conflicts Technique
 Rural Intersection Investigation for the Purpose of Evaluating the General Motors Traffic-Conflicts Technique R. E. CAMPBELL, Virginia Department of Highways; and L. ELLIS KING, West Virginia University
4. ENVIRONMENTAL IMPACT ANALYSIS 9. TRANSPORTATION AND TRAFFIC
 4. ENVIRONMENTAL IMPACT ANALYSIS 9. TRANSPORTATION AND TRAFFIC 4.9.1 INTRODUCTION The following section addresses the Proposed Project s impact on transportation and traffic based on the Traffic Study
Relative safety of alternative intersection designs
 Urban Transport XII: Urban Transport and the Environment in the 21st Century 379 Relative safety of alternative intersection designs L. C. Wadhwa 1 & M. Thomson 2 1 James Cook University Townsville Queensland
Converting Four-Lane Undivided Roadways to a Three-Lane Cross Section: Factors to Consider By: Keith K. Knapp, Thomas M. Welch, and John A.
 Converting Four-Lane Undivided Roadways to a Three-Lane Cross Section: Factors to Consider By: Keith K. Knapp, Thomas M. Welch, and John A. Witmer INTRODUCTION There are a large number of four-lane undivided
Operation Green Light Traffic Signal Coordination Report North Oak Trafficway - New Mark Drive to NE 42nd Street
 Introduction Operation Green Light Traffic Signal Coordination Report North Oak Trafficway - New Mark Drive to NE 42nd Street Operation Green Light (OGL) is a regional effort to improve traffic flow and
4.0 ACCESS CONTROL PLAN - SH 14 (JEFFERSON STREET/RIVERSIDE AVENUE)
") 4.1 Existing Conditions Roadway Physical Characteristics Typical Sections Jefferson Street 4.0 ACCESS CONTROL PLAN - SH 14 (JEFFERSON STREET/RIVERSIDE AVENUE) The existing typical cross-section for SH
4.1 Existing Conditions Roadway Physical Characteristics Typical Sections Jefferson Street 4.0 ACCESS CONTROL PLAN - SH 14 (JEFFERSON STREET/RIVERSIDE AVENUE) The existing typical cross-section for SH
Gwinnett County Department of Transportation SR 324 / Gravel Springs Road at I-85 / SR 403 Interchange Project Number F , PI No.
 June 4, 2015 Dear Resident: Thank you for attending this public information meeting for the proposed SR 324 / Gravel Springs Road at I-85 Interchange. The purpose of this meeting is two-fold: to provide
Access Management in the Vicinity of Intersections
 Access Management in the Vicinity of Intersections FHWA-SA-10-002 Technical Summary Photo: Ralph Bentley (used with permission) 0 Access Management is: The design, implementation and management of entry
Chapter Twenty-eight SIGHT DISTANCE BUREAU OF LOCAL ROADS AND STREETS MANUAL
 Chapter Twenty-eight SIGHT DISTANCE BUREAU OF LOCAL ROADS AND STREETS MANUAL Jan 2006 SIGHT DISTANCE 28(i) Chapter Twenty-eight SIGHT DISTANCE Table of Contents Section Page 28-1 STOPPING SIGHT DISTANCE
Superstreets. A Tool for Safely and Efficiently Managing Congestion
 Superstreets A Tool for Safely and Efficiently Managing Congestion Prepared for NORTH CAROLINA DEPARTMENT OF TRANSPORTATION TRAFFIC ENGINEERING AND SAFETY SYSTEMS BRANCH Original Superstreet Presentation