Determining bicycle infrastructure preferences A case study of Dublin
|
|
|
- Albert Hancock
- 5 years ago
- Views:
Transcription
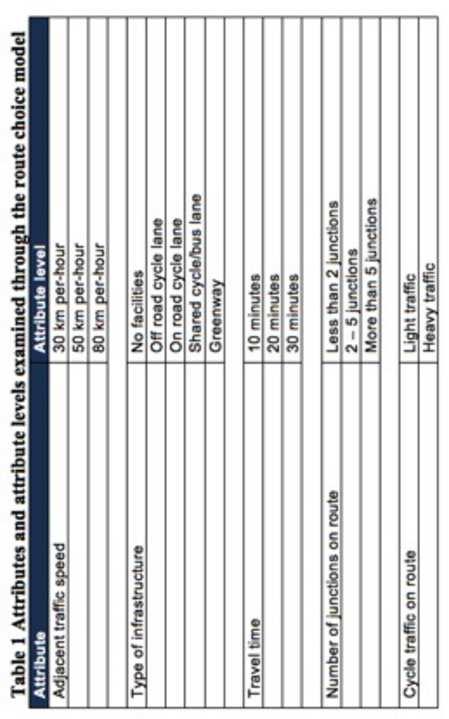
1 *Manuscript Click here to view linked References 1 Determining bicycle infrastructure preferences A case study of Dublin Brian Caulfield 1, Elaine Brick 2, Orla Thérèse McCarthy 1 1 Department of Civil, Structural and Environmental Engineering, Trinity College Dublin, Dublin 2, Ireland 2 AECOM, Grand Canal House, Upper Grand Canal Street, Dublin 4, Ireland Abstract This paper examines infrastructure preferences for cyclists. In Ireland, the Irish National Cycle Policy Framework acknowledges that investment in cycling infrastructure type and quality has been in many cases, inadequate and has, generally, not led to an overall increase in cycling numbers. Therefore, in order to ensure future investment is targeted where it is likely to be most effective in achieving adopted mode share targets for cycling, the following research has been undertaken to determine the factors which most influence cycling route choice. In particular, the research aims to determine the factors, which have greatest influence on cycle route infrastructure preference the correlation between the level of cycling confidence and preferred types of infrastructure and route characteristics. A stated preference survey, undertaken by almost 2,000 cyclists and noncyclists, was used to gauge preferences for a range of infrastructure types and route characteristics. Facilities which were segregated from traffic were the most preferred form of cycling infrastructure, regardless of cycling confidence. Interestingly, routes through residential streets and parks were the second most favoured, where no specific infrastructure is provided with the exception of improvements in way-finding. Routes which offered no facilities were least favoured and least likely to support a shift to cycling. Introduction and background Transport policy across Europe in the past ten years has made a significant shift to sustainable transport objectives and targets which are clearly linked to environmental and economic objectives. In Ireland, Smarter Travel, the National Sustainable Transport Policy marks a significant departure from previous national policies for transport. This plan has a greater focus to strengthening Ireland s road and public transport networks (Department of Transport, 2009a). The strategy highlights the implications of future growth projections on the Irish transport network: increasing car ownership and annual vehicle kilometres travelled, declining average speeds in commuting periods and increasing congestion amidst a decline in walking and cycling modal share. In light of these forecasts, the strategy sets out bold travel targets supported by a 48 actions for implementation, ranging from infrastructure to policy and education measures. The overall target is to reduce work related commuting by car from a current modal share of 65% to 45%. In addition, it is envisaged that total
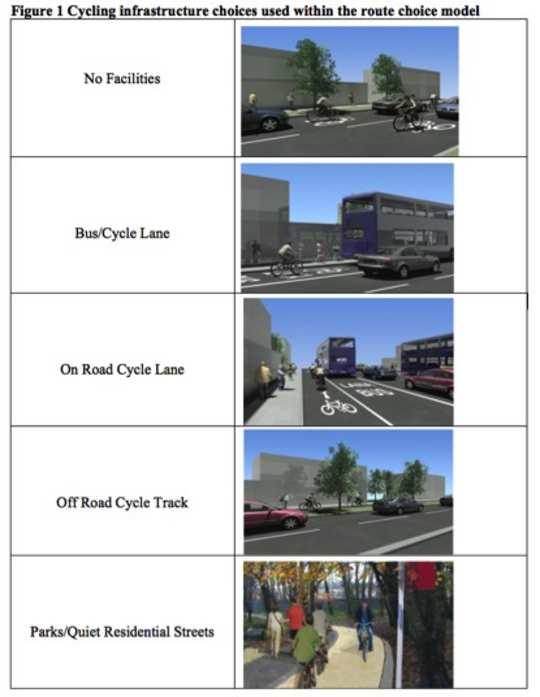
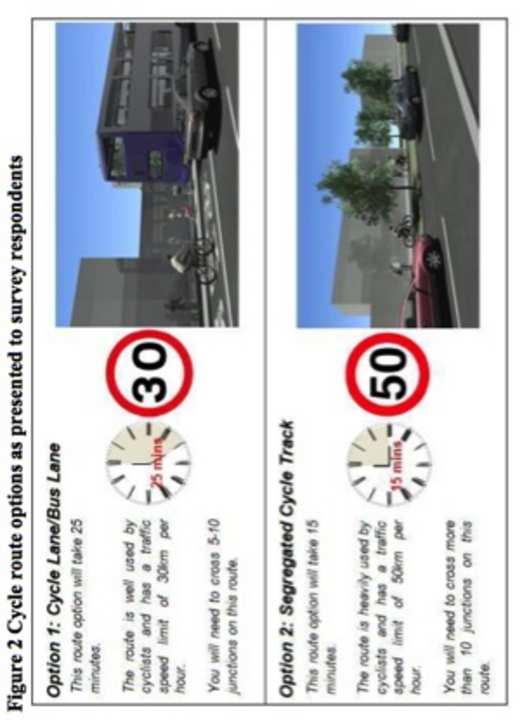
2 2 vehicle kilometres travelled by car will not increase substantially from a 2009 baseline (Department of Transport, 2009a). These targets are challenging and highlight the need for a robust response in terms of policy and investment. The Strategy therefore sets out separate objectives and targets for walking, cycling and public transport. In relation to cycling, the Strategy aims to secure a strong culture of cycling in Ireland and ensure that all cities, towns, villages and rural areas will be cycle-friendly (Department of Transport, 2009a). The strategy envisages that by 2020, 10% of all our trips will be by bike. In relation to commuting, the Strategy envisages that by 2020 cycle trips to work will have increased to 160,000 from a 2006 baseline of 35,000. To encourage delivery of the Smarter Travel vision, the National Cycle Policy Framework was adopted in 2009 (Department of Transport, 2009b). The Framework is clear on the challenges, which lie ahead by acknowledging that investment in cycling infrastructure has been inadequate and has not led to an overall increase in cycling. The Framework presents a robust package of measures classified into the following categories: Planning, Infrastructure, Communication and Education. With regards infrastructure design, the National Cycle Policy Framework also reiterates the need for transportation infrastructure design to be cycle friendly. Cycle friendly routes are defined as those that are deemed to be: safe, direct, coherent, attractive and comfortable. These five criteria frequently form the basis of cycling infrastructure policies internationally and are also identified in the National Cycle Manual (National Transport Authority, 2011) as being the five basic needs of cyclists which should be understood by designers if cycle friendly environments are to be created. Methodology Stated Preference Model The stated preference experiments used for this research included a route choice model which examined 5 key attributes. Table 1 outlines each of the attributes and attribute levels examined. These determinants were proposed on the basis of local knowledge of the local transport network as well as outputs from the literature review. <<INSERT TABLE 1>> The infrastructure options presented are highlighted in Figure 1. These options were based on the five most common cycle route infrastructure types in the Greater Dublin area. <<INSERT FIGURE 1>> A fractional factorial was designed which included two routes each which had the same attributes but differed on the attribute levels. A fractional factorial was designed using the method described in Hensher et al (2005). The fractional factorial design produced 64 scenarios to be evaluated. These scenarios were randomly distributed to 11 versions of the survey, with 10 versions of the survey containing 6 scenarios to evaluate and 1 with 4 scenarios. As the respondents may not be familiar with the variants of cycle lane presented in the scenarios, it was decided to make these scenarios as visual as
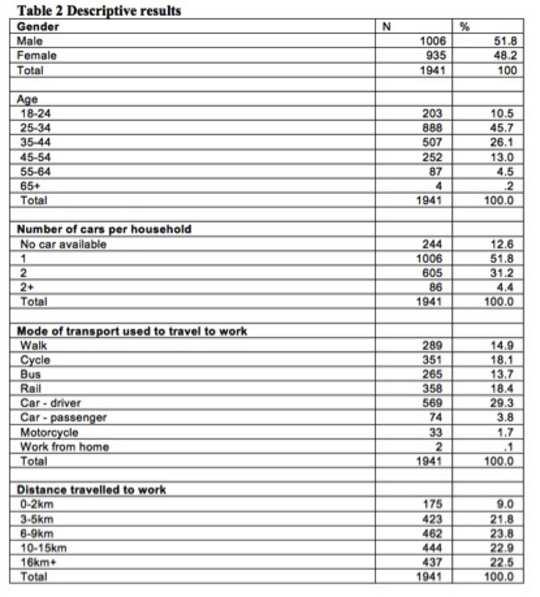
3 3 possible. An example of one of the scenarios is shown in Figure 2. The following text was used to set up the scenarios presented to the respondents. You have started a new job, which is located close to your home. Cycling to work has now become a possibility. Whether you currently cycle to work or not, please consider the following route choices for your trip to work and choose the most preferable route for your journey to work in each instance. <<INSERT FIGURE 2>> A multinomial logit model was used to estimate the impact of each of the attributes presented in Table 1. The model takes the following functional form: U in = X in + in (1) where n represents the route choice option and i represents the individual. X in represents the set of explanatory variables specific to route option n and by individual i. U in is the utility obtained by individual i and ε in is a random error term, which is assumed to be identically and independently distributed using the Gumbel distribution method (Train, 2003). The probability that individual i chooses route n can be expressed as follows: e X in Prob (U in >U jn ) = (e X in + e X jn ) (2) The above equation states that the individual will choose route n over the other route (j) providing the utility that s derived from this route is greater than the alternative route. The models estimated using a maximum likelihood estimation approach (Hensher et al 2005; Train, 2003 or Louviere et al 2000 for more details on this approach). Several models are presented in the next section, some of the models have been segmented by various attributes such as gender, age etc. The models were segmented to provide an indication as to how various characteristics of the respondents impact upon their route choice selection. Data collection The survey was undertaken by 1,941 people employed in businesses participating in the Smarter Travel Workplaces initiative, currently being managed by the Irish National Transport Authority. The businesses are all located within an 8km radius of the city centre. Results Descriptive results Table 2 presents descriptive results of the sample collected. The gender balance of respondents was relatively balanced, 51.8% male and 48.2% female. 45.7% of respondents were in the age group and 26.1% in the age group. 51.8% of the sample was shown to have one car and 31.2% had two cars in their household.
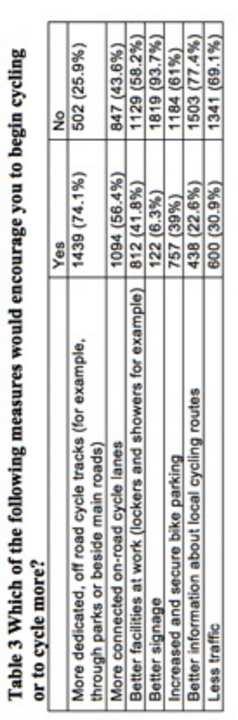
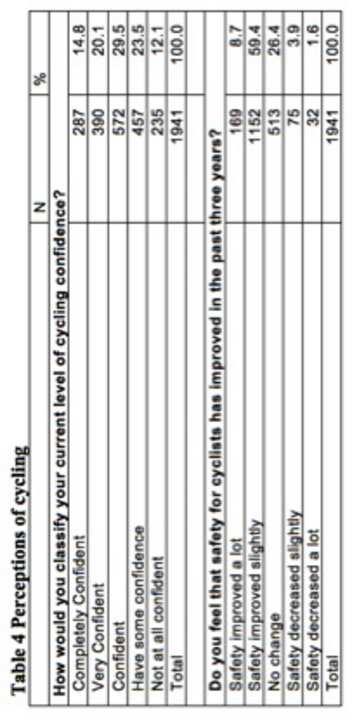
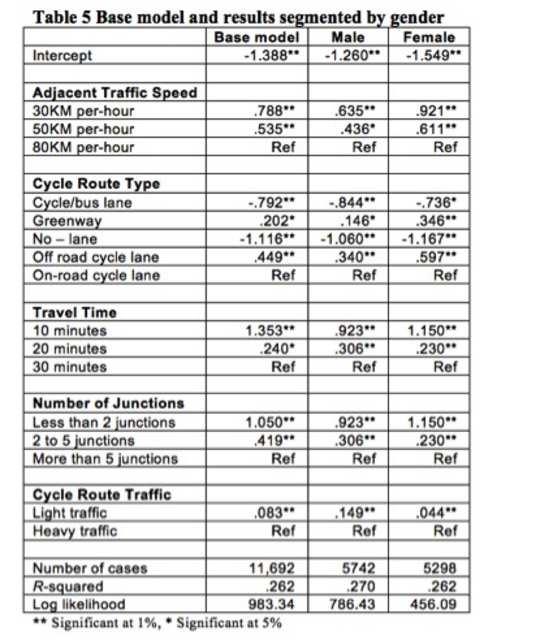
4 4 The results for mode of transport used to travel to work showed that just under 30% of the sample drove alone on a regular basis to work. 14.9% indicated they walked and 18.1% said they cycled to work on a regular basis. The final result presented in Table 2 details the distance travelled to work. 9% travelled less that 2km and 21.8% travelled 3-5km. In terms of how the sample relates to the national population, the gender split was generally representative of the national population. There was a bias in this survey towards those in the working age cohort of In terms of the mode of travel to work, sustainable transport modes are generally better represented. This is due to the fact that the survey respondents were generally living in the Dublin urban area where there are greater bus and rail options and where even networks to support walking and cycling are better established than in other parts of the country. With regards cycling for example, 18% of respondents cycle to work while nationally this figure is just 4% as recorded in the 2006 Census. <<INSERT TABLE 2>> Before the stated preference component of the survey was presented to respondents, they were asked to indicate what factors would encourage the respondents to begin cycling. The results from this question can are presented in Table % of respondents said more off road cycle tracks and 56.4% said that more connected onroad cycle lanes would encourage them to begin to cycle to work. The results for better facilities at work, better signage, improved information and increased bike parking were found to be unlikely to encourage individuals to cycle to work. Interestingly 69.1% of respondents said less traffic was unlikely to encourage them to cycle on a regular basis. <<INSERT TABLE 3>> In the survey respondents were asked how confident they were cycling in Dublin. The results show that 14.8% indicated that they were completely confident and 20.1% said they were very confident (see Table 4). The respondents were also asked had cycle safety changed in Dublin in the past three years. 8.7% said safety had improved a lot and 59.4% said that it has improved slightly. <<INSERT TABLE 4>> Route choice models This section of the paper presents the results from the route choice models. The first model presented in Table 5 contains the results of the base model, which includes all of the respondents in the sample. The first set of coefficients examines the impact adjacent traffic speed has upon route choice. The findings show that respondents had a greater preference for lower adjacent traffic speeds as the 30km per-hour coefficient has the highest positive value. The second set of coefficients measure the impact that the cycle route type has upon route choice. The results show that both the cycle/bus lane and the no-lane options both had significant negative coefficients indicating that respondents are unlikely to select a route option if it has this type of route infrastructure. The off road cycle lane option was found to have the highest positive
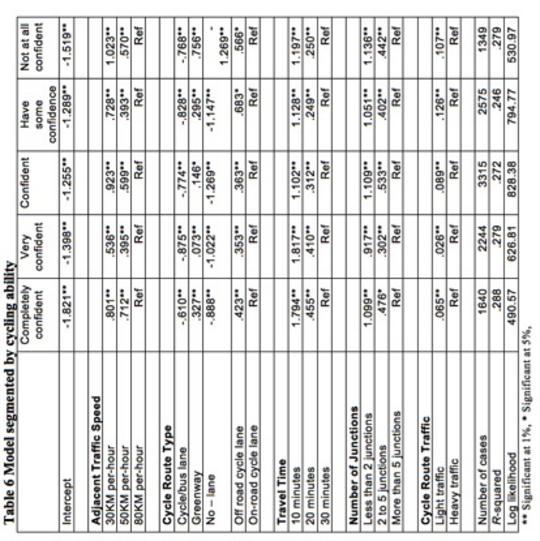
5 5 coefficient followed by the greenway option, this result indicates that respondents are more likely to choose a route that has one of these infrastructures. The results for the travel time coefficients show, as one would expect, that respondents had a greater preference for lower travel times, with the coefficient related to a 10-minute travel time having the highest positive coefficient. The number of junctions that the respondent would encounter while cycling along the route was examined to determine if this would significantly impact upon respondents utility. The findings show that respondents are more likely to choose a route that has fewer junctions with the less than 2 junctions coefficient having the highest positive value. The final set of coefficients presented in Table 5 relates the amount of cycle traffic along the route. The findings show that respondents have a slight preference for light traffic while cycling along the route. <<INSERT TABLE 5>> The model results presented in Table 6 segment the route choice model by the users cycling confidence level. The dataset was segmented by the five confidence levels reported in the survey, ranging from completely confident to not at all confident. The first set of results relate to the adjacent traffic speeds. The results show no clear pattern amongst the different groups other than the fact that all groups do have a preference for lower traffic speeds. However, as one would expect those in the not at all confident group where shown to have the greatest preference for lower speeds. The findings for the type of cycling infrastructure show that, again as one would expect, those with lower confidence levels would derive the greatest benefit from greenways and off road cycle lanes. The findings for the travel time showed that there was very little difference between the user groups, but that all respondents had a desire for lower travel times. The findings for the number of junctions encountered along the route showed that those respondents that were not at all confident cyclists were shown to have the greatest preference for lower numbers of junctions along the route. The final set of results presented in Table 6 estimate the impact that the volume of cycling traffic has along the route. The findings suggest that those respondents with lower levels of cycling had a greater preference for lower traffic volumes along the route. << INSERT TABLE 6>> Summary of findings The purpose of this research was to add further clarity in relation to individual preference regarding infrastructure and the measures which are most likely to achieve modal shift. An improvement in infrastructure for cyclists is the most important measure in encouraging a growth in cycling. This is followed by the need for increased bike parking and better facilities for cyclists such as showers and lockers at work. Direct routes with short journey times were found to be the most important variable for existing cyclists and non-cyclists in determining route choice. This is followed by infrastructure type, the number of junctions along the route, traffic speed and cyclist volumes. In terms if infrastructure, regardless of the level of cycling confidence, routes which have no facilities or bus/cycle lanes are the least favoured cycle route types.
6 6 There appears to be no direct correlation between cycling confidence and route choice preference with confident cyclists demonstrating a similar preference for the presented infrastructure types as respondents with no cycling confidence. There are, however, a small proportion of very confident cyclists who place high importance on short journey times and direct facilities with low cyclist volumes. For these cyclists, type of infrastructure and traffic speeds is of less relevance. Acknowledgments The authors wish to thank the National Transport Authority and Dublin City Council for their assistance in undertaking this research. References: Department of Transport, Smarter Travel: A New Transport Policy for Ireland , Dublin, Ireland, 2009a Department of Transport, Ireland s First National Cycle Policy Framework, Dublin, Ireland, 2009b Hensher, D. A., Rose, J.M. and Greene, W.H. Applied Choice: A Primer. Cambridge University Press, New York, Louviere, J. J., Hensher, D.A., J.D. Swait. J.D, Stated Choice Methods: Analysis and Application, Cambridge University Press, National Transport Authority, National Cycle Manual, Dublin, Ireland, 2011 Train. K. Discrete Choice Methods wit Simulation, Cambridge University Press, New York, 2003
7 Figure 1
8 Figure 2
9 Table 1
10 Table 2
11 Table 3
12 Table 4
13 Table 5
14 Table 6
BICYCLE INFRASTRUCTURE PREFERENCES A CASE STUDY OF DUBLIN
 Proceedings 31st August 1st ITRN2011 University College Cork Brick, McCarty and Caulfield: Bicycle infrastructure preferences A case study of Dublin BICYCLE INFRASTRUCTURE PREFERENCES A CASE STUDY OF DUBLIN
RE-CYCLING A CITY: EXAMINING THE GROWTH OF CYCLING IN DUBLIN
 Proceedings ITRN2013 5-6th September, Caulfield: Re-cycling a city: Examining the growth of cycling in Dublin RE-CYCLING A CITY: EXAMINING THE GROWTH OF CYCLING IN DUBLIN Brian Caulfield Abstract In the
PERSONALISED TRAVEL PLANNING IN MIDLETON, COUNTY CORK
 PERSONALISED TRAVEL PLANNING IN MIDLETON, COUNTY CORK Elaine Brick Principal Transport Planner AECOM Abstract Smarter Travel funding was awarded to the Chartered Institute of Highways and Transportation
Brian Caulfield Department of Civil, Structural and Environmental Engineering, Trinity College Dublin, Dublin 2, Ireland
 *Manuscript Click here to view linked References Re-cycling a city examining the growth of cycling in Dublin Brian Caulfield Department of Civil, Structural and Environmental Engineering, Trinity College
KEY FINDINGS OF THE INTERIM EVALUATION OF THE SMARTER TRAVEL AREAS PROGRAMME
 Proceedings 1st - 2nd September 2016 BRICK, CANTWELL, SWIFT: Smarter Travel Areas KEY FINDINGS OF THE INTERIM EVALUATION OF THE SMARTER TRAVEL AREAS PROGRAMME Elaine Brick Associate Director AECOM Mairead
Baseline Survey of New Zealanders' Attitudes and Behaviours towards Cycling in Urban Settings
 Baseline Survey of New Zealanders' Attitudes and Behaviours towards Cycling in Urban Settings Highlights 67% of urban New Zealanders, 18 years of age or more own or have access to a bicycle that is in
Thursday 18 th January Cambridgeshire Travel Survey Presentation to the Greater Cambridge Partnership Joint Assembly
 Thursday 18 th January 2018 Cambridgeshire Travel Survey Presentation to the Greater Cambridge Partnership Joint Assembly Contents 1. Study Background 2. Methodology 3. Key Findings An opportunity for
GD 0043/18 ACTIVE TRAVEL STRATEGY
 GD 0043/18 ACTIVE TRAVEL STRATEGY 2018-2021 May 2018 Minister s Introduction There is strong evidence that regular physical activity reduces the risk of a range of health conditions. The best way to increase
Final Plan 20 December 2016
 Final Plan 20 December 2016 Introduction Aims of the Travel Plan How do we travel? Understanding travel behaviours? The University Master Plan and its implications Galway City sustainable transport policies
York Scarborough Bridge Economic Appraisal Update Technical Note
 York Scarborough Bridge Economic Appraisal Update Technical Note Specification No. 1 Client name West Yorkshire Combined Authority Client reference M088 Discipline Transportation Project name CCAG2 Economics
Active Travel Towns Funding Scheme Project Proposal. Sligo. Sligo Local Authorities
 Active Travel Towns Funding Scheme 2014-2016 Project Proposal for Sligo by Sligo Local Authorities Introduction Over the last two years, Sligo Local Authorities have implemented years 1 & 2 of their 5
Making Dublin More Accessible: The dublinbikes Scheme. Martin Rogers Colm Keenan 13th November 2012
 : The dublinbikes Scheme Martin Rogers Colm Keenan 13th November 2012 Modal Splits for Dublin 2001-2011 Dublin Mode Share Summary - Persons Crossing Canal Cordon 07.00-10.00 Year Total All PT % Car % Walk
ANNEX1 The investment required to achieve the Government s ambition to double cycling activity by 2025
 ANNEX1 The investment required to achieve the Government s ambition to double cycling activity by 2025 May 2016 About Sustrans Sustrans makes smarter travel choices possible, desirable and inevitable.
TYPES OF CYCLING. Figure 1: Types of Cycling by Gender (Actual) Figure 2: Types of Cycling by Gender (%) 65% Chi-squared significance test results 65%
 Figure 2: Types of Cycling by Gender (%) 65% Chi-squared significance test results 65%") TYPES OF CYCLING 1,980 responses were received to this question (multiple answers were allowed), 727 female (41%) and 1,242 (71%) from male respondents. The most common responses for both genders were
TYPES OF CYCLING 1,980 responses were received to this question (multiple answers were allowed), 727 female (41%) and 1,242 (71%) from male respondents. The most common responses for both genders were
Transportation Master Plan Advisory Task Force
 Transportation Master Plan Advisory Task Force Network Alternatives & Phasing Strategy February 2016 BACKGROUND Table of Contents BACKGROUND Purpose & Introduction 2 Linking the TMP to Key Council Approved
Land Use and Cycling. Søren Underlien Jensen, Project Manager, Danish Road Directorate Niels Juels Gade 13, 1020 Copenhagen K, Denmark
 Land Use and Cycling Søren Underlien Jensen, Project Manager, Danish Road Directorate Niels Juels Gade 13, 1020 Copenhagen K, Denmark suj@vd.dk Summary: Research about correlation between land use and
Modal Shift in the Boulder Valley 1990 to 2009
 Modal Shift in the Boulder Valley 1990 to 2009 May 2010 Prepared for the City of Boulder by National Research Center, Inc. 3005 30th Street Boulder, CO 80301 (303) 444-7863 www.n-r-c.com Table of Contents
This objective implies that all population groups should find walking appealing, and that it is made easier for them to walk more on a daily basis.
 Walking for life The Norwegian Walking Strategy Guro Berge Norwegian public Roads Administration "Walking for life" is the slogan for the National Walking Strategy that is now being formulated in Norway.
Elsevier Editorial System(tm) for Tourism Management Manuscript Draft
 for Tourism Management Manuscript Draft") Elsevier Editorial System(tm) for Tourism Management Manuscript Draft Manuscript Number: JTMA-D-14-00139R2 Title: Do tourists value different levels of cycling infrastructure? Article Type: Research Paper
Elsevier Editorial System(tm) for Tourism Management Manuscript Draft Manuscript Number: JTMA-D-14-00139R2 Title: Do tourists value different levels of cycling infrastructure? Article Type: Research Paper
Investment in Active Transport Survey
 Investment in Active Transport Survey KEY FINDINGS 3 METHODOLOGY 7 CYCLING INFRASTRUCTURE 8 Riding a bike 9 Reasons for riding a bike 9 Mainly ride on 10 Comfortable riding on 10 Rating of cycling infrastructure
Using a Mixed-Method Approach to Evaluate the Behavioural Effects of the Cycling City and Towns Programme
 1 of 25 Using a Mixed-Method Approach to Evaluate the Behavioural Effects of the Cycling City and Towns Programme Kiron Chatterjee (Centre for Transport & Society, UWE) with acknowledgements to research
21/02/2018. How Far is it Acceptable to Walk? Introduction. How Far is it Acceptable to Walk?
 21/2/218 Introduction Walking is an important mode of travel. How far people walk is factor in: Accessibility/ Sustainability. Allocating land in Local Plans. Determining planning applications. Previous
9. Parking Supporting Statement
 9. Parking Supporting Statement Content 1. Setting the Scene 2. Vision 3. Parking and the Shared Priorities 4. Issues 5. Delivery Programme in the first Plan Period 2001/02 2005/06 6. Good Practice 7.
A future cycle route network for North Staffordshire mb/08/16 Need for a strategy. Existing cycle route network
 Need for a strategy 1. The government s aim is to double cycling levels nationally by 2025 [note 1]. This would bring significant health, environmental, economic and traffic benefits [note 2]. It is widely
Loughborough University Travel Planning
 Document Ti tle Client Name Loughborough University Travel Planning Loughborough University Travel Plan Executive Summary 2015-2020 23 December 2015 Loughborough University Travel Planning Project no:
Active Travel Strategy Dumfries and Galloway
 Active Travel Strategy Dumfries and Galloway Our Active Travel Strategy The agreed Interventions for Dumfries and Galloway Council s Local Transport Strategy includes an action to Develop an Active Travel
March Maidstone Integrated Transport Strategy Boxley Parish Council Briefing Note. Context. Author: Parish Clerk 2 March 2016
 Context. Author: Parish Clerk 2 The Draft Integrated Transport Policy (DITS) sets out a vision and objectives, and identifies a detailed programme of interventions to support the Maidstone Borough Local
Assessment of socio economic benefits of non-motorized transport (NMT) integration with public transit (PT)
 integration with public transit (PT)") Assessment of socio economic benefits of non-motorized transport (NMT) integration with public transit (PT) Case study of Bike share (BS) system in Pune, India Parvesh Kumar Sharawat Department of Policy
Assessment of socio economic benefits of non-motorized transport (NMT) integration with public transit (PT) Case study of Bike share (BS) system in Pune, India Parvesh Kumar Sharawat Department of Policy
2. Context. Existing framework. The context. The challenge. Transport Strategy
 Transport Strategy Providing quality connections Contents 1. Introduction 2. Context 3. Long-term direction 4. Three-year priorities 5. Strategy tree Wellington City Council July 2006 1. Introduction Wellington
Climate Change Action Plan: Transportation Sector Discussion Paper: Cycling
 Climate Change Action Plan: Transportation Sector Discussion Paper: Cycling ontario.ca/climatechange Contents 1. Minister of Transportation s message... 3 2. Introduction... 5 3. Sector Overview and Support
Douglas Land Use and Transportation Strategy (DLUTS) Summary. August 2013
 Summary. August 2013") Douglas Land Use and Transportation Strategy (DLUTS) Summary August 2013 Background Douglas is a large and popular residential suburb of approximately 30,000 persons on the periphery of Cork City along
Douglas Land Use and Transportation Strategy (DLUTS) Summary August 2013 Background Douglas is a large and popular residential suburb of approximately 30,000 persons on the periphery of Cork City along
1999 On-Board Sacramento Regional Transit District Survey
 SACOG-00-009 1999 On-Board Sacramento Regional Transit District Survey June 2000 Sacramento Area Council of Governments 1999 On-Board Sacramento Regional Transit District Survey June 2000 Table of Contents
What s the issue for transport in Cardiff?
 Demand for travel The number of commuters travelling to work in Cardiff has increased from 190,000 in 2001 to 198,000 in 2010, with some 124,000 Cardiff residents travelling across the city daily to their
Public transport and town planning from a retroactive point of view C. Wallstrom, S. Johansson et al
 Public transport and town planning from a retroactive point of view C. Wallstrom, S. Johansson et al The aim of this project is to estimate the effect of town planning on traffic volumes and modal split
Measuring and growing active modes of transport in Auckland
 AUCKLAND CLIENT TRANSPORT SECTION HEADLINE1 AUCKLAND TRANSPORT JUNE 2017 Measuring and growing active modes of transport in Auckland WAVE 3 1 AUCKLAND TRANSPORT 2 The overall business objective is to:
Route User Intercept Survey Report
 Route User Intercept Survey Report Hills Road, Cambridge Fieldwork: October 2016 Report published: December 2016 1 About Sustrans Sustrans makes smarter travel choices possible, desirable and inevitable.
Integrated Urban Mobility
 Integrated Urban Mobility The Berlin Experience Forum Urba 2015 Conference Montreal, 23 th March 2011 Maria Krautzberger Permanent Secretary of State, Senate Department for Urban Development, Berlin The
WEST YORKSHIRE LTP CYCLE PROSPECTUS
 WEST YORKSHIRE LTP CYCLE PROSPECTUS The West Yorkshire Ambition: To be recognised as a great place for safe cycling, inspiring more people to cycle more often. INTRODUCTION Cycling is low cost, environmentally
TRANSPORTATION TOMORROW SURVEY
 Clause No. 15 in Report No. 7 of was adopted, without amendment, by the Council of The Regional Municipality of York at its meeting held on April 17, 2014. 15 2011 TRANSPORTATION TOMORROW SURVEY recommends
Reflections on our learning: active travel, transport and inequalities
 Reflections on our learning: active travel, transport and inequalities Jill Muirie Glasgow Centre for Population Health Active travel definition Active travel refers to walking, cycling or using some other
Canada s Capital Region Delegation to the Velo-City Global 2010 Conference
 Canada s Capital Region Delegation to the Velo-City Global 2010 Conference Report of Findings from Visits, Meetings & Presentations In Amsterdam-Den Haag, Utrecht, Berlin & Copenhagen The Itinerary Copenhagen
Examining the factors that impact upon mode choice for frequent short trips
 Brazil and Caulfield 1 Examining the factors that impact upon mode choice for frequent short trips William Brazil Department of Civil, Structural and Environmental Engineering Trinity College Dublin Dublin
Driverless Vehicles Potential Influence on Bicyclist Facility Preferences
 Driverless Vehicles Potential Influence on Bicyclist Facility Preferences MICHAEL BLAU, MCRP, LCI O T E C O C T O B E R 2 6, 2 0 1 6 S E S S I O N # 8 2 - E V A L U AT I N G T H E P E R F O R M A N C E
May Canal Cordon Report 2017
 May 2018 Canal Cordon Report 2017 Report on trends in mode share of vehicles and people crossing the Canal Cordon to 2017 2 Analysis of trends in mode share of people crossing the canal cordon - 2017 Contents
The Limassol SUMP Planning for a better future. Apostolos Bizakis Limassol, May 16, th Cyprus Sustainable Mobility and ITS conference
 The Limassol SUMP Planning for a better future Apostolos Bizakis Limassol, May 16, 2017 5 th Cyprus Sustainable Mobility and ITS conference Αbout Limassol Αbout Limassol The second largest city in Cyprus
Walking and Cycling Action Plan Summary. A Catalyst for Change The Regional Transport Strategy for the west of Scotland
 Walking and Cycling Action Plan Summary A Catalyst for Change The Regional Transport Strategy for the west of Scotland 2007-2021 Strathclyde Partnership for Transport Contents Purpose...2 Issues, Constraints
HAMILTON BIKING PLAN OUR VISION: A BIKE FRIENDLY CITY
 HAMILTON BIKING PLAN 2015-2045 OUR VISION: A BIKE FRIENDLY CITY INTRODUCTION Biking as a travel option is experiencing a resurgence internationally and in New Zealand, growing as a familyfriendly and healthy
WILMAPCO Public Opinion Survey Summary of Results
 Wilmington Area Planning Council WILMAPCO Public Opinion Survey Summary of Results Prepared by: 2955 Valmont Road, Suite 300 Boulder, Colorado 80301 t: 303-444-7863 f: 303-444-1145 www.n-r-c.com Table
NOTES FROM JUNIOR COUNCIL ORIENTATION SESSION HELD ON MONDAY, JANUARY 22, 2018, AT 3:30 PM IN COUNCIL CHAMBERS, CITY HALL
 CITY OF KAMLOOPS Junior Council Meeting Agenda March 12, 2018, at 3:30 pm in Council Chambers, 7 Victoria Street West, Kamloops, BC Page 1. APPROVAL OF THE AGENDA 2. MINUTES Attachment Recommendation:
GETTING WHERE WE WANT TO BE
 CAMBRIDGESHIRE & peterborough GETTING WHERE WE WANT TO BE A GREEN PARTY TRANSPORT POLICY CONTENTS Our Campaign Priorities 4 Bus Franchising 6 Supporting Active Transport 8 Workplace Parking Levy 9 Tackling
Paper submitted to the Scottish Transport Studies Group (STSG) April 2004
 April 2004") A SURVEY OF TRAVEL BEHAVIOUR IN EDINBURGH Paper submitted to the Scottish Transport Studies Group (STSG) April 2004 Tim Ryley Research Fellow Transport Research Institute Napier University 1. Introduction
A SURVEY OF TRAVEL BEHAVIOUR IN EDINBURGH Paper submitted to the Scottish Transport Studies Group (STSG) April 2004 Tim Ryley Research Fellow Transport Research Institute Napier University 1. Introduction
City of Novi Non-Motorized Master Plan 2011 Executive Summary
 City of Novi Non-Motorized Master Plan 2011 Executive Summary Prepared by: February 28, 2011 Why Plan? Encouraging healthy, active lifestyles through pathway and sidewalk connectivity has been a focus
Exhibit 1 PLANNING COMMISSION AGENDA ITEM
 Exhibit 1 PLANNING COMMISSION AGENDA ITEM Project Name: Grand Junction Circulation Plan Grand Junction Complete Streets Policy Applicant: City of Grand Junction Representative: David Thornton Address:
Towards a Sustainable Transport Network in the West Region. Padraic O Donoghue
 Towards a Sustainable Transport Network in the West Region Padraic O Donoghue Professor of Civil Engineer NUI Galway Engineers Ireland West Region March 3, 2015 Outline One Planet Living Engineering the
The role of the Authority in promoting sustainable transport. Gerry Murphy South East Regional Assembly 27 th May 2011
 The role of the Authority in promoting sustainable transport Gerry Murphy South East Regional Assembly 27 th May 2011 Who we are National Transport Authority established on 1 st December 2009 Dublin Transport
ENFIELD TOWN THE REVISED DESIGN
 TOWN THE REVISED DESIGN We re turning Enfield into a borough that encourages walking and cycling, a place that s easy for all of us to get around however we choose to travel. A greener place, with safer
Developing a Birmingham Transport Space Allocation policy. David Harris Transport Policy Manager Economy Directorate Birmingham City Council
 Developing a Birmingham Transport Space Allocation policy David Harris Transport Policy Manager Economy Directorate Birmingham City Council Birmingham s Sustainable Urban Mobility Plan Birmingham Connected
Weather and Cycling in Dublin : Perceptions and Reality
 Author : Keegan, O P 1. Abstract It is generally accepted that weather conditions and especially rainfall have an impact on cycling patterns in Dublin. For individuals who regularly cycle to work poor
1.0 FOREWORD EXECUTIVE SUMMARY INTRODUCTION CURRENT TRENDS IN TRAVEL FUTURE TRENDS IN TRAVEL...
 Sustainable Travel Plan 2008-2012 1 Contents Page Number 1.0 FOREWORD... 3 2.0 EXECUTIVE SUMMARY... 3 3.0 INTRODUCTION... 4 4.0 CURRENT TRENDS IN TRAVEL... 4 5.0 FUTURE TRENDS IN TRAVEL... 7 6.0 TRAVEL
SUSTAINABLE TRAVEL TOWNS: RESULTS AND LESSONS
 SUSTAINABLE TRAVEL TOWNS: RESULTS AND LESSONS Joe Finlay Sustainable Travel Team Department for Transport (UK) Introduction I will: Give brief background on the Sustainable Travel Towns and the projects
Cabrillo College Transportation Study
 Cabrillo College Transportation Study Planning and Research Office Terrence Willett, Research Analyst, Principle Author Jing Luan, Director of Planning and Research Judy Cassada, Research Specialist Shirley
Implementing Complete Streets in Ottawa. Project Delivery Process and Tools Complete Streets Forum 2015 October 1, 2015
 Implementing Complete Streets in Ottawa October 1, 2015 The Essentials Complete Streets Implementation Framework will become part of the routine delivery of City transportation projects Approach uses every
A new sustainable transport option for Hereford
 A new sustainable transport option for Hereford MTRU September 2010 September 2011 Introduction by Paige Mitchell Ten Minute Travel Radius for Trips on Foot and Bicycle from or to the City Centre Source:
The case study was drafted by Rachel Aldred on behalf of the PCT team.
 Rotherhithe Case Study: Propensity to Cycle Tool This case study has been written to use the Propensity to Cycle Tool (PCT: www.pct.bike) to consider the impact of a bridge in South-East London between
THE TWO BANKS OF THE TAGUS RIVER BY INTEGRATING THE BYCICLE INTO A MULTIMODAL SYSTEM
 TH 1.E Cycling to work, school, retail and for leisure LINKING THE TWO BANKS OF THE TAGUS RIVER BY INTEGRATING THE BYCICLE INTO A MULTIMODAL SYSTEM Summary A glimpse of Almada Transport impacts in Almada
TOWARDS A BIKE-FRIENDLY CANADA A National Cycling Strategy Overview
 TOWARDS A BIKE-FRIENDLY CANADA A National Cycling Strategy Overview NationalCyclingStrategFrameworkv3.indd 1 Potential for this modal shift can be found in municipalities of all sizes, in every population
LONG DISTANCE COMMUTING IN SCOTLAND David Connolly Lucy Barker MVA Consultancy
 LONG DISTANCE COMMUTING IN SCOTLAND David Connolly Lucy Barker MVA Consultancy 1. INTRODUCTION This report summarises the results of a study commissioned by the Scottish Executive to investigate long distance
Travel Patterns and Cycling opportunites
 Travel Patterns and Cycling opportunites The Household Travel Survey is the largest and most comprehensive source of information on the travel patterns of residents of the Sydney Greater Metropolitan Area
North West Non-Technical Summary of the Transport Assessment September 2011
 North West Non-Technical Summary of the Transport Assessment September 2011 Introduction This is a Non-Technical Summary of the findings of the Transport assessment work undertaken for the proposed North
SAN FRANCISCO WOMEN AND BIKING A CASE STUDY ON THE USE OF SAN FRANCISCO BIKE LANES SYNTHESIS
 SAN FRANCISCO WOMEN AND BIKING A CASE STUDY ON THE USE OF SAN FRANCISCO BIKE LANES SYNTHESIS WOMEN AND BIKING: A CASE STUDY ON THE USE OF SAN FRANCISCO BIKE LANES 2 TAKEAWAY KEY Increasing biking is a
Acknowledgements. Ms. Linda Banister Ms. Tracy With Mr. Hassan Shaheen Mr. Scott Johnston
 Acknowledgements The 2005 Household Travel Survey was funded by the City of Edmonton and Alberta Infrastructure and Transportation (AIT). The survey was led by a steering committee comprised of: Dr. Alan
Chapter 2. Bellingham Bicycle Master Plan Chapter 2: Policies and Actions
 Chapter 2 Bellingham Bicycle Master Plan Chapter 2: Policies and Actions Chapter 2: Policies and Actions The Bicycle Master Plan provides a road map for making bicycling in Bellingham a viable transportation
Gdynia s bicycle model
 Gdynia s bicycle model Problems related to cycling network and demand modelling Michał Miszewski, city of Gdynia Development of tool for transport analysis - MST Statistical data (baseline and forecasts)
City of Perth Cycle Plan 2029
 Bicycling Western Australia s response City of Perth Cycle Plan 2029 2012-2021 More People Cycling More Often ABOUT BICYCLING WESTERN AUSTRALIA Bicycling Western Australia is a community based, not-for-profit
Public Consultation Centre For. Transportation Master Plan Update. Information Package
 Public Consultation Centre For Transportation Master Plan Update Information Package Date Location Hours Tuesday, September 12, 2017 Wednesday, September 13, 2017 Tuesday, September 19, 2017 Cambridge
University of Victoria Campus Cycling Plan Terms of Reference. 1.0 Project Description
 University of Victoria Campus Cycling Plan Terms of Reference 1.0 Project Description The Campus Cycling Plan, a first for the University, will provide a comprehensive and coordinated approach to support
University of Leeds Travel Plan
 University of Leeds Travel Plan 2015-2018 Contents 1: Introduction 1.1 What is a Travel Plan? 1.2 Why do we need one? 1.3 Sustainability Strategy 2: Overview 2.1 The bigger picture 2.2 The City scale 2.3
SANTA CLARA COUNTYWIDE BICYCLE PLAN August 2008
 SANTA CLARA COUNTYWIDE BICYCLE PLAN August 2008 To assist VTA and Member Agencies in the planning, development and programming of bicycle improvements in Santa Clara County. Vision Statement To establish,
ONE SIZE DOESN T FIT ALL RECONCILING OVERLAPPING TRANSPORT NETWORKS IN A CONSTRAINED URBAN ENVIRONMENT
 One Size Doesn t Fit All S Corbett, C Chenery Page 1 ONE SIZE DOESN T FIT ALL RECONCILING OVERLAPPING TRANSPORT NETWORKS IN A CONSTRAINED URBAN ENVIRONMENT Authors/Presenters: Sam Corbett, Principal Transport
Trial 3: Interactions Between Autonomous Vehicles and Pedestrians and Cyclists
 Trial 3: Interactions Between Autonomous Vehicles and Pedestrians and Cyclists What is VENTURER? VENTURER is a 5m research and development project funded by government and industry and delivered by Innovate
VILNIUS SUMP. Gintarė Krušinskaitė International project manager place your logo here
 VILNIUS SUMP Gintarė Krušinskaitė International project manager Gintare.krusinskaite@vilniustransport.lt place your logo here 19 April, 2017 WHERE DID WE CAME FROM? Mobility management and mobility planning
REYKJAVÍK - NEW MOBILITY OPTIONS
 25. OKTÓBER 2017 REYKJAVÍK - NEW MOBILITY OPTIONS ÞORSTEINN R. HERMANNSSON City of Reykjavik Director of Transportation REYKJAVIK CAPITAL AREA EXPECTED GROWTH 2015-2040 70.000 How will we travel? How should
EUROPEAN MOBILITY WEEK September 2015
 EUROPEAN MOBILITY WEEK 16-22 September 2015 Description and objective The European Mobility Week is an annual campaign on sustainable urban mobility, organised with the support of the Directorates General
Cycling Master Plan Community Engagement Session WELCOME
 Cycling Master Plan Community Engagement Session WELCOME WHY COMMUNITIES PLAN Considering Short Term and Long Term Needs City of Lethbridge is committed to planning - to determine short term goals along
City of Toronto Complete Streets Guidelines
 Round One This is a summary of the Complete Streets Guidelines Survey posted on June 18 th, 2015 and live until July 2 nd, 2015. The survey was designed to solicit feedback on the draft Complete Streets
FAQ s Walsh Road / Ferguson Road Pilot Scheme
 FAQ s Walsh Road / Ferguson Road Pilot Scheme What is happening? Traffic calming measures are being installed as a pilot. Temporary Bollards will be installed to the east of 1 Ferguson Road and a Temporary
LEEDS BECKETT UNIVERSITY. Transport Strategy
 LEEDS BECKETT UNIVERSITY Transport Strategy 2016-2021 2 3 Contents 1. Introduction 1. Introduction...3 Scope of the Document...3 Vision...3 Key Successes...3 2. Our Travel Behaviour...4 Staff and Student
Life Transitions and Travel Behaviour Study. Job changes and home moves disrupt established commuting patterns
 Life Transitions and Travel Behaviour Study Evidence Summary 2 Drivers of change to commuting mode Job changes and home moves disrupt established commuting patterns This leaflet summarises new analysis
Department for Transport
 Improving UK evidence on health and environmental (low carbon) behaviours John Cummings Department for Transport 4 th November, 2015 CYCLING AND WALKING POLICY TEAM, OFFICIAL, 1st DRAFT 1 Walking and cycling
Launceston's Transport Futures. Greater travel options for the people of Launceston
 Launceston's Transport Futures Greater travel options for the people of Launceston Final Draft 13 Jan 2014 1 Page Number Executive summary 3 What is Transport Futures? 4 Vision 6 Economy, access and liveability
Factors Associated with the Bicycle Commute Use of Newcomers: An analysis of the 70 largest U.S. Cities
 : An analysis of the 70 largest U.S. Cities Ryan J. Dann PhD Student, Urban Studies Portland State University May 2014 Newcomers and Bicycles Photo Credit: Daveena Tauber 2 Presentation Outline Introduction
Greenhouse gas emissions from transport have been rising and are expected to continue to rise both in higher & lower income countries.
 1 Greenhouse gas emissions from transport have been rising and are expected to continue to rise both in higher & lower income countries. Transport is seen as a hard area for mitigation 2 However, there
Report to: Greater Cambridge Partnership Executive Board 4 July Transport Strategy - Future Public Transport Requirements
 Report to: Greater Cambridge Partnership Executive Board 4 July 2018 Lead officer: Peter Blake GCP Transport Director Transport Strategy - Future Public Transport Requirements 1. Purpose 1.1. This paper
Tallinn Region Sustainable Urban Mobility Plan 2035
 Estonian Road Administration Tallinna Transport Department Tallinn Region Sustainable Urban Mobility Plan 2035 Mari Jüssi, SUMP expert Estonian Road Administration/ Tallinn Transport Department FESM Steering
Satisfaction with getting to work 56% 15% 6% 6% Total distance travelled. miles per week
 Page/... Headlines Emersons Green Travel to Work Survey March 0 Number of respondents Main modes of travel (%) 0% Satisfaction with getting to work % % Satisfaction with getting % % % (driver with others/
City of Hamilton s Transportation Master Plan (TMP) Public Consultation 3 December 2015
 Public Consultation 3 December 2015") City of Hamilton s Transportation Master Plan (TMP) Public Consultation 3 December 2015 McPhail Transportation Planning Services Ltd. AGENDA 6:00 7:00 pm Viewing Boards / Q & A with the Team 7:00 7:50
City of Hamilton s Transportation Master Plan (TMP) Public Consultation 3 December 2015 McPhail Transportation Planning Services Ltd. AGENDA 6:00 7:00 pm Viewing Boards / Q & A with the Team 7:00 7:50
Update June 2018 OUR 2017 PUBLIC ENGAGEMENT
 Update June 2018 Hi, Let s Get Wellington Moving (LGWM) is developing a Recommended Programme of Investment (RPI) that meets our programme objectives and supports the city s and region s growth. As part
CPC Parking Lot Riverside Drive. Transportation Rationale
 CPC Parking Lot Transportation Rationale Prepared By: NOVATECH Suite 200, 240 Michael Cowpland Drive Ottawa, Ontario K2M 1P6 September 2015 Novatech File: 114093 Ref: R-2015-153 Table of Contents 1.0 INTRODUCTION...
Chapter 7. Transportation. Transportation Road Network Plan Transit Cyclists Pedestrians Multi-Use and Equestrian Trails
 Chapter 7 Transportation Transportation Road Network Plan Transit Cyclists Pedestrians Multi-Use and Equestrian Trails 7.1 TRANSPORTATION BACKGROUND The District of Maple Ridge faces a number of unique
Rural Economy and Connectivity Committee. Restricted Roads (20mph Speed Limit) (Scotland) Bill: Key Themes Arising from the Online Survey
 (Scotland) Bill: Key Themes Arising from the Online Survey") Rural Economy and Connectivity Committee Restricted Roads (20mph Speed Limit) (Scotland) Bill: Key Themes Arising from the Online Survey Introduction On Friday 9 November 2018, the Rural Economy and Connectivity
Rural Economy and Connectivity Committee Restricted Roads (20mph Speed Limit) (Scotland) Bill: Key Themes Arising from the Online Survey Introduction On Friday 9 November 2018, the Rural Economy and Connectivity