OC FOOTHILLS BIKEWAYS STRATEGY. April 2016
|
|
|
- Hannah Perry
- 5 years ago
- Views:
Transcription


1 OC FOOTHILLS BIKEWAYS STRATEGY April 2016
2 This page intentionally blank
3 TABLE OF CONTENTS ES. Executive Summary...1 ES.1 Background...1 ES.2 Collaborative Efforts...2 ES.3 Regional Corridors... 4 ES.4 Corridor Evaluation...8 ES.5 Action Plan...10 ES.6 Bicycle Facility Toolkit ES.7 Funding Strategies Introduction Background Collaborative Efforts Local Agency Implementation Bikeways Classifications Existing Conditions Context Rationale Activity Levels and Collision Analysis Regional Bikeway Corridors Regional Corridors Corridor Evaluation Action Plan Early Action Project Examples Programmatic Recommendations Bicycle Facility Toolkit Introduction Bicycle Facility Section Shared-Use Paths Path Roadway crossings Separated Bikeways Separated Bikeways at Intersections Signalization Shared Roadways Bikeway Signing Retrofitting Existing Streets to Add Bikeways Bicycle Support Facilities Bikeway Maintenance Funding Strategies Appendices A. Sample Letter of Support B. List of References...140
4 OCTA - Orange County Transportation Authority This page intentionally blank
5 OC Foothills Bikeways Strategy ES. EXECUTIVE SUMMARY This report summarizes the results of a collaborative effort to identify and prioritize potential bikeways throughout the foothills area of Orange County (Supervisorial District 3). Through extensive facilitation efforts, eleven regional bikeway corridors were identified and studied. While the Orange County Council of Governments (OCCOG) and the Orange County Transportation Authority (OCTA) have commissioned this report, implementation of bikeway corridors will be led by the agencies that have jurisdiction. In some cases, roadways are managed by Caltrans, such as at freeway interchanges. While OCCOG and OCTA will promote the implementation of corridors recommended in this report, final design, construction, and maintenance of the corridors will be coordinated and conducted by the respective jurisdictions. Additionally, the cities or the County may need to coordinate with various landowners such as utility companies, rail operators, and OCTA for right-of-way acquisition. The OC Foothills Bikeways Strategy aims to enhance community interaction and expand travel choices for residents and bicyclists of all skill levels throughout the foothills and adjacent districts. The integrated planning effort establishes bikeways that cross jurisdictional boundaries and serve major destinations and employment centers. The coordinated efforts by OCTA and member agencies support improved road safety, expanded travel options, sustainability, and improved community health outcomes. ES.1 BACKGROUND The OC Foothills Bikeways Strategy was developed as part of OCTA s regional bikeways planning process, which involves OCTA, local jurisdictions, and public stakeholders. This process began in 2011 with a pilot effort for Supervisorial District 4 in northern Orange County, then for Supervisorial Districts 1 & 2 in central and western Orange County in 2012, and most recently for Supervisorial District 5 in south Orange County. It is funded by a federal grant received by OCCOG, with a 20% local match provided by OCTA. There are two phases of the regional bikeways planning process. Phase 1 is this bikeways strategy, which identifies the regional backbone bikeway corridors that connect to major activity centers. The regional bikeway corridors are identified based on community and agency input and evaluated based on criteria consistent with regional transportation goals and objectives (see Table ES.1 and Chapter 3). In Phase 2, selected concepts are studied in more detail with the development of a feasibility study, which provide planning-level design recommendations to the local jurisdictions. Regional bikeway planning supports the goals contained in existing countywide transportation plans, such as the Long Range Transportation Plan, OCTA Commuter Bikeways Strategic Plan (CBSP), and the 2012 Orange County Sustainable Communities Strategy (2012 OC SCS). These goals are interrelated and include expanding travel choices, improving safety, and supporting the viability of bicycle transportation. 1
6 OCTA - Orange County Transportation Authority ES.2 COLLABORATIVE EFFORTS Preparation of this report was a collaborative effort between OCTA, local agencies, active transportation stakeholders, and the general public. The process for facilitating discussions between the various stakeholders is detailed below. A project development team (PDT) was organized with planning and engineering representatives from each local jurisdiction (county and city) within the study area. These include the County of Orange, and the cities of Anaheim, Irvine, Orange, Tustin, Villa Park and Yorba Linda. The California Department of Transportation (Caltrans) District 12, Transportation Corridor Agencies (TCA), OCTA staff, and the project consultant team also participated on the PDT. The PDT met over four times to discuss project goals and objectives, opportunities and constraints, preliminary corridor alignments, and draft ranking criteria. Focus group meetings were conducted with smaller working groups of PDT representatives. During the focus group meetings, large-format maps were printed for brainstorming potential bikeways corridors. The boards presented information to help frame bikeways demand, needs, and opportunities. This included the identification of flood control channels and rail corridors, the transportation network, existing and proposed bikeways, major destinations, and other key features for consideration and collaborative brainstorming. Two community roundtable discussions were held to provide an opportunity for public input on the project. The first roundtable occurred in June A presentation on the planning process and the development of the draft regional bikeway corridors was provided. Attendees were grouped around several cafe-style tables and provided with large format map graphics. Two project team staff were assigned to each table to facilitate the discussion and record comments. Approximately 50 attendees included public stakeholders from the bicycle advocacy, health, safety, and social justice sectors, bicycle shop owners, as well as elected officials and community residents. The second roundtable occurred in September 2015 and was attended by approximately 50 people. A presentation described the attributes of each of the eleven corridors and key changes since the first roundtable. The OCTA Board Chairman Jeffrey Lalloway led a question-and-answer session. The discussion focused on systemic planning and engineering issues as well as implementation and funding. Promotion of the roundtables was conducted by means of direct s to over 1,000 stakeholders, advertisements on OCTA and city websites, the OCTA On the Move blog, and social media. Study updates were regularly provided to the OCTA Citizens Advisory Committee, representatives from the Orange County Council of Governments, and on a dedicated webpage on OCTA s website ( that included a project overview, study documents, meeting dates, and contact information. OCTA s social media & On the Move blog provided information for meetings & public participation opportunities ( net/oc-foothills-bikeways-planningmoves-forward). 2
 asking respondents their level of bicycling comfort, presented as a fun what type of bike are you? quiz, in order to gather input about their bicycling preferences and frequency.")
7 OC Foothills Bikeways Strategy Roundtable attendance in June 2015 (above) and September 2015 (below) An initial questionnaire was promoted online and distributed at various tabling events (described below) asking respondents their level of bicycling comfort, presented as a fun what type of bike are you? quiz, in order to gather input about their bicycling preferences and frequency. Almost 300 questionnaires were completed. A second questionnaire was distributed online and at the second roundtable to solicit feedback on the proposed corridors. It included a map of the proposed corridors and participants were asked to rank the top three corridors. There were 150 questionnaires completed. Input was sought at a series of table events. The tabling events were held at various locations throughout the study area including the following: Irvine National Night Out Irvine Ride of Silence Jeffrey Open Space Trail event OC Public Works Open House OC Parks Summer Concerts OCTA Bike Festival and Bike Rally Santa Ana River Trail Villa Park Bike Rodeo A sticker survey board was used to gather input on what makes bicycling challenging and ipad stands provided participants with the option to take the bike quiz. 3


8 OCTA - Orange County Transportation Authority ES.3 REGIONAL CORRIDORS As shown in Figure ES.1, a total of 11 regional bikeway corridors are proposed to help improve the viability of bicycling and cross-jurisdictional bikeway connectivity throughout the foothills of Orange County. The proposed corridors are consistent with the regional bikeway corridors established in the neighboring areas and between major points of interest. These corridors are comprised of existing, upgrades to existing, and new proposed bikeway segments. The exact corridor alignments may change upon more detailed analysis during the feasibility study phase. For example, corridors may be realigned to use parallel or adjacent streets that provide a more feasible route. The proposed corridors and corridor alignments evaluated in this Strategy are the following: Corridor A Regional Parks Connector: This bikeway corridor serves three major parks Yorba Regional Park, Irvine Regional Park, Peters Canyon Regional Park and feeds into three of the County s most popular trails: Santiago Creek Trail, Peters Canyon Trail, and the Santa Ana River Trail. While mostly a recreational connection, the existing connections between these areas are on higher-stress facilities, with needs for safety improvements. Corridor B Lakeview San Diego Creek: With high travel demand, this corridor provides intermodal connectivity with the Anaheim Canyon Metrolink Station, access to major employment centers in the Anaheim Canyon and Irvine Business Center areas, as well as to major shopping and entertainment centers: The Village at Orange, Old Town Tustin, and the future Yorba Linda Commons town center. There are an estimated 25 schools served by the proposed corridor, which also has strong public support and provides gap closures. 4
9 OC Foothills Bikeways Strategy Corridor C Cambridge Portola: This corridor is an opportunity for a continuous, lower stress, flat north-south connection, with an estimated 26 schools directly adjacent to the proposed corridor. Most of the bikeway corridor is in place today, and the next step will be to seize on an opportunity for enhancements to create protected facilities for bicyclists. Corridor D Taft Corridor: This corridor provides a connection between the Santa Ana River and Santiago Creek trails, and serves as an alternative to Katella Avenue a higher stress, higher collision street while helping bicyclists avoid the SR-55 freeway ramps. Corridor E Walnut Chapman: Both Corridors D and E have similar characteristics providing a connection between the Santa Ana River and Santiago Creek trails and helping bicyclists avoid the SR-55 freeway ramps. Corridor E serves as an alternative to Chapman Avenue. Corridor F Santiago Canyon: This corridor aligns with a popular recreational bicycling route for avid cyclists: while there are not as many collisions along this corridor, curves and high traffic speeds create the potential for more severe collisions. Corridor G Old Town Great Park: This corridor connects to Tustin s downtown area, the marketplace, as well as the OC Great Park, all while serving bicyclists crossing the I 5 and SR-55 freeways. The corridor provides a less stressful option than biking on Irvine Blvd, and also serves a range of socioeconomic areas. Corridor H Warner Edinger: Providing intermodal connectivity with the Irvine and Tustin rail stations and The District at Tustin Legacy, this corridor would require a new bridge, but the ratio of benefits to cost is strong. Corridor I Laguna Canyon Irvine Station: This corridor connects bicyclists from Laguna Canyon Road to the Irvine rail station, while serving the Irvine Spectrum - a major employment, shopping, and entertainment center, and would also help bicyclists get to the OC Great Park. There are strong safety needs, as it aligns along higher speed streets and is constrained at multiple freeway crossings. Corridor J Jeffrey Corridor: This corridor has strong trip demand and requires only one significant gap closure to complete a corridor that would provide a primarily off-street connection to many destinations, such as UCI, Mason Regional Park, and Irvine Valley College. Corridor K Bastanchury Corridor: This corridor feeds into the El Cajon and Santa Ana River trails, and has strong safety needs with higher speeds on Bastanchury Road. 5
10 OCTA - Orange County Transportation Authority Table ES.1: Corridor Miles, Cost Estimate, and Population Served New/ Enhanced Bikeways and Trails (miles) People Served within ¼ Mile (thousands) Total Corridor Project Cost Corridor Length (miles) (millions) A: Regional Parks Connector $ B: Lakeview San Diego Creek $ C: Cambridge Portola $ D: Taft Corridor $ E: Walnut Chapman $ F: Santiago Canyon $ G: Old Town Great Park $ H: Warner Edinger $ I: Laguna Canyon Irvine Station $ J: Jeffrey Corridor $ K: Bastanchury Corridor $ TOTAL $ ,159 6
11 OC Foothills Bikeways Strategy Figure ES.1: Corridor Overview Map BREA CHAPMAN BRISTOL EDINGER PLACENTIA CIVIC CENTER MACARTHUR MELROSE 57 b ORANGE LA VETA WARNER MAIN BATAVIA Santa Ana River Trail COLLINS 5 BATAVIA 55 DYER VALENCIA GLASSELL b b SANTA ANA CHESTNUT GLASSELL TAFT JAMBOREE!(D UNIVERSITY MEATS CAMBRIDGE ALTON b TUSTIN KATELLA WALNUT RED HILL VON KARMAN 405 YORBA LINDA!(B CHAPMAN BUENA VISTA MAIN UNIVERSITY CAMPUS BASTANCHURY WANDA!(H MICHELSON LA PALMA VILLA PARK TAFT FAIRHAVEN Santiago Creek Trail BARRANCA HOLT WALNUT CULVER LAKEVIEW NOHL RANCH VILLA PARK BRYAN NEWPORT b HARVARD!(E!(G!(K SANTA ANA CANYON VIA ESCOLA ESPLANADE TUSTIN RANCH San Diego Creek Trail El Cajon Trail LA COLINA YORBA LINDA ANAHEIM TUSTIN!(J COUNTY SANTIAGO CANYON CHAPMAN CANYON VIEW Peters Canyon Trail 5 BRYAN YALE 261 Option A TRABUCO IRVINE CENTER FAIRMONT Option B!(C 91 IRVINE!(A SERRANO I Proposed JEFFREY IRVINE RIDGE VALLEY WEIR CANYON 241 MARINE WAY PORTOLA 133 b OC Foothills Corridors ALTON!(F!(A!(B!(C!(D!(E!(F!(G!(H!(I!(J 241!(K Corridor Facilities Existing!(I Regional Parks Connector Lakeview - San Diego Creek Cambridge - Portola Taft Corridor Walnut - Chapman Santiago Canyon Old Town - Great Park Warner - Edinger Laguna Canyon - Irvine Station Jeffrey Corridor Bastanchury Corridor Potential New/Enhanced Facilities Regional Trails Existing Proposed Connection to Bikeways Corridor *Options A & B through Peters Canyon Regional Park area are pending detailed study by OC Parks. COUNTY PORTOLA SANTIAGO CANYON LAGUNA CANYON MUIRLANDS FORD 73 CULVER BONITA CANYON BAKE LOS ALISOS Miles EL TORO 7
12 OCTA - Orange County Transportation Authority ES.4 CORRIDOR EVALUATION Each corridor was evaluated using criteria consistent with various competitive grant programs, building on criteria specified in Orange County Supervisorial: 2009 CBSP, and the Orange County Supervisorial Districts 1 & 2, District 4, and District 5 Bikeways Strategy reports. The criteria used for the OC Foothills Bikeways Strategy consider a range of opportunities, constraints, and other factors affecting demand and feasibility including the following: Safety Needs (measured by Level of Traffic Stress metric and reported collisions) Public Support Trip Demand Ease of Implementation (physical constraints such as roadway width or parking) Bikeway Completion (both the corridor in question and the wider network) Cost per Benefit (economic efficiency) Serves Disadvantaged Areas Avoids Steep Hills Figure ES.2 summarizes the evaluation, intended to help provide context for each corridor in light of different potential funding sources and community priorities. The first table shows each corridor and how it fares in each evaluation criteria category, shown as round ideograms known as Harvey Balls that represent a rating on a scale of 1 (lowest rating, blank circle) to 5 (highest rating, black-filled circle). The second table shows the evaluation criteria categories and groups the corridors that achieve the same score for each category; for example, Corridors D, E, and F have the highest rating (black-filled circle) for Safety Needs. 8
13 OC Foothills Bikeways Strategy Figure ES.2: Corridor Evaluation Lower Higher Safety Needs Public Support Trip Demand Ease of Implementation Bikeway Completion Cost per Benefit Serve Disadvantaged Areas Avoids Steep Hills A. Regional Parks Connector B. Lakeview-San Diego Creek C. Cambridge-Portola D. Taft Corridor E. Walnut-Chapman F. Santiago Canyon G. Old Town-Great Park H. Warner-Edinger I. Laguna Canyon-Irvine Station J. Jeffrey Corridor K. Bastanchury Corridor Corridor Scoring Summary Higher..... Lower Safety Needs Public Support Trip Demand D, E, F B, F G, J A, B, C, G, I, J, K H A, C G, I H, J D, E, K B, E D, I Ease of Implementation G, J C, H C, H Bikeway Completion A, C, G Cost per Benefit A, F, K A, F, I D, F A, F, K G, I Serve Disadvantaged Areas Avoids Steep Hills D, E B, J D, E D, G D B, K I, K H, J E, H B, C B, E C, H I, J C, G, H, I B, J A, F, K A, E, F, K 9


14 OCTA - Orange County Transportation Authority ES.5 ACTION PLAN OCTA and the local jurisdictions will continue to work together to advance concepts along the regional bikeway network. There are numerous opportunities along the proposed regional bikeway corridors for early action efforts. Potential actions that could be taken in the near term include: more-detailed evaluation, neighborhood outreach, grant funding pursuit, and final design. The following specific projects are a few examples of early action projects already in the pipeline or ready to be advanced: Corridor A: Fairmont Bridge: This concept requires a bridge crossing over the 91 freeway and the Santa Ana River at Fairmount Avenue. This will connect Anaheim Hills with the bikeway along the north bank of the river. The City of Anaheim identified this, and other bridges, to better connect the hills with the river trail. Having this bridge in both the City bike plan and the regional study will strengthen its funding eligibility. A concept for the bridge is shown, but early actions will focus on securing money to plan and design the bridge. Corridor F: Santiago Canyon Road Safety Improvements: Currently, Santiago Canyon Road serves the canyon communities, but is also very popular with motorists, motorcyclists and bicyclists who enjoy the natural scenic beauty hard to find elsewhere in Orange County. The County of Orange has already pursued funding for general safety improvements but this is now another tool to strengthen their next pursuit of funds for more safety improvements to serve all users. Improvements could include a buffered bike lane, enhanced warnings for curves such as flashing beacons and reflective markers, and surface treatments for high friction. Example Bridge Concept Existing Santiago Canyon Road 10

 along Corridor J.")
15 OC Foothills Bikeways Strategy Corridor G: Tustin Main Street: Aligned with efforts by the City of Tustin, Corridor G could benefit from a redesign of Main Street in front of the Civic Center leading into the Downtown. Improvements on Main Street could include wider sidewalks, bike lanes, a landscaped median, and a gateway arch to link the Civic Center area with Old Town. These ideas have already been reviewed at the City of Tustin, and the regional bikeway study helps build momentum for this positive change. Main Street Tustin Concept Sketch Corridor J: JOST Bridge: Another project with a lot of momentum is the Jeffrey Open Space Trail (JOST) along Corridor J. Creation of a bridge over Interstate 5 (I-5) will allow the communities north of the I-5 to link to Irvine Valley College, and to the existing bridge over Interstate 405 (I-405) and points south. As with the Fairmont Bridge concept in Anaheim, having this bridge idea in the regional study will strengthen its funding eligibility. The existing I-405 shared use path bridge on the JOST is shown at right as an example. Example Bridge Concept Non-infrastructure bicycle programs, such as education, encouragement (public outreach), enforcement and evaluation (four of the Five Es of bicycle planning with the fifth being engineering), work together through policy development and engineering implementation to enhance the bicycle network for all users. Therefore, programmatic efforts are also recommended for early action and described in more detail in this Strategy (Chapter 4) to complement the infrastructure recommendations associated with the proposed corridors. 11
16 OCTA - Orange County Transportation Authority ES.6 BICYCLE FACILITY TOOLKIT In order to assist with the selection and design of bicycle facilities, a toolkit of best practices for bikeways design is included in Chapter 5. The toolkit pulls together best practices from public agencies and municipalities nationwide. Each section includes important design information and discussion, example photos, schematics (if applicable), and existing summary guidance from current or upcoming draft standards. Existing standards are referenced throughout and should be the first source of information when seeking to implement any of the treatments featured. ES.7 FUNDING STRATEGIES Funding assistance can be provided through federal, state, and local government agency programs aimed at improving bicycle infrastructure. It is important that communities are made aware of funding sources and that the proper procedures are followed to maximize the chances of success in applying for grants. Because only a portion of public transportation funding is allocated toward bicycle policy development and infrastructure, there is strong competition between jurisdictions to successfully secure funding. Most federal and state funding sources require that funds be matched by state and/or local municipalities. To facilitate the acquisition and coordination of funding, a full-time bicycle (or active transportation) coordinator with extensive knowledge of funding sources is often appointed. Coordinators should also have a strong capability to develop a competitive proposal, specifying the project details, jurisdictional needs, and opportunities for bicycle improvements. A summary table by funding source type has been provided with details regarding eligibility, use and requirements associated with funding sources (Chapter 6). 12
.")
17 OC Foothills Bikeways Strategy 1.0 INTRODUCTION This report summarizes the results of a collaborative effort to identify and prioritize potential bikeways throughout the foothills area of Orange County (Supervisorial District 3). The objective of the OC Foothills Bikeways Strategy (Strategy) is to coordinate planning and funding efforts between jurisdictions for implementing regionally-beneficial bikeways that serve a broad range of bicyclists and skill levels. Through an extensive collaborative process between local agencies and community stakeholders, 11 regional bikeway corridors were identified and studied. 1.1 BACKGROUND The OC Foothills Bikeways Strategy was developed as part of OCTA's regional bikeways planning process involving OCTA, local jurisdictions, and public stakeholders. This process began in 2011 with a pilot effort for Supervisorial District 4 in northern Orange County, then for Supervisorial Districts 1 & 2 in central and western Orange County in 2012, and most recently for Supervisorial District 5 in south Orange County. The OC Foothills Bikeways Strategy is funded by a federal grant received by the Orange County Council of Governments (OCCOG), with a 20% match provided by the Orange County Transportation Authority (OCTA). Figure 1.1 illustrates the OC Foothills Bikeways Strategy study area which aligns with the Orange County Supervisorial District 3 boundary. Figure 1.1 OC Foothills Study Area 13
18 OCTA - Orange County Transportation Authority Regional bikeway planning efforts support the goals contained in existing countywide transportation plans, such as OCTA s Long Range Transportation Plan and the 2012 Orange County Sustainable Community Strategy. These goals include expanding travel choices, improving safety, and supporting the viability of bicycle transportation. The Strategy also builds on OCTA s 2009 Commuter Bikeways Strategic Plan (CBSP) which outlines OCTA's roles in bikeways planning, as follows: Suggesting regional priorities for optimal use by local jurisdictions Assisting in coordinating plans between jurisdictions Providing planning and design guidelines Participating in outreach efforts to encourage bicycle commuting The CBSP outlines "regional priority locations" around the county including: colleges and universities, transportation centers, and major employment areas. These regional priority areas served as the basis for developing the potential District 3 regional bikeway corridors. While this planning process has been initiated and coordinated by OCTA, local jurisdictions will bring projects from concept to construction, through coordination with Caltrans and OCTA as needed. 1.2 COLLABORATIVE EFFORTS Preparation of this report was a collaborative effort between OCTA, local agencies, active transportation stakeholders, and the general public. The process for facilitating discussions between the various stakeholders is detailed below. A project development team (PDT) was organized with planning and engineering representatives from each local jurisdiction (county and city) within the study area. These include the County of Orange, and the cities of Anaheim, Irvine, Orange, Tustin, Villa Park and Yorba Linda. The California Department of Transportation (Caltrans) District 12, Transportation Corridor Agencies (TCA), OCTA staff, and the project consultant team also participated on the PDT. The PDT met over four times to discuss project goals and objectives, opportunities and constraints, preliminary corridor alignments, and draft ranking criteria. Focus group meetings were conducted with smaller working groups of PDT representatives. During the focus group meetings, large-format maps were printed for brainstorming potential bikeways corridors. The boards presented information to help frame bikeways demand, needs, and opportunities. This included the identification of flood control channels and rail corridors, the transportation network, existing and proposed bikeways, major destinations, and other key features for consideration and collaborative brainstorming. Two community roundtable discussions were held to provide an opportunity for public input on the project. The first roundtable occurred in June A presentation on the planning process and the development of the draft regional bikeway corridors was provided. Attendees were grouped around several cafe-style tables and provided with large format map graphics. Two project team staff were assigned to each table to facilitate the discussion and record comments. Approximately 50 attendees included public stakeholders from the bicycle advocacy, health, safety, and social justice sectors, bicycle shop owners, as well as elected officials and community residents. The second roundtable occurred in September 2015 and was attended by approximately 50 people. A presentation described the attributes of each of the eleven corridors and key changes since the first roundtable. The OCTA Board Chairman Jeffrey Lalloway led a question-and-answer session. 14

19 OC Foothills Bikeways Strategy Roundtable attendance in June 2015 (above) and September 2015 (below) The discussion focused on systemic planning and engineering issues as well as implementation and funding. Promotion of the roundtables was conducted by means of direct s to over 1,000 stakeholders, advertisements on OCTA and city websites, the OCTA On the Move blog, and social media. Study updates were regularly provided on a dedicated webpage on OCTA s website: net/ocfoothills that included a project overview, study documents, meeting dates, and contact information. OCTA s social media & On the Move blog provided information for meetings & public participation opportunities ( An initial questionnaire was promoted online and distributed at various tabling events (described below) asking respondents their level of bicycling comfort, presented as a fun what type of bike are you? quiz, in order to gather input about their bicycling preferences and frequency. Almost 300 questionnaires were completed. A second questionnaire was distributed online and at the second roundtable to solicit feedback on the proposed corridors. It included a map of the proposed corridors and participants were asked to rank the top three corridors. There were 150 questionnaires completed. 15
20 OCTA - Orange County Transportation Authority Input was sought at a series of table events. The tabling events were held at various locations throughout the study area including the following: Irvine National Night Out Irvine Ride of Silence Jeffrey Open Space Trail event OC Public Works Open House OC Parks Summer Concerts OCTA Bike Festival and Bike Rally Santa Ana River Trail Villa Park Bike Rodeo A sticker survey board was used to gather input on what makes bicycling challenging and ipad stands provided participants with the option to take the bike quiz. What makes bicycling challenging? 16
21 OC Foothills Bikeways Strategy 1.3 LOCAL AGENCY IMPLEMENTATION While OCCOG and OCTA have commissioned this report, the implementation of specific bikeway corridors will be led by the agencies that have jurisdiction. In most cases this will be the cities or County, and some roadways are managed by Caltrans, particularly at freeway interchanges. Additionally, the cities or the County may need to coordinate with various landowners such as utility companies, rail operators, and OCTA for right-of-way acquisition. OCTA will continue to promote the implementation of regional corridors, but final design, construction, and maintenance of the corridor will be coordinated and conducted by the respective jurisdictions. 1.4 BIKEWAYS CLASSIFICATIONS Throughout this report, reference is made to the following four categories of bikeways defined by Caltrans: Class I - Off-Street Shared-Use Paths: Paved facilities on a separate right-of-way from roadways for the exclusive use of bicyclists, pedestrians and other non-motorized users. Class II - On-Road Bicycle Lanes: A striped lane for one-way bicycle travel on a roadway adjacent to automobile lanes. Class III - On-Road Shared Signed Bicycle Routes: A signed on-street route where bicycles and vehicles operate in the same travel lane. Class IV Bikeways - Separated Bikeways: A bikeway for the exclusive use of bicycles and includes a separation required between the separated bikeway and the through vehicular traffic. The separation may include, but is not limited to, grade separation, flexible posts, inflexible posts, inflexible barriers, or on-street parking. 17
22 OCTA - Orange County Transportation Authority 2.0 EXISTING CONDITIONS 2.1 CONTEXT The earliest intensive land uses in modern Orange County were increasingly larger-scale agricultural efforts, with their supporting facilities and infrastructure proliferating through the area in the late 19th and the early 20th century. The OC foothills was afterwards developed as a series of planned communities, steadily increasing over the last 40 years. The foothills land uses continued to develop with notes from its agrarian past. Land use types are largely separate still, changing from the activity centers along the riparian habitats, to commercial, retail, and then residential sites occupying the old groves, lightly receding into the hills. At this stage, the area is mostly built-out, or in advanced planning stages, with local planning documents in place to guide future redevelopment efforts within each foothill jurisdiction. As a result of these varied developments occurring both in specific periods and unique geographies, there is no one-size-fits-all approach to implementing this bikeway network in the foothills. Newer mixed-use developments are being introduced in Anaheim, Tustin, and Irvine, short distances away from larger residential tracts and multi-family units, but connected with a growing network of greenbelts and trails. Other areas look to the compact and imminently walkable pre-war downtowns of Orange and Tustin as a model for future growth. During the post-war period of incremental growth, land use and transportation decisions have primarily focused on a network of roadways which have been designed to efficiently move motor vehicles into, around, and out of the foothills communities. The foothills roadways are, generally, wider and more circuitous than in western Orange County. Throughout these decades of development, roadway design and construction practices have gradually provided more separation for an ever-increasing number of bicyclists and pedestrians sharing these facilities. As a result, the foothills have a range of roadway typologies, and these might be seen as a work in progress, adapting to the needs of a growing, shifting population relying on a continuously evolving public right-of-way. Many were designed with Class II bike lanes, which creates a separate space for bicyclists to travel in the roadway. Bicyclists riding in these striped lanes often act as buffers between, on one side the swiftly moving, and on the other stationary, motor vehicles. These roads predominantly have higher posted speed limits, wider travel lanes, and more significant elevation change, as they extend through low-density foothills communities where housing is widely separated from commercial centers. This land use pattern often results in longer trips, and the lower densities consequently result in fewer job opportunities near residential communities. The higher vehicle speeds and wider roads result in more challenges for bicyclists desiring to share and cross the roadways. Nonetheless, as the current practice of roadway design evolves, many opportunities can be found for improvement, in this Strategy s toolkit. These modifications will result in safer streets, inviting a range of users to travel by bicycle along routes that they would not currently consider. The greatest gains can be achieved by restriping and repurposing these older roadways, designed in the last 40 years to better provide foothills residents with connections to their neighborhood shopping centers, schools, parks, and with improved access to transit stations serving points beyond. The Strategy identifies corridors that course through all portions of the OC Foothills area. They are intended to be designed for, and used by, bicyclists of all skill levels. These corridors have been selected to connect with bikeways in neighboring cities and districts which, within those boundaries, will connect to major points of interest, including employment and retail centers. This effort will require coordination among associated entities to implement. 18
23 OC Foothills Bikeways Strategy 2.2 RATIONALE Improving the bicycling environment for people of all ages and abilities has a multitude of benefits including health, economic, environmental, safety, space efficiency, and equity. There is evidence that bicycling is good for individuals, businesses, cities, and society as a whole. Safety Safety concerns are a primary reason to improve bicycle infrastructure. Although the incidence of crashes involving bicycles may be low, concerns about safety have historically been the single greatest reason people do not commute by bicycle, as captured in polls as early as Planning for safety requires accommodating pedestrians, bicyclists, and motorists as they share space on the street. Studies have shown slower motor vehicle speeds significantly increase survival rates for both pedestrians and people riding bicycles involved in collisions with motorists. At 20 mph, a pedestrian or cyclist has a 95% survival rate, compared with survival rates of 55% and 15% at 30 mph and 40 mph respectively. Strategies that attract bicycle riders, including creating bicycle friendly streets that make it comfortable for the average person to ride a bicycle, are the same ones that improve safety for all road users. Affordability Bicycling is one of the most affordable means of transportation available to Orange County residents. Nationally, the average annual operating cost of a bicycle is $308, compared to $8,220 for the average car.2 Replacing auto trips with bicycling offers immediate financial benefit for households, and providing bicycle facilities appropriate for people of all ages and abilities can help make that choice a reality. Physical and Mental Health Physical activity is indisputably effective in the primary and secondary prevention of cardiovascular disease, diabetes, cancer, and other related chronic diseases. Public health professionals support active transportation as a means of improving these and other health outcomes related to the obesity epidemic. The rapid rise in childhood obesity correlates with the nationwide drop in bicycling and walking to school over the last half century. Mental health and academic achievement are also improved by bicycling and walking, as children who walk or bicycle to school are more attentive and better able to concentrate in class. A study of more than 20,000 school-aged children found that by walking or bicycling to school, children s mental alertness was advanced by half a school year.3 Creating a bicycle network appropriate for all ages and abilities, and a built environment that encourages bicycling, will support efforts to improve healthy lifestyles. Economic Benefits There are many ways to consider the economic benefits of increased levels of bicycling. Nationally, bicycling makes up $133 billion of the US economy, funding 1.1 million jobs, and bicycle-related trips generate $47 billion nationally in tourism activity.4 In a number of cities, realtors report that good walking and bicycling access to neighborhood destinations and good bicycling facilities in general are important home selection criteria.5 Major employers and young, talented employees seek communities with good opportunities for active lifestyles and attractive urban amenities. Intercept surveys in Seattle, WA found that people arriving to retail stores on foot or by bicycle visit more frequently than those who drive, and spend more money over the course of a month.6 1Lou Harris Poll Bureau of Transportation Statistics. Pocket Guide to Transportation Egelund, Niels, Centre for Strategic Education Research at Aarhus University 4Flusche, Darren, for the League of American Bicyclists. The Economic Benefits of Bicycle Infrastructure Investments Cortright, Joe, for CEOs for Cities. Walking the Walk: How Walkability Raises Home Values in U.S. Cities Neighborhood Business District Access Survey. Intercept survey of neighborhood visitors. Seattle Department of Economic Development
 in fossil fuel burning vehicles and reducing greenhouse gas (GHG) emission intensity per mile traveled will improve and protect Orange County s natural")
24 OCTA - Orange County Transportation Authority Environmental Benefits Transportation is a significant source of air, water, and carbon pollution. Reducing vehicle miles traveled (VMT) in fossil fuel burning vehicles and reducing greenhouse gas (GHG) emission intensity per mile traveled will improve and protect Orange County s natural environment while reducing carbon emissions. A bicycle commuter who rides four miles to work, five days a week, avoids 2,000 miles of driving and about 2,000 pounds of carbon dioxide emissions each year, which is approximately 5% of the average American s carbon footprint ( Expanding and enhancing active transportation opportunities are a highly cost-effective approach to meeting the goals of the State s Assembly Bill 32 (Global Warming Solutions Act of 2006) and Senate Bill 375 (Sustainable Communities and Climate Protection Act of 2008), as well as protecting the Foothills area s unique natural environment. Space Efficiency There simply is very limited space to add traffic lanes to meet increasing travel demands, reduce congestion, or increase parking in the public right-of-way. Both vehicles and bicycles usually carry a single person, but bicycles take up much less space. Planning for bicycles may permit a better use of the resources available to accommodate additional trips. To take advantage of this will require a realignment of priorities in how space is allocated and resources are invested (see Figure 2.2). Increasing the number of people riding bicycles will help optimize the use of limited urban space and create safer streets for all. Figure 2.2: Moving 55 People by Car, Bus, and Bicycle on Roadway Source: FHWA. Summary of Travel Trends: 2009 National Household Travel Survey
.")
25 OC Foothills Bikeways Strategy Equity According to the American Community Survey (U.S. Census Bureau), 4.6% of Orange County households have no motor vehicle available for use. Specifically in the OC Foothills study area the number is 3.5% of households, but there are a few census tracts with significantly higher percentages (see Figure 2.3). Furthermore, many residents are too young to drive; are incapable due to age, illness, or disability; are unable or unwilling to afford the costs of owning and operating a car; or for other reasons are simply unfit or unwilling to drive. Transportation choices for these residents may include walking, riding a bicycle, taking transit, or carpooling. This Strategy strives to provide access to good bicycling infrastructure in parts of the Foothills and the County with lower car ownership. Figure 2.3: Car Ownership in Orange County Feasibility Study Segments & Bus Tour COMMONWEALTH MACARTHUR PLACENTIA MELROSE 57 "b ORANGE "b LA VETA WARNER MAIN BATAVIA Santa Ana River Trail COLLINS BATAVIA DYER VALENCIA GLASSELL "b SANTA ANA CHESTNUT GLASSELL TAFT JAMBOREE!(D ALTON MEATS CAMBRIDGE 17TH UNIVERSITY RED HILL IMPERIAL "b ANAHEIM TUSTIN KATELLA WALNUT VON KARMAN SANTIAGO SANTA CLARA YORBA LINDA!(B UNIVERSITY CAMPUS BASTANCHURY!(H LAKEVIEW SANTA ANA CANYON 55 YORBA FAIRHAVEN YORBA MAIN ARMSTRONG BARRANCA BUENA VISTA WANDA LA VETA MICHELSON PROSPECT PROSPECT TAFT CHAPMAN HOLT CULVER NOHL RANCH VILLA PARK ESPLANADE WALNUT LAKEVIEW HEWES NEWPORT TUSTIN RANCH El Cajon Trail "b LA PALMA VIA ESCOLA VILLA PARK Santiago Creek Trail HARVARD!(J!(E FOOTHILL BRYAN San Diego Creek Trail!(G!(K CANNON LA COLINA SANTIAGO CANYON CHAPMAN TUSTIN 5 COUNTY Proposed Foothills Corridors A: Regional Parks Connector B: Lakeview - San Diego Creek C: Cambridge - Portola YORBA LINDA D: Taft Corridor E: Walnut - Chapman F: Santiago Canyon CANYON VIEW BRYAN Peters Canyon Trail YALE TRABUCO IRVINE CENTER SAND CANYON 261!(C BARRANCA FAIRMONT!(A SERRANO JEFFREY G: Old Town - Great Park 91 H: Warner - Edinger I: Laguna Canyon - Irvine Station IRVINE IRVINE TOWNGATE RIDGE VALLEY TECHNOLOGY MARINE WAY WEIR CANYON PORTOLA "b K: Bastanchury Corridor Existing Bikeways Strategy Corridors Regional Trails Existing Proposed Existing Bikeway Network Class I Bikeway Class II Bikeway Class III Bikeway % Occupied Housing Units with No Vehicles Available 0-1.9% % % % % 2/9/2016 JEFFREY ALTON!(F!(I J: Jeffrey Corridor COUNTY PORTOLA SANTIAGO CANYON SANTA MARGARITA LAGUNA CANYON MUIRLANDS FORD I 73 CULVER BONITA CANYON Miles BAKE EL TORO LOS ALISOS 21
26 OCTA - Orange County Transportation Authority Changes in Transportation Behavior Auto ownership and use is dropping in the United States, particularly among young people who are becoming drivers later in life and owning fewer vehicles per household. This seems to be in part due to costs of ownership and operation, trip convenience, concern for the environment, personal health concerns, or for the pure joy and fun that it is to ride a bicycle. This is often a lifestyle choice, made possible by home and employment location decisions. Existing and future active and shared travel options, such as transit, car sharing, walking, and bicycling, provide viable travel alternatives to the car. 2.3 ACTIVITY LEVELS AND COLLISION ANALYSIS BICYCLE COMMUTE MODE SHARE According to the American Community Survey (U.S. Census Bureau), about 1% of Orange County's population commutes by bicycle, which is similar to that of the state, while the national average is 0.6%. The vast majority of commuters (almost 80%) get to work by driving alone; see Figure 2.4. Figure 2.5 illustrates the bicycle commute mode share for cities in District 3 which ranges between 0% and 2.4%. Figure 2.4: Commute Mode in Orange County Other Means 1% Work from Home 5% Bike 1% Walk 2% Transit 3% Carpool 10% Drive Alone 78% Source: US Census Bureau 22
27 OC Foothills Bikeways Strategy Figure 2.5: Bicycle Commute Mode Share by City Source: US Census Bureau: American Community Survey, 5-Year Estimates Note: Only the tracts within Supervisorial District 3 of Irvine This mode share data shows how automobile-dependent Orange County currently is and why many of the streets and freeways are at, or close to, maximum capacity. The Orange County Projections, produced by the Center for Demographic Research, estimates Orange County s 2013 population of 3.14 million to grow by more than 19% by 2035, which will put more demand on transportation infrastructure; see 2014 Long Range Transportation Plan ( Developing the regional bikeway network envisioned in the Strategy report will provide Orange County residents with additional mobility choices and improve access to transit and other key destinations ESTIMATED COMMUTER AND UTILITARIAN BICYCLISTS A key goal of this Strategy is to maximize the number of bicyclists in order to recognize the multiple benefits of less traffic congestion, improved health, and maintenance of ambient air quality levels. In order to achieve this goal, a better understanding of the number of existing bicycle trips is needed. The U.S. Census provides useful data for understanding bicycling rates across different populations and geographies, as shown in Figures 2.4 and 2.5, but only reports the primary mode which residents use for commuting to and from work. The American Community Survey estimates that there were 14,773 Orange County residents that commuted to and from work by bicycle in The following estimates include additional utilitarian bicycle trips-- those transportation trips made for daily activity like shopping or going to school -- by populations other than adults commuting to work. Table 2.1 displays the results of a model that uses specific data from U.S. Census, National Safe Routes to School survey data, and Federal Highway Administration college commute survey information to estimate the total number of bicycle trips being made for all commute and utility purposes in District 3. As shown in Table 2.1, estimations for total daily trips by bicycle in District 3 could be as high as 55,000. It is important to note that this is simply an order-of-magnitude estimate, an extrapolation based on available data. 23
28 OCTA - Orange County Transportation Authority Table 2.1: Bicycle Trends in District 3 Variable Value Source Existing Employed Population 429, ACS, B Year Estimates Existing Bike-to-Work Mode Share Existing Number of Bike-to-Work Commuters Existing Work-at-Home Mode Share Existing Number of Work-at- Home Population Existing Number of Work-at- Home Bicyclists Existing Transit-to-Work Mode Share Existing Transit-to-Work Commuters Existing Transit Bicycle Commuters Existing School Children, Ages 5-14 (Grades K-8) Existing School Children Bike Mode Share Existing School Children Bike Commuters Existing Number of College Students Existing College Bicycling Mode Share 0.8% ACS, B Year Estimates 5, ACS B Year Estimates (excludes all other means) 3.9% ACS, B Year Estimates 16,770 (Existing Employed Population) x (Existing Work-at-Home Mode Share) 838 Assumes 5% of population working at home makes at least one daily bicycle trip 2.2% ACS, B Year Estimates 9, ACS B0B Year Estimates 487 Assumes 5% of transit riders access transit by bicycle 56, ACS, B Year Estimates 2.0% National Safe Routes to Schools surveys, ,132 (Existing School Children) x (Existing School Children Bicycling Mode Share) 79, ACS, B Year Estimates 25.0% National Bicycling & Walking Study, FHWA, Case Study No. 1, 1995) Existing College Bike Commuters 19,896 (Existing Number of College Students) x (Estimated College Bicycling Mode Share) Existing Total Number of Bike Commuters 27,875 Total bike-to-work, school, college and utilitarian trips. Does not include recreation TOTAL DAILY BICYCLING TRIPS 55,750 Total bicycle commuters x 2 (for round trips) 24
29 OC Foothills Bikeways Strategy COLLISION ANALYSIS Safety is a major concern for both existing and potential bicyclists. A bikeway perceived as too dangerous or too close to heavy vehicular traffic will discourage the majority of cyclists from using that facility. Identifying bicycle collision patterns can assist in developing improvements or determining appropriate bicycle routes. Orange County is currently ranked 13th highest out of the 58 California counties in the number of reported bicyclist injuries and fatalities relative to daily vehicle miles traveled; the County is ranked 2nd highest when looking only at bicyclists under the age of This report analyzes reported bicyclist-involved crash data in District 3 from 2009 to 2013, obtained from the California Statewide Integrated Traffic Records System (SWITRS). Between January of 2009 and December of 2013, 4 bicyclists were struck and killed in District 3 according to SWITRS. Part of this study is identifying potential improvements that will help prevent or minimize these collisions and resulting fatalities. The analysis of bicyclist-involved crash data in District 3 from 2009 to 2013 shows there were 710 total crashes in the study area in the five-year period. Table 2.2 presents the total crashes in District 3 by violation category and party at fault. As shown in Figure 2.6, excluding "unknown causes" and not stated, over three-quarters of the crashes were the result of four major causes listed below: 1. Bicycle riding on the wrong side of the road represents 28% of all crashes (141 of 506). This is the number one cause of bicyclist-caused crashes and fatalities statewide. This is an area where the education of bicyclists can make a major difference in their safety. 2. Right-of-way violation also represents approximately 28% (140) of all crashes. A good example would be a car pulling out in front of a bicyclist. 3. The third is improper turning, which accounts for 10% (51) of all crashes. An example of this is when a motor vehicle driver or a bicyclist turns in front of the other. 4. The fourth is traffic signals and signs, typically meaning running stop signs and stop lights, accounting for 10% (48) of all crashes. Table 2.2 shows that the violation category with the most bicyclists at fault was riding on the wrong side of the road, while the violation category with the most drivers at fault was automobile right-of-way. This suggests a lack of education by both drivers and bicyclists on how to interact with other modes safely. Overall, bicyclists were cited at fault more often than drivers. 11 California Office of Traffic Safety,
30 OCTA - Orange County Transportation Authority Table 2.2: Bicycle Collisions in District 3, Violation Category Bicyclist At-Fault Motorist At-Fault Total* Total % Excluding Unknown Under the Influence % Unsafe Speed % Wrong Side of Road % Improper Passing % Unsafe Lane Change <1% Improper Turning % Automobile ROW % Pedestrian ROW <1% Pedestrian Violation <1% Traffic Signals and Signs % Lights <1% Other Hazardous Violation % Other Than Driver % Unsafe Starting or Backing % Other Improper Driving % SUBTOTAL % Unknown Not Stated TOTAL *Total is not sum of preceding columns, as it includes reported collisions with other objects or not stated 26

31 OC Foothills Bikeways Strategy Figure 2.6: Violation Category of Bicyclist- Involved Crashes, Figure 2.7: Bicyclist-Involved Crashes and Estimated Bicycling Commuters by Year Unsafe Speed All Others, excluding unknown/not stated Riding on Wrong Side of Road Traffic Signals/Signs Improper Turning Viola ng Automobile ROW Bicyclist-Involved Crashes Estimated Bicycling Commuters by Year RECENT AGENCY EFFORTS TO IMPROVE BICYCLE PLANNING & INFRASTRUCTURE Within District 3, there are a number of ongoing planning and engineering efforts being led by the cities to improve bicyclist safety, enhance infrastructure, and support increased bicycle usage. The planning of bicycle infrastructure through general plan updates or master planning has occurred in Orange, Anaheim, Irvine, Tustin, Yorba Linda, and the OC Parks. Many cities have applied for or obtained ATP Cycle I grant funds to implement new or improved bicycle facilities. Lower-cost bike facilities such as Class II bike lane striping have been implemented by many cities. A few notable bike design and construction projects recently completed by cities in District 3 include a portion of the Mountains to Sea Trail in Tustin (above), and the El Cajon Trail in Yorba Linda (below). These are just two examples where determined coordination and a vision combined to create a dedicated facility that creates connections for bicyclists of all skill levels. Both of these facilities are used to create connections and close the gaps, with proposed corridors linking them into a network of regional bikeways. 27


32 OCTA - Orange County Transportation Authority 3.0 REGIONAL BIKEWAY CORRIDORS As shown in Figure 3.1 and Table 3.1, 11 regional bikeway corridors are proposed for District 3. The corridors are connected and continuous, as they link with bike facilities in the neighboring Supervisorial Districts. The combined Orange County regional bikeway network provides key connections to regionallysignificant destinations including beaches, parks, schools, shopping centers, major employment centers, and transit centers. Regional corridors were developed through a series of PDT meetings and through public outreach to residents and stakeholders. The corridors were refined through a months-long process, and the progress can be seen in these iterative maps, below. Figure 3.1 Working Corridors Sketch corridors were identified during the March 2015 Upper and Lower Foothills PDT workshops BREA O TUSTIN SANTIAG WANDA ESPLANADE PROSPECT ace Trai l JEFF REY Sp en Trai l TER ANCA LEY VA L GE PO RID FR EY NY ON CA GA TE MA R INE 5 YON CAN b ON ALT IRL AN OS DS ALIS MU BAKE LOS BONIT A RTO LA! (I WA Y SA ER CULV 73 Op TUST HA RV AR D R LVE CU ND EE OR JAM B ISOS LOS AL CAMPUS IMO JERON ny on Pe ters Ca OR T WP IN RA NCH AR MA N RID G RO JEF YORBA PROSPECT YORBA NE ILL DH MS MAIN VO NK EV ALL EY FORD Jeffr ey CAMBRIDGE HEWES GLASSELL RE TR O NG JEFF EY JEFF R HOLT FAIRVIEW BRISTOL REY Cany on Pete rs N YO AN DC SAN LAKEVIEW VALENCIA SE ONW EALTH PLACEN TIA COMM MELRO Trail River Santa Ana BATAVIA GLASSELL HEWES ESPLANADE YORBA PROSPECT HOLT RT PROSPECT NEW PO NCH TUST IN RA NG RD VA HA R LVER CU CULV ER E BATAVIA WANDA TUSTIN YORBA L AR MST RO HIL RED RM AN KA OR EE Trai l H CEN BARR I-2! ( TY UNIVERSI 19T IRV INE IAGO SANT GLASSELL r Trail Ana Rive Santa BATAVIA GLASSELL MAIN VO N ERITE MAR GU IRV IN LAK EF OR LOS ALIS OS BAK E EST JAM B RID GE VA LLE Y SANTA VIT TORIA LAKEVIEW VALENCIA COMM ONWE ALTH PLACEN TIA MELROS E FAIRVIEW BRISTOL JEF FR EY EY JEF FR I AN YO N SA ND C LAGUNA CANYON TURTLE ROCK BATAVIA BLAC K ST AR CA NYO N F B RA N CH HA RV AR D YAL E CU LVE R LA CRE KE EK E JAM BO RE BIR CH EA STB LU FF CAMBRIDGE VILLAGE CENT ER OHIO KELLOGG HEWES PRO YORBA YORBA PROSPECT NE PROSPECT WP OR T HOLT ESPLANADE TUS TIN RED AR HILL MS TR ON G MA N VO NK AR BEAR LAKEVIEW ROSE TUSTIN C GLASSELL ECKHOFF BATAVIA PARKER MAIN BROADWAY STANDARD GRAND FLOWER RICHFIELD JEFFERSON OLIVE GLASSELL ORANGE RIO VISTA SUNKIST STATE COLLEGE LEWIS LEWIS THE CITY FAIRVIEW RAITT BRISTOL WANDA D BRADFOR PLACEN TIA ACACIA IGU EL E INE INE TOW N IRVINE!J! ( H ( IRV SON IRV CO A RIT DS J-2! ( HEL UNIVERSITY BU GA AN MIC TR A LE YA R MA SAN M 405 BR YAN NTA IRL L TO IA ALIC San Dieg o Cr eek Tra il Proposed Connection to Bikeways Corridor SA ON ALT MU BAKE G! (! ( 5 b LAGUNA CANYON YON CAN CA C! ( GY b CAMPUS BONIT A LA! (I WA Y 261 LO IRV INE INE AN Existing NO 73 RTO MA R NA ON NY TER ANCA BAKER CO LI CA CEN BARR LA B-4 RR!K Bastanchury Corridor ( Regional Trails TUSTIN!B ( WA LN J-2 Yale Corridor! ( F! (!A ( UT BA I-2 Spectrum Alternate! (!J Jeffrey Corridor ( CH N PO 241 CANYON VIEW O IAG NT INE SO ALT ON CHAPMAN E-2! ( SA IRV!E ( LA RTO!J (!F Santiago Canyon (!G Old Town - Great Park ( H Warner - Edinger! (!I Laguna Canyon - Irvine Station ( PO il MACARTHUR N Tra DYER ail k Tr Cree BR YAN B-5! ( WARNER E-2 Avenida Palmer Alternate! ( ANO TE FORD GA TE ITA TH INE IRVINE TY UNIVERSI 19 IRV TO WN R GA TO EL LA ND S RO UC O R MA HIL LS 28 HEL EDINGER SERR SANTIAGO CANYON FOOTHILL MAIN TA MO ULT ON UCO MIC AB 5 Dieg o Cr eek b SAN T COAS UIN AQ N JO SA RIDGE ROUTE MU IR TRAB San TR E L YA LAGUNA CANYON J BR YA N UNIVERSITY Developed corridors were presented at the April 2015 PDT meeting CO AS T NCH N RA GLEN ITA AR RG MA b HIL L CA 17TH A A AN SANT CHESTNUT!C ( b! (H AN 405 ON ALT MA RIN EW AY! (G GY CEN TER BAKER TA SAN NYON PO RTO LA LA VETA SANTA CLARA INA N T COUNTY CIVIC CENTER OLO IRV INE IELD CKF RO Y CA SHAD 241 BU CO RR!F ( CO L HN TEC IRVINE QU AIL 133 BR YA iago Sant CHAPMAN FAIRHAVEN LA YO CAN TRA BA LA VETA TUSTIN NU ALT ON 55 (!B WALNUT ORANGE b LA VILLA PARK KATELLA COLLINS b 5 ONT ESCO D! ( TAFT CERRITOS CANYON VIEW 261 WA L DYER Connection to Bikeways Corridor AN PM CHA!E ( VIA C Cambridge - Portola! (!D Taft Corridor (!E Walnut - Chapman ( FAIRM A-3 A-2! (! ( ANCH VILLA PARK TAFT FOOTHILL WARNER MACARTHUR BALL LR R WEI IRV INE Cree 91!A ( SANTA ANA CANYON NOH B-2 Orange Olive Alternate! ( B-3 Lincoln - Tustin Alternate! ( B-4 Tustin Ranch Alternate! ( B-5 Newport-Valenica Alternate! ( ON G MAIN EDINGER O O LED TO IM ON JER ON 73 A CANY BONIT PORT NEW DOVER BAYSIDE INE GEL CAMPUS FORD 17TH A B-2! ( MEATS! ( YORBA LINDA Trai l CANN H WA LN UT 5 go ntia Sa LA VETA FAIRHAVEN RWO OD ail k Tr 57 Proposed 241 jon ANAHEIM Regional Trails ANO A-2 Cannon Alternate! ( A-3 Anaheim Hills Alternate! ( B Lakeview - San Diego Creek!K ( El Ca LA PALMA Existing VILLA PARK CHAPMAN b SERR SANTIAGO CANYON!A Regional Parks Connector ( BASTANCHURY B-3! ( b YON b ARBO VIA LA ESCO TAFT 55 A AN SANT!A ( CH!B VILLA PARK ( SANTA CLARA CIVIC CENTER T RAN WALNUT LA VETA COUNTY BR YA N 405 UNIVERSITY KATELLA CHESTNUT BISON COLLINS ORANGE b 261 RID 22N D MIC HEL SON MES A 5 HL NO ON GO CAN SANTIA AN CA b A SANT IRM ANAHEIM RIAL BUENA VISTA LA RTO BA RR MEATS!D ( TAFT CHAPMAN FA NYON CA ANA IMPE YORBA LINDA PO BAKER ARLINGTON FAIR DE LM AR PAULARINO 57 BALL SYC AM OR TUSTIN E 91 N NYO R CA SUNFLOWER I M 241 YORBA LINDA Trai l LA PALMA b O jon Proposed Foothills Corridors N ALT ON b ON O CANY SANTIAG DYER 2 4/28/2015 BR YA N WARNER MACARTHUR 1 Miles El Ca CANNO MAIN MCFADDEN CANY ON RI NYON FOOTHILL YORBA LINDA CANYON CANYON VIEW YON CAN CABRILLO PARK b4th A FORD CRAW LA VETA SANTA CLARA CHESTNUT SEGERSTROM VILLA PARK CHAPMAN 0.5 I BASTANCHURY BUENA VISTA CERRITOS FAIRHAVEN 17TH YON C AN ORANGE NT CA IAGO SANT 55 0 SANTA ANA OAK CANYON AN SERR CANNON KATELLA MO VIA ESCOLA CHAPMAN NZA 91 ANAHEIM FAIR TAFT VILLA PARK WALNUT PENN EDINGER Eb J: Alton Crosstown Connection ESPERA ROYAL OAK LA VETA CIVIC CENTER SANTA ANA 1ST 4TH TAFT COLLINS CHAPMAN MEMORY NOHL RANCH O TIAG SAN D b METRO POLITA N b RIAL I: Irvine Corridors Connector YORBA LINDA LA PALMA MEATS IMPE F: Peters Canyon Corridor WEI BUENA VISTA R MILLE EAST GROVE CERRITO E: Canyon to River Trails I Alignment Alternatives!A Regional Parks Connector (!B Lakeview - San Diego Creek (!C Cambridge - Portola (!D Taft Corridor (!E Walnut - Chapman (!F Santiago Canyon (!G Old Town - Great Park (!H Warner - Edinger (!I Laguna Canyon - Irvine Station (!J Yale Corridor ( 6/4/2015 COUNTY H: Future Parks Connector YORBA LINDA LE RIVERDA LINCOLN ORANGEWOOD 5 IMPE RIA L PALM FRONTERA 57 S D: Orange - Villa Park Connector G: Santa Ana - Lake Forest SPEC T KRAEMER ASSOCIATED GOLDEN CHAPMAN NUTWOOD ALTA VISTA COMMONWEALTH CROWTHER THORPE ORANGE MA MIRALO BALL Regional Bikeways Corridors COUNTY BASTANCHURY SOUTH Proposed Foothills Corridors C: River to Creek Trails ON CANY R WEI b Miles 10 5 B: Yorba Linda - Back Bay BREA ON CARB VALENCIA BERRY BREA BIRCH 2.5 A: Santiago Canyon Corridor TED CIA SO AS LAMBERT 0 Proposed Foothills Corridors Existing Class I Bikeways AR Foothills PDT Meeting #3 OCTA District 3 Boundaries TONNER CANYON CENTRAL Prospective corridors were refined in anticipation of the April 2015 PDT meeting Miles 10 EL RO TO IMO JERON These proposed corridors were presented at the Corridor alignment alternatives were developed as a result of Roundtable feedback meeting June 2015 Public Roundtable
33 OC Foothills Bikeways Strategy 3.1 REGIONAL CORRIDORS The following provides a detailed discussion of each regional corridor within District 3. Each corridor has been assigned a letter, in no particular order. The evaluation analysis of the 11 corridors, using specific criteria, is presented in Section 3.2. Efforts have been made to identify conceptual alignments of each corridor; however, refinements are expected as feasibility studies are conducted to provide an improved analysis and review of the constraints and opportunities of each corridor. Therefore, flexibility in the alignment of each corridor should be expected to help achieve regional connectivity and continuous linkage. Table 3.1 Foothills Regional Bikeway Corridors New/ Enhanced Bikeways and Trails (miles) People Served within ¼ Mile (thousands) Total Corridor Project Cost Corridor Length (miles) (millions) A: Regional Parks Connector $ B: Lakeview San Diego Creek $ C: Cambridge Portola $ D: Taft Corridor $ E: Walnut Chapman $ F: Santiago Canyon $ G: Old Town Great Park $ H: Warner Edinger $ I: Laguna Canyon Irvine Station $ J: Jeffrey Corridor $ K: Bastanchury Corridor $ TOTAL $ ,159 29
34 OCTA - Orange County Transportation Authority Figure 3.2 Foothills Regional Bikeway Corridors BREA CHAPMAN BRISTOL EDINGER PLACENTIA CIVIC CENTER MACARTHUR MELROSE 57 b ORANGE LA VETA WARNER MAIN BATAVIA Santa Ana River Trail COLLINS 5 BATAVIA 55 DYER VALENCIA GLASSELL b b SANTA ANA CHESTNUT GLASSELL TAFT JAMBOREE!(D UNIVERSITY MEATS CAMBRIDGE ALTON b TUSTIN KATELLA WALNUT RED HILL VON KARMAN 405 YORBA LINDA!(B CHAPMAN BUENA VISTA MAIN UNIVERSITY CAMPUS BASTANCHURY WANDA!(H MICHELSON LA PALMA VILLA PARK TAFT FAIRHAVEN Santiago Creek Trail BARRANCA HOLT WALNUT CULVER LAKEVIEW NOHL RANCH VILLA PARK BRYAN NEWPORT b HARVARD!(E!(G!(K SANTA ANA CANYON VIA ESCOLA ESPLANADE TUSTIN RANCH San Diego Creek Trail El Cajon Trail LA COLINA YORBA LINDA ANAHEIM TUSTIN!(J COUNTY SANTIAGO CANYON CHAPMAN CANYON VIEW Peters Canyon Trail 5 BRYAN YALE 261 Option A TRABUCO IRVINE CENTER FAIRMONT Option B!(C 91 IRVINE!(A SERRANO I Proposed JEFFREY IRVINE RIDGE VALLEY WEIR CANYON 241 MARINE WAY PORTOLA 133 b OC Foothills Corridors ALTON!(F!(A!(B!(C!(D!(E!(F!(G!(H!(I!(J 241!(K Corridor Facilities Existing!(I Regional Parks Connector Lakeview - San Diego Creek Cambridge - Portola Taft Corridor Walnut - Chapman Santiago Canyon Old Town - Great Park Warner - Edinger Laguna Canyon - Irvine Station Jeffrey Corridor Bastanchury Corridor Potential New/Enhanced Facilities Regional Trails Existing Proposed Connection to Bikeways Corridor *Options A & B through Peters Canyon Regional Park area are pending detailed study by OC Parks. COUNTY PORTOLA SANTIAGO CANYON LAGUNA CANYON MUIRLANDS FORD 73 CULVER BONITA CANYON BAKE LOS ALISOS Miles EL TORO 30

35 OC Foothills Bikeways Strategy With the final corridor alignments identified, a preliminary bike facility was selected for the individual corridor segments based on specific criteria developed by the consultant team. (For more information regarding specific bike facilities, please refer to the Bicycle Facility Toolkit in Section 5.) The Preferred Facility Type for each segment was determined using the following procedure: Figure 3.3 OCTA D3 Bike Facility Selection Flow Chart STEP 1: Determine Minimum Required Bike Facility Is ADT < 5,000 NO Is the Posted Speed Limit 40 MPH or less? NO YES Is the Posted Speed Limit 45 or Higher? Is the Posted Speed Limit 30 MPH or less? NO YES YES YES Class-III Bike Route (Neighborhood Greenway) Class-II Bike Lanes (w/ Striped Buffer ) Step 1 Minimum Required Facility Class-IV Bikeway or Class-I Trail STEP 2: Comparison to Existing and Proposed Facilities Step 1 Minimum Required Facility Existing or Proposed Bike Facility Selected Highest Order Facility Between Networks Bike Facility Hierarchy 1st. Class - I or Class-II Protected 2nd. Class-II Buffered Bike Lanes 3rd. Class-II Bike Lanes 4th Class-III Bike Route Step 2 Recommended Facility Type STEP 3: Applied Engineering Judgment Engineering Judgment Reviewed ADT, Network Connectivity Agency (OCTA) Input Preferred Facility Type 31
36 OCTA - Orange County Transportation Authority Figure 3.4 Corridor A: Regional Parks Connector Kellogg Dr STATER BROS Orangethorpe Ave Oakvale Dr Santa Ana Canyon Rd Esperanza Rd Santa Ana River Greenbelt la Palma Ave YORBA REGIONAL PARK Fairmont Blvd Santa Ana River Trail 91 ANAHEIM TARGET PHARMACY SPROUTS Weir Canyon Rd Featherly Regional Park Corridor Details 2.1 miles of existing bikeways 9.3 miles of new bikeways 2.4 miles of new trails = 13.8 miles of bikeways Royal Oak Rd Nohl Ranch Rd Anaheim Hills Rd ANAHEIM PLAZA Paseo Caballo Canyon Rim Rd Sunset Ridge Rd ion to Corridor K Connect Existing Bikeway Proposed Class I Bike Path Via Escola Stage Coach Rd Nohl Ranch Rd Columbus Dr Proposed Class IV Proposed Class II Bike Lane with Striped Buffer Cannon St VILLA PARK Serrano Ave Santiago Oaks Regional Park Weir Canyon Nature Preserve Scoring Lower Higher Safety Needs Bikeway Completion Taft Ave Public Support Cost per Benefit Santiago Blvd Santiago Creek Trail Bond Ave Rancho Santiago Blvd ALBERTSONS Dodge Ave ORANGE Santiago Oaks Regional Park Chapman Ave Cannon St Quail Ln Crawford Canyon Rd Cadbury Dr COUNTY Orange Park Blvd Canyon View Ave A Newport Blvd Santiago Canyon Rd Connection to Corridor E ALBERTSONS SAVON PETERS CANYON REGIONAL PARK Option A* Peters Canyon Rd Irvine Regional Park Connection to Corridor F Limestone Canyon & Whiting Ranch Wilderness Park COUNTY Peters Canyon Rd Santiago Canyon Rd Loma Ridge Nature Preserve Weir Canyon Nature Preserve 241 Fremont Canyon Nature Preserve Trip Demand Ease of Implementation Key Facts $40 million Project Cost 11.7 miles Of Bikeway Improvements 8 Parks within 1/4-mile Served Disadvantaged Areas Avoids Steep Hills 9 Schools + Universities within 1/4-mile Served 116k People within 1/4-mile Served (approx.) Newport Ave Red Hill Ave la Colina Dr TUSTIN Tustin Ranch Rd Connection to Peters Canyon Trail Pioneer Rd Portola Pkwy Corrido r C Jamboree Rd 261 Option B* IRVINE COUNTY Limestone Canyon Nature Preserve 241 *Options A & B through Peters Canyon Regional Park area are pending detailed study by OC Parks. Legend City Boundary Existing Proposed Class I (Regional) Class I (Local) Class II Class III Parks Schools Civic Shopping 32
37 OC Foothills Bikeways Strategy CORRIDOR A: REGIONAL PARKS CONNECTOR Overview This bikeway corridor serves three major parks Yorba Regional Park, Irvine Regional Park, Peters Canyon Regional Park and feeds into four of the County s most popular trails: Santiago Creek Trail, El Cajon Trail, Peters Canyon Trail, and the Santa Ana River Trail. While mostly a recreational connection, it is currently a higher stress environment, with more than 54% of the corridor being comprised of segments which ranked 4 in the Level of Traffic Stress (LTS) analysis (more information on this analysis is found in the Evaluation Criteria section). There are needs for immediate safety improvements to serve regular users along this corridor. The Regional Parks Connector connects the south-eastern edge of the City of Yorba Linda to points south, roughly following the border between the Cities of Tustin and Irvine. This corridor aligns on roads connecting many of the upper and lower foothills different suburban neighborhoods to an additional four proposed corridors C, E, F, and K. Opportunities and Constraints The Regional Parks Connector will provide many residents with access into and out of the foothills. While the trail follows the edge of the foothills, heading south towards Peters Canyon, there are currently two opportunities for its southern terminus which include orienting the trail through Peters Canyon Regional Park, or along Jamboree Road, each as a Class I shared-use path. Local residents have expressed a concern over installing a Class I bikeway in the Regional Park, so the alternative route along Jamboree Road would still facilitate connection to regional trails and corridors. The southernmost section of Corridor A, at Peters Canyon Regional Park, was deemed a critical connection and critical safety point by many participants eager to see it connect a gap in the existing Class I bikeway. Despite its overall good connectivity, there are grade/terrain concerns for this corridor, as Serrano Avenue s 11% grade may deter riders. As a result, this corridor may find it s most frequently used as a good option for recreational bike enthusiasts to safely cover a good swatch of the foothills. The entire corridor may not necessarily serve a connection to each adjacent neighborhood, but portions can still serve to as a link for the larger target population as many feeder local bikeway facilities link to this alignment. During outreach efforts, residents have also requested consideration of separate facilities for bikes, pedestrians, and equestrian riders throughout this corridor. Major Regional Destinations The Peters Canyon Regional Park is a big draw for local residents. Trails are currently used by hikers, and cyclists on mountain bikes. A few sections along this corridor have existing and planned connections to trails that go further up into the foothills. A proposed bridge at the corridor s northern terminus would provide a direct, stress-free connection to Yorba Linda, Anaheim, to Placentia (and points west), via the Santa Ana River Trail. 33

38 Main St OCTA - Orange County Transportation Authority Figure 3.5 Corridor B: Lakeview - San Diego Creek East St Raitt St Ted Craig Regional Park la Palma Ave Cerritos Ave Orangewood Ave Bristol St Sunkist St McFadden Ave Baker St 57 ANAHEIM Flower St b Macarthur Blvd Sunflower Ave 73 Wagner Ave ARTIC Alton Ave Melrose St Lincoln Ave Rio Vista St 17th St Bradford Ave Tri-City Regional Park Orangethorpe Ave RALPHS 5 Old Orange County Courthouse Warner Ave Batavia St Palm Ave SANTA ANA Frontera St Dyer Rd b Valencia Ave b Glassell St Chestnut Ave Pullman St Palm Dr Alta Vista St San Juan Ln Miraloma Ave Fletcher Ave ORANGE Irvine Business Complex b Anaheim Canyon Business Center Santa Ana River Greenbelt Cambridge St Red Hill Ave Main St Von Karman Ave 405 Orange Olive Rd Taft Ave Bastanchury Rd Jefferson St THE VILLAGE AT ORANGE-WEST Tustin St CVS PHARMACY ALBERTSONS RITE AID Fairhaven Ave Santa Clara Ave Tustin Ave Main St Jamboree Rd Handy St SPROUTS Richfield Rd Collins Ave Conne c tion to TARGET RALPHS WHOLE FOODS CVS Buena Vista Ave Connection to Prospect St RALPHS CVS/ PHARMACY STATER BROS Holt Ave STATER BROS Edinger Ave Culver Dr Meats Ave WALGREENS RALPHS ALBERTSONS b STATER BROS STATER BROS VILLA PARK B Connection to Corridor H Connection to Corr Connection to Santiago Blvd Villa Park Rd idor E Corridor G TUSTIN ALBERTSONS Harvard Ave Barranca Pkwy Alton Pkwy Corridor K COSTCO CVS/PHARMACY RALPHS RITE AID Santa Ana Canyon Rd Santiago Oaks Regional Park Foothill Blvd Corridor C Newport Ave Bryan Ave la Colina Dr Cannon St Serrano Ave Chapman Ave RITE AID RALPHS 5 Yale Ave IRVINE YORBA LINDA Tustin Ranch Rd Walnut Ave Irvine Ranch Historic Park Yorba Linda Regional Park Santiago Oaks Regional Park Irvine Regional Park ALBERTSONS SAVON Weir Canyon Nature Preserve Peters Canyon Regional Park Loma Ridge Nature Preserve Jamboree Rd Jeffrey Rd Irvine Center Dr Irvine Blvd Trabuco Rd Esperanza Rd 261 Portola Pkwy SAFEWAY Sand Canyon Ave 133 Corridor Details 6.34 miles of existing bikeways miles of new bikeways 2.05 miles of new trails = miles of bikeways Scoring Safety Needs Public Support Key Facts Legend Existing Parks Civic Existing Bikeway Proposed Class I Bike Path Proposed Class II Bike Lane Proposed Class II Bike Lane with Striped Buffer Proposed Class IV Lower Higher Trip Demand Ease of Implementation $27 million Project Cost 25 Schools + Universities within 1/4-mile Served miles Of Bikeway Improvements 179k People within 1/4-mile Served (approx.) 6 Parks within 1/4-mile Served Proposed Bikeway Completion Cost per Benefit Disadvantaged Areas Avoids Steep Hills City Boundary Class I (Regional) Class I (Local) Class II Class III Schools Shopping 34
39 OC Foothills Bikeways Strategy CORRIDOR B: LAKEVIEW - SAN DIEGO CREEK Overview With high travel demand, this corridor provides intermodal connectivity with the Anaheim Canyon Train Station, access to major employment centers in the Anaheim Canyon and Irvine Business Center areas, as well as major shopping and entertainment centers: The Village at Orange, Old Town Tustin, and the future Yorba Linda Commons town center. There are an estimated 25 schools served by the proposed corridor, which is a main reason it received such strong public support. An additional advantage to this corridor alignment is that it provides a number of bicycle facility gap closures, existing and proposed. Corridor B is the longest of the 11 proposed corridors. To help clarify the route and individual segment s preferred bike facility type, descriptions of 23 major alignments along the corridor are included in Table 3.2. Opportunities and Constraints The corridor alignment is positioned along the right-of-way of a few major arterial roadways with high vehicle volumes and speeds. As such, it is recommended that these sections be implemented with a Class IV or Class I facility to ensure the greatest number of bicyclists will use the corridor. Another concern is the steep grade on North Tustin Road; alternative routes that avoid this difficult segment should still be considered. An alternate route on Santa Ana Canyon was discussed but later dismissed, due to intractable concerns regarding how to get cyclists through the difficult interchange at Lakeview Avenue. Major Regional Destinations From the North, a priority corridor has been identified to connect the OCTA District 4 areas of Placentia and Anaheim, through the Anaheim Canyon Metrolink Station to the Santa Ana River Trail. Either Tustin Avenue, or a future bicycle and pedestrian bridge would allow Corridor B to provide a key connection to the Anaheim Canyon Business Center and the Anaheim Canyon Metrolink Station. Corridor B heading north-to-south connects the Santiago Creek Trail, the Santa Ana River Trail, and the City of Tustin. At its southern terminus, the corridor takes the course of a flood control channel through the densely populated Irvine Business Complex. The bikeways which make up Corridor B could become a hallmark of the commercial centers they will serve, as businesses look to attract a new generation of employees and customers for whom transportation alternatives are increasingly important. Corridor B serves a significant number of schools, and connects all of the District 3 jurisdictions. The corridor scored strongly in 7 of the 8 criteria (the 8th being neutral), with the highest values for public support and bikeway completion, respectively. 35
40 OCTA - Orange County Transportation Authority With many turns, and transitions between preferred facilities, text descriptions of 23 major alignments along the corridor are included, for reference. Table 3.2 Corridor B Alignments (organized by preferred bike facility or directional change) Segment From To Preferred Bike Facility Miles Lakeview Ave Bastanchury Rd La Palma Ave Class II Bike Lanes with Striped Buffer 2.9 Lakeview Ave La Palma Ave Santa Ana Class II Bike Lanes with Striped Buffer 0.7 Canyon Rd Santa Ana Lakeview Ave Nohl Ranch Rd Class IV Separated Bikeway 2.2 Canyon Rd Santiago Blvd Nohl Ranch Rd Katella Ave Class II Bike Lanes with Striped Buffer 1.9 Tustin Branch and Santiago Creek Trails Walnut Ave Katella Ave Walnut Ave Class I Shared Use Path exists, Recommending improved intersections 1.3 Santiago Creek Esplanade Street Class II Bike Lanes with Striped Buffer 0.5 Trail N Esplanade St Walnut Ave Spring St Class II Bike Lanes with Striped Buffer 0.3 S Esplanade St Spring St Palmyra Ave Class II Bike Lanes with Striped Buffer 0.5 Palmyra Ave S Esplanade St Flood Channel Class II Bike Lanes with Striped Buffer 0.1 Flood Channel Palmyra Ave La Veta Ave Class I Shared Use Path 2.9 La Veta Ave Flood Channel (N) Flood Channel (S) Class II Bike Lanes with Striped Buffer 0.1 Flood Channel La Veta Ave Fairhaven Ave Class I Shared Use Path 0.5 Esplanade Ave/ Flood Channel Fairhaven Ave Santa Clara Ave/ Dodge Ave Class I Shared Use Path 0.5 Santa Clara Ave Esplanade Ave Flood Channel Class II Bike Lanes with Striped Buffer 0.1 (S) Flood Channel Santa Clara Ave 17th St Class I Shared Use Path 0.5 Holt Ave 17th St Newport Ave Class II Bike Lanes with Striped Buffer 1.0 Mountains to Holt Ave El Camino Real Class I Shared Use Path 0.7 Sea Trail Newport Ave El Camino Real LOSSAN Rail Class II Bike Lanes with Striped Buffer 1.0 Corridor LOSSAN Rail Newport Ave Red Hill Ave Class I Shared Use Path 0.5 Corridor Red Hill Ave LOSSAN Rail Barranca Pkwy Class I Shared Use Path 1.5 Barranca Pkwy Red Hill Ave Flood Channel Class I Shared Use Path 0.9 Flood Channel Barranca Pkwy Peters Canyon Trail Class I Shared Use Path
41 OC Foothill Bikeways Strategy This page intentionally blank 37


42 OCTA - Orange County Transportation Authority Figure 3.6 Corridor C: Cambridge - Portola e Ave Riverdal Canyo n Rim R d Orang e Olive Tustin St Rd ANAHEIM a Serr THE VILLAGE AT Meats Ave VILLA PARK Katella Ave ALBERTSONS Connection to ek Cre go tia San Weir Canyon Nature Preserve Bond Ave Irvine Regional Park Irvi ne Vine Ave ALBERTSONS Prospect Ave n Rd nyo Foothill Blvd Fremont Canyon Nature Preserve t Av e C o rrido rb Loma Ridge Nature Preserve r Black Star Canyon Wilderness Park 241 Pet e rs C an yon Re Tra il dh ill A ve RALPHS e c t ion to ALBERTSONS ad Corrid or A Main St CVS McFadden Ave C SAFEWAY d STATER BROS Irv ine Rd bo Jam San Die St go Cre ek Rd aul Cen ter ne H rj mo to uth t Dr Ca ny on nd Tra bu Irv co R d Pkw y ine Blv d Legend Key Facts 0.29 miles of existing bikeways miles of new bikeways 1.77 miles of new trails Existing 26 Schools + Universities within 1/4-mile Served Proposed Class II Bike Lane with Striped Buffer 152k Parks within 1/4-mile Served Schools Shopping Lower Higher People within 1/4-mile Served (approx.) 5 Parks Civic Scoring miles Of Bikeway Improvements Proposed Class I Bike Path City Boundary Class I (Regional) Class I (Local) Class II Class III Project Cost 19.3 Existing Bikeway Proposed $11.4 million = 19.6 miles of bikeways Tra il Corridor Details Proposed Class IV Por tol a Av e Co nn ec Rd Ave Irvi IRVINE Blv d Co rri do wo od CVS Ply We st Dr Cul ver ut Limestone Canyon Nature Preserve Sa Ave ine rey in R anc hr er Irv Jeff WHOLE FOODS y Wa rn Wa ln Ave TARGET ree an arm Vo nk Main y Dr Yal e Pkw ffe tt Ave 261 rd Ave kw Ave rva np Br y an TUSTINM b o Ave Re Alt o nca ger Ave RALPHS COSTCO wy na F ta A San dh ill A ve rra Edi n Ave Myford Rd dh Ave Dyer Rd Ba Valenci a Re er oke Ha Cos t am ill A ve esa Fw y an Wa rn RITE AID Tus t Ro io n Chestnut Ave la C olin WALGREENS Con n Holt Ave 5 Prospect Ave Tustin Ave Grand Ave New 17th St b COUNTY o Ca Fairhaven Ave Santa Clara Ave Peters Canyon Regional Park Co n ction to ne 55 por RALPHS Rd Canyon View Ave STATER BROS Prospect St RITE AID Par k ALBERTSONS-SAVON tiag San Cambridge St Fremont Canyon Nature Preserve il Tra Corridor E Palm Ave ORANGE Cannon St Handy St CVS Collins Ave Center Dr RALPHS Wanda Rd Glassell St Corridor D Cannon St Taft Ave Connection to Orange Park Blvd ORANGE-WEST b Gypsum Canyon Nature Preserve ve no A Safety Needs Bikeway Completion Public Support Cost per Benefit Trip Demand Disadvantaged Areas Ease of Implementation Avoids Steep Hills
43 OC Foothills Bikeways Strategy CORRIDOR C: CAMBRIDGE PORTOLA Overview This corridor is an opportunity for a continuous, lower stress, flat north-south connection, with an estimated 26 schools directly adjacent to the proposed corridor. Since most of the bikeway corridor is in place today, there are opportunities for enhancements that create more protected facilities, appealing to a great number of bicyclists. Opportunities and Constraints Corridor C boasts a total of seven connections with other Strategy corridors in this district, and neighboring cities. Meeting participants requested direct connections be made to other trails, along with wayfinding signage to help make those connections easy to identify and follow without wasting time looking at a map or possibly backtracking. Safety concerns for multi-modal flows, specifically at the Dodge Ave/Newport Ave intersection, will need to be addressed since students use this intersection due to its proximity to Hillview High School. Portola at the SR-261/Peters Canyon Trail interchange may need to be improved to provide low-stress access along this corridor. The crossing for trail users need to be direct, and through-movements for bicyclists along Portola should put them in the appropriate lane positions at on/off ramps. The segment on Fairhaven Ave between Yorba St and Ponderosa St, underneath SR-55, as well as the segment on La Colina between Newport Ave and Tustin Ranch Rd is particularly constrained, requiring special attention and creative treatments to accommodate bicyclists. Major Regional Destinations The Northern terminus of the corridor arrives at both a major employment center, and the Santa Ana River Trail, while also linking to a regional corridor being implemented in adjacent districts. Additionally, this section is under study for a supplemental trail to link up to the Anaheim Canyon Metrolink station, which is less than a mile away. Corridor C courses through four cities and connects more schools than any other corridor, and so the opportunities for activating placemaking efforts along this alignment are significant. 39


44 Nichols Ave OCTA - Orange County Transportation Authority Figure 3.7 Corridor D: Taft Corridor Orange Fwy Rio Vista St Fletcher Ave Heim Ave Santiago Blvd Ball Rd 57 ANAHEIM Santa Ana River Greenbelt Main St STADIUM PROMENADE Main St Santa Ana River Trail BATAVIA Batavia St Pacific St Grove Ave Blueridge Ave TAFT Glassell St Orange Olive Rd Shaffer St MEATS Connection to Corrid or C Taft Ave KATELLA THE VILLAGE AT ORANGE-WEST Tustin St TUSTIN ORANGE CVS/PHARMACY Meats Ave Costa Mesa Fwy 55 CVS/PHARMACY D Mori Ln Mori Ln Serrano Ave Connection to Corrido r B RALPHS Arden Villa Dr WANDA Lincoln St TAFT VILLA PARK Serrano Ave Santiago Blvd VILLA PARK COUNTY Sycamore St Santiago Blvd Cannon St Santiago Creek Trail Corridor A Connection to ARTIC b Eckhoff St COLLINS Struck Ave GLASSELL Cambridge St ALBERTSONS STATER BROS Handy St Collins Ave ORANGE Santiago Oaks Regional Park Corridor Details Key Facts Scoring Legend 0 miles of existing bikeways 4.24 miles of new bikeways 0.14 miles of new trails = 4.38 miles of bikeways Class I Bike Path Proposed Class II Bike Lane with Striped Buffer Proposed Class IV 2 Parks within 1/4-mile Served 6 Schools + Universities within 1/4-mile Served $2.2 million Project Cost 52k People within 1/4-mile Served (approx.) 4.38 miles Of Bikeway Improvements Lower Higher Safety Needs Bikeway Completion Public Support Cost per Benefit Trip Demand Disadvantaged Areas Ease of Implementation Avoids Steep Hills City Boundary Existing Proposed Class I (Regional) Class I (Local) Class II Class III Parks Schools Civic Shopping 40
45 OC Foothills Bikeways Strategy CORRIDOR D: TAFT CORRIDOR Overview Both Corridors D and E provide a connection between the Santa Ana River and Santiago Creek trails, and serve as alternatives to higher stress, higher collision streets (Chapman Avenue and Katella Avenue), while also helping bicyclists avoid the SR-55 freeway ramps. Opportunities and Constraints Corridor D represents a critical East-West connection to other corridors and trails in a relatively short distance. The outside travel lanes are extremely wide in places, and with an abundance of parking available at the commercial businesses along W. Taft Ave, the reduction and reallocation of striped roadway presents a great opportunity for placemaking along this corridor. Residents requested this corridor to be extended via Santiago Oaks and the proposed Class I bikeway (Santiago Creek Trail), South to Santiago Canyon, connecting to the northern terminus of Corridor F. Major Regional Destinations Connecting to the Santa Ana River Trail to the West, Corridor D presents a critical linkage into Orange County. The Honda Center, ARTIC, and Angels Stadium are a quick ride from this corridor s western terminus. Orange County civic buildings, parks, schools, and places of worship are abundant along the streets that feed into the Taft Corridor. 41


46 Connection to Center Dr Jamboree Rd OCTA - Orange County Transportation Authority Figure 3.8 Corridor E: Walnut - Chapman State Rte 57 STADIUM PROMENADE Santa Ana River Greenbelt b Ball Rd ANAHEIM Orange Fwy ARTIC 57 la Veta Ave 5 Santa Ana River Trail Yale Ave Main St Main St RALPHS WALGREENS Walnut Ave Batavia St Main Street Area CVS/PHARMACY Almond Ave 22 Taft Ave Glassell St Glassell St ORANGE Glassell St Palm Ave Walnut Ave Pine St Cambridge St Connection to Corridor C Sycamore Ave Tustin St CVS/PHARMACY ALBERTSONS STATER BROS Lincoln St RITE AID WALGREENS Handy St RALPHS Palmyra Ave Wanda Rd Taft Ave RALPHS Katella Ave la Veta Ave STATER BROS WALGREENS Prospect St Lincoln St Corridor B Walnut Ave Santiago Blvd Spring St Bond Ave Santiago Creek Trail Corridor D Graphic CVS/PHARMACY Esplanade St Taft Ave VILLA PARK COUNTY Chapman Ave ALBERTSONS Rancho Santiago Blvd Sycamore St E Cannon St Cannon St Santiago Oaks Regional Park Crawford Canyon Rd Santiago Canyon Rd COUNTY Orange Park Blvd Canyon View Ave Santiago Oaks Regional Park Newport Blvd COUNTY ALBERTSONS-SAVON Weir Canyon Nature Preserve COUNTY Irvine Regional Park Connection to Corridor A Peters Canyon Regional Park Corridor F SANTA ANA Grand Ave Calvo Dr Fairhaven Ave Corridor Details Key Facts Scoring Legend 1.47 miles of existing bikeways 7.21 miles of new bikeways 0.1 miles of new trails = 8.78 miles of bikeways Existing Bikeway Proposed Class I Bike Path Proposed Class II Bike Lane with Striped Buffer Proposed Class IV 4 Parks within 1/4-mile Served 10 Schools + Universities within 1/4-mile Served $3.7 million Project Cost 107k People within 1/4-mile Served (approx.) 7.31 miles Of Bikeway Improvements Lower Higher Safety Needs Bikeway Completion Public Support Cost per Benefit Trip Demand Disadvantaged Areas Ease of Implementation Avoids Steep Hills City Boundary Existing Proposed Class I (Regional) Class I (Local) Class II Class III Parks Schools Civic Shopping 42
47 OC Foothills Bikeways Strategy CORRIDOR E: WALNUT - CHAPMAN Overview Both Corridors D and E provide a connection between the Santa Ana River and Santiago Creek trails, and serve as alternatives to higher stress, higher collision streets Chapman Avenue and Katella Avenue while helping bicyclists avoid the SR-55 freeway ramps. Opportunities and Constraints Roadway alignments vary throughout this corridor, and a range of bikeway facilities are proposed to suit these conditions. Vehicle lanes can be narrowed to provide the additional room necessary to buffer bicyclists from automobiles. Walnut Avenue can be re-imagined as a more pedestrian and bicyclefriendly route with a range of shops and businesses catering to a new clientele. Chapman University is directly served by this corridor. The western Orange commercial district occupants could tout this new bikeway feature as a way to attract new businesses and employee s eager to have car-free commuting options so close to established transit. This corridor scored highly in four key areas Safety Needs, Cost per Benefit, serving Disadvantaged Areas, and in Ease of Implementation. This East-West alignment provides a critical path from the river into the foothills, early identified by the PDT as underserved areas that proposed corridor routes should address. Major Regional Destinations Directly connecting to the Santa Ana River Trail to the West, Corridor E presents a critical linkage to the Honda Center, ARTIC, and Angels Stadium. Corridor E also connects with three additional corridors and the Santiago Creek Trail, offering the much-needed East-West connection to these North-South routes. A connection to Corridor C occurs at the northeast section of historic Old Towne Orange. 43


48 OCTA - Orange County Transportation Authority Figure 3.9 Corridor F: Santiago Canyon Irvine Park Rd Con nection to Irvine Regional Park Corridor E ALBERTSONS SAVON Canyon View Ave Corriodr A Peters Canyon Rd 241 Fremont Canyon Nature Preserve Peters Canyon Regional Park ORANGE Pioneer Rd Jamboree Rd TUSTIN 261 Loma Ridge Nature Preserve Santiago Canyon Rd 241 COUNTY F Black Star Canyon Wilderness Park Orchard Hills SAFEWAY Culver Dr Trailwood IRVINE Jeffrey Rd Limestone Canyon Nature Preserve Corridor E Graphic Yale Ave Bryan Ave Jeffrey Rd Irvine Blvd Irvine Blvd Trabuco Rd Sand Canyon Ave Portola Pkwy Whiting Ranch Wilderness Park Santiago Canyon Rd LAKE FOREST 5 Corridor Details 0 miles of existing bikeways 1.54 miles of new bikeways 8.73 miles of new trails = 10.3 miles of bikeways Proposed Class I Bike Path Proposed Class IV Key Facts $15.9 million Project Cost 10.3 miles Of Bikeway Improvements 7 Parks within 1/4-mile Served 1 Schools + Universities within 1/4-mile Served 55k People within 1/4-mile Served (approx.) Legend City Boundary Existing Proposed Class I (Regional) Class I (Local) Class II Class III Parks Schools Civic Shopping Scoring Lower Higher Safety Needs Public Support Trip Demand Ease of Implementation Bikeway Completion Cost per Benefit Disadvantaged Areas Avoids Steep Hills 44
49 OC Foothills Bikeways Strategy CORRIDOR F: SANTIAGO CANYON Overview This corridor aligns with a popular recreational bicycling route for avid cyclists, and has high safety needs. While there are not as many collisions along this corridor, curves and high traffic speeds create the potential for more severe collisions. There was strong public support for this corridor, voiced by residents at the workshops, and events held throughout Orange County. Opportunities and Constraints Even though it is proposed as a protected bikeway for most of its length, this corridor alignment does not connect to a range of land-use types, and so it serves primarily recreational enthusiast bicyclists, and is not likely to draw cyclists of all skill levels. However, the roadway s configuration, and the availability of adjacent land, can allow for a faster implementation process if funding is secured. Major Regional Destinations Corridor F serves an expansive wilderness preserve, and a few retail establishments as well. This Corridor would serve to greatly improve conditions for recreational cyclists who are regularly using the route despite its current lack of facilities. A District 5 corridor alignment connects up to the proposed southern terminus of Corridor F. This corridor has the potential to be a destination in itself, a challenge to cyclists and opportunity for bicycle tourism dollars to be directed towards businesses along the corridor who might cater to this contingent. 45


50 OCTA - Orange County Transportation Authority Figure 3.10 Corridor G: Old Town - Great Park 17TH Ra nch wo o 261 d dh ill A ve an ch R Re to Orch ard Tus t in R BR YA N SAFEWAY 5 T RALPHS COSTCO RAN CH COUNTY Blv d Ave Tra bu Ave VA L GE RID ew ay MA R INE WA Y Regional Park Pkw y Rd Irvine Spectrum Jeron MU IRL Corridor Details Legend Key Facts 1.09 miles of existing bikeways 5.28 miles of new bikeways 2.68 miles of new trails Existing = 9.1 miles of bikeways 12 Schools + Universities within 1/4-mile Served 7.96 miles People within 1/4-mile Served (approx.) Proposed Class II Bike Lane with Striped Buffer Proposed Class IV d AN DS City Boundary Parks Civic Schools Shopping Scoring 93k Existing Bikeway imo R Class I (Regional) Class I (Local) Class II Class III Project Cost Of Bikeway Improvements Proposed Class III Proposed $21.2 million 1.48 miles of bike routes Co ON ALT y nca kw rra Bak ep S CAMPU Canyon ALBERTSONS-SAVON Ba VILLAGE MARKET I nn ec ti RALPHS William R. Mason or on to C or r id SA ND Yal e CA Ave Y NY ON OG OL UNIVERSITY Laguna Harvard Ave LEY San Rd Lak e A TER Yale Loop 405 RITE AID NC rin CEN HN ON d TEC ELS y 133 R LVE CU par Pso We st CH INE RRA RALPHS Ma IRV BA MI Pkw dc any on Rd 5 rey r k Cen ter D Jeff ine IRVINE Por tol a co R Ave bo St Irv y Jam Main kw 241 G Yal e np ree Rd VO N Alt o wy INE r J FRE Ave erfi eld KA RM AN CVS/PHARMACY De Yal e Ave o rid tio nt o ose HA er TR vel ABU t CO JEF Ro Nature Preserve Pk Co r Ave ec ut Limestone Canyon IRV Y Wa ln wy na F ta A San Wa rn ree bo Rd D Dr Jam WHOLE FOODS ine Co nn Mo y TARGET Irv Ave Po rto la ffe tt Pkw Br y an Ave RV AR TRO nca ger TUSTIN AR MS ill A ve dh Re rra Edi n Rd NG RED HIL L Berry TIN aa ve TUS nci Ba Dr NU Cul ver dh ill A ve RITE AID WA L Re Val e Hills REY Robinson Dr JEF F nn A ec ve tio n 241 d r STATER BROS Edinger Ave Limestone Canyon dr WP OR T Holt Ave HOLT NE ad RALPHS Ne wp Co ort 55 Loma Ridge Nature Preserve Nature Preserve la C olin ALBERTSONS Co rri MAIN Peters Canyon Regional Park do rb PROSPECT Tustin Ave 17th St Parks within 1/4-mile Served Lower Higher Safety Needs Bikeway Completion Public Support Cost per Benefit Trip Demand Disadvantaged Areas Ease of Implementation Avoids Steep Hills
51 OC Foothills Bikeways Strategy CORRIDOR G: OLD TOWN - GREAT PARK Overview This corridor connects to Tustin s downtown, the marketplace, as well as the OC Great Park, all while serving bicyclists crossing the I-5 and SR-55 freeways. The corridor provides a less stressful option than biking on Irvine Blvd, and also serves socioeconomically diverse areas. The corridor seeks to provide a route to areas identified by the technical team as underserved connecting the southeastern portion of Orange County to central areas in Santa Ana and beyond. The western terminus of this corridor connects with the eastern terminus of a corridor earlier studied, identified, and being implemented in Districts 1&2. Opportunities and Constraints Residents at the first public workshop suggested that Bryan Ave be re-configured, narrowing vehicle travel lanes for a buffer to be added between cars and cyclists. Bryan Ave at Jamboree Rd was cited specifically as a very problematic intersection, and additional treatments should be considered to safely accommodate all modes. Traffic calming should be used to bring vehicle speeds on Main Street in Tustin closer to the travel speeds of the bicyclists sharing the lane. The residential nature of this stretch of the corridor, in tandem with the historic downtown s close setbacks/façades along the existing streetscape, encourage these treatments, all roadway users will benefit as a result of their implementation. The corridor scores highly in Safety Needs, and an analysis of the data in this area shows a high profusion of bicycle-involved collisions. With a high concentration of retail destinations, parks, people, and schools, a route consisting of the proposed physically-separated barriers will counteract these statistics, with a higher number of bicyclists using an on-road facility designed specifically for them and the reduction of conflict points with motorists. Major Regional Destinations Major regional parks, and new destinations slated for development in both Tustin and Irvine, will each be connected by this corridor. Historic downtown Tustin, the library, City Hall and The Marketplace are all sited along the corridor. The corridor scores highest in Trip Demand as a result of these destinations. Additionally the corridor scores highest in service to Disadvantaged Areas within a ¼ mile of its proposed alignment. 47


52 OCTA - Orange County Transportation Authority Figure 3.11 Corridor H: Warner - Edinger Grand Ave ALTON Michelson Dr VON KARMAN ARMSTRONG Irvine Business Complex Carlson Ave Campus Dr 55 Edinger Ave Red Hill Ave University Dr Warner Ave Main St Connection to Corridor B Barranca Pkwy ALBERTSONS- SAVON Jamboree Rd UNIVERSITY RED HILL TARGET PHARMACY WHOLE FOODS MICHELSON CAMPUS Berry Rd Alton Pkwy TUSTIN RITE AID STATER BROS WALNUT Edinger Ave Warner Ave CULVER TUSTIN RANCH Yale Ave b Myford Rd HARVARD Lake Rd Yale Loop RALPHS William R. Mason Regional Park Ridgeline Dr SAFEWAY RITE AID RALPHS COSTCO CVS/PHARMACY University Dr 261 Jamboree Rd Deer Park St Deerfield Ave RALPHS Bryan Ave Yale Ave Walnut Ave Cascade BARRANCA YALE H Culver Dr Roosevelt IRVINE CENTER Northwood Irvine Blvd BRYAN JEFFREY TRABUCO Discovery Jeffrey Rd Sand Canyon Ave Marine Way Connection to Corridor J TECHNOLOGY Connection to RIDGE VALLEY Irvine Spectrum MARINE WAY Enterprise Dr Irvine Blvd 133 Portola Pkwy IRVINE Perimeter Rd b Barranca Pkwy Ridge Valley Lambert Rd Limestone Canyon Nature Preserve 241 ALTON Corridor I COUNTY 241 MUIRLANDS Jeronimo Rd Bonita Canyon Dr 73 Shady Canyon Dr Turtle Rock Dr Laguna Canyon Rd Lake Forest Dr BAKE Laguna Coast Wilderness Park Moulton Pkwy Rockfield Blvd Corridor Details 3.22 miles of existing bikeways 3.53 miles of new bikeways 2.98 miles of new trails = 9.73 miles of bikeways Existing Bikeway Proposed Class I Bike Path Proposed Class II Bike Lane with Striped Buffer Proposed Class IV Key Facts $6.2 million Project Cost 8 Parks within 1/4-mile Served 3 Schools + Universities within 1/4-mile Served 6.51miles Of Bikeway Improvements 89k People within 1/4-mile Served (approx.) Legend City Boundary Existing Proposed Class I (Regional) Class I (Local) Class II Class III Parks Schools Civic Shopping Scoring Lower Higher Safety Needs Public Support Trip Demand Ease of Implementation Bikeway Completion Cost per Benefit Disadvantaged Areas Avoids Steep Hills 48
53 OC Foothills Bikeways Strategy CORRIDOR H: WARNER - EDINGER Overview Early PDT efforts were focused on both Warner and Edinger to create a connection across Irvine. Ultimately the rail and flood channel easements were identified as the more realistic parallel route, which is less circuitous. Providing intermodal connectivity with the Irvine and Tustin rail stations and The District at Tustin Legacy, this corridor would require a new bridge across the flood channel just south of State Route 261, but the ratio of benefits to cost is still strong. A primary strategy in developing this corridor is to eliminate a number of the gaps between existing and soon-to-be-completed bikeways in Irvine and Tustin. Opportunities and Constraints The connection to the Metrolink stations should be direct, with future bicycle facilities providing access directly to the bike parking areas at each station. Costs per Benefit makes this corridor an economically responsible public improvement project, leveraging existing infrastructure and easements to fill out a multi-modal network. The at-grade alignment should make travel direct and less strenuous, appealing to bicyclists of all skill levels. Additionally, the bikeway will connect to the Peters Canyon Trail, leading to the proposed Corridor A, proposed Corridors B, J, I, and two corridors already in development in other districts. Major Regional Destinations The Tustin Legacy development and recreation park, Tustin Metrolink Station, Irvine Metrolink Station, and Irvine Spectrum are all adjacent to this corridor. The Peters Canyon Trail can be designed to link directly into this corridor, which then leads to the San Diego Trail, producing an excellent axial connection through the foothills. 49


54 OCTA - Orange County Transportation Authority Figure 3.12 Corridor I: Laguna Canyon - Irvine Station Jeffrey Rd 5 Trabuco Rd 133 Irvine Blvd Portola Pkwy Whiting Ranch Wilderness Park RIDGE VALLEY Alton Pkwy Portola Pkwy Bake Pkwy Valley Oak Dr SAND CANYON IRVINE CENTER Barranca Pkwy Jenner Sand Canyon Ave Banting Irvine Center Dr Pacifica Marine Way 133 TECHNOLOGY Irvine Spectrum Connection to 5 MARINE WAY Ada b IRVINE IRVINE Barranca Pkwy ALTON Irvine Blvd I Toledo Way Connection to Corridor G COUNTY Corridor G Graphic Bake Pkwy Trabuco Rd LAKE FOREST 241 Rancho Pkwy el Toro Rd Rancho Pkwy Laguna Canyon Rd 405 Jeronimo Rd Toledo Ln Corridor H MUIRLANDS Lake Forest Dr Corridor Details Key Facts Scoring Legend 0 miles of existing bikeways 7.9 miles of new bikeways 0 miles of new trails = 7.9 miles of bikeways LAGUNA CANYON Proposed Class IV 3 Parks within 1/4-mile Served 2 Schools + Universities within 1/4-mile Served $13.9million Project Cost 26k People within 1/4-mile Served (approx.) 7.9 miles Of Bikeway Improvements Lower Higher Safety Needs Bikeway Completion Public Support Cost per Benefit Trip Demand Disadvantaged Areas Ease of Implementation Avoids Steep Hills Existing Parks Civic City Boundary Proposed Class I (Regional) Class I (Local) Class II Class III Schools Shopping 50
55 OC Foothills Bikeways Strategy CORRIDOR I: LAGUNA CANYON - IRVINE STATION Overview This corridor connects bicyclists from Laguna Canyon Road to the Irvine rail station. This alignment also serves the Irvine Spectrum - a major employment and shopping & entertainment center, and would help bicyclists get to the OC Great Park. There are strong safety needs, as it is proposed along higher speed arterial roadways and is constrained at multiple freeway crossings. Opportunities and Constraints Free-right turns on Alton and Barranca/Muirlands, Alton/Jeronimo, Alton/Toledo, and Alton/Irvine are in need of realignment and protected intersection treatments to accommodate bicyclists. Also, demand drops significantly along Alton northeast of Irvine Blvd, but this will change with new development and so there is an opportunity at this early stage to accommodate and attract businesses eager to tout this amenity for their employees. Therefore, implementing this segment as part of a later phase contingent upon (and potentially funded by partnerships with) new development could be considered. Buffered bike lanes were identified as the preferred facility type for this alignment by workshop attendees. A proposed connection to Laguna Canyon, and eventually to the coast via Old Laguna Canyon Road (formerly state route 185) beginning at the southern terminus of Corridor I, was mentioned as a possible linkage for further study by residents at each of the public workshops. Major Regional Destinations This corridor provides desired access to Irvine Spectrum and the range of employers currently in this area, along with those expected after further development. Additionally, the bikeway will connect to two corridors already under development in other districts. 51


56 OCTA - Orange County Transportation Authority Figure 3.13 Corridor J: Jeffrey Corridor RED HILL Barranca Pkwy Von Karman Ave ARMSTRONG TARGET PHARMACY WHOLE FOODS TUSTIN Edinger Ave b HARVARD Jamboree Rd CVS 261 Deerfield Ave el Camino Real Walnut Ave Santa Ana Fwy YALE Westwood Roosevelt TRABUCO Bryan Ave Northwood Irvine Blvd Connection to Corridor G JEFFREY Jeffrey Rd BRYAN IRVINE Irvine Blvd Connect ion to Corridor C COUNTY Portola Pkwy Irvine Center Dr Irvine Business Complex ALBERTSONS SAVON Jamboree Rd IRVINE Main St UNIVERSITY MICHELSON RITE AID CAMPUS Alton Pkwy 405 CULVER Michelson Dr Culver Dr Yale Loop Warner Ave RALPHS William R. Mason Regional Park RALPHS CVS/PHARMACY Yale Ave J BARRANCA Corridor I Graphic Connection to Corridor H IRVINE CENTER SAND CANYON Laguna Canyon Rd Irvine Center Dr Discovery Trabuco Rd Sand Canyon Ave Marine Way RIDGE VALLEY TECHNOLOGY Irvine Spectrum MARINE WAY Ada Technology Dr Perimeter Rd b Barranca Pkwy California Ave Ridgeline Dr BAKE Bonita Canyon Dr Shady Canyon Dr Turtle Rock Dr Bake Pkwy Corridor Details 6.84 miles of existing bikeways 0.33 miles of new bikeways 2 miles of new trails = 9.17 miles of bikeways Existing Bikeway Proposed Class I Bike Path Proposed Class IV Key Facts $14.6 million Project Cost 11 Schools + Universities within 1/4-mile Served 2.33 miles Of Bikeway Improvements 12 Parks within 1/4-mile Served 194k People within 1/4-mile Served (approx.) Legend City Boundary Existing Proposed Class I (Regional) Class I (Local) Class II Class III Parks Schools Civic Shopping Scoring Lower Higher Safety Needs Public Support Trip Demand Ease of Implementation Bikeway Completion Cost per Benefit Disadvantaged Areas Avoids Steep Hills 52
57 OC Foothills Bikeways Strategy CORRIDOR J: JEFFREY CORRIDOR Overview This corridor has strong Trip Demand and would require only gap closures, which allowed it to score highest on Bikeway Completion as well. A single big-ticket project being is all that is required to complete a network which will be providing primarily off-street connections to many destinations, including the University of California, Irvine, Mason Regional Park, and Irvine Valley College. Opportunities and Constraints This Corridor proposes an alignment which would connect a series of Class I multi-use trails for bicyclists of all abilities. This Corridor contains the highest percentage of completed bikeways, with Interstate 5 presenting a considerable barrier to completion, necessitating construction of a bicycle and pedestrian bridge. Opportunities to connect University students (many of whom do not have access to a motor vehicle) with the surrounding community was a chief concern of attendees at both workshops. A well-designed system of updated wayfinding markers would be extremely beneficial along this corridor which links to multiple existing and planned trails, along with three other proposed corridors. Major Regional Destinations Along with UCI and Irvine Valley College, several high schools are served by the corridor. Corridor completion could provide a Safe Route to School for a growing number of students in this area. 53


58 Rose Dr Yorba Ranch Rd OCTA - Orange County Transportation Authority Figure 3.14 Corridor K: Bastanchury Corridor Valencia Ave Rose Dr Carbon Canyon Regional Park BREA 142 COUNTY Golden Ave 90 Bastanchury Rd IMPERIAL BASTANCHURY Bastanchury Rd YORBA LINDA San Antonio Rd Palm Dr Alta Vista St Yorba Linda Blvd Jefferson St Miraloma Ave Valley View Ave Imperial Hwy YORBA LINDA BUENA VISTA CVS/PHARMACY LAKEVIEW SPROUTS STATER BROS Richfield Rd PLACENTIA Mariposa Ave Lakeview Ave Connection to Corridor B Cll Mirador Kellogg Dr STATER BROS Orangethorpe Ave RITE AID Oakvale Dr Village Center Dr Pso de Las Palomas Esperanza Rd Yorba Regional Park Riverside Fwy K 91 ALBERTSONS TARGET PHARMACY COSTCO Featherly Regional Park SPROUTS WEIR CANYON Grove St Weir Canyon Rd Miller St b Santa Ana River Greenbelt ANAHEIM CANYON Riverdale Ave 91 Corridor J Graphic ANAHEIM Imperial Hwy Santa Ana Canyon Rd Riverside Fwy FAIRMONT Sunset Ridge Rd Orange Olive Rd SANTIAGO VIA ESCOLA Canyon Rim Rd SERRANO Conn ection to C Corridor A Serrano Ave Santiago Oaks Regional Park Corridor Details miles of existing bikeways 8.47 miles of new bikeways 0.69 miles of new trails = 9.16 miles of bikeways Existing Bikeway Proposed Class I Bike Path Proposed Class II Bike Lane with Striped Buffer Proposed Class IV Key Facts $33.4 million Project Cost 9.16 miles Of Bikeway Improvements 8 Parks within 1/4-mile Served 8 Schools + Universities within 1/4-mile Served 95k People within 1/4-mile Served (approx.) Legend City Boundary Existing Proposed Class I (Regional) Class I (Local) Class II Class III Parks Schools Civic Shopping Scoring Lower Higher Safety Needs Public Support Trip Demand Ease of Implementation Bikeway Completion Cost per Benefit Disadvantaged Areas Avoids Steep Hills 54
59 OC Foothills Bikeways Strategy CORRIDOR K: BASTANCHURY CORRIDOR Overview This corridor feeds into the El Cajon and Santa Ana River trails, and has strong safety needs, with higher vehicle speeds on Bastanchury Road. The corridor scores highly on Ease of Implementation as only a few linkages are required for connecting a number of existing and proposed facilities to serve this portion of the district, which has grown considerably in recent years. This corridor was identified nearly halfway into the current project s lifespan by the PDT. As a result, the same opportunities for feedback - through voting and comments, that were available for other corridors (and which go into calculating the final values for Public Support scoring) were not available for Corridor K. Opportunities and Constraints Crossing physical and environmental barriers, Corridor K is additionally constrained by steep elevation in places. The route can connect a number of bicycle facilities and provide increased comfort for a growing number of cyclists finding their way to this route. At its northwestern terminus, this corridor connects to two corridors identified for development within each Brea, and Placentia, respectively. Coordination between jurisdictions will ensure that these linkages receive due consideration in all future designs. Major Regional Destinations The East Anaheim Community Center and Santa Ana River trail are central connections for this upper foothills corridor. The corridor also connects into the close-to-completion OC Loop - 66 miles of seamless connections and an opportunity for people to bike, walk and connect to some of California s most scenic beaches and inland reaches. 55

60 OCTA - Orange County Transportation Authority 3.2 CORRIDOR EVALUATION Figure 3.15 summarizes the evaluation, intended to help provide context for each corridor in light of different potential funding sources and community priorities. The first table shows each corridor and how it fares in each evaluation criteria category, shown as round ideograms known as Harvey Balls that represent a rating on a scale of 1 (lowest rating, blank circle) to 5 (highest rating, black-filled circle). The second table shows the evaluation criteria categories and groups the corridors that achieve the same score for each category; for example, Corridors D, E, and F have the highest rating (black-filled circle) for Safety Needs. Attendees at the entrance station for the second public Roundtable, where the corridor evaluation results were first presented. 56
61 OC Foothills Bikeways Strategy Figure 3.15: Corridor Evaluation Lower Higher Safety Needs Public Support Trip Demand Ease of Implementation Bikeway Completion Cost per Benefit Serve Disadvantaged Areas Avoids Steep Hills A. Regional Parks Connector B. Lakeview-San Diego Creek C. Cambridge-Portola D. Taft Corridor E. Walnut-Chapman F. Santiago Canyon G. Old Town-Great Park H. Warner-Edinger I. Laguna Canyon-Irvine Station J. Jeffrey Corridor K. Bastanchury Corridor Corridor Scoring Summary Higher..... Lower Safety Needs Public Support Trip Demand D, E, F B, F G, J A, B, C, G, I, J, K H A, C G, I H, J D, E, K B, E D, I Ease of Implementation G, J C, H C, H Bikeway Completion A, C, G Cost per Benefit A, F, K A, F, I D, F A, F, K G, I Serve Disadvantaged Areas Avoids Steep Hills D, E B, J D, E D, G D B, K I, K H, J E, H B, C B, E C, H I, J C, G, H, I B, J A, F, K A, E, F, K 57
62 OCTA - Orange County Transportation Authority EVALUATION CRITERIA Each corridor was evaluated using criteria consistent with many competitive grant program criteria and building from criteria specified in OCTA s 2009 CBSP and the Districts 1 & 2, District 4, and District 5 Bikeways Strategy reports. The criteria consider a range of opportunities, constraints, and other factors affecting demand and feasibility. The evaluation criteria include the following categories: Safety Needs: Level of Stress: addresses perceived safety related to posted traffic speeds, traffic volumes and existing bikeway type. In addition to serving as a proxy for safety, the existing bikeway factor is a measure of existing network supply. Stress increases with traffic speeds, volumes and lack of existing bikeways. LTS scores can range from 1 (low stress) to 4 (high stress). Collisions: addresses safety through five years of reported data (from SWITRS), normalized by bike-involved collisions per mile. For each corridor, a 100' buffer will be defined and all reported collisions for the five-year period up to and including 2012 counted. If no facility exists, the adjacent corridor will be assessed. The total reported collisions would be divided by corridor length in miles. Public Support: incorporates public priorities through a Public Demand Index. A combination of votes from the survey and public roundtable events were used as inputs. Trip Demand: based on the OCTA Bicycle Priority Index (BPI), a measure of population and employment density, land use, local schools and transit that influences usage. Higher numbers represent a higher estimated potential demand. Ease of Implementation (physical constraints): tallies physical constraints such as right of way, on-street parking, and other chokepoints. Fewer constraints results in a higher score as the corridor will be easier to implement. Points will be assigned as follows: 0 (significant), 1 (minor), 2 (none). Higher scoring corridors are considered easier to implement and therefore prioritized for treatment. 58
63 OC Foothills Bikeways Strategy Bikeway Completion: Corridor: the proportion of the corridor that is already built to at least minimum Caltrans standard for the bikeway type that is proposed helps to prioritize corridors which are already partially built. This will be assessed by a ratio of proposed length to total length. A high ratio means that the corridor has no existing bikeways to build on. Regional Network: regional corridors which link to other regional and local bikeways help complete the network measured by number of intersections the proposed regional bikeway corridors have with other existing and planned bikeways, as well as to other potential regional bikeway corridors. Although partly captured in the BPI method, the number of links/crossings with other bikeways is used as the BPI does not include the proposed regional corridors. Connections to Class III routes will be excluded, unless that Class III route is a bicycle boulevard featuring traffic calming, including turn/access restrictions and speed reduction measures. The number of connections will be divided by length in miles to enable comparability. Cost per Benefit (economic efficiency): measures the financial benefits associated with the corridor, normalized by the number of anticipated users (in turn a product of the facility length), and divided by the rough order construction cost estimates. Serves Disadvantaged Areas: based on California EnviroScreen 2.0 data, the average population characteristics score (children and elderly, low birth-weights, asthma, educational attainment, linguistic isolation, poverty, and unemployment) within a 1/4 mile buffer of each corridor alignment is computed. The Environmental Characteristics score does not vary significantly and will be excluded. The average Population Characteristic score for the 1/4 mile area surrounding each alignment was used for this criteria category. Methods may include using an average score for the alignment or a total number of corridor miles in the top 30% most socially disadvantaged (statewide). Avoids Steep Hills: although hilly routes may be more attractive for some enthusiast/fitness bicyclists, the general public is more likely to use flatter routes. The average upslope for the hilliest 500 feet of any given corridor will be computed, using elevation gain in real feet from the National Elevation Dataset s 10m Digital Elevation Model. Based on work by Broach et al (2012), a score of 3 will be assigned to flat routes (0-1.9% average) 2 for slightly hilly routes (2-3.9%), 1 for hilly routes (4-5.9%), and 0 for very hilly routes (>6%). If a corridor has a hilly section only at one end, segmentation to exclude the hilly portion may be considered. 59

64 OCTA - Orange County Transportation Authority COST ESTIMATE ASSUMPTIONS Planning level cost estimates were prepared for each corridor for use in the economic efficiency criterion. The costs utilized in the ranking analysis include high-level estimates based on cost averages of similar facilities. Estimates include costs for sign installations at intersections, major intersection improvements, grading and retaining walls, and other anticipated construction costs including bridges, but do not include environmental clearance, design, utility impacts, or maintenance costs. Refer to Table 3.3 for detailed cost estimate assumptions. Table 3.4 summarizes the results of the eleven proposed corridors within District 3 with length costs shown, based on the following key assumptions utilized during the preparation of the cost estimates by facility type: Bicyclists on the Santa Ana River Trail approaching the Glassell Street bridge, where a connection to Corridor C: Cambridge - Portola is proposed. 60
65 OC Foothills Bikeways Strategy Table 3.3: Cost Estimate Assumptions Item Unit Rate Comment Class I Bikeways (Bike Path / Shared Use Path) New Class I Facility Linear Foot $150 Installation of new Class I. Facility where no existing path exists. 10' path construction, striping, and amenities Grading / Retaining Wall Linear Foot $500 Assumes Grading and Approx. 6-8ft Retaining wall in areas where Class I is bring proposed in areas of steep existing grades Class II Bikeways (Bike Lanes) New Class II Facility Linear Foot $28 Based on signing and striping of buffered Class II facility where no existing facility exists New Class II Facility w/ Widening Linear Foot $1,122 Total for widening and installation of Class II on both sides of road Class III Bikeways (Bike Routes) New Class III Facility Linear Foot $5 Based on sharrow striping and wayfinding signs approximately every 800 ft. Class IV Bikeways (Separated Bikeways) New Class IV Facility Linear Foot $50 Based on Alameda Costs assuming Protected Bike Lane (One-Way Cycle Track on both sides of road with striped buffers and soft-hit posts) New Class IV Facility w/ Widening Linear Foot $1,150 Total for widening and installation of Class IV on both sides of road Intersection Cost Minor Intersection (Signalized - No MPAH Roadways) Each $780 Bike Sign and Directional Arrow//Route Label Intermediate Intersection (Signalized - One MPAH Roadway) Each $50,000 Assumed Average Cost of Intersection Treatment Major Intersection (Signalized - Both Legs MPAH Roadways) Each $111,172 Includes wayfinding signage, bike lanes striping, green conflict zones, bike boxes, bike loops and/or video detection) Intersection Crossing Upgrades Each $89,600 Intersection Crossing Upgrades or midblock HAWK, signs Roundabout Each $200,000 Based on Long Beach Freeway Interchange Treatment Each $2,000,000 Rough cost for proposed treatment at interchange, which may involve ped/bike crossing signals at ramps, street and or bridge widening etc. Crossing Cost New Bridge Linear Foot $1,200 Assuming $100 per SF for construction of 12' Wide Bridge Contingency Contingency 30% 61
66 OCTA - Orange County Transportation Authority Table 3.3: Cost Estimate Assumptions (continued) Class I Bikeways (Bike Path / Shared Use Path) Existing Facilities Upgrade wayfinding on existing routes New Facilities Construction of new Class I bikeway includes 10-foot wide pavement with 2-foot wide shoulders and signage/wayfinding Street crossings assumed to be at-grade either using nearby existing signalized intersections - no new traffic signals assumed Bridges over flood control channels were assumed, where appropriate Class II Bikeways (Bike Lanes) Existing Facilities Upgrade wayfinding on existing routes Upgrade Class II striping to include buffer between vehicle travel lanes and the bike lane New Facilities Stripe new Class-II on-street bike lane with buffer where curbside travel lane is greater than 16 feet wide Widening of street by 4 feet to accommodate new Class II on-street bike lane (buffered) where curbside travel lane is less than 16 feet wide with general costs for widening and ROW acquisition Where on-street parking exists, initial cost assumes removal on on-street parking instead of street widening. The feasibility of removing parking will be evaluated in a later phase. Class III Bikeways (Bike Routes) Existing Facilities Upgrade wayfinding on existing routes, includes signage, sharrows, and signage for regional corridor New Facilities New sharrows, bike route signage, and way-finding signage. Enhanced bike boulevard treatments such as traffic calming, roundabouts, or bikeway channels were not included in cost estimates pending more detailed feasibility review Class IV Bikeways (Separated Bikeways) Existing Facilities N/A (No existing Class-IV facilities) New Facilities Installation of One-Way Cycle Track on both sides of road with striped buffers and soft-hit posts Widening of street by 4 feet to accommodate new Class IV where curbside travel lane is less than 16 feet wide with general costs for widening and ROW acquisition Narrowing of vehicular lanes by restriping 62
67 OC Foothills Bikeways Strategy Table 3.4: Corridor Cost Estimates Corridor Total Bikeways (miles) New Bikeways & Trails (miles) Project Cost (millions) Cost Assumptions A: Regional Parks Connector $40.0 Fairmont Pedestrian Bridge Project at SR-91 ($15.5M) Requires widening along Serrano Ave. between Santiago Creek and Nohl Ranch Rd. ($13.7M) B: Lakeview San Diego Creek $26.6 C: Cambridge Portola $11.4 D: Taft Corridor $2.2 Primarily enhancing existing Class-II with buffered Class-II E: Walnut Chapman $3.7 F: Santiago Canyon $15.9 Addition of Class-I trail along Santiago Cyn Rd. ($12.3M) G: Old Town Great Park $21.2 New pedestrian bridge over SR-133 from Towngate Rd. to Perimeter Rd. Assumes costs for improvements within Great Park Widening required on Irvine Blvd. between the Great Park and Alton Pkwy. H: Warner Edinger $6.2 Requires new pedestrian bridge over Como Channel and Drainage Channel along Edinger Ave. at Tustin Metrolink Station ($960K) Class-I path with grading required near at the Jamboree Rd. underpass at Como Channel ($2.3M) I: Laguna Canyon Irvine Station $13.9 Bicycle and Pedestrian Bridge over I-405 along Laguna Canyon Rd. ($6M) Major interchange crossing improvements required at SR-241 / Alton Pkwy ($2M) J: Jeffrey Corridor $13.6 I-5 Pedestrian Bridge at Jeffrey Rd. ($10.7M) K: Bastanchury Corridor $33.4 Major interchange crossing improvements at Weir Canyon Rd. at SR-91 ($2M) Requires widening of Serrano Ave. between Weir Canyon Rd. and Canyon Rim Rd. ($8.5M) TOTAL $187.9 Note: The costs shown above are high-level estimates based on averages of similar facilities. Costs Include costs for sign installations at intersections, major intersection improvements, grading and retaining walls, and other anticipated construction costs including bridges, but do not include environmental clearance, design, utility impacts, or maintenance costs. 63
68 OCTA - Orange County Transportation Authority 4.0 ACTION PLAN OCTA and the local jurisdictions will continue to work together to advance concepts along the regional bikeway network. There are numerous opportunities along the proposed regional bikeway corridors for early action efforts (see Figure 4.1). Potential actions that could be taken in the near term include: moredetailed evaluation, neighborhood outreach, grant funding pursuit, and final design. Figure 4.1 Early Action Projects Opportunities Map BREA CHAPMAN BRISTOL EDINGER PLACENTIA CIVIC CENTER MACARTHUR MELROSE 57 b ORANGE LA VETA WARNER MAIN BATAVIA Santa Ana River Trail COLLINS 5 BATAVIA 55 DYER VALENCIA GLASSELL b b SANTA ANA CHESTNUT GLASSELL TAFT JAMBOREE!(D UNIVERSITY MEATS CAMBRIDGE ALTON b TUSTIN KATELLA WALNUT RED HILL VON KARMAN 405 YORBA LINDA!(B CHAPMAN BUENA VISTA MAIN UNIVERSITY CAMPUS BASTANCHURY WANDA!(H MICHELSON LA PALMA VILLA PARK TAFT FAIRHAVEN Santiago Creek Trail BARRANCA HOLT WALNUT CULVER LAKEVIEW NOHL RANCH VILLA PARK BRYAN NEWPORT b HARVARD!(E!(G!(K SANTA ANA CANYON VIA ESCOLA ESPLANADE TUSTIN RANCH San Diego Creek Trail El Cajon Trail LA COLINA YORBA LINDA ANAHEIM TUSTIN!(J COUNTY SANTIAGO CANYON CHAPMAN CANYON VIEW Peters Canyon Trail 5 BRYAN YALE 261 Option A TRABUCO IRVINE CENTER FAIRMONT Option B!(C 91 IRVINE!(A SERRANO I Proposed JEFFREY IRVINE RIDGE VALLEY WEIR CANYON 241 MARINE WAY PORTOLA 133 b ALTON Foothills Corridors!(F!(A!(B!(C!(D!(E!(F!(G!(H!(I!(J 241!(K Corridor Facilities Existing!(I Regional Parks Connector Lakeview - San Diego Creek Cambridge - Portola Taft Corridor Walnut - Chapman Santiago Canyon Old Town - Great Park Warner - Edinger Laguna Canyon - Irvine Station Jeffrey Corridor Bastanchury Corridor Potential New/Enhanced Facilities Regional Trails Existing Proposed Early Action Projects Connection to Bikeways Corridor *Options A & B through Peters Canyon Regional Park area are pending detailed study by OC Parks. COUNTY PORTOLA SANTIAGO CANYON LAGUNA CANYON MUIRLANDS FORD 73 CULVER BONITA CANYON BAKE LOS ALISOS Miles EL TORO 64


69 OC Foothills Bikeways Strategy 4.1 EARLY ACTION PROJECT EXAMPLES The following specific projects are a few examples of early action projects already in the pipeline or ready to be advanced: Corridor A, Fairmont Bridge: This concept requires a bridge crossing over the 91 freeway and the Santa Ana River at Fairmount Avenue. This will connect Anaheim Hills with the bikeway along the north bank of the river. The City of Anaheim identified this, and other bridges, to better connect the hills with the river trail. Having this bridge in both the City bike plan and the regional study will strengthen its funding eligibility. A concept for the bridge is shown, but early actions will focus on securing money to plan and design the bridge. Example Bridge Concept Corridor F, Santiago Canyon Road Safety Improvements: Currently, Santiago Canyon Road serves the canyon communities, but is also very popular with motorists, motorcyclists and bicyclists who enjoy the natural scenic beauty hard to find elsewhere in Orange County. The County of Orange has already pursued funding for general safety improvements but this is now another tool to strengthen their next pursuit of funds for more safety improvements to serve all users. Improvements could include a buffered Existing Santiago Canyon Road bike lane, enhanced warnings for curves such as flashing beacons and reflective markers, and surface treatments for high friction. Corridor G, Tustin Main Street: Aligned with efforts by the City of Tustin, Corridor G could benefit from a dramatic redesign of Main Street in front of the Civic Center leading into the Downtown. As shown in the concepts at right, improvements on Main Street could include wider sidewalks, bike lanes, a landscaped median, and a gateway arch to link the Civic Center area with Old Town. These ideas have already been reviewed at the City of Tustin, and the regional bikeway study helps build momentum for this positive change. Corridor J, JOST Bridge: Another project with a lot of momentum is the Jeffrey Open Space Trail (JOST) along Corridor J. As with the Fairmont Bridge concept in Anaheim, having this bridge idea in the regional study will strengthen its funding eligibility. The existing I-405 shared use path bridge on the JOST is shown, above, as an example. Tustin Main Street Concept Existing JOST Bridge 65

70 OCTA - Orange County Transportation Authority 4.2 PROGRAMMATIC RECOMMENDATIONS Of the five E's of bicycle planning, four are related to programs: encouragement, education, enforcement and evaluation. Programs should complement engineering improvements such as bike paths, lanes, and routes by providing the education and encouragement to ensure that the facilities get maximum utilization ENCOURAGEMENT OCTA has prioritized the advancement of bicycling in Orange County, which includes safety programs and community events. Each year, OCTA leads the celebration of National Bike Month in May with local events and bicycling promotions. OCTA s safety program has created entertaining and educational videos, brochures and other pieces of collateral to raise awareness for general safety topics, the three feet for safety act, wrong-way riding and visibility during low-light conditions. The safety program also consists of organizing educational outreach events like bicycle rodeos, school assemblies and community bicycling events. Whether you bike to work or school, for exercise or recreation bicycling is a fun, healthy and efficient way to travel in Orange County and OCTA is dedicated to making our streets safer for all road users. Safe Routes to School Program The National Center for Safe Routes to School ( provided program tools which focus on both education and infrastructure development with the goal of increasing the number of children who walk and bike to school on a regular basis. The program offers promotional and educational materials to help communities develop effective safe routes to schools programs. The statewide Active Transportation Program (ATP) for funding bike and pedestrian programs includes funding opportunities for SRTS programs. These grants can be used for either infrastructure or educational programs that promote children walking and biking to school. One of the advantages of SRTS grants is that they require no local match. For more on funding opportunities, see Chapter 6. National Bike month National Bike Month is a nationwide event held in May of each year. The intent of the month long campaign is to increase awareness of bicycling, its benefits and impact, as well as encourage bicycling across all segments of the population. OCTA has an active campaign each May that includes biketo-work day, and events throughout the month. In addition, many of the cities in District 5 hold their own bike-related events. For more information on National Bike Month, go to the League of American Bicyclists website: 66
71 OC Foothills Bikeways Strategy Employer-Based Encouragement Programs Many companies, OCTA, and participating cities can work with or provide information to employees about commuting by bicycle. The annual award-winning City of Portland SmartTrips program, which has consistently shown a 9-13% reduction in drive-alone trips in the selected target area since 2004 at a cost of approximately $20 per household, is a good reference example for an evidence-based program that can be implemented easily in District 3. More information at: gov/transportation/43801 Bike Fleet Cities and large employers are starting to see the benefit in developing bike fleets for employee use during the day. They can be used for errands or meetings during the day, or recreational rides during lunch. Many of these daytime trips, particularly within a downtown or employment center, are within bicycling distance. Bike fleets reduce a public agency s dependence on automobile fleets or personal vehicles and associated employer reimbursements. Because several Orange County cities have multiple divisions in separate buildings, many of which are relatively close to one another, a municipal bike fleet could be a great asset to city employees. Employer/Employee Incentives Employers can lower their FICA and Federal income tax costs by offering employees up to $220 per month for transit use and bicycle commuting through the Federal Commuter Choice program. Options exist so employers have more flexibility in affording the full Commuter Benefit. These include partial employer subsidies ( fare share benefit ) and pre-tax deductions. Launch Party for New Bikeways When a new bikeway is built, some residents will become aware of it and use it, while others may not realize that they have improved bikeway options available. Conducting opening events where you invite local dignitaries, school groups, bike clubs, and local businesses to participate is a great way to help raise early awareness and use of new facilities. Open Street Events Open streets events have many names: Sunday Parkways, Ciclovias, Summer Streets, and Sunday Streets. These events have become increasingly popular across the country. In Southern California, these events have been hosted from Los Angeles to Santa Ana, Garden Grove, and San Diego. Los Angeles events routinely attract over 100,000 participants and have encouraged large numbers of people who do not regularly ride a bike to come out and enjoy car-free city streets. One of the many benefits of these events is highlighting the businesses along the route and showing people how easy it is to dine and shop by bike. A recent study from UCLA, titled Economic impacts of CicLAvia Study Finds Gain To Local Businesses discusses the significant economic impact of these events. For a guide to conducting an open streets event, go to the Alliance for Biking and Walking website: 67
72 OCTA - Orange County Transportation Authority Bicycle Friendly Community The League of American Bicyclists (LAB) recognizes communities that improve bicycling conditions through education, encouragement, enforcement and evaluation programs. Communities can achieve platinum, gold, silver, or bronze status or an honorary mention. Bicycle friendliness can indicate that a community is healthy and vibrant. Like good schools and attractive downtowns, bicycle friendliness can increase property values, spur business growth and increase tourism. In District 3, the City of Irvine is currently recognized as a silver-level Bicycle Friendly Community. For information on the advantages of being recognized as a bike friendly community and on obtaining bike friendly status see the League of American Bicyclists website EDUCATION Bicycle Resource Website Educating both bicycles and motorists is an important aspect of being bike friendly. Bicyclists need to understand safe bicycling behavior and the basics of bicycle maintenance. They need to understand how to deal with traffic as well as pedestrians and other bicyclists. Motorists need to understand that bicyclists have the same rights that vehicle drivers have. Now motorists need to understand safety rules, such as the 3-foot law. OCTA hosts several pages dedicated to bicycling and bicycle safety: bike/riding-in-orange-county/oc-bikeways-map/ Advertisements for all bikeways after implementation Bicycling tips including information on how to: Carry items using baskets and panniers Properly lock a bike Ride in the rain with help from fenders and rain gear Tips can also include information on the importance of bicycle lights and reflectors. Bikeway maintenance and repair phone numbers Bicycle events calendar Bicycle traffic skills classes information Multilingual versions 68
73 OC Foothills Bikeways Strategy Bicycle resource websites may also include: Marketing Concurrent with New Facilities Education about new facilities can help notify and educate both cyclists and motorists about newly installed facilities. OCTA has a history of effective marketing using local events to highlight new facilities. These include special events associated with opening segments of facilities, such as ribbon cutting ceremonies and bike rides where local private and governmental entities are invited to participate, along with local school and youth groups. Social media and the web are also important tools for marketing new facilities. A recent example of a marketing campaign associated with the OC Loop, a 66-mile largely off-street bike and pedestrian facility that connects northern inland OC with the beach communities can be found at OCLOOP A marketing campaign that highlights bicyclists and pedestrian safety is an important part of creating public awareness. OCTA has a strong history of creating community outreach programs, using social media, and creating public service messages including items such as banner ads, in particular those placed on OCTA buses. Another good example using these placements is Los Angeles Metro s Every Lane is a Bike Lane Campaign, which offers a compelling take on share the road : metro.net/2013/04/11/every-lane-is-a-bike-lane/ OCTA s yearly Bike Month Campaign has been very effective at conveying a safety message for both motorists and bicyclists. Funding sources for similar campaigns that can be conducted at the city level are discussed in Chapter 6. Adult Bicycling Traffic Skills Classes Most adult bicyclists have not received any formal training on safe bicycling practices, the rules of the road, and bicycle handling skills. If they received any bike education at all, it was most likely as a child. Now, many of the adults who are being encouraged to return to bicycling feel uncomfortable, in many cases, even riding in their neighborhood. Adult classes offered by League of American Bicyclist certified instructors are available by contacting These courses combine some short lectures about riding skills and simple bike maintenance. More importantly they offer the bicyclist the opportunity to learn new skills or refresh old skills in a safe environment, accompanied by a certified instructor. Youth Bicycle Skills Classes School-based bicycle education programs educate students about the rules of the road and safe bicycling skills. Safe routes to schools (SRTS) educational grants are available for these programs, which are typically offered for upper elementary and middle school age children. Funding strategies for these programs is discussed in Chapter 6. Bike trains and walking school buses, where parents or staff guide students to and from school over a set route at a set time, are being added in more and more schools across Southern California. In some cases these are formal programs that are sponsored by the school. In other cases the programs are organized and coordinated informally by parents who want the children to have the opportunity to walk and/or bike to school. These programs allow children with different skill levels to interact and provide an alternative to the class-room or school-yard based training. 69

74 OCTA - Orange County Transportation Authority ENFORCEMENT Bicycle Patrol Police bicycle patrols not only increase the mobility of officers in dense areas but also offer the opportunity for officers to interact with bicyclists in a non-confrontational, low key manor. Bicycle patrol officers know both the law as well as the challenges faced by bicyclists on a day-to-day basis. These officers can demonstrate and explain safe riding techniques as well as provide enforcement if appropriate. Speed Feedback Signs and Rest in Red Signals Vehicle speeds greatly affect the severity of the crash for the bicyclist or pedestrian. The figure to the right, previously discussed in the Rationale section (Section 2.2), shows that at a speed of 20 MPH, 50%. the percentage of pedestrians being killed in a crash is under 5% but at a speed of 40 MPH, the percentage is 85% ( saferoutesinfo.org/engineering/slowing_down_ traffic.cfm). Speed feedback signs have been shown to be an effective means of making the driver more aware of their speed and encouraging them to reduce their speed. A relatively new traffic engineering tool involves setting traffic lights for when vehicles approach a signal over the legal speed limit, the light turns red. Once the vehicle slows to below the limit, it will turn green, allowing the vehicle to proceed. The City of Long Beach has recently installed these with success at two locations. Targeted Enforcement Targeted enforcement uses the focused efforts of police officers at known locations where compliance is low. According to the Federal Highway Traffic Administration (FHWA) these programs are most effective when crash, citation or other sources of information suggests that the site is unusually hazardous due to illegal driving practices. According to the FHWA, "The advantage of targeted enforcement is that it can be implemented in a very short period of time and identified problems can be addressed almost immediately. The disadvantage is that the effectiveness is usually measured in terms of days and perhaps weeks, rather than months or years." Adult Bicycle Education Diversion Program The State of California s Assembly Bill 902 authorizes adult bicycle diversion programs. In these programs, when bicyclists are given a traffic ticket they are provided the opportunity to take a bike education program rather than paying the full price of the ticket. 70

75 OC Foothills Bikeways Strategy EVALUATION Evaluation programs measure and evaluate the impact of projects, policies and programs. Surveys Surveys are useful for eliciting infrastructural deficiency and attitudinal information. These may be intercept surveys conducted in the field during events or in locations such as bike shops. They may also be conducted online. For this report both online and face-to-face surveys were used to collect both behavioral information as well as indications of preferred routes and to determine corridor rankings. Counts Bike counts are an important part of any bike program. As the National Bicycle and Pedestrian Documentation Project says, "One of the greatest challenges facing the bicycle and pedestrian field is the lack of documentation on usage and demand. Without accurate and consistent demand figures, it is difficult to measure the impacts of investments in these modes." Standard forms and instructions for bike counts can be downloaded from the National Bicycle and Pedestrian Documentation Project website ( In addition to yearly counts, counts can be done on a before and after basis to show the impact of a specific project. Most projects that are funded by government grants routinely incorporate these counts into the project plans. Recently, several cities have started to use automated counters that are useful in collecting long term counts, establishing daily, weekly, or monthly variations, and almost always requiring fewer person hours. San Diego reflects the region s counts on a publicly accessible website: ParcPublic/?id=681 The photo at right shows one form of counter that has recently been installed on the Santa River Trail. Several other cities including Portland, OR, Minneapolis, MN and Arlington, VA, are installing totem counters such as the one shown on the bottom right. These counters not only keep track of the number of bicyclists, but visibly display the results on a real time basis. The Santa Ana River Trail in Yorba Linda, near the intersection of E. La Palma Ave and Via Lomas de Yorba E. Automated counters are an important element in helping determine the effectiveness of bike programs. With their effectiveness and efficiency in data collection and their reasonable costs ($2,000-$3,000 or less per installation), they can be incorporated in most future projects. 71


76 OCTA - Orange County Transportation Authority A recent project sponsored jointly by SCAG and the Los Angeles County MTA is designed to help compile, organize, make accessible and create a standard for bike count data in Southern California. As a result of the project, a clearinghouse for bike count data has been created and is being maintained by UCLA. The project includes information on best practices and forms for bike counts, a literature review, and a white paper on bike counts, travel demand modeling, and benefits estimation. For more information on the Bike Count Clearinghouse see ucla.edu. Photo Source: Eco-Counter BICYCLE AND TRAILS REPORT CARD Assess progress towards achieving the goals of this Strategy with regular updates for City staff, elected officials, and the general public. It is important to track accomplishments, relate information regarding setbacks or delays, and dynamically adjust whether the Strategy is meeting its stated timeline and objectives. This report should include relevant cycling metrics (number of riders, new on-street and off-street biking facility miles, major completed projects, crashes) and may also include information on user satisfaction, public perception of safety, or other qualitative data that have been collected and are related to walking and bicycling. Cumulative bikeway and trail mileage should be shown to demonstrate long-term progress in improving infrastructure. Reports should be shared with the public to demonstrate the region s commitment to improving walking and cycling. Residents at each of the roundtable events expressed an interest in tracking the progress of this plan, as well as receiving regular updates regarding trail closures or roadwork. Inter-agency and Cities cooperation will be critical to ensure the information is as current as possible. Sample annual reports: City of New York NYC: City of San Francisco - San Francisco, CA: bike_report_card_2006.pdf City of Seattle s Bicycle Report Card infoaboutcommutingmodes/bicyclereportcard_web.pdf City of Cincinnati s Bike Report Card 72


77 OC Foothills Bikeways Strategy 5.0 BICYCLE FACILITY TOOLKIT 5.1 INTRODUCTION This chapter is intended to assist the Orange County Transportation Authority and local jurisdictions within the District 3 study area in the selection and design of bicycle facilities. District 3 is unique from the other Districts in Orange County in which corridors are on major arterials due to the topography of District 3. Many of these corridors have existing bike lanes; however an extensive shared-use path network also exists throughout District 3. The following pages pull together best practices by facility type from public agencies and municipalities nationwide. Within the design section, treatments are covered within a single-sheet tabular format relaying important design information and discussion, example photos, schematics (if applicable), and existing summary guidance from current or upcoming draft standards. Existing standards are referenced throughout and should be the first source of information when seeking to implement any of the treatments featured here NATIONAL STANDARDS Several agencies and organizations provide design standards for bike facilities in the US. The most commonly used manuals that outline these standards are listed below. The Federal Highway Administration's Manual on Uniform Traffic Control Devices (MUTCD) defines the standards used by traffic engineers nationwide to install and maintain traffic control devices on all public streets, highways, bikeways, and private roads open to public traffic. The FHWA MUTCD forms the basis of the California MUTCD, which is the standard used by most cities in California. 73
78 OCTA - Orange County Transportation Authority To further clarify the MUTCD, the FHWA created a table of contemporary bicycle facilities that lists various bicycle related signs, markings, signals, and other treatments and identifies their official status (e.g., can be implemented, currently experimental). See Bicycle Facilities in the Manual on Uniform Traffic Control Devices. Some newer bikeway treatments may not be explicitly covered by the MUTCD, and as such are often subject to experiments, interpretations and official rulings by the FHWA. The MUTCD Official Rulings is a resource that allows website visitors to obtain information about these supplementary materials. Various documents (such as incoming request letters, response letters from the FHWA, progress reports, and final reports) are available on the site. American Association of State Highway and Transportation Officials (AASHTO) Guide for the Development of Bicycle Facilities, updated in June 2012 provides guidance on dimensions, use, and layout of specific bicycle facilities. The standards and guidelines presented by AASHTO provide basic information, such as minimum sidewalk widths, bicycle lane dimensions, detailed striping requirements and recommended signage and pavement markings. The National Association of City Transportation Officials (NACTO) 2014 Urban Bikeway Design Guide is the newest publication of nationally recognized bikeway design standards, and offers guidance on the current state of the practice designs. The intent of the guide is to offer substantive guidance for cities seeking to improve bicycle transportation in places where competing demands for the use of the right of way present unique challenges. All of the NACTO Urban Bikeway Design Guide treatments are in use internationally and in many cities around the US. Meeting the requirements of the Americans with Disabilities Act (ADA) is an important part of any bicycle and pedestrian facility project. The United States Access Board s proposed Public Rights-of-Way Accessibility Guidelines (PROWAG) and the 2010 ADA Standards for Accessible Design (2010 Standards) contain guidance and standards, respectively, for the construction of accessible facilities. This includes requirements for sidewalk curb ramps, slope requirements, and pedestrian railings along stairs. Some of these treatments are not directly referenced in the current versions of the AASHTO Guide or the MUTCD, although many of the elements of these treatments are found within these documents. In all cases, engineering judgment is recommended to ensure that the application makes sense for the context of each treatment, given the many complexities of urban streets. Below is a list of the websites associated with these standards and guides and their associated manuals. 1. FHWA. Bicycle Facilities and the Manual on Uniform Traffic Control Devices fhwa.dot.gov/environmentlbikeped/mutcdbike.htm 2. MUTCD Official Rulings. FHWA public-rights-of-way
 (2012) This manual establishes uniform policies and procedures to carry out highway design functions for the California")
79 OC Foothills Bikeways Strategy STATE STANDARDS AND GUIDELINES California Highway Design Manual (HDM) (2012) This manual establishes uniform policies and procedures to carry out highway design functions for the California Department of Transportation. The 2012 edition incorporated Complete Streets focused revisions to address Caltrans Deputy Directive 64-R-1. Under existing California law, all local agencies responsible for the development or operation of bikeways or roadways where bicycle travel is permitted must utilize Caltrans adopted design criteria and specifications as contained in the HDM and MUTCD. For bikeways that do not meet these standards, cities and counties can apply for a design exception from Caltrans. However, according to the Legislative Analyst's review during passage of Assembly Bill 1193 in 2014, "local governments complain that the process is cumbersome and time-consuming. In contrast, cities and counties may, but are not required to, utilize the HDM when designing local streets and roads." AB 1193 allows local governments to adopt alternative national criteria, such as AASHTO's or NACTO's. Complete Intersections: A Guide to Reconstructing Intersections and Interchanges for Bicyclists and Pedestrians (2010) This Caltrans reference guide presents information and concepts related to improving conditions for bicyclists and pedestrians at major intersections and interchanges. The guide can be used to inform minor signage and striping changes to intersections, as well as major changes and designs for new intersections. Main Streets: Flexibility in Design & Operations (2013) This Caltrans booklet is an informational guide that reflects many of the recent updates to the Caltrans manuals and policies that improve multimodal access, livability and sustain ability within the transportation system. The document will help users locate information about standards and procedures descried in the Caltrans Highway Design Manual (HDM), the California Manual on Uniform Traffic Control Devices (California MUTCD) and the Project Development Procedures Manual (PDPM) LandArch/mainstreet/main_street _3rd_edition.pdf NCHRP Legal Digest 53: Liability Aspects of Bikeways (2010) This digest is a useful resource for city staff considering innovative engineering solutions to localized issues. The document addresses the liability of public entities for bicycle collisions on bikeways as well as on streets and highways. The report will be useful to attorneys, transportation officials, planners, maintenance engineers and all persons interested in the relative rights and responsibilities of motorists and bicyclists on shared roadways. New Legislation Allowing Safety Standards Other Than Caltrans' HDM: AB 1193 AB 1193, signed into law on September 22, 2014, allows local agencies to adopt, by resolution, safety standards for bikeways other than Caltrans' Highway Design Manual. According to the Legislative Analyst, 75
80 OCTA - Orange County Transportation Authority AB 1193 "allows local governments to deviate from state criteria when designing bikeways, but does not give them complete control. Cities and counties that elect to use design criteria not contained within the HDM would have to ensure that the alternative criteria have been reviewed and approved by a qualified engineer, are adopted by resolution at a public meeting, and adhere to guidelines established by a national association of public agency transportation officials, such as the National Association of City Transportation Officials." The bill also expands the definition of bikeways to include cycle tracks or separated bikeways, also referred to as "Class IV bikeways," which promote active transportation and provide a right-of-way designated exclusively for bicycle travel adjacent to a roadway and which are protected from vehicular traffic. Types of separation include, but are not limited to, grade separation, flexible posts, inflexible physical barriers, or on-street parking BICYCLE FACILITY STANDARDS COMPLIANCE Some of these bicycle facilities covered by these guidelines are not directly referenced in the current versions of the California Highway Design Manual or the California MUTCD, although many of the elements of these treatments are found within these documents. An "X" marking in Table 5.1 below identifies the inclusion of a particular treatment within the national and state design guides. A "-" marking indicates a treatment may not be specifically mentioned, but is compliant assuming MUTCD compliant signs and markings are used. In all cases, engineering judgment is recommended to ensure that the application makes sense for the context of each treatment, given the many complexities of urban streets. Table 5.1: National and State Design Guides Signed Shared Roadway Caltrans CA MUTCD (2014) X Caltrans Highway Design Manual (2015) NACTO Urban Bikeway Design Guide (2014) Marked Shared Roadway X X Bicycle Boulevard - X Bicycle Lane X X X Buffered Bicycle Lane X - X Cycle Tracks (Protected Bikeways) X X Bike Box Experimental X Bike Lanes to the left of Right Turn Only Lanes X X Green-Colored Bike Lanes in Conflict Areas FHWA Interim Approval (IA-I4) X Combined Bike Lane/Turn Lane Disallowed X Two-Stage Turn Queue Boxes At T-intersections X Intersection Crossing Markings X X Wayfinding Sign Types & Placement X X Wayfinding Sign Placement X X Bicycle Signal Heads X X Active Warning Beacons X X Pedestrian Hybrid Beacons X X 76
.")

81 OC Foothills Bikeways Strategy 5.2 BICYCLE FACILITY SECTION The specific bicycle facility type that should be provided depends on the surrounding environment (e.g. auto speed and volume, topography, and adjacent land use) and expected bicyclist needs (e.g. bicyclists commuting on a highway versus students riding to school on residential streets). FACILITY SELECTION GUIDELINES There are no hard and fast rules for determining the most appropriate type of bicycle facility for a particular location roadway speeds, volumes, right-of-way width, presence of parking, adjacent land uses, and expected bicycle user types are all critical elements of this decision. Studies find that the most significant factors influencing bicycle use are motor vehicle traffic volumes and speeds. Additionally, most bicyclists prefer facilities separated from motor vehicle traffic or located on local roads with low motor vehicle traffic speeds and volumes. Because off-street pathways are physically separated from the roadway, they are perceived as safe and attractive routes for bicyclists who prefer to avoid motor vehicle traffic. Consistent use of treatments and application of bikeway facilities allow users to anticipate whether they would feel comfortable riding on a particular facility, and plan their trips accordingly. This section provides guidance on various factors that affect the type of facilities that should be provided. Facility Classification Facility Continua 77

 are bikeways where bicyclists and cars operate within the same travel lane, either side by side or in single file")
, or designates preferred routes through high-demand corridors.")

, such as bike lanes, use signage and striping to delineate the right-of-way assigned to bicyclists and motorists.")
82 OCTA - Orange County Transportation Authority FACILITY CLASSIFICATION Description Consistent with bicycle facility classifications throughout the nation, these Bicycle Facility Design Guidelines identify the following classes of facilities by degree of separation from motor vehicle traffic. Shared roadways (Class III) are bikeways where bicyclists and cars operate within the same travel lane, either side by side or in single file depending on roadway configuration. The most basic type of bikeway is a signed shared roadway. This facility provides continuity with other bicycle facilities (usually bike lanes), or designates preferred routes through high-demand corridors. Shared roadways may also be designated by pavement markings, signage and other treatments including directional signage, traffic diverters, chicanes, chokers and /or other traffic calming devices to reduce vehicle speeds or volumes. Such treatments often are associated with Neighborhood Greenways. Separated Bikeways (Class II), such as bike lanes, use signage and striping to delineate the right-of-way assigned to bicyclists and motorists. Bike lanes encourage predictable movements by both bicyclists and motorists. Cycle Tracks (Class IV) are exclusive bike facilities that combine the user experience of a separated path with the on-street infrastructure of conventional bike lanes. Shared Use Paths (Class I) are facilities separated from roadways for use by bicyclists and pedestrians. 78


83 OC Foothills Bikeways Strategy RANGE OF BICYCLE FACILITIES The following continua illustrate the range of bicycle facilities applicable to various roadway environments, based on the roadway type and desired degree of separation. Engineering judgment, traffic studies, previous municipal planning efforts, community input and local context should be used to refine criteria when developing bicycle facility recommendations for a particular street. In some corridors, it may be desirable to construct facilities to a higher level of treatment than those recommended in relevant planning documents in order to enhance user safety and comfort. In other cases, existing and/ or future motor vehicle speeds and volumes may not justify the recommended level of separation, and a less intensive treatment may be acceptable. Least Protected Arterial/Highway Bikeway Continuum (without curb and gutter) Shared Lane Marked Wide Curb Lane Shoulder Bikeway Wide Shoulder Bikeway Cycle Track: protected with barrier Most Protected Shared Use Path Arterial/Highway Bikeway Continuum (with curb and gutter) Marked Wide Curb Lane Conventional Bicycle Lane Buffered Bicycle Lane Cycle Track: at-grade, protected with parking Cycle Track: protected with barrier Cycle Track: curb separated Collector Bikeway Continuum Shared Lane Marked Wide Curb Lane Conventional Bicycle Lane Wide Bicycle Lane Buffered Bicycle Lane 79


.")


84 OCTA - Orange County Transportation Authority 5.3 SHARED-USE PATHS A shared use path allows for two-way, off-street bicycle use and also may be used by pedestrians, skaters, wheelchair users, joggers and other non-motorized users. These facilities are frequently found in parks, along rivers, beaches, and in greenbelts or utility corridors where there are few conflicts with motorized vehicles. Path facilities can also include amenities such as lighting, signage, and fencing (where appropriate). General Design Practices Key features of shared use paths include: Frequent access points from the local road network. Directional signs to direct users to and from the path. A limited number of at-grade crossings with streets or driveways. Terminating the path where it is easily accessible to and from the street system. Trails in River and Utility Corridors Separate treads for pedestrians and bicyclists when heavy use is expected. Trails in Abandoned Rail Corridors Trails in Existing Active Rail Corridors Local Neighborhood Accessways 80

85 OC Foothills Bikeways Strategy GENERAL DESIGN PRACTICES Description Shared use paths can provide a desirable facility, particularly for recreation, and users of all skill levels preferring separation from traffic. Bicycle paths should generally provide directional travel opportunities not provided by existing roadways. Guidance Width 8 feet is the minimum allowed for a two-way bicycle path and is only recommended for low traffic situations. 10 feet is recommended in most situations and will be adequate for moderate to heavy use depending on usage 12 feet is recommended for heavy use situations with high concentrations of multiple users. A separate track (5 minimum) can be provided for pedestrian use. Lateral Clearance A 2 foot or greater shoulder on both sides of the path should be provided. An additional foot of lateral clearance (total of 3 ) is required by the MUTCD for the installation of signage or other furnishings. If bollards are used at intersections and access points, they should be colored brightly and/or supplemented with reflective materials to be visible at night. Overhead Clearance Clearance to overhead obstructions should be 8 feet minimum, with 10 feet recommended. Striping When striping is required, use a 4 inch dashed yellow centerline stripe with 4 inch solid white edge lines. Solid centerlines can be provided on tight or blind corners, and on the approaches to roadway crossings. Discussion Terminate the path where it is easily accessible to and from the street system, preferably at a controlled intersection or at the beginning of a dead-end street. Additional References and Guidelines AASHTO. Guide for the Development of Bicycle Facilities FHWA. Manual on Uniform Traffic Control Devices Flink, C. Greenways: A Guide To Planning Design And Development Materials and Maintenance Asphalt is the most common surface for bicycle paths. The use of concrete for paths has proven to be more durable over the long term. Saw cut concrete joints rather than troweled improve the experience of path users. 81

86 OCTA - Orange County Transportation Authority PATHS IN RIVER AND UTILITY CORRIDORS Description Guidance Utility and waterway corridors often offer excellent shared use path development and bikeway gap closure opportunities. Utility corridors typically include powerline and sewer corridors, while waterway corridors include canals, drainage ditches, rivers, and beaches. These corridors offer excellent transportation and recreation opportunities for bicyclists of all ages and skills. Shared use paths in utility corridors should meet or exceed general design practices. If additional width allows, wider paths, and landscaping are desirable. Access Points Any access point to the path should be well-defined with appropriate signage designating the pathway as a bicycle facility and prohibiting motor vehicles. Path Closure Public access to the shared use path may be prohibited during the following events: Canal/flood control channel or other utility maintenance activities Inclement weather or the prediction of storm conditions Discussion Similar to railroads, public access to flood control channels or canals may be undesirable. Hazardous materials, deep water or swift current, steep, slippery slopes, and debris all may constitute risks for public access. Appropriate fencing may be desired to keep path users within the designated travel way. Creative design of fencing is encouraged to make the path facility feel welcoming to the user. Additional References and Guidelines AASHTO. Guide for the Development of Bicycle Facilities FHWA. Manual on Uniform Traffic Control Devices Flink, C. Greenways: A Guide To Planning Design And Development Materials and Maintenance Asphalt is the most common surface for bicycle paths. The use of concrete for paths has proven to be more durable over the long term. Saw cut concrete joints rather than troweled improve the experience of path users. 82

87 OC Foothills Bikeways Strategy PATHS IN ABANDONED RAIL CORRIDORS Description Guidance Commonly referred to as Rails-to-Trails or Rail-Trails, these projects convert vacated rail corridors into off-street paths. Rail corridors offer several advantages, including relatively direct routes between major destinations and generally flat terrain. In some cases, rail owners may rail-bank their corridors as an alternative to a complete abandonment of the line, thus preserving the rail corridor for possible future use. Shared use paths in abandoned rail corridors should meet or exceed general design practices. If additional width allows, wider paths, and landscaping are desirable. In full conversions of abandoned rail corridors, the subbase, superstructure, drainage, bridges, and crossings are already established. Design becomes a matter of working with the existing infrastructure to meet the needs of a rail-trail. The railroad may form an agreement with any person, public or private, who would like to use the banked rail line as a trail or linear park until it is again needed for rail use. Municipalities should acquire abandoned rail rights-of-way whenever possible to preserve the opportunity for trail development. If converting a rail bed adjacent to an active rail line, see Shared Use Paths in Active Rail Corridors. Where possible, leave as much of the ballast in place as possible to disperse the weight of the rail-trail surface and to promote drainage Railroad grades are very gradual. This makes rails-totrails attractive to many users, and easier to adapt to ADA guidelines Discussion It is often impractical and costly to add material to existing railroad bed fill slopes. This results in trails that meet minimum path widths, but often lack preferred shoulder and lateral clearance widths. Rail-to-trails can involve many challenges including the acquisition of the right of way, cleanup and removal of toxic substances, and rehabilitation of tunnels, trestles and culverts. A structural engineer should evaluate existing railroad bridges for structural integrity to ensure they are capable of carrying the appropriate design loads. Additional References and Guidelines AASHTO. Guide for the Development of Bicycle Facilities FHWA. Manual on Uniform Traffic Control Devices Flink, C. Greenways: A Guide To Planning Design And Development Materials and Maintenance Asphalt is the most common surface for bicycle paths. The use of concrete for paths has proven to be more durable over the long term. Saw cut concrete joints rather than troweled improve the experience of path users. 83


88 OCTA - Orange County Transportation Authority PATHS IN ACTIVE RAIL CORRIDORS Description Rails-with-Trails projects typically consist of paths adjacent to active railroads. It should be noted that some constraints could impact the feasibility of rail-with-trail projects. In some cases, space needs to be preserved for future planned freight, transit or commuter rail service. In other cases, limited right-of-way width, inadequate setbacks, concerns about safety/trespassing, and numerous crossings may affect a project s feasibility. Guidance Shared use paths in utility corridors should meet or exceed general design standards. If additional width allows, wider paths, and landscaping are desirable. If required, fencing should be a minimum of 5 feet in height with higher fencing than usual next to sensitive areas such as switching yards. Setbacks from the active rail line will vary depending on the speed and frequency of trains, and available right-of-way. Centerline of tracks Setback is based on space constraints, train frequency, train speed and physical separation minimum Separation greater than 20 will result in a more pleasant trail user experience and should be pursued where possible. Fencing between trail and tracks will likely be required Discussion Railroads may require fencing with rail-with-trail projects. Concerns with trespassing and security can vary with the volume and speed of train traffic on the adjacent rail line and the setting of the shared use path, i.e. whether the section of track is in an urban or rural setting. Additional References and Guidelines AASHTO. Guide for the Development of Bicycle Facilities FHWA. Manual on Uniform Traffic Control Devices FHWA. Rails-with-Trails: Lessons Learned SCRRA. Rail-with-Trail Design Guidelines Materials and Maintenance Asphalt is the most common surface for bicycle paths. The use of concrete for paths has proven to be more durable over the long term. Saw cut concrete joints rather than troweled improve the experience of path users. 84


89 OC Foothills Bikeways Strategy LOCAL NEIGHBORHOOD ACCESSWAYS Description Neighborhood accessways provide residential areas with direct bicycle and pedestrian access to parks, trails, greenspaces, and other recreational areas. They most often serve as small trail connections to and from the larger trail network, typically having their own rights-of-way and easements. Additionally, these smaller trails can be used to provide bicycle and pedestrian connections between dead-end streets, cul-de-sacs, and access to nearby destinations not provided by the street network. Guidance Neighborhood accessways should remain open to the public. Trail pavement shall be at least 8 wide to accommodate emergency and maintenance vehicles, meet ADA requirements and be considered suitable for multi-use. Trail widths should be designed to be less than 8 wide only when necessary to protect large mature native trees over 18 in caliper, wetlands or other ecologically sensitive areas. Access trails should slightly meander whenever possible. From street or cul-de-sac 8 wide concrete access trail from street 5 minimum ADA access Property Line 8 wide asphalt trail Discussion Neighborhood accessways should be designed into new subdivisions at every opportunity and should be required by City/County subdivision regulations. For existing subdivisions, Neighborhood and homeowner association groups are encouraged to identify locations where such connects would be desirable. Nearby residents and adjacent property owners should be invited to provide landscape design input. Additional References and Guidelines AASHTO. Guide for the Development of Bicycle Facilities FHWA. Manual on Uniform Traffic Control Devices FHWA. Federal Highway Administration University Course on Bicycle and Pedestrian Transportation. Lesson 19: Greenways and Shared Use Paths NACTO. Urban Street Design Guide Materials and Maintenance Asphalt is the most common surface for bicycle paths. The use of concrete for paths has proven to be more durable over the long term. Saw cut concrete joints rather than troweled improve the experience of path users. 85


90 OCTA - Orange County Transportation Authority 5.4 PATH ROADWAY CROSSINGS At-grade roadway crossings can create potential conflicts between path users and motorists, however, well-designed crossings can mitigate many operational issues and provide a higher degree of safety and comfort for path users. This is evidenced by the thousands of successful facilities around the United States with atgrade crossings. In most cases, at-grade path crossings can be properly designed to provide a reasonable degree of safety and can meet existing traffic and safety standards. Path facilities that cater to bicyclists can require additional considerations due to the higher travel speed of bicyclists versus pedestrians. Consideration must be given to adequate warning distance based on vehicle speeds and line of sight, with the visibility of any signs absolutely critical. Directing the active attention of motorists to roadway signs may require additional alerting devices such as a flashing beacon, roadway striping or changes in pavement texture. Signing for path users may include a standard STOP or YIELD sign and pavement markings, possibly combined with other features such as bollards or a bend in the pathway to slow bicyclists. Care must be taken not to place too many signs at crossings lest they begin to lose their visual impact. A number of striping patterns have emerged over the years to delineate path crossings. A median stripe on the path approach will help to organize and warn path users. Crosswalk striping is typically a matter of local and State preference, and may be accompanied by pavement treatments to help warn and slow motorists. In areas where motorists do not typically yield to crosswalk users, additional measures may be required to increase compliance. Marked/Unsignalized Crossings Signalized/Controlled Crossings Overcrossings 86

91 OC Foothills Bikeways Strategy MARKED/UNSIGNALIZED CROSSINGS Description A marked/unsignalized crossing typically consists of a marked crossing area, signage and other markings to slow or stop traffic. The approach to designing crossings at mid-block locations depends on an evaluation of vehicular traffic, line of sight, pathway traffic, use patterns, vehicle speed, road type, road width, and other safety issues such as proximity to major attractions. When space is available, using a median refuge island can improve user safety by providing pedestrians and bicyclists space to perform the safe crossing of one side of the street at a time. Crosswalk markings legally establish midblock pedestrian crossing W11-15, W16-9P Guidance Maximum traffic volumes 9,000-12,000 Average Daily Traffic (ADT) volume Up to 15,000 ADT on two-lane roads, preferably with a median Up to 12,000 ADT on four-lane roads with median Maximum travel speed 35 MPH Minimum line of sight 25 MPH zone: 155 feet 35 MPH zone: 250 feet 45 MPH zone: 360 feet Detectable warning strips help visually impaired pedestrians identify the edge of the street Curves in paths help slow path users and make them aware of oncoming vehicles If used, a curb ramp should be the full width of the path R1-2 YIELD or R1-1 STOP for path users Consider a median refuge island when space is available Discussion Unsignalized crossings of multi-lane arterials over 15,000 ADT may be possible with features such as sufficient crossing gaps (more than 60 per hour), median refuges, and/or active warning devices like rectangular rapid flash beacons or in-pavement flashers, and excellent sight distance. For more information see the discussion of active warning beacons. On roadways with low to moderate traffic volumes (<12,000 ADT) and a need to control traffic speeds, a raised crosswalk may be the most appropriate crossing design to improve pedestrian visibility and safety. Additional References and Guidelines AASHTO. Guide for the Development of Bicycle Facilities FHWA. Manual on Uniform Traffic Control Devices Materials and Maintenance Locate markings out of wheel tread when possible to minimize wear and maintenance costs. 87

92 OCTA - Orange County Transportation Authority SIGNALIZED CROSSINGS Description Path crossings within approximately 400 feet of an existing signalized intersection with pedestrian crosswalks are typically diverted to the signalized intersection to avoid traffic operation problems when located so close to an existing signal. For this restriction to be effective, barriers and signing may be needed to direct path users to the signalized crossing. If no pedestrian crossing exists at the signal, modifications should be made. Guidance Path crossings should not be provided within approximately 400 feet of an existing signalized intersection. If possible, route path directly to the signal. Barriers and signing may be needed to direct shared use path users to the signalized crossings R9-3bP If possible, route users directly to the signal Discussion In the US, the minimum distance a marked crossing can be from an existing signalized intersection varies from approximately 250 to 660 feet. Engineering judgement and the context of the location should be taken into account when choosing the appropriate allowable setback. Pedestrians are particularly sensitive to out of direction travel and undesired mid-block crossing may become prevalent if the distance is too great. Additional References and Guidelines AASHTO. Guide for the Development of Bicycle Facilities AASHTO. Guide for the Planning, Design, and Operation of Pedestrian Facilities Materials and Maintenance If a sidewalk is used for crossing access, it should be kept clear of snow and debris and the surface should be level for wheeled users. 88

93 OC Foothills Bikeways Strategy OVERCROSSINGS Description Bicycle/pedestrian overcrossings provide critical nonmotorized system links by joining areas separated by barriers such as deep canyons, waterways or major transportation corridors. In most cases, these structures are built in response to user demand for safe crossings where they previously did not exist. There are no minimum roadway characteristics for considering grade separation. Depending on the type of facility or the desired user group grade separation may be considered in many types of projects. Overcrossings require a minimum of 17 feet of vertical clearance to the roadway below versus a minimum elevation differential of around 12 feet for an undercrossing. This results in potentially greater elevation differences and much longer ramps for bicycles and pedestrians to negotiate. Guidance 8 foot minimum width, 14 feet preferred. If overcrossing has any scenic vistas additional width should be provided to allow for stopping. A separate 5 foot pedestrian area may be provided for facilities with high bicycle and pedestrian use. 10 foot headroom on overcrossing; clearance below will vary depending on feature being crossed. Roadway: Freeway: Heavy Rail Line: 17 feet 18.5 feet 23 feet The overcrossing should have a centerline stripe even if the rest of the path does not have one. ADA generally limits ramp slopes to 1:20 Path width of 14 feet preferred for shared bicycle and pedestrian overcrossings Center line striping Railing height of 42 min. 17 min. Discussion Overcrossings for bicycles and pedestrians typically fall under the Americans with Disabilities Act (ADA), which strictly limits ramp slopes to 5% (1:20) with landings at 400 foot intervals, or 8.33% (1:12) with landings every 30 feet. Overcrossings pose potential concerns about visual impact and functional appeal, as well as space requirements necessary to meet ADA guidelines for slope. Additional References and Guidelines AASHTO. Guide for the Development of Bicycle Facilities AASHTO. Guide for the Planning, Design, and Operation of Pedestrian Facilities Materials and Maintenance Potential issues with vandalism. Overcrossings can be more difficult to clear of snow than undercrossings. 89


94 OCTA - Orange County Transportation Authority 5.5 SEPARATED BIKEWAYS Designated exclusively for bicycle travel, separated bikeways are segregated from vehicle travel lanes by striping, and can include pavement stencils and other treatments. Separated bikeways are most appropriate on arterial and collector streets where higher traffic volumes and speeds warrant greater separation. Separated bikeways can increase safety and promote proper riding by: Conventional Bicycle Lanes Defining road space for bicyclists and motorists, reducing the possibility that motorists will stray into the bicyclists path. Discouraging bicyclists from riding on the sidewalk. Reducing the incidence of wrong way riding. Reminding motorists that bicyclists have a right to the road. Buffered Bike Lanes One Way Cycle Tracks 90
95 OC Foothills Bikeways Strategy Design Needs of Bicyclists The purpose of this section is to provide the facility designer with an understanding of how bicyclists operate and how their bicycle influences that operation. Bicyclists, by nature, are much more affected by poor facility design, construction and maintenance practices than motor vehicle drivers. Bicyclists lack the protection from the elements and roadway hazards provided by an automobile s structure and safety features. By understanding the unique characteristics and needs of bicyclists, a facility designer can provide quality facilities and minimize user risk. Bicycle as a Design Vehicle Similar to motor vehicles, bicyclists and their bicycles exist in a variety of sizes and configurations. These variations occur in the types of vehicle (such as a conventional bicycle, a recumbent bicycle or a tricycle), and behavioral characteristics (such as the comfort level of the bicyclist). The design of a bikeway should consider reasonably expected bicycle types on the facility and utilize the appropriate dimensions. The figure below illustrates the operating space and physical dimensions of a typical adult bicyclist, which are the basis for typical facility design. Bicyclists require clear space to operate within a facility. This is why the minimum operating width is greater than the physical dimensions of the bicyclist. Bicyclists prefer five feet or more operating width, although four feet may be minimally acceptable. Standard Bicycle Rider Dimensions Operating Envelope 8 4 Eye Level 5 Handlebar Height 3 8 Physical Operating Width 2 6 Preferred Operating Width 5 Minimum Operating Width 4 Source: AASHTO Guide for the Development of Bicycle Facilities, 4th Edition
96 OCTA - Orange County Transportation Authority In addition to the design dimensions of a typical bicycle, there are many other commonly used pedal-driven cycles and accessories to consider when planning and designing bicycle facilities. The most common types include tandem bicycles, recumbent bicycles, and trailer accessories. The figure and table below summarize the typical dimensions for bicycle types. Bicycle as Design Vehicle - Typical Dimensions Standard Bicycle Tandem 5 10 Bicycle Type Upright Adult Bicyclist Feature Physical width Operating width (Minimum) Operating width (Preferred) Typical Dimensions 2 ft 6 in 4 ft 5 ft Bicycle Physical length Physical height of handlebars 5 ft 10 in 3 ft 8 in 8 Operating height 8 ft 4 in Recumbent Bicycle Eye height Vertical clearance to obstructions (tunnel height, lighting, etc) 5 ft 10 ft Standard Bicycle with 6 10 Recumbent Bicyclist Approximate center of gravity Physical length Eye height 2 ft 9 in - 3 ft 4 in 8 ft 3 ft 10 in Child Trailer Standard Bicycle Tandem Bicyclist Bicyclist with child trailer Physical length Physical length Physical width 8 ft 10 ft 2 ft 6 in with Child Pedal Assist Trailer 3 9 Bicycle as Design Vehicle - Design Speed Expectations Bicycle as Design Vehicle - Typical Dimensions Source: AASHTO Guide for the Development of Bicycle Facilities, 4th Edition *AASHTO does not provide typical dimensions for tricycles. Design Speed Expectations The expected speed that different types of bicyclists can maintain under various conditions also influences the design of facilities such as shared use paths. The table to the right provides typical bicyclist speeds for a variety of conditions. Bicycle Type Upright Adult Bicyclist Recumbent Bicyclist Feature Paved level surfacing Crossing Intersections Downhill Uphill Paved level surfacing Typical Speed 15 mph 10 mph 30 mph 5-12 mph 18 mph *Tandem bicycles and bicyclists with trailers have typical speeds equal to or less than upright adult bicyclists. 92

97 OC Foothills Bikeways Strategy BICYCLE LANE Description Bike lanes designate an exclusive space for bicyclists through the use of pavement markings and signage. The bike lane is located adjacent to motor vehicle travel lanes and is used in the same direction as motor vehicle traffic. Bike lanes are typically on the right side of the street, between the adjacent travel lane and curb, road edge or parking lane. Many bicyclists, particularly less experienced riders, are more comfortable riding on a busy street if it has a striped and signed bikeway than if they are expected to share a lane with vehicles. Guidance 12 foot minimum from curb face to edge of bike lane foot preferred from curb face to edge of bike lane. 7 foot maximum for marked width of bike lane. Greater widths may encourage vehicle loading in bike lane. Configure as buffered bicycle lanes when a wider facility is desired. A marked separation can reduce door zone riding. 6-8 white line 4 white line or parking Ts MUTCD R3-17 (optional) Discussion Bike lanes adjacent to on-street parallel parking require special treatment in order to avoid crashes caused by an open vehicle door. The bike lane should have sufficient width to allow bicyclists to stay out of the door zone while not encroaching into the adjacent vehicular lane. Parking stall markings, such as parking Ts and double white lines create a parking side buffer that encourages bicyclists to ride farther away from the door zone. Additional References and Guidelines AASHTO. Guide for the Development of Bicycle Facilities FHWA. Manual on Uniform Traffic Control Devices NACTO. Urban Bikeway Design Guide Materials and Maintenance Paint can wear more quickly in high traffic areas or in winter climates. Bicycle lanes should be cleared of snow through routine snow removal operations. 93

98 OCTA - Orange County Transportation Authority BICYCLE LANE AND DIAGONAL PARKING Description In certain areas with high parking demand such as urban commercial areas, diagonal parking can be used to increase parking supply. Back-in diagonal parking improves sight distances between drivers and bicyclists when compared to conventional head-in diagonal parking. Back-in parking is best paired with a dedicated bicycle lane. Conventional front-in diagonal parking is not compatible or recommended with the provision of bike lanes, as drivers backing out of conventional diagonal parking have limited visibility of approaching bicyclists. Under these conditions, shared lane markings should be used to guide bicyclists away from reversing automobiles. Guidance Front-in Diagonal Parking Shared lane markings are the preferred facility with front-in diagonal parking Back-in Diagonal Parking 5 foot minimum marked width of bike lane Parking bays are sufficiently long to accommodate most vehicles (so vehicles do not block bike lane) Front-in Diagonal Parking Center placed shared lane marking Back-in Diagonal Parking 2 buffer space Discussion Additional References and Guidelines AASHTO. Guide for the Development of Bicycle Facilities Materials and Maintenance Paint can wear more quickly in high traffic areas or in winter climates. Bicycle lanes should be cleared of snow through routine snow removal operations. 94

99 OC Foothills Bikeways Strategy BUFFERED BICYCLE LANE Description Buffered bike lanes are conventional bicycle lanes paired with a designated buffer space, separating the bicycle lane from the adjacent motor vehicle travel lane and/or parking lane. Buffered bike lanes follow general guidance for buffered preferential vehicle lanes as per MUTCD guidelines (section 3D-01). Buffered bike lanes are designed to increase the space between the bike lane and the travel lane and/or parked cars. This treatment is appropriate for bike lanes on roadways with high motor vehicle traffic volumes and speed, adjacent to parking lanes, or a high volume of truck or oversized vehicle traffic. Guidance The minimum bicycle travel area (not including buffer) is 5 feet wide. Buffers should be at least 2 feet wide. If 3 feet or wider, mark with diagonal or chevron hatching. For clarity at driveways or minor street crossings, consider a dotted line for the inside buffer boundary where cars are expected to cross. Buffered bike lanes can buffer the travel lane only, or parking lane only depending on available space and the objectives of the design. Parking side buffer designed to discourage riding in the door zone MUTCD R3-17 (optional) Colored pavement may be used at the beginning of each block to discourage motorists from entering the buffered lane Discussion Frequency of right turns by motor vehicles at major intersections should determine whether continuous or truncated buffer striping should be used approaching the intersection. Commonly configured as a buffer between the bicycle lane and motor vehicle travel lane, a parking side buffer may also be provided to help bicyclists avoid the door zone of parked cars. Additional References and Guidelines AASHTO. Guide for the Development of Bicycle Facilities FHWA. Manual on Uniform Traffic Control Devices. (3D-01) NACTO. Urban Bikeway Design Guide Materials and Maintenance Paint can wear more quickly in high traffic areas or in winter climates. Bicycle lanes should be cleared of snow through routine snow removal operations. 95
, San")
")
100 OCTA - Orange County Transportation Authority Travel Side Buffered Bike Lane on Sloat Blvd (SR-35), San Francisco (Photo: Mark Dreger) Travel Side Buffered Bike Lane on Nimitz Blvd, San Diego (Photo: BikeSD) 96

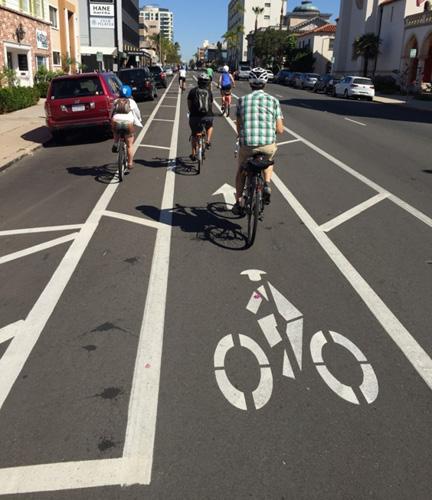
101 OC Foothills Bikeways Strategy Parking Side and Travel Side Buffered Bike Lane on Fifth Ave, San Diego (Photo: Paul Jamason) Parking Side and Travel Side Buffered Bike Lane on Fifth Ave, San Diego (Photo: Paul Jamason) 97
, Dana")

102 OCTA - Orange County Transportation Authority Travel Side Buffered Bike Lane on PCH (SR-1), Dana Point (Photo: Google Street View) Two-Way Buffered Bike Lane on Brink Ave, Modesto (Photo: Streetsblog) 98

103 OC Foothills Bikeways Strategy CLASS IV SEPARATED BIKEWAY Description Protection is provided through physical barriers and can include bollards, parking, a planter strip, an extruded curb, or on-street parking. Separated bikeways using these protection elements typically share the same elevation as adjacent travel lanes. Raised separated bikeways may be at the level of the adjacent sidewalk or set at an intermediate level between the roadway and sidewalk to separate the bikeway from the pedestrian area. Guidance Separated bikeways should ideally be placed along streets with long blocks and few driveways or midblock access points for motor vehicles. Separated bikeways located on one-way streets have fewer potential conflict areas than those on two-way streets. In situations where on-street parking is allowed, separated bikeways shall be located between the parking lane and the sidewalk (in contrast to bike lanes). Openings in the barrier or curb are needed at intersections and driveways or other access points to allow vehicle crossing. Parking should be set back 30 feet from minor intersections or driveways to provide improved visibility for bicyclists. Separated bikeway can be raised or at street level Discussion Sidewalks or other pedestrian facilities should not be narrowed to accommodate the cycle track as pedestrians will likely walk on the bikeway if sidewalk capacity is reduced. Visual and physical cues (e.g., pavement markings & signage) should be used to make it clear where bicyclists and pedestrians should be traveling. If possible, separate the bikeway and pedestrian zone with a furnishing zone. Additional References and Guidelines NACTO. Urban Bikeway Design Guide FHWA. Separated Bike Lane Planning and Design Guide Caltrans. Design Information Bulletin #89 - Class IV Bikeway Guidance Materials and Maintenance Barrier-separated and raised separated bikeways may require special equipment for sweeping and cleaning. 99
 along Harbor Drive, San")
 Westwood Blvd, Redondo Beach (Photo:")
104 OCTA - Orange County Transportation Authority Two-Way Cycle Track (Separated Bikeway) along Harbor Drive, San Diego (Photo: Stephan Vance) Two-Way Cycle Track (Separated Bikeway) Westwood Blvd, Redondo Beach (Photo: Jim Lyle) 100


 and")


105 OC Foothills Bikeways Strategy 5.6 SEPARATED BIKEWAYS AT INTERSECTIONS Intersections are junctions at which different modes of transportation meet and facilities overlap. An intersection facilitates the interchange between bicyclists, motorists, pedestrians and other modes in order to advance traffic flow in a safe and efficient manner. Designs for intersections with bicycle facilities should reduce conflict between bicyclists (and other vulnerable road users) and vehicles by heightening the level of visibility, denoting clear right-of-way and facilitating eye contact and awareness with other modes. Intersection treatments can improve both queuing and merging maneuvers for bicyclists, and are often coordinated with timed or specialized signals. The configuration of a safe intersection for bicyclists may include elements such as color, signage, medians, signal detection and pavement markings. Intersection design should take into consideration existing and anticipated bicyclist, pedestrian and motorist movements. In all cases, the degree of mixing or separation between bicyclists and other modes is intended to reduce the risk of crashes and increase bicyclist comfort. The level of treatment required for bicyclists at an intersection will depend on the bicycle facility type used, whether bicycle facilities are intersecting, and the adjacent street function and land use. Colored Bike Lanes in Conflict Areas Bike Lanes at Right Turn Only Lanes Shared Bicycle/Right Turn Lane Intersection Crossing Markings Bike Boxes Two Stage Turn Boxes 101

106 OCTA - Orange County Transportation Authority BIKE BOX Description A bike box is a designated area located at the head of a traffic lane at a signalized intersection that provides bicyclists with a safe and visible space to get in front of queuing motorized traffic during the red signal phase. Motor vehicles must queue behind the white stop line at the rear of the bike box. Guidance 14 minimum depth A No Turn on Red (MUTCD R10-11) sign shall be installed overhead to prevent vehicles from entering the Bike Box. A Stop Here on Red sign should be post-mounted at the stop line to reinforce observance of the stop line. A Yield to Bikes sign should be post-mounted in advance of and in conjunction with an egress lane to reinforce that bicyclists have the right-of-way going through the intersection. An ingress lane should be used to provide access to the box. A supplemental Wait Here legend can be provided in advance of the stop bar to increase clarity to motorists. May be combined with intersection crossing markings and colored bike lanes in conflict areas Colored pavement can be used in the box for increased visibility R10-11 R10-15 variant Wide stop lines used for increased visibility R10-6a If used, colored pavement should extend 50 from the intersection Discussion Bike boxes are considered experimental by the FHWA. Bike boxes should be placed only at signalized intersections, and right turns on red shall be prohibited for motor vehicles. Bike boxes should be used in locations that have a large volume of bicyclists and are best utilized in central areas where traffic is usually moving more slowly. Prohibiting right turns on red improves safety for bicyclists yet does not significantly impede motor vehicle travel. Additional References and Guidelines NACTO. Urban Bikeway Design Guide FHWA. Interim Approval (IA-14) has been granted. Requests to use green colored pavement need to comply with the provisions of Paragraphs 14 through 22 of Section 1A Materials and Maintenance Because the effectiveness of markings depends entirely on their visibility, maintaining markings should be a high priority. 102

107 OC Foothills Bikeways Strategy COLORED BIKE LANE IN CONFLICT AREAS Description Colored pavement within a bicycle lane increases the visibility of the facility and reinforces priority of bicyclists in conflict areas. Guidance Green colored pavement was given interim approval by the Federal Highways Administration in March See interim approval for specific colored pavement standards. R4-4 The colored surface should be skid resistant and retro-reflective. A Yield to Bikes sign should be used at intersections or driveway crossings to reinforce that bicyclists have the right-of-way in colored bike lane areas. Normal white dotted edge lines should define colored space Discussion Evaluations performed in Portland, OR, St. Petersburg, FL and Austin, TX found that significantly more motorists yielded to bicyclists and slowed or stopped before entering the conflict area after the application of the colored pavement when compared with an uncolored treatment. Additional References and Guidelines FHWA. Interim Approval (IA-14) has been granted. Requests to use green colored pavement need to comply with the provisions of Paragraphs 14 through 22 of Section 1A NACTO. Urban Bikeway Design Guide Materials and Maintenance Because the effectiveness of markings depends entirely on their visibility, maintaining markings should be a high priority. 103
")
108 OCTA - Orange County Transportation Authority Colored Bicycle Lane in Conflict Area on 3rd St at Lime Ave, Long Beach (Photo: Streetsblog) 104

109 OC Foothills Bikeways Strategy BIKE LANE AT RIGHT TURN ONLY LANE Description The appropriate treatment at right-turn lanes is to place the bike lane between the right-turn lane and the rightmost through lane or, where right-of-way is insufficient, to use a shared bike lane/turn lane. The design (right) illustrates a bike lane pocket, with signage indicating that motorists should yield to bicyclists through the conflict area. Guidance At auxiliary right turn only lanes (add lane): Continue existing bike lane width; standard width of 5 to 6 feet or 4 feet in constrained locations. Use signage to indicate that motorists should yield to bicyclists through the conflict area. Consider using colored conflict areas to promote visibility of the mixing zone. Colored pavement may be used in the weaving area to increase visibility and awareness of potential conflict Where a through lane becomes a right turn only lane: Do not define a dotted line merging path for bicyclists. MUTCD R4-4 (optional) Drop the bicycle lane in advance of the merge area. Use shared lane markings to indicate shared use of the lane in the merging zone. Optional dotted lines Discussion For other potential approaches to providing accommodations for bicyclists at intersections with turn lanes, please see guidance on shared bike lane/turn lane, bicycle signals, and colored bike facilities. Additional References and Guidelines AASHTO. Guide for the Development of Bicycle Facilities FHWA. Manual on Uniform Traffic Control Devices NACTO. Urban Bikeway Design Guide Materials and Maintenance Because the effectiveness of markings depends entirely on their visibility, maintaining markings should be a high priority. 105

110 OCTA - Orange County Transportation Authority COMBINED BIKE LANE/TURN LANE Description The combined bike lane/turn lane places a standard-width bike lane on the left side of a dedicated right turn lane. A dotted line delineates the space for bicyclists and motorists within the shared lane. This treatment includes signage advising motorists and bicyclists of proper positioning within the lane. This treatment is recommended at intersections lacking sufficient space to accommodate both a standard through bike lane and right turn lane. Guidance Maximum shared turn lane width is 13 feet; narrower is preferable. Bike Lane pocket should have a minimum width of 4 feet with 5 feet preferred. A dotted 4 inch line and bicycle lane marking should be used to clarify bicyclist positioning within the combined lane, without excluding cars from the suggested bicycle area. A Right Turn Only sign with an Except Bicycles plaque may be needed to make it legal for through bicyclists to use a right turn lane. Short length turn pockets encourage slower motor vehicle speeds R4-4 Discussion Case studies cited by the Pedestrian and Bicycle Information Center indicate that this treatment works best on streets with lower posted speeds (30 MPH or less) and with lower traffic volumes (10,000 ADT or less). May not be appropriate for high-speed arterials or intersections with long right turn lanes. May not be appropriate for intersections with large percentages of right-turning heavy vehicles. Additional References and Guidelines NACTO. Urban Bikeway Design Guide Materials and Maintenance Locate markings out of tire tread to minimize wear. Because the effectiveness of markings depends on their visibility, maintaining markings should be a high priority. 106


111 OC Foothills Bikeways Strategy TWO-STAGE TURN BOX Description Two-stage turn queue boxes offer bicyclists a safe way to make left turns at multi-lane signalized intersections from a right side cycle track or bike lane. On right side cycle tracks, bicyclists are often unable to merge into traffic to turn left due to physical separation, making the provision of two-stage left turn boxes critical. Design guidance for two-stage turns apply to both bike lanes and cycle tracks. Guidance The queue box shall be placed in a protected area. Typically this is within an on-street parking lane or cycle track buffer area. Turns from a bicycle lane may be protected by an adjacent parking lane or crosswalk setback space Consider using colored pavement inside the box to further define the bicycle space 6 minimum depth of bicycle storage area Bicycle stencil and turn arrow pavement markings shall be used to indicate proper bicycle direction and positioning. A No Turn on Red (MUTCD R10-11) sign shall be installed on the cross street to prevent vehicles from entering the turn box. Turns from cycle tracks may be protected by a parking lane or other physical buffer Cycle track turn box protected by physical buffer: Bike lane turn box protected by parking lane: Discussion Two-Stage Turn boxes are considered experimental by FHWA. While two stage turns may increase bicyclist comfort in many locations, this configuration will typically result in higher average signal delay for bicyclists due to the need to receive two separate green signal indications (one for the through street, followed by one for the cross street) before proceeding. Additional References and Guidelines NACTO. Urban Bikeway Design Guide Materials and Maintenance Paint can wear more quickly in high traffic areas or in winter climates. 107


112 OCTA - Orange County Transportation Authority INTERSECTION CROSSING MARKINGS Description Bicycle pavement markings through intersections indicate the intended path of bicyclists through an intersection or across a driveway or ramp. They guide bicyclists on a safe and direct path through the intersection and provide a clear boundary between the paths of through bicyclists and either through or crossing motor vehicles in the adjacent lane. Guidance See MUTCD Section 3B.08: dotted line extensions Crossing striping shall be at least six inches wide when adjacent to motor vehicle travel lanes. Dotted lines should be two-foot lines spaced two to six feet apart. Chevrons, shared lane markings, or colored bike lanes in conflict areas may be used to increase visibility within conflict areas or across entire intersections. Elephant s Feet markings are common in Europe and Canada. Chevrons Shared Lane Markings Colored Conflict Area Elephant s Feet 2 stripe 2-6 gap Discussion Additional markings such as chevrons, shared lane markings, or colored bike lanes in conflict areas are strategies currently in use in the United States and Canada. Cities considering the implementation of markings through intersections should standardize future designs to avoid confusion. Additional References and Guidelines AASHTO. Guide for the Development of Bicycle Facilities FHWA. Manual on Uniform Traffic Control Devices. (3A.06) NACTO. Urban Bikeway Design Guide Materials and Maintenance Because the effectiveness of marked crossings depends entirely on their visibility, maintaining marked crossings should be a high priority. 108

113 OC Foothills Bikeways Strategy BICYCLES AT SINGLE LANE ROUNDABOUTS Description In single lane roundabouts it is important to indicate to motorists, bicyclists and pedestrians the right-of-way rules and correct way for them to circulate, using appropriately designed signage, pavement markings, and geometric design elements. Guidelines 25 mph maximum circulating design speed. Design approaches/exits to the lowest speeds possible. Encourage bicyclists navigating the roundabout like motor vehicles to take the lane. Maximize yielding rate of motorists to pedestrians and bicyclists at crosswalks. Provide separated facilities for bicyclists who prefer not to navigate the roundabout on the roadway. Crossings set back at least one car length from the entrance of the roundabout Truck apron can provide adequate clearance for longer vehicles Narrow circulating lane to discourage attempted passing by motorists Sidewalk should be wider to accommodate bicycle and pedestrian traffic W11-15 Visible, well marked crossings alert motorists to the presence of bicyclists and pedestrians (W11-15 signage) Bicycle ramps leading to a wide shared facility with pedestrians Bicycle exit ramp in line with bicycle lane Discussion Research indicates that while single-lane roundabouts may benefit bicyclists and pedestrians by slowing traffic, multi-lane roundabouts may present greater challenges and significantly increase safety problems for these users. Additional References and Guidelines AASHTO. Guide for the Development of Bicycle Facilities FHWA. Roundabouts: An Informational Guide TRB. Roundabouts: An Informational Guide, Second Edition. NCHRP Materials and Maintenance Signage and striping require routine maintenance. 109


114 OCTA - Orange County Transportation Authority BIKE LANES AT DIVERGING RAMPS Description Some arterials may contain high speed freeway-style designs such as merge lanes and exit ramps, which can create difficulties for bicyclists. The entrance and exit lanes typically have intrinsic visibility problems because of low approach angles and feature high speed differentials between bicyclists and motor vehicles. Strategies to improve safety focus on increasing sight distances, creating formal crossings, and minimizing crossing distances. Guidance Entrance Ramps: Angle the bike lane to increase the approach angle with entering traffic. Position crossing before drivers attention is focused on the upcoming merge. Exit Ramps: Use a jug handle turn to bring bicyclists to increase the approach angle with exiting traffic, and add yield striping and signage to the bicycle approach. R1-2 Crossing located before drivers attention is focused on the upcoming merge Dashed lane lines for confident bicyclist to continue through Main St 0.1 MI. 1 MIN. Industrial Dist 2.0 MI. 15 MIN. Waterfront 3.0 MI. 20 MIN. Wayfinding signage should clarify path to destinations Ramp geometrics minimize speed for exiting vehicles Crossing located in location with lowest speed and highest visibility W11-1 R1-2 W11-15 Discussion While the jug-handle approach is the preferred configuration at exit ramps, provide the option for through bicyclists to perform a vehicular merge and proceed straight through under safe conditions. Additional References and Guidelines AASHTO. Guide for the Development of Bicycle Facilities FHWA. Manual on Uniform Traffic Control Devices FHWA. Bicycle and Pedestrian Transportation. Lesson 15: Bicycle Lanes Materials and Maintenance Locate crossing markings out of wheel tread when possible to minimize wear and maintenance costs. 110


115 OC Foothills Bikeways Strategy 5.7 SIGNALIZATION Bicycle signals and beacons facilitate bicyclist crossings of roadways. Bicycle signals make crossing intersections safer for bicyclists by clarifying when to enter an intersection and by restricting conflicting vehicle movements. Bicycle signals are traditional three lens signal heads with green, yellow and red bicycle stenciled lenses that can be employed at standard signalized intersections. Flashing amber warning beacons can be utilized at unsignalized intersection crossings. Push buttons, signage, and pavement markings may be used to supplement these facilities for both bicyclists and motorists. Determining which type of signal or beacon to use for a particular intersection depends on a variety of factors. These include speed limits, Average Daily Traffic (ADT), anticipated bicycle crossing traffic, and the configuration of planned or existing bicycle facilities. Signals may be necessary as part of the construction of a protected bicycle facility such as a cycle track with potential turning conflicts, or to decrease vehicle or pedestrian conflicts at major crossings. An intersection with bicycle signals may reduce stress and delays for a crossing bicyclist, and discourage illegal and unsafe crossing maneuvers. Bicycle Detection and Actuation Active Warning Beacons Hybrid Beacons (HAWK) Bicycle Signal Heads 111


116 OCTA - Orange County Transportation Authority BICYCLE DETECTION AND ACTUATION Description Push Button Actuation User-activated button mounted on a pole facing the street. Video detection camera Loop Detectors Bicycle-activated loop detectors are installed within the roadway to allow the presence of a bicycle to trigger a change in the traffic signal. This allows the bicyclist to stay within the lane of travel without having to maneuver to the side of the road to trigger a push button. Loops that are sensitive enough to detect bicycles should be supplemented with pavement markings to instruct bicyclists how to trip them. Video Detection Cameras Video detection systems use digital image processing to detect a change in the image at a location. These systems can be calibrated to detect bicycles. Video camera system costs range from $20,000 to $25,000 per intersection. Remote Traffic Microwave Sensor Detection (RTMS) RTMS is a system which uses frequency modulated continuous wave radio signals to detect objects in the roadway. This method marks the detected object with a time code to determine its distance from the sensor. The RTMS system is unaffected by temperature and lighting, which can affect standard video detection. Bicycle detector pavement marking (MUTCD Figure 9C-7) Push button actuation RTMS In bike lane loop detection Discussion Proper bicycle detection should meet two primary criteria: 1) accurately detects bicyclists and 2) provides clear guidance to bicyclists on how to actuate detection (e.g., what button to push, where to stand). Bicycle loops and other detection mechanisms can also provide bicyclists with an extended green time before the light turns yellow so that bicyclists of all abilities can reach the far side of the intersection. Additional References and Guidelines AASHTO. Guide for the Development of Bicycle Facilities FHWA. Manual on Uniform Traffic Control Devices NACTO. Urban Bikeway Design Guide Materials and Maintenance Signal detection and actuation for bicyclists should be maintained with other traffic signal detection and roadway pavement markings. 112


117 OC Foothills Bikeways Strategy Bicycle Detector Pavement Marking, San Luis Obispo (Photo: NACTO) Bicycle Detection Instruction Sign, San Luis Obispo (Photo: NACTO) 113
, consists of a signal-head with two red lenses over a single yellow lens on the major")
118 OCTA - Orange County Transportation Authority HYBRID BEACON Description A hybrid beacon, formerly known as a High-intensity Activated CrosswalK (HAWK), consists of a signal-head with two red lenses over a single yellow lens on the major street, and pedestrian and/or bicycle signal heads for the minor street. There are no signal indications for motor vehicles on the minor street approaches. Hybrid beacons are used to improve non-motorized crossings of major streets in locations where side-street volumes do not support installation of a conventional traffic signal or where there are concerns that a conventional signal will encourage additional motor vehicle traffic on the minor street. Hybrid beacons may also be used at mid-block crossing locations. Guidance Hybrid beacons may be installed without meeting traffic control signal warrants if roadway speed and volumes are excessive for comfortable user crossing. If installed within a signal system, signal engineers should evaluate the need for the hybrid signal to be coordinated with other signals. Parking and other sight obstructions should be prohibited for at least 100 feet in advance of and at least 20 feet beyond the marked crosswalk to provide adequate sight distance. W11-15 Push button actuation for bicyclists. Bike Route Discussion The hybrid beacon can significantly improve the operation of a bicycle route, particularly along neighborhood greenway corridors. Because of the low traffic volumes on these facilities, intersections with major roadways are often unsignalized, creating difficult and potentially unsafe crossing conditions for bicyclists. Each crossing, regardless of traffic speed or volume, requires additional review by a registered engineer to identify sight lines, potential impacts on traffic progression, timing with adjacent signals, capacity and safety. Additional References and Guidelines FHWA. Pedestrian Hybrid Beacon Guide - Recommendations and Case Study NACTO. Urban Bikeway Design Guide FHWA. Manual on Uniform Traffic Control Devices Materials and Maintenance Hybrid beacons are subject to the same maintenance needs and requirements as standard traffic signals. Signing and striping need to be maintained to help users understand any unfamiliar traffic control. 114


119 OC Foothills Bikeways Strategy 5.8 SHARED ROADWAYS On shared roadways, bicyclists and motor vehicles use the same roadway space. These facilities are typically used on roads with low speeds and traffic volumes, however they can be used on higher volume roads with wide outside lanes or shoulders. A motor vehicle driver will usually have to cross over into the adjacent travel lane to pass a bicyclist, unless a wide outside lane or shoulder is provided. Signed Shared Roadway Shared roadways employ a large variety of treatments from simple signage and shared lane markings to more complex treatments including directional signage, traffic diverters, chicanes, chokers, and/or other traffic calming devices to reduce vehicle speeds or volumes. Neighborhood Greenways Neighborhood greenways are a special class of shared roadways designed for a broad spectrum of bicyclists. They are low-volume local streets where motorists and bicyclists share the same travel lane. Treatments for neighborhood greenways are selected as necessary to create appropriate automobile volumes and speeds, and to provide safe crossing opportunities of busy streets. Marked Shared Roadway Shared Roadways with Diagonal Parking Neighborhood Greenways 115

120 OCTA - Orange County Transportation Authority SIGNED SHARED ROADWAY Description Signed shared roadways are facilities shared with motor vehicles. They are typically used on roads with low speeds and traffic volumes, however can be used on higher volume roads with wide outside lanes or shoulders. A motor vehicle driver will usually have to cross over into the adjacent travel lane to pass a bicyclist, unless a wide outside lane or shoulder is provided. Guidance Lane width varies depending on roadway configuration. Bike route signage (D11-1) should be applied at intervals frequent enough to keep bicyclists informed of changes in route direction and to remind motorists of the presence of bicyclists. Commonly, this includes placement at: Beginning or end of Bicycle Route. At major changes in direction or at intersections with other bicycle routes. At intervals along bicycle routes not to exceed ½ mile. MUTCD D11-1 Discussion Signed Shared Roadways serve either to provide continuity with other bicycle facilities (usually bike lanes) or to designate preferred routes through high-demand corridors. This configuration differs from a neighborhood greenway due to a lack of traffic calming, wayfinding, pavement markings and other enhancements designed to provide a higher level of comfort for a broad spectrum of users. Additional References and Guidelines AASHTO. Guide for the Development of Bicycle Facilities FHWA. Manual on Uniform Traffic Control Devices Materials and Maintenance Maintenance needs for bicycle wayfinding signs are similar to other signs, and will need periodic replacement due to wear. 116
 used to encourage bicycle travel and proper positioning within the")

121 OC Foothills Bikeways Strategy MARKED SHARED ROADWAY Description A marked shared roadway is a general purpose travel lane marked with shared lane markings (SLM) used to encourage bicycle travel and proper positioning within the lane. In constrained conditions, the SLMs are placed in the middle of the lane. On a wide outside lane, the SLMs can be used to promote bicycle travel to the right of motor vehicles. In all conditions, SLMs should be placed outside of the door zone of parked cars. Guidance May be used on streets with a speed limit of 35 mph or under. Lower than 30 mph speed limit preferred. In constrained conditions, preferred placement is in the center of the travel lane to minimize wear and promote single file travel. Minimum placement of SLM marking centerline is 11 feet from edge of curb where on-street parking is present, 4 feet from edge of curb with no parking. If parking lane is wider than 7.5 feet, the SLM should be moved further out accordingly. Consider modifications to signal timing to induce a bicycle-friendly travel speed for all users When placed adjacent to parking, SLMs should be outside of the Door Zone. Minimum placement is 11 from curb MUTCD R4-11 (optional) MUTCD D11-1 (optional) Placement in center of travel lane is preferred in constrained conditions Discussion If collector or arterial, this should not be a substitute for dedicated bicycle facilities if space is available. Bike Lanes should be considered on roadways with outside travel lanes wider than 15 feet, or where other lane narrowing or removal strategies may provide adequate road space. SLMs shall not be used on shoulders, in designated bike lanes, or to designate bicycle detection at signalized intersections. (MUTCD 9C.07) Additional References and Guidelines AASHTO. Guide for the Development of Bicycle Facilities FHWA. Manual on Uniform Traffic Control Devices NACTO. Urban Bikeway Design Guide Materials and Maintenance Placing SLMs between vehicle tire tracks will increase the life of the markings and minimize the long-term cost of the treatment. 117


122 OCTA - Orange County Transportation Authority 5.9 BIKEWAY SIGNING The ability to navigate through a city is informed by landmarks, natural features and other visual cues. Signs throughout the city should indicate to bicyclists: Direction of travel Location of destinations Travel time/distance to those destinations Wayfinding Sign Types These signs will increase users comfort and accessibility to the bicycle systems. Signage can serve both wayfinding and safety purposes including: Helping to familiarize users with the bicycle network Helping users identify the best routes to destinations Helping to address misperceptions about time and distance Wayfinding Sign Placement Helping overcome a barrier to entry for people who are not frequent bicyclists (e.g., interested but concerned bicyclists) A community-wide bicycle wayfinding signage plan would identify: Sign locations Sign type what information should be included and design features Destinations to be highlighted on each sign key destinations for bicyclists Approximate distance and travel time to each destination Bicycle wayfinding signs also visually cue motorists that they are driving along a bicycle route and should use caution. Signs are typically placed at key locations leading to and along bicycle routes, including the intersection of multiple routes. Too many road signs tend to clutter the right-of-way, and it is recommended that these signs be posted at a level most visible to bicyclists rather than per vehicle signage standards. 118
123 OC Foothills Bikeways Strategy WAYFINDING SIGN TYPES Description A bicycle wayfinding system consists of comprehensive signing and/or pavement markings to guide bicyclists to their destinations along preferred bicycle routes. There are three general types of wayfinding signs: Confirmation Signs Indicate to bicyclists that they are on a designated bikeway. Make motorists aware of the bicycle route. Can include destinations and distance/time. Do not include arrows. Turn Signs Indicate where a bikeway turns from one street onto another street. Can be used with pavement markings. BIKE ROUTE Foothills Park Include destinations and arrows. Decisions Signs Mark the junction of two or more bikeways. Inform bicyclists of the designated bike route to access key destinations. Includes destinations and arrows and distances. Travel times are optional but recommended. BIKE ROUTE Jordan River Trail 0.3 miles 2 min Riverton City Park 0.7 miles 5 min Discussion There is no standard color for bicycle wayfinding signage. Section 1A.12 of the MUTCD establishes the general meaning for signage colors. Green is the color used for directional guidance and is the most common color of bicycle wayfinding signage in the US, including those in the MUTCD. Additional References and Guidelines AASHTO. Guide for the Development of Bicycle Facilities FHWA. Manual on Uniform Traffic Control Devices NACTO. Urban Bikeway Design Guide Materials and Maintenance Maintenance needs for bicycle wayfinding signs are similar to other signs and will need periodic replacement due to wear. 119
124 OCTA - Orange County Transportation Authority WAYFINDING SIGN PLACEMENT Confirmation Signs Every ¼ to ½ mile on off-street facilities and every 2 to 3 blocks along on-street bicycle facilities, unless another type of sign is used (e.g., within 150 ft of a turn or decision sign). Should be placed soon after turns to confirm destination(s). Pavement markings can also act as confirmation that a bicyclist is on a preferred route. Turn Signs Near-side of intersections where bike routes turn (e.g., where the street ceases to be a bicycle route or does not go through). Pavement markings can also indicate the need to turn to the bicyclist. Guidance Signs are typically placed at decision points along bicycle routes typically at the intersection of two or more bikeways and at other key locations leading to and along bicycle routes. Decisions Signs Near-side of intersections in advance of a junction with another bicycle route. Along a route to indicate a nearby destination. C Elementary C School D Decision Sign C Confirmation Sign Bike Route Library D C Bike Route T C D T T D BIKE ROUTE Elementary School 0.3 miles 2 min Library 0.7 miles 5 min City Park 1.5 miles 12 min T BIKE ROUTE Turn Sign Library Discussion It can be useful to classify a list of destinations for inclusion on the signs based on their relative importance to users throughout the area. A particular destination s ranking in the hierarchy can be used to determine the physical distance from which the locations are signed. For example, primary destinations (such as the downtown area) may be included on signage up to 5 miles away. Secondary destinations (such as a transit station) may be included on signage up to two miles away. Tertiary destinations (such as a park) may be included on signage up to one mile away. Additional References and Guidelines AASHTO. Guide for the Development of Bicycle Facilities FHWA. Manual on Uniform Traffic Control Devices NACTO. Urban Bikeway Design Guide Materials and Maintenance Maintenance needs for bicycle wayfinding signs are similar to other signs and will need periodic replacement due to wear. 120


125 OC Foothills Bikeways Strategy 5.10 RETROFITTING EXISTING STREETS TO ADD BIKEWAYS Most major streets are characterized by conditions (e.g., high vehicle speeds and/or volumes) for which dedicated bike lanes are the most appropriate facility to accommodate safe and comfortable riding. Although opportunities to add bike lanes through roadway widening may exist in some locations, many major streets have physical and other constraints that would require street retrofit measures within existing curb-tocurb widths. As a result, much of the guidance provided in this section focuses on effectively reallocating existing street width through striping modifications to accommodate dedicated bike lanes. Although largely intended for major streets, these measures may be appropriate for any roadway where bike lanes would be the best accommodation for bicyclists. Lane Narrowing Lane Reconfiguration 121


126 OCTA - Orange County Transportation Authority LANE NARROWING Description Lane narrowing utilizes roadway space that exceeds minimum standards to provide the needed space for bike lanes. Many roadways have existing travel lanes that are wider than those prescribed in local and national roadway design standards, or which are not marked. Most standards allow for the use of 11 foot and sometimes 10 foot wide travel lanes to create space for bike lanes. Guidance Vehicle lane width: Before: feet After: feet Bicycle lane width: Guidance on bicycle lanes applies to this treatment. Before 24 Travel/Parking After 8 Parking 6 Bike 10 Travel Discussion Special consideration should be given to the amount of heavy vehicle traffic and horizontal curvature before the decision is made to narrow travel lanes. Center turn lanes can also be narrowed in some situations to free up pavement space for bike lanes. AASHTO supports reduced width lanes in A Policy on Geometric Design of Highways and Streets: On interrupted-flow operation conditions at low speeds (45 mph or less), narrow lane widths are normally adequate and have some advantages. Additional References and Guidelines AASHTO. Guide for the Development of Bicycle Facilities AASHTO. A Policy on Geometric Design of Highways and Streets NACTO. Urban Street Design Guide Materials and Maintenance Repair rough or uneven pavement surface. Use bicycle compatible drainage grates. Raise or lower existing grates and utility covers so they are flush with the pavement. 122

127 OC Foothills Bikeways Strategy LANE RECONFIGURATION Description The removal of a single travel lane will generally provide sufficient space for bike lanes on both sides of a street. Streets with excess vehicle capacity provide opportunities for bike lane retrofit projects. Guidance Vehicle lane width: Width depends on project. No narrowing may be needed if a lane is removed. Bicycle lane width: Guidance on bicycle lanes applies to this treatment. Before Travel 11 Travel 6 Bike Travel After Turn Discussion Depending on a street s existing configuration, traffic operations, user needs and safety concerns, various lane reduction configurations may apply. For instance, a four-lane street (with two travel lanes in each direction) could be modified to provide one travel lane in each direction, a center turn lane, and bike lanes. Prior to implementing this measure, a traffic analysis should identify potential impacts. Additional References and Guidelines AASHTO. Guide for the Development of Bicycle Facilities FHWA. Evaluation of Lane Reduction Road Diet Measures on Crashes. Publication Number: FHWA-HRT NACTO. Urban Street Design Guide Materials and Maintenance Repair rough or uneven pavement surface. Use bicycle compatible drainage grates. Raise or lower existing grates and utility covers so they are flush with the pavement. 123


128 OCTA - Orange County Transportation Authority 5.11 BICYCLE SUPPORT FACILITIES Bicycle Parking Bicyclists expect a safe, convenient place to secure their bicycle when they reach their destination. This may be short-term parking of 2 hours or less, or longterm parking for employees, students, residents, and commuters. Access to Transit Safe and easy access to bicycle parking facilities is necessary to encourage commuters to access transit via bicycle. Providing bicycle access to transit and space for bicycles on buses and rail vehicles can increase the feasibility of transit in lower-density areas, where transit stops are beyond walking distance of many residences. People are often willing to walk only a quarter- to halfmile to a bus stop, while they might bike as much as two or more miles to reach a transit station. Bicycle Parking Bicycle Access to Transit Roadway Construction and Repair Safety of all roadway users should be considered during road construction and repair. Wherever bicycles are allowed, measures should be taken to provide for the continuity of a bicyclist s trip through a work zone area. Only in rare cases should pedestrians and bicyclists be detoured to another street when travel vehicle lanes remain open. Contractors performing work should be made aware of the needs of bicyclists and be properly trained in how to safely route bicyclists through or around work zones. Access through Construction Areas 124

129 OC Foothills Bikeways Strategy BICYCLE RACKS Description Short-term bicycle parking is meant to accommodate visitors, customers, and others expected to depart within two hours. It should have an approved standard rack, appropriate location and placement, and weather protection. The Association for Pedestrian and Bicycle Professionals (APBP) recommends selecting a bicycle rack that: Supports the bicycle in at least two places, preventing it from falling over. Allows locking of the frame and one or both wheels with a U-lock. Guidance 2 minimum from the curb face to avoid dooring. Close to destinations; 50 maximum distance from main building entrance. Minimum clear distance of 6 should be provided between the bicycle rack and the property line. Should be highly visible from adjacent bicycle routes and pedestrian traffic. Locate racks in areas that cyclists are most likely to travel. Is securely anchored to ground. Resists cutting, rusting and bending or deformation. Bicycle shelters consist of bicycle racks grouped together within structures with a roof that provides weather protection. A loop may be attached to retired parking meter posts to formalize the meter as bicycle parking. 4 min 3 min D4-3 2 min Avoid fire zones, loading zones, bus zones, etc. Discussion Where the placement of racks on sidewalks is not possible (due to narrow sidewalk width, sidewalk obstructions, street trees, etc.), bicycle parking can be provided in the street where on-street vehicle parking is allowed in the form of onstreet bicycle corrals. Some types of bicycle racks may meet design criteria, but are discouraged except in limited situations. This includes undulating wave racks, schoolyard wheel bender racks, and spiral racks. Additional References and Guidelines AASHTO. Guide for the Development of Bicycle Facilities APBP. Bicycle Parking Guide 2nd Edition Materials and Maintenance Use of proper anchors will prevent vandalism and theft. Racks and anchors should be regularly inspected for damage. Educate snow removal crews to avoid burying racks during winter months. 125
 consist of bicycle racks grouped together in a common area within the street traditionally used for")

130 OCTA - Orange County Transportation Authority ON-STREET BICYCLE CORRAL Description Bicycle corrals (also known as on-street bicycle parking) consist of bicycle racks grouped together in a common area within the street traditionally used for automobile parking. Bicycle corrals are reserved exclusively for bicycle parking and provide a relatively inexpensive solution to providing high-volume bicycle parking. Bicycle corrals can be implemented by converting one or two on-street motor vehicle parking spaces into on-street bicycle parking. Each motor vehicle parking space can be replaced with approximately 6-10 bicycle parking spaces. Guidance See guidelines for sidewalk bicycle rack placement and clear zones. Bicyclists should have an entrance width from the roadway of 5 6. Can be used with parallel or angled parking. Parking stalls adjacent to curb extensions are good candidates for bicycle corrals since the concrete extension serves as delimitation on one side. Bicycle corrals move bicycles off the sidewalks, leaving more space for pedestrians, sidewalk café tables, etc. Because bicycle parking does not block sightlines (as large motor vehicles would do), it may be possible to locate bicycle parking in no-parking zones near intersections and crosswalks. Improved corner visibility Remove existing sidewalk bicycle racks to maximize pedestrian space D4-3 Bicycle pavement marking indicates maneuvering zone Physical barrier to avoid accidental damage to bicycles or racks Discussion In many communities, the installation of bicycle corrals is driven by requests from adjacent businesses, and is not a city-driven initiative. In such cases, the city does not remove motor vehicle parking unless it is explicitly requested. In other areas, the city provides the facility and business associations take responsibility for the maintenance of the facility. Communities can establish maintenance agreements with the requesting business. Bicycle corrals can be especially effective in areas with high bicycle parking demand or along street frontages with narrow sidewalks where parked bicycles would be detrimental to the pedestrian environment. Additional References and Guidelines APBP. Bicycle Parking Guide 2nd Edition Materials and Maintenance Physical barriers may obstruct drainage and collect debris. Establish a maintenance agreement with neighboring businesses. In snowy climates the bicycle corral may need to be removed during the winter months. 126

131 OC Foothills Bikeways Strategy BICYCLE LOCKERS Description Bicycle lockers are intended to provide long-term bicycle storage for employees, students, residents, commuters, and others expected to park more than two hours. Long-term facilities protect the entire bicycle, its components and accessories against theft and against inclement weather, including snow and wind-driven rain. Bicycle lockers provide space to store a few accessories or rain gear in addition to containing the bicycle. Some lockers allow access to two users - a partition separating the two bicycles can help users feel their bike is secure. Lockers can also be stacked, reducing the footprint of the area, although that makes them more difficult to use. Guidance Minimum dimensions: width (opening) 2.5 ; height 4 ; depth 6. 4 foot side clearance and 6 foot end clearance. 7 foot minimum distance between facing lockers. Locker designs that allow visibility and inspection of contents are recommended for increased security. Access is controlled by a key or access code. 4 side clearance 6 end clearance 7 between facing lockers Discussion Long-term parking facilities are more expensive to provide than short-term facilities, but are also significantly more secure. Although many bicycle commuters would be willing to pay a nominal fee to guarantee the safety of their bicycle, long-term bicycle parking should be free wherever automobile parking is free. Potential locations for long-term bicycle parking include transit stations, large employers, and institutions where people use their bikes for commuting and not consistently throughout the day. Additional References and Guidelines AASHTO. Guide for the Development of Bicycle Facilities APBP. Bicycle Parking Guide 2nd Edition Materials and Maintenance Regularly inspect the functioning of moving parts and enclosures. Change keys and access codes periodically to prevent access to unapproved users. 127
 Description A Secure Parking Area for bicycles, also known as a BikeSPA or Bike & Ride (when located at transit stations), is a semi-enclosed space that offers a higher")
132 OCTA - Orange County Transportation Authority SECURE PARKING AREAS (SPA) Description A Secure Parking Area for bicycles, also known as a BikeSPA or Bike & Ride (when located at transit stations), is a semi-enclosed space that offers a higher level of security than ordinary bike racks. Accessible via key-card, combination locks, or keys, BikeSPAs provide high-capacity parking for 10 to 100 or more bicycles. Increased security measures create an additional transportation option for those whose biggest concern is theft and vulnerability. Guidance Key features may include: Closed-circuit television monitoring. Double high racks & cargo bike spaces. Bike repair station with bench. Bike tube and maintenance item vending machine. Bike lock hitching post allows people to leave bike locks. Secure access for users. Double-height racks help take advantage of the vertical space, further maximizing the parking capacity. In the space formerly used for seven cars, a BikeSPA can comfortably park 80 bikes with room for future expansion. Discussion Long-term parking facilities are more expensive to provide than short-term facilities, but are also significantly more secure. Although many bicycle commuters would be willing to pay a nominal fee to guarantee the safety of their bicycle, long-term bicycle parking should be free wherever automobile parking is free. BikeSPAs are ideal for transit centers, airports, train stations, or wherever large numbers of people might arrive by bicycle and need a secure place to park while away. Additional References and Guidelines AASHTO. Guide for the Development of Bicycle Facilities APBP. Bicycle Parking Guide 2nd Edition Materials and Maintenance Regularly inspect the functioning of moving parts and enclosures. Change keys and access codes periodically to prevent access to unapproved users. 128

133 OC Foothills Bikeways Strategy BICYCLE ACCESS THROUGH CONSTRUCTION AREAS Description Wherever bicycles are allowed, measures should be taken to provide for the continuity of a bicyclist s trip through a work zone area. Bicyclists should not be led into conflicts with work site vehicles, equipment, moving vehicles, open trenches, or temporary construction signage. Efforts should be made to re-create a bike lane (if one exists) to the left of the construction zone. If this is impossible, then consider the closure of a standard-width travel lane to accommodate bicycle travel. Use asphalt lip on edges greater than.275 Sign placement when no furnishing zone is present Guidance Construction Signage Place in a location that does not obstruct the path of bicyclists or pedestrians. Detour and closure signs related to bicycle travel may be included on all bikeways where construction activities occur. Signage should also be provided on all other roadways. Bicycle Travel around Steel Grates Require temporary asphalt (cold mix) around plates to create a smooth transition. Preferred sign placement in sidewalk furnishing zone Use steel plates only as a temporary measure during construction, not for extended periods. Use warning signs where steel plates are in use. Require both temporary and final repaving to provide a smooth surface without abrupt edges. Discussion Plates used to cover trenches tend to not be flush with pavement and have a 1-2 vertical transition on the edges. This can puncture a hole in a bicycle tire and cause a bicyclist to lose control. Although it is common to use steel plates during non-construction hours, these plates can be dangerously slippery, particularly when wet. Contractors performing work should be made aware of the needs of bicyclists and be properly trained in how to safely route bicyclists through or around work zones. Additional References and Guidelines AASHTO. Guide for the Development of Bicycle Facilities FHWA. Manual on Uniform Traffic Control Devices FHWA. Federal Highway Administration University Course on Bicycle and Pedestrian Transportation. Lesson 21: Bicycle and Pedestrian Accommodation in Work Zones Materials and Maintenance Debris should be swept to maintain a reasonably clean riding surface in the outer 5-6 ft of roadway. 129


 Tree and shrub plantings, trimming Major damage response (washouts, fallen trees, flooding) This Section Includes: Sweeping")
134 OCTA - Orange County Transportation Authority 5.12 BIKEWAY MAINTENANCE Regular bicycle facility maintenance includes sweeping, maintaining a smooth roadway, ensuring that the gutter-to-pavement transition remains relatively flush, and installing bicycle-friendly drainage grates. Pavement overlays are a good opportunity to improve bicycle facilities. The following recommendations provide a menu of options to consider to enhance a maintenance regimen. Sweeping Recommended Walkway and Bikeway Maintenance Activities Maintenance Activity Inspections Pavement sweeping/ blowing Pavement sealing Pothole repair Culvert and drainage grate inspection Pavement markings replacement Signage replacement Frequency Seasonal at beginning and end of Summer As needed, with higher frequency in the early Spring and Fall 5-15 years 1 week 1 month after report Before Winter and after major storms As needed As needed Roadway Surface Gutter to Pavement Transition Shoulder plant trimming (weeds, trees, brambles) Tree and shrub plantings, trimming Major damage response (washouts, fallen trees, flooding) This Section Includes: Sweeping Signage Roadway Surface Pavement Overlays Drainage Grates Twice a year; middle of growing season and early Fall 1 3 years As soon as possible Drainage Grates Landscaping Gutter to Pavement Transition Landscaping Maintenance Management Plan Maintenance Management Plan 130
135 OC Foothills Bikeways Strategy SWEEPING Description Bicyclists often avoid shoulders and bike lanes filled with gravel, broken glass and other debris; they will ride in the roadway to avoid these hazards, potentially causing conflicts with motorists. Debris from the roadway should not be swept onto sidewalks (pedestrians need a clean walking surface), nor should debris be swept from the sidewalk onto the roadway. A regularly scheduled inspection and maintenance program helps ensure that roadway debris is regularly picked up or swept. Guidance Establish a seasonal sweeping schedule that prioritizes roadways with major bicycle routes. Sweep walkways and bikeways whenever there is an accumulation of debris on the facility. In curbed sections, sweepers should pick up debris; on open shoulders, debris can be swept onto gravel shoulders. Pave gravel driveway approaches to minimize loose gravel on paved roadway shoulders. Perform additional sweeping in the Spring to remove debris from the Winter. Perform additional sweeping in the Fall in areas where leaves accumulate GUTTER TO PAVEMENT TRANSITION Description On streets with concrete curbs and gutters, 1 to 2 feet of the curbside area is typically devoted to the gutter pan, where water collects and drains into catch basins. On many streets, the bikeway is situated near the transition between the gutter pan and the pavement edge. This transition can be susceptible to erosion, creating potholes and a rough surface for travel. The pavement on many streets is not flush with the gutter, creating a vertical transition between these segments. This area can buckle over time, creating a hazardous condition for bicyclists. Guidance Ensure that gutter-to-pavement transitions have no more than a ¼ vertical transition. Examine pavement transitions during every roadway project for new construction, maintenance activities, and construction project activities that occur in streets. Inspect the pavement 2 to 4 months after trenching construction activities are completed to ensure that excessive settlement has not occurred. Provide at least 3 feet of pavement outside of the gutter seam. 131

136 OCTA - Orange County Transportation Authority ROADWAY SURFACE Description Bicycles are much more sensitive to subtle changes in roadway surface than are motor vehicles. Various materials are used to pave roadways, and some are smoother than others. Compaction is also an important issue after trenches and other construction holes are filled. Uneven settlement after trenching can affect the roadway surface nearest the curb where bicycles travel. Sometimes compaction is not achieved to a satisfactory level, and an uneven pavement surface can result due to settling over the course of days or weeks. When resurfacing streets, use the smallest chip size and ensure that the surface is as smooth as possible to improve safety and comfort for bicyclists. Guidance Maintain a smooth pothole-free surface. Ensure that on new roadway construction, the finished surface on bikeways does not vary more than ¼. Maintain pavement so ridge buildup does not occur at the gutter-to-pavement transition or adjacent to railway crossings. Inspect the pavement 2 to 4 months after trenching construction activities are completed to ensure that excessive settlement has not occurred. If chip sealing is to be performed, use the smallest possible chip on bike lanes and shoulders. Sweep loose chips regularly following application. During chip seal maintenance projects, if the pavement condition of the bike lane is satisfactory, it may be appropriate to chip seal the travel lanes only. However, use caution when doing this so as not to create an unacceptable ridge between the bike lane and travel lane DRAINAGE GRATES Description Drainage grates are typically located in the gutter area near the curb of a roadway. Drainage grates typically have slots through which water drains into the municipal storm sewer system. Many older grates were designed with linear parallel bars spread wide enough for a tire to become caught so that if a bicyclist were to ride on them, the front tire could become caught in the slot. This would cause the bicyclist to tumble over the handlebars and sustain potentially serious injuries. Guidance Require all new drainage grates be bicycle-friendly, including grates that have horizontal slats on them so that bicycle tires and assistive devices do not fall through the vertical slats. Create a program to inventory all existing drainage grates, and replace hazardous grates as necessary temporary modifications such as installing rebar horizontally across the grate should not be an acceptable alternative to replacement. Direction of travel 4 spacing max 132
City of Novi Non-Motorized Master Plan 2011 Executive Summary
 City of Novi Non-Motorized Master Plan 2011 Executive Summary Prepared by: February 28, 2011 Why Plan? Encouraging healthy, active lifestyles through pathway and sidewalk connectivity has been a focus
Transportation Master Plan Advisory Task Force
 Transportation Master Plan Advisory Task Force Network Alternatives & Phasing Strategy February 2016 BACKGROUND Table of Contents BACKGROUND Purpose & Introduction 2 Linking the TMP to Key Council Approved
Proposed. City of Grand Junction Complete Streets Policy. Exhibit 10
 Proposed City of Grand Junction Complete Streets Policy Exhibit 10 1 City of Grand Junction Complete Streets Policy Vision: The Complete Streets Vision is to develop a safe, efficient, and reliable travel
EXECUTIVE SUMMARY. Vision
 Vision Walking and bicycling in Salt Lake City will be safe, convenient, comfortable, and viable transportation options that connect people to places, foster recreational and economic development opportunities,
Chapter 2. Bellingham Bicycle Master Plan Chapter 2: Policies and Actions
 Chapter 2 Bellingham Bicycle Master Plan Chapter 2: Policies and Actions Chapter 2: Policies and Actions The Bicycle Master Plan provides a road map for making bicycling in Bellingham a viable transportation
Chapter 7. Transportation. Transportation Road Network Plan Transit Cyclists Pedestrians Multi-Use and Equestrian Trails
 Chapter 7 Transportation Transportation Road Network Plan Transit Cyclists Pedestrians Multi-Use and Equestrian Trails 7.1 TRANSPORTATION BACKGROUND The District of Maple Ridge faces a number of unique
RESOLUTION NO ?? A RESOLUTION OF THE CITY OF NEPTUNE BEACH ADOPTING A COMPLETE STREETS POLICY
 RESOLUTION NO. 2018-?? A RESOLUTION OF THE CITY OF NEPTUNE BEACH ADOPTING A COMPLETE STREETS POLICY WHEREAS, safe, convenient, and accessible transportation for all users is a priority of the City of Neptune
Perryville TOD and Greenway Plan
 Perryville TOD and Greenway Plan Greenway Glossary Pathway: A bicycle and pedestrian path separated from motorized vehicular traffic by an open space, barrier or curb. Multi-use paths may be within the
Corpus Christi Metropolitan Transportation Plan Fiscal Year Introduction:
 Introduction: The Safe, Accountable, Flexible, Efficient Transportation Equity Act: A Legacy for Users (SAFETEA-LU) has continued the efforts started through the Intermodal Surface Transportation Efficiency
4 MOBILITY PLAN. Mobility Plan Objectives. Mobility Context. 1. Integrate with Local and Regional Transit Improvements
 Harbor Mixed Use CHAPTER Transit Corridor 4: Mobility Plan 4 MOBILITY PLAN Mobility Plan Objectives The Harbor Corridor Plan seeks to expand and improve the ways that people move along and through the
4. ENVIRONMENTAL IMPACT ANALYSIS 9. TRANSPORTATION AND TRAFFIC
 4. ENVIRONMENTAL IMPACT ANALYSIS 9. TRANSPORTATION AND TRAFFIC 4.9.1 INTRODUCTION The following section addresses the Proposed Project s impact on transportation and traffic based on the Traffic Study
Bicycle Master Plan Goals, Strategies, and Policies
 Bicycle Master Plan Goals, Strategies, and Policies Mobilizing 5 This chapter outlines the overarching goals, action statements, and action items Long Beach will take in order to achieve its vision of
Solana Beach Comprehensive Active Transportation Strategy (CATS)
") Solana Beach Comprehensive Active Transportation Strategy (CATS) 3.0 Goals & Policies The Solana Beach CATS goals and objectives outlined below were largely drawn from the Solana Beach Circulation Element
Solana Beach Comprehensive Active Transportation Strategy (CATS) 3.0 Goals & Policies The Solana Beach CATS goals and objectives outlined below were largely drawn from the Solana Beach Circulation Element
CONNECTING PEOPLE TO PLACES
 CONNECTING PEOPLE TO PLACES 82 EAST BENCH MASTER PLAN 07 Introduction The East Bench transportation system is a collection of slow moving, treelined residential streets and major arteries that are the
TABLE OF CONTENTS. Executive Summary
 Executive Summary Background... ES-1 Pedestrian Network... ES-2 Bikeway Network... ES-2 Collision History... ES-2 Public Input... ES-4 Conclusions and Recommendations... ES-4 1. Introduction and Setting
PEDESTRIAN ACTION PLAN
 ATTACHMENT 2 CITY OF SANTA MONICA PEDESTRIAN ACTION PLAN CITY OF SANTA MONICA PEDESTRIAN ACTION PLAN This page intentionally left blank EXECUTIVE SUMMARY CHAPTER 1 EXECUTIVE SUMMARY Setting the Stage
Chapter 14 PARLIER RELATIONSHIP TO CITY PLANS AND POLICIES. Recommendations to Improve Pedestrian Safety in the City of Parlier (2014)
") Chapter 14 PARLIER This chapter describes the current status and future plans for biking and walking in the City of Parlier. RELATIONSHIP TO CITY PLANS AND POLICIES The Parlier General Plan is the primary
Chapter 14 PARLIER This chapter describes the current status and future plans for biking and walking in the City of Parlier. RELATIONSHIP TO CITY PLANS AND POLICIES The Parlier General Plan is the primary
I-105 Corridor Sustainability Study (CSS)
") I-105 Corridor Sustainability Study (CSS) Metro Streets and Freeways Subcommittee March 21, 2019 Gary Hamrick Cambridge Systematics, Inc. I-105 CSS Project History & Background Funded by Caltrans Sustainable
I-105 Corridor Sustainability Study (CSS) Metro Streets and Freeways Subcommittee March 21, 2019 Gary Hamrick Cambridge Systematics, Inc. I-105 CSS Project History & Background Funded by Caltrans Sustainable
PEDALING FORWARD. A Glance at the SFMTA s Bike Program for SFMTA.COM
 PEDALING FORWARD A Glance at the SFMTA s Bike Program for 2017-2021 SFMTA.COM INTRODUCTION About This Booklet More people from all walks of life see their bicycle as a more convenient way to get where
Exhibit 1 PLANNING COMMISSION AGENDA ITEM
 Exhibit 1 PLANNING COMMISSION AGENDA ITEM Project Name: Grand Junction Circulation Plan Grand Junction Complete Streets Policy Applicant: City of Grand Junction Representative: David Thornton Address:
Chapter 5. Complete Streets and Walkable Communities.
 Chapter 5. Complete Streets and Walkable Communities. 5.1 Description of Complete Streets. Cities throughout the world, and specifically the United States, are coming to embrace a new transportation and
WALKNBIKE DRAFT PLAN NASHVILLE, TENNESSEE EXECUTIVE SUMMARY NASHVILLE, TENNESSEE
 NASHVILLE, TENNESSEE EXECUTIVE SUMMARY Executive Summary A world-class multi-modal transportation system is essential to a vibrant city and better quality of life. -Mayor Barry The WalknBike plan aims
Berkeley Strategic Transportation Plan A-76
 Berkeley Strategic Transportation Plan A-76 Appendices 1. A Team Effort 2. Where We ve Been A-11 Berkeley Strategic Transportation Plan Alameda County Transportation Plan Alameda County will be served
Goals, Objectives, and Policies
 Goals, Objectives, and Policies ADVISORY GROUP INPUT PUBLIC INPUT SNS PREVIOUS STUDIES RBPP Goals Vision Statement Southern Nevada will develop a safe, connected, and convenient walking and bicycling system
General Plan Circulation Element Update Scoping Meeting April 16, 2014 Santa Ana Senior Center, 424 W. 3rd Street, Santa Ana, CA 92701
 General Plan Circulation Element Update Scoping Meeting April 16, 2014 Santa Ana Senior Center, 424 W. 3rd Street, Santa Ana, CA 92701 Meeting Agenda 1. Purpose of Scoping Meeting 2. Project Overview 3.
EXECUTIVE SUMMARY... vii 1 STUDY OVERVIEW Study Scope Study Area Study Objectives
 Contents EXECUTIVE SUMMARY... vii 1 STUDY OVERVIEW... 1-1 1.1 Study Scope... 1-1 1.2 Study Area... 1-1 1.3 Study Objectives... 1-3 2 EXISTING CONDITIONS... 2-1 2.1 Existing Freeway Conditions... 2-4 2.1.1
CITY OF BLOOMINGTON COMPLETE STREETS POLICY
 CITY OF BLOOMINGTON COMPLETE STREETS POLICY POLICY OBJECTIVE: The City of Bloomington will enhance safety, mobility, accessibility and convenience for transportation network users of all ages and abilities,
Living Streets Policy
 Living Streets Policy Introduction Living streets balance the needs of motorists, bicyclists, pedestrians and transit riders in ways that promote safety and convenience, enhance community identity, create
4 Goals, Objectives & Actions
 Chapter4 4 This chapter presents goals, objectives, and recommended actions to support the vision of making Overland Park a safer and easier place to ride a bicycle. 35 4.1 Recommendations Structure The
Circulation in Elk Grove includes: Motor vehicles, including cars and trucks
 Circulation, as it is used in this General Plan, refers to the many ways people and goods move from place to place in Elk Grove and the region. Circulation in Elk Grove includes: Motor vehicles, including
NM-POLICY 1: Improve service levels, participation, and options for non-motorized transportation modes throughout the County.
 Transportation PRINCE WILLIAM COUNTY 2008 COMPREHENSIVE PLAN NON-MOTORIZED PLAN CONTENTS Goals, Policies, and Action Strategies Table 4 (Bike Facility Classifications and Descriptions) Table 5 (Bike Facility
SANTA CLARA COUNTYWIDE BICYCLE PLAN August 2008
 SANTA CLARA COUNTYWIDE BICYCLE PLAN August 2008 To assist VTA and Member Agencies in the planning, development and programming of bicycle improvements in Santa Clara County. Vision Statement To establish,
Climate Change Action Plan: Transportation Sector Discussion Paper: Cycling
 Climate Change Action Plan: Transportation Sector Discussion Paper: Cycling ontario.ca/climatechange Contents 1. Minister of Transportation s message... 3 2. Introduction... 5 3. Sector Overview and Support
Kelowna On the Move. Pedestrian and Bicycle Master Plan
 Kelowna On the Move Pedestrian and Bicycle Master Plan Executive Summary April 2016 Purpose of the Plan The Pedestrian and Bicycle Master Plan identifies infrastructure, planning, and policy requirements
TRANSIT & NON-MOTORIZED PLAN DRAFT FINAL REPORT Butte County Association of Governments
 1 INTRODUCTION Maintaining a high quality of life is the essence of this plan for transit and non-motorized transportation in Butte County. Curbing greenhouse gas emissions (GHG) by reducing congestion,
5. Pedestrian System. Accomplishments Over the Past Five Years
 5. Pedestrian System Accomplishments Over the Past Five Years The Alamo Area Metropolitan Planning Organization (MPO) and its partner agencies recognize the importance of improving pedestrian mobility.
Agenda. Overview PRINCE GEORGE S PLAZA METRO AREA PEDESTRIAN PLAN
 PRINCE GEORGE S PLAZA METRO AREA PEDESTRIAN PLAN May 28, 2008 Agenda Welcome and introductions Project overview and issue identification Planning context and strengths Design challenges and initial recommendations
ACTIVE TRANSPORTATION
 ACTIVE TRANSPORTATION Mobility 2040 Supported Goals Improve the availability of transportation options for people and goods. Support travel efficiency measures and system enhancements targeted at congestion
summary of issues and opportunities
 1 summary of issues and opportunities EXECUTIVE SUMMARY CHAPTER 2: HISTORY - 3: LAND USE This first chapter is an overview of lessons learned from analysis of the existing conditions on El Camino as well
Regional Transportation Needs Within Southeastern Wisconsin
 Regional Transportation Needs Within Southeastern Wisconsin #118274 May 24, 2006 1 Introduction The Southeastern Wisconsin Regional Planning Commission (SEWRPC) is the official areawide planning agency
Key objectives of the survey were to gain a better understanding of:
 3 COMMUNITY INPUT Community input is an essential part of corridor studies. For the SR 87 corridor study, VTA staff conducted an extensive online survey of people living and commuting along the corridor.
Memorandum. Fund Allocation Fund Programming Policy/Legislation Plan/Study Capital Project Oversight/Delivery Budget/Finance Contract/Agreement Other:
 Memorandum Date: November 20, 2017 To: Transportation Authority Board From: Eric Cordoba Deputy Director Capital Projects Subject: 12/5/17 Board Meeting: San Francisco Freeway Corridor Management Study
Proposed White Flint Separated Bike Lane Network September 2015
 Proposed White Flint Separated Bike Lane Network September 2015 Abstract This report includes a proposed separated bike lane network for the White Flint Sector Plan area. Separated bike lanes create a
ACTIVE TRANSPORTATION/NONMOTORIZED TRANSPORTATION
 ACTIVE TRANSPORTATION/NONMOTORIZED TRANSPORTATION BACKGROUND Active transportation, also known as nonmotorized transportation, is increasingly recognized as an important consideration when planning and
CITY OF COCOA BEACH 2025 COMPREHENSIVE PLAN. Section VIII Mobility Element Goals, Objectives, and Policies
 CITY OF COCOA BEACH 2025 COMPREHENSIVE PLAN Section VIII Mobility Element Goals, Objectives, and Policies Adopted August 6, 2015 by Ordinance No. 1591 VIII MOBILITY ELEMENT Table of Contents Page Number
Chapter 5 Future Transportation
 Chapter 5 Future Transportation The Future Land Use Plan identifies the desired land use designations. The land uses desired for Crozet depend, in large part, on the success of the transportation system,
TOWN OF PORTLAND, CONNECTICUT COMPLETE STREETS POLICY
 TOWN OF PORTLAND, CONNECTICUT COMPLETE STREETS POLICY I. VISION, GOALS & PRINCIPLES VISION To improve the streets of Portland making them safer and more accessible for all users including pedestrians,
Bikeway action plan. Bicycle Friendly Community Workshop March 5, 2007 Rochester, MN
 Bikeway action plan Summary The was held on March 5, 2007 at the Rochester Mayo Civic Center. The workshop was hosted by Rochester-Olmsted County Planning Department in collaboration with the League of
Eastern PA Trail Summit October 1, 2018
 Eastern PA Trail Summit October 1, 2018 WHO WE ARE + WHY + WE RE * HERE * * * * * * Session Goals: Discuss how to coordinate planning and design in small, urbanized towns Consider how to develop alternative
Planning Guidance in the 2012 AASHTO Bike Guide
 Planning Guidance in the 2012 AASHTO Bike Guide Presentation by: RJ Eldridge Peter Lagerwey August 22, 2012 WEBINAR 2: PLANNING GUIDANCE IN THE 2012 AASHTO BIKE GUIDE Today s Webinar Significant Updates
City of Jacksonville Mobility Fee Update
 City of Jacksonville Mobility Fee Update 2017 Preliminary Analysis May 3, 2017 Carnival Cruise lines photo credit Presentation Overview Public Outreach Process Pedestrian and Bicycle Master Plan Study
Executive Summary Route 30 Corridor Master Plan
 Route Corridor Master Plan Project Overview The Route Corridor Master Plan is a coordinated multimodal transportation and land use plan for the entire stretch of Route through East Whiteland Township,
DRAFT MOVING FORWARD RHODE ISLAND BICYCLE MOBILITY PLAN 2018 PREPARED FOR PREPARED BY IN ASSOCIATION WITH
 RHODE ISLAND MOVING FORWARD BICYCLE MOBILITY PLAN 2018 PREPARED FOR PREPARED BY IN ASSOCIATION WITH T AF CHAPTER 1 D R INTRODUCTION CHAPTER 3 ARTICULATES VISION Bicycling is safe, fun and practical in
Agency Advisory Group Meeting #3 and Walk Audit Anchorage Non-Motorized Plan
 Agency Advisory Group Meeting #3 and Walk Audit Anchorage Non-Motorized Plan Friday, May 18 th Walk Audit 10:00-11:30 AM Meeting 11:30 AM 1:00 PM Municipal Planning Department, 4700 Elmore Road, Training
BIKE PLAN CONTENTS GATEWAY
 CONTENTS Acknowledgments...vii Great Rivers Greenway District Board of Directors... vii Great Rivers Greenway District Staff... vii Project Consultants... vii Committees... viii Citizens Advisory Committee
Public Works AGENDA ITEM D-2 STAFF REPORT
 AGENDA ITEM D-2 Public Works STAFF REPORT Transportation Master Plan Oversight and Outreach Committee Meeting Date: 10/30/2017 Staff Report Number: 17-001-TMP Regular Business: Provide feedback on Performance
AMATS Complete Streets Policy
 AMATS Complete Streets Policy Table of Contents: Section 1. Definition of Complete Streets Section 2. Principles of Complete Streets Section 3. Complete Streets Policy Section 4. Consistency Section 5.
Welcome. Background. Goals. Vision
 Welcome The formal Public Information Centre (PIC) for the Transportation Master Plan How We GO will be held in early 2017. At that time we will present the recommended transportation system for Niagara
CHAPTER 3: Vision Statement and Goals
 Davidson Walks & Rolls: Active Transportation Master Plan CHAPTER 3 Contents: Overview Vision Statement Measurable Goals Public Outreach CHAPTER 3: Vision Statement and Goals Overview The vision statement
San Mateo County Comprehensive Bicycle and Pedestrian Plan Open House
 San Mateo County Comprehensive Bicycle and Pedestrian Plan Open House October 28, 2010 Presented to San Mateo County residents and interested parties by Lauren Ledbetter, Alta Planning + Design Matt Haynes,
MCTC 2018 RTP SCS and Madera County RIFP Multi-Modal Project Eval Criteria GV13.xlsx
 MCTC 8 RTP SCS and Madera County RIFP Multi-Modal Project Eval Criteria GV.xlsx Madera County Transportation Commission Regional Transportation Plan / Sustainable Communities Strategy Multi-Modal Project
Purpose and Need. Chapter Introduction. 2.2 Project Purpose and Need Project Purpose Project Need
 Chapter 2 Purpose and Need 2.1 Introduction The El Camino Real Bus Rapid Transit (BRT) Project (Project) would make transit and other transportation improvements along a 17.6-mile segment of the El Camino
Moving Cambridge. City of Cambridge Transportation Master Plan Public Consultation Centre. March 7, :00 8:00 PM.
 City of Cambridge Transportation Master Plan Public Consultation Centre March 7, 2018 5:00 8:00 PM Region of Waterloo City of Cambridge Transportation Master Plan Public Consultation Centre March 7, 2018
T1-A - Service Reduction (Re-sizing)
") Key T1-A Choice A Key T1-B Choice B Key T1-C Choice C Key T1-D Choice D Key T1-E Choice E Key T1-F Choice F Key Choice G T2 T1-A - Service Reduction (Re-sizing) Description This key choice would represent
Key T1-A Choice A Key T1-B Choice B Key T1-C Choice C Key T1-D Choice D Key T1-E Choice E Key T1-F Choice F Key Choice G T2 T1-A - Service Reduction (Re-sizing) Description This key choice would represent
CHAPTER 7.0 IMPLEMENTATION
 CHAPTER 7.0 IMPLEMENTATION Achieving the vision of the Better Streets Plan will rely on the ability to effectively fund, build and maintain improvements, and to sustain improvements over time. CHAPTER
University of Victoria Campus Cycling Plan Terms of Reference. 1.0 Project Description
 University of Victoria Campus Cycling Plan Terms of Reference 1.0 Project Description The Campus Cycling Plan, a first for the University, will provide a comprehensive and coordinated approach to support
Chapter 13 ORANGE COVE
 Chapter 13 ORANGE COVE This chapter describes the current status and future plans for biking and walking in the City of Orange Cove. RELATIONSHIP TO CITY PLANS AND POLICIES The Orange Cove General Plan
TRANSPORTATION TRAINING TOPICS. April 6, 2010
 TRANSPORTATION TRAINING TOPICS April 6, 2010 Roles of Transportation Providers Context and Policy Makers Division of Transportation and Traffic Other City Operations Other Transportation Operators CMA
Multimodal Through Corridors and Placemaking Corridors
 68 Multimodal Through Corridors and Placemaking Corridors Corridors have different functions in a region. Some corridors are used to get smoothly and rapidly through a region or to get quickly to major
2015 Florida Main Street Annual Conference. Complete Streets Equal Stronger Main Streets
 WHAT ARE COMPLETE STREETS? CASE STUDIES COMPLETING YOUR MAIN STREET 2015 Florida Main Street Annual Conference St. Petersburg, Florida August 19, 2015 WHAT ARE COMPLETE STREETS? CASE STUDIES COMPLETING
Madison Urban Area and Dane County. Bicycle Transportation Plan Summary. September Introduction. Bicycle Plan Scope and Planning Process
 Bicycle Transportation Plan Summary Madison Urban Area and Dane County Introduction September 2000 Bicycling is an important mode of transportation in the Madison urban area and countywide that is available
Town of Babylon Sustainable Complete Streets Policy
 Town of Babylon Sustainable Complete Streets Policy Steve Bellone, Supervisor Adopted July 14, 2010 1 Table of Contents Vision... 3 Policy Statement... 3 Definition... 3 Road Users... 4 Network... 4 Roads...
The Route 29 Corridor Study was initiated at the request of Virginia s Commonwealth
 CHAPTER 2: Study Background and approach The Route 29 Corridor Study was initiated at the request of Virginia s Commonwealth Transportation Board in response to requests from members of the General Assembly
Santa Clara I-280 CORRIDOR STUDY
 Santa Clara I-280 CORRIDOR STUDY OCTOBER 2017 PREPARED BY: 1.1 Background The I-280 Corridor Study within Santa Clara County is a high-level highway planning study led by the Santa Clara VTA, in partnership
SAN FRANCISCO MUNICIPAL TRANSPORTATION AGENCY
 THIS PRINT COVERS CALENDAR ITEM NO. : 11 DIVISION: Sustainable Streets BRIEF DESCRIPTION: SAN FRANCISCO MUNICIPAL TRANSPORTATION AGENCY Approving traffic modifications on Twin Peaks Boulevard between Christmas
NASHUA REGIONAL PLANNING COMMISSION REGIONAL BICYCLE AND PEDESTRIAN PLAN
 NASHUA REGIONAL PLANNING COMMISSION REGIONAL BICYCLE AND PEDESTRIAN PLAN June, 2005 Prepared by the Nashua Regional Planning Commission 2005 NRPC Regional Bicycle and Pedestrian Plan- JUNE 2005 ACKNOWLEDGEMENTS
Speed Limits Study and Proposal. Public Input Session: 8/14/13
 Speed Limits Study and Proposal Public Input Session: 8/14/13 Why is Decatur a unique place for this project? First Community Transportation Plan in the nation with a Health Impact Assessment. Strong sense
Develop a Multi-Modal Transportation Strategy (Theme 6)
") DEVELOP A MULTI-MODAL TRANSPORTATION STRATEGY (THEME 6) WHY IS THIS THEME ADDRESSED? Develop a Multi-Modal Transportation Strategy (Theme 6) Statement of Ideal Reduce resident and visitor reliance on single
DEVELOP A MULTI-MODAL TRANSPORTATION STRATEGY (THEME 6) WHY IS THIS THEME ADDRESSED? Develop a Multi-Modal Transportation Strategy (Theme 6) Statement of Ideal Reduce resident and visitor reliance on single
Creating Complete Streets to Accommodate All Users
 Creating Complete Streets to Accommodate All Users Peter Lagerwey, Toole Design Group plagerwey@tooledesign.com Brian Dougherty, Seattle DOT brian.dougherty@seattle.gov International Conference on Urban
City of Birmingham Draft Multi-modal Transportation Plan
 City of Birmingham Draft Multi-modal Transportation Plan City Commission Public Hearing Monday, November 25, 2013 7:30 pm Norman Cox, PLA, ASLA The Greenway Collaborative, Inc. Ann Arbor, Michigan The
 Time of Change We Are Growing We Are An Attractive Place To Live We Are Age Diverse + Living Longer 50000 40000 30000 20000 10000 0 2010 Census Job Density Housing Sheds Transit Sheds The Project FUNDING
WELCOME TO OPEN HOUSE # 1 June 14, 2017
 Langstaff Road Weston Road to Highway 7 Class Environmental Assessment Study WELCOME TO OPEN HOUSE # 1 June 14, 2017 Please sign in and join our mailing list Purpose of Open House #1 & Study Area York
REGIONAL BICYCLE AND PEDESTRIAN DESIGN GUIDELINES
 REGIONAL BICYCLE AND PEDESTRIAN DESIGN GUIDELINES November 16, 2011 Deb Humphreys North Central Texas Council of Governments Bicycle and Pedestrian Advisory Committee Snapshot of the Guide 1. Introduction
Clackamas County Comprehensive Plan
 ROADWAYS The County s road system permits the movement of goods and people between communities and regions, using any of a variety of modes of travel. Roads provide access to virtually all property. They
GRAHAM PEDESTRIAN TRANSPORTATION PLAN
 GRAHAM PEDESTRIAN TRANSPORTATION PLAN Chapter 1 I 1.1 Scope and Purpose n March of 2005, the City of Graham contracted with Greenways Incorporated (GWI) to create a Pedestrian Transportation Plan. The
Owl Canyon Corridor Project Overview and Summary
 Owl Canyon Corridor Project Overview and Summary December 22, 2008 The Owl Canyon corridor (generally the connection between the I-25 / Larimer County Road 70 interchange and the US 287 / Larimer County
Rochester Downtown Bicycle Study 2009
 Rochester Downtown Bicycle Study 2009 Relationship of ROCOG Long Range Transportation Plan to Rochester Comprehensive Plan Regional Long Range Transportation Plan (LRTP) is prepared under the auspices
Dear City Council Members,
 From: Bob Kenyon [mailto: ] Sent: Monday, February 08, 2016 10:20 AM To: City Clerk Subject: Please prioritize Caltrain and a complete transit network Thank you for prioritizing bringing BART to San Jose
FOR INFORMATION ONLY
 9 Date: August 6, 2012 Current Meeting: August 16, 2012 Board Meeting: September 6, 2012 BOARD MEMORANDUM TO: THROUGH: FROM: SUBJECT: Santa Clara Valley Transportation Authority Congestion Management Program
North Coast Corridor:
 North Coast Corridor: Connecting People, Transportation & Environment Legislative Hearing: 11.8.10 1 North Coast Corridor Region s Lifeline A Regional Strategy Mobility, Economy & Environment North Coast
CHAPTER 1 INTRODUCTION
 CHAPTER 1 INTRODUCTION Chapter Table of Contents THE 2017 HOUSTON BIKE PLAN 1-1 HOUSTON BIKEWAYS PROGRAM 1-2 HISTORY OF BICYCLE PLANNING IN HOUSTON 1-3 BICYCLE LEVEL OF COMFORT 1-3 EXISTING PLANS, PROGRAMS
Bicycle and Pedestrian Planning in a Historically Car-Centric Culture: A Focus on Connectivity, Safety, & Accessibility
 Bicycle and Pedestrian Planning in a Historically Car-Centric Culture: A Focus on Connectivity, Safety, & Accessibility Kate Horton and Zylavian Watley Transportation Planners Memphis MPO Date: October
Plant City Walk-Bike Plan
 Plant City Walk-Bike Plan Plant City Commute Mode Share 2.2% 1.4% 2.9% Drove alone 10.2% Carpooled Public transportation (0.1%) Walked Used a Bike (0.4%) 82.9% Taxicab, motorcycle, or other means Worked
Land Use and Transportation Town Hall September 17, 2018
 Land Use and Transportation Town Hall September 17, 2018 Welcome! Tonight s Agenda: 7:00-7:30 OVERVIEW PRESENTATIONS 7:30-8:15 BREAKOUT SESSIONS 8:15 - End TOWN HALL CITIZEN S TIME Purpose of Tonight s
CPC Parking Lot Riverside Drive. Transportation Rationale
 CPC Parking Lot Transportation Rationale Prepared By: NOVATECH Suite 200, 240 Michael Cowpland Drive Ottawa, Ontario K2M 1P6 September 2015 Novatech File: 114093 Ref: R-2015-153 Table of Contents 1.0 INTRODUCTION...
Welcome! San Jose Avenue Open House August 25, 2015
 Welcome! San Jose Avenue Open House August 25, 2015 Vision Zero The City and County of San Francisco adopted Vision Zero San Francisco Vision Zero High Injury Network as a policy in 2014, committing an
EXECUTIVE DIRECTIVE NO. 20. Issue Date: July 1, 2011
 ANTONIO R. VILLARAIGOSA MAYOR EXECUTIVE DIRECTIVE NO. 20 Issue Date: July 1, 2011 SUBJECT: Implementation of the 2010 Bicycle Plan It is no secret that the quality of life in Los Angeles is directly influenced
A Matter of Fairness: ROCOG s Environmental Justice Protocol. What is Mobility Limitation?
 No Person Left Behind What is Mobility Limitation? What is the Access Limitation? Environmental Justice population should be provided adequate mobility & access to meet their needs; Identify acceptable
Data Analysis February to March Identified safety needs from reported collisions and existing travel patterns.
 Welcome! Thank you for participating in today s Valencia Bikeway Improvements workshop. Data Analysis February to March Identified safety needs from reported collisions and existing travel patterns. Initial
Typical Rush Hour Commute. PennyforTransportation.com
 Typical Rush Hour Commute In the News Overview of the Plan Collaborative plan with projects in every community Prioritizing connectivity and congestion relief Dedicated transportation-specific funding;