Brady Yauch Executive Director and Economist of Consumer Policy Institute (416) ext 236
|
|
|
- Karen Stevens
- 6 years ago
- Views:
Transcription


1 Brady Yauch Executive Director and Economist of Consumer Policy Institute (416) ext 236
2 The City of Toronto is considering proposals to build a subway line referred to as the Downtown Relief Line to address various traffic congestion problems in the city. These proposals are counterproductive and based on three misunderstandings. Misunderstanding #1: The Downtown Relief Line needs to be built because more people are living downtown. Contrary to its name, the real reason for the Downtown Relief Line is increased ridership from the distant corners of the city and the surrounding suburbs to the downtown core during the busy morning commute. The TTC expects total public transit ridership into the downtown core to increase by 55% by 2031, but the source of that traffic is unevenly distributed, with trips from outside the city expected to grow by 83% over that time period, while trips from within Toronto will grow by just 17%. In short, the TTC s future capacity constraints on the Yonge-University subway line and Bloor-Yonge station are largely a result of growth in suburban, long-distance ridership. Misunderstanding #2: The Yonge-University subway line can t handle future ridership without building the Downtown Relief Line. According to estimates from the TTC, future ridership on the Yonge-University subway line will be handled through a better signalling system to allow more trains to run during rush hour and the introduction of new subway cars capable of moving more people. The Yonge subway line, designed to carry 26,000 people into the downtown core during the peak morning commute, currently moves 28,400. With a better signalling system and new cars, the TTC expects to increase capacity on the subway line by 45% to 38,000 passengers per hour above the expected future ridership of 35,800. Misunderstanding #3: The Downtown Relief Line would be economic. Fare revenues from the Downtown Relief Line would likely never support its operating costs, let alone its capital costs, because even during the busiest travel periods the line is expected to operate at less than half of its total capacity. The Downtown Relief Line, with a best case scenario price tag of $3 billion and a worst-case of $8 billion, leaves the TTC s riders and taxpayers exposed to the risk of cost overruns and chronic operating deficits. What the Yonge Line needs The TTC s problem as it relates to the Yonge line is high demand during a very short period of time the morning commute between 8:00 and 9:00 a.m. into the downtown core. The solution being proposed to this narrow problem is the construction of a multibillion dollar subway line that even during the busiest times will be vastly underutilized. This high-cost solution, in turn, will require future fare increases, discouraging the future use of transit and leading to lower ridership.
3 A more targeted solution is needed. Other jurisdictions around the world use peak pricing to encourage commuters to travel at less busy times. In Melbourne, Australia, transit officials now offer free rides to those commuters who travel prior to the peak morning commute. The effect was to reduce peak ridership, obviating the need for expansion. The solution in Melbourne ended up benefiting transit riders in two ways: for some, their morning commute was free; for others, their morning commute was less crowded, but for all fare-payers and taxpayers, high capital and operating costs were avoided and people travelled more efficiently at lower cost than if the system had been expanded Commuters in Toronto could expect to benefit from a similar approach.
4 I: EXECUTIVE SUMMARY Contrary to its title, the proposed Downtown Relief Line (DRL) is not being built because there are more residents and increased transit ridership in Toronto s downtown core. The $3 billion and counting subway line is being proposed, largely, as a way to deal with growing long-distance ridership on the Yonge-University and Bloor-Danforth lines, as well as the regional commuter service GO Transit, and the impact this is having on the city s downtown transit infrastructure during the busy morning commute. The DRL will require billions of dollars in capital costs and tens of millions of dollars in operating subsidies annually from the Toronto, Ontario and federal governments and, ultimately, taxpayers. That money will likely be raised through greater-than-inflation increases in fares which have more then doubled since the early 1990s while inflation has been about half of that as well as higher property and other taxes. It will also go to support a subway line that will be nearly as underutilized as the controversial Scarborough subway. Though the DRL is being built largely to accommodate riders originating in the outer rings of the TTC system and heading towards the downtown core, all riders will pay the cost of fare increases, while the benefits will be enjoyed by far fewer. The intended benefits of the DRL can be achieved by other means that would save riders and taxpayers billions of dollars. Consumer Policy Institute estimates that offering discounted fares in the hours before the peak morning commute rather than building a new subway line would save the agency billions of dollars in capital and operating costs. For example, even offering residents and TTC riders a free ride to the downtown core in the hours prior to peak morning commute, would save at least $1.5 billion over the next two decades compared to building even the shortest version of the DRL. Such savings would alleviate pressure to increase fares, which would be paid by all riders, while easing overcrowding at critical points in the transit system and ensure greater reliability. The TTC is already finding ways to alleviate congestion on the Yonge subway line with longer trains and a better signalling system. If the TTC were to also introduce targeted fare reductions, the peak morning commute and future growth would likely be accommodated without building the DRL. We believe our proposal to reduce fares in the off-peak periods of travel even to zero, in the most extreme scenario is the best and most immediate solution. We also believe that the introduction of an electronic fare payment system over the next two years provides an excellent opportunity for the TTC to use fares as a way to address overcrowding. Doing so would entice those riders with more flexible schedules to change their travel patterns slightly and receive a discount for doing so and ease congestion on the entire system.
 evening travel periods is becoming the norm.")
5 Building expensive new infrastructure which meets peak demand but remains underutilized off-peak, is an uneconomic and risky way to meet the needs of commuters and does so only at great expense to fare and taxpayers. II: WHY IS THE DOWNTOWN RELIEF LINE BEING PROPOSED? Overcrowding on the TTC during the peak morning and (to a lesser extent) evening travel periods is becoming the norm. The Yonge-University subway line is already at overcapacity for those riders travelling south along Yonge Street during the morning commute. According to the TTC, the Yonge subway line heading into the downtown core moves 28,400 people during the peak morning commute, yet the capacity for that subway line is currently 26,000 people. 1 (See Figure 1.) Figure 1 2 : 1 All figures from the TTC s Downtown Rapid Transit Expansion Study. 2 V/C/ is the volume to capacity ratio. In the case of the Yonge Subway that would be 28,400/26,000.
6 What s Being Done About It? The TTC is currently upgrading its system in two ways to deal with these capacity constraints. First, the TTC has ordered new Toronto Rocket trains that will increase passenger carrying capacity by 10% when fully introduced. The TTC expects the Yonge-University subway line to be completely converted to the new trains by It will then begin upgrading trains on the Bloor-Danforth line. The TTC is also updating its antiquated signalling system on the Yonge-University subway line. The TTC says the new signalling system which it calls Automatic Train Control will shorten the time between arriving trains. Under this new system, a train will arrive every one minute and forty-five seconds as opposed to the current time between trains of two minutes and twenty seconds and will increase the capacity on that subway line by 30%. The TTC also says it may be possible to add another car to each train and further increase capacity by 10%, but admits this is not part of its current plans. Cumulatively, the two upgrades will increase capacity on the subway line by 45% to 38,000 passengers per hour exceeding expected future ridership. Future Ridership and the Suburbs Those upgrades longer trains and better signalling would accommodate the increase in ridership into and within the downtown core that the TTC and city planners expect over the next two decades. Specifically, by 2031, ridership is expected to grow to 35,800 per hour during the morning peak while these upgrades would give the TTC the capacity to accommodate a peak of 38,000 riders. (See Figure 2.)

7 Figure 2: For all modes of public transit, including GO Transit and surface bus and streetcar routes, the TTC forecasts that transit demand into the downtown core will increase by 55% from 155,000 to 236,000 during the peak morning commute. Meanwhile, the number of residents living in the downtown core is expected to grow by 83% from 71,000 to 130,000. Those figures lay the foundation from planners and proponents for the push to build the DRL. In addition, advocates of the DRL argue that because more people will be living and working in the downtown core over the next two decades, more subway lines will be
8 needed to move those workers and residents around the city, particularly during the busy morning commute. Yet, on closer inspection, the Yonge subway line even with the growth in suburban and urban ridership and employment in the downtown core is expected to be below capacity in 2031 after the planned upgrades. The TTC forecasts that ridership on the Yonge subway line into the downtown core during the busiest hour in the morning will grow to 35,800 riders by 2031 or about 6% below peak capacity after the planned upgrades. The TTC acknowledges that of the increased ridership in the downtown core over the next two decades, a large percentage of that increase will be coming from the suburbs, not from short-distance riders who both live and work downtown. The TTC expects ridership into the downtown core to increase by 55% in 2031, but the source of that traffic is unevenly distributed, with trips from outside the city expected to grow by 83%, while trips from within Toronto are expected to grow by just 17%. 3 In short, the TTC s capacity challenges moving forward are largely a result of a growth in suburban, longdistance ridership. Capacity Constraints Will Linger At Some Stations Two TTC subway stations that will continue to face capacity constraints are the Bloor- Yonge station, which is the main transfer point from riders coming from the Bloor- Danforth line and headed into the downtown core, and the TTC platform at Union Station. The TTC forecasts that the number of passengers traveling through the Bloor-Yonge subway station will increase from 23,000 per hour today to 37,000 by 2031, or about a 60% increase. (See Figure 3.) It argues that such an increase will compound existing concerns about the adequacy of Bloor-Yonge Station from a passenger safety perspective and may have a negative impact on the ability of the new signalling system and new longer trains to add capacity. It is currently studying ways to improve the station s capacity. 3 Downtown Raid Transit Expansion Study, Presentation,

9 Figure 3: At Union Station, the number of boardings is expected to grow significantly, largely because of more GO Transit riders transferring to the Yonge-University subway line and, to a lesser extent, because of more residents living in the downtown core who are boarding the trains to go uptown and to other areas in the city. The TTC expects boardings at Union Station to triple by 2031 from 5,700 to 17,300. Other stations in the downtown core, such as King, are also expected to see dramatic increases in boardings, which the TTC says may exceed station capacities in the future during peak periods. Making Matters Worse and Adding Fuel to DRL Fire Potentially exacerbating those capacity concerns are calls to extend the Yonge subway line north into Richmond Hill. Metrolinx the provincial transit agency has made the project to extend the Yonge subway line north by as many as six stops one of its priority projects. 4 4 Yonge North Subway Extension, Metrolinx
 It also argues that a Yonge subway extension will aggravate concerns about riders using the TTC, rather than GO Transit for long distance trips.")
10 The TTC forecasts that, even with the upgrades to longer trains and better signalling, such an extension could potentially push the subway system beyond capacity within a decade. (See Figure 4.) It also argues that a Yonge subway extension will aggravate concerns about riders using the TTC, rather than GO Transit for long distance trips. Already some commuters take the TTC rather than GO Transit for their trip into the downtown core, largely the agency says, because the cost of a TTC token is cheaper. Figure 4: The Real Reason for the DRL The DRL is being proposed as a way of dealing with a growing influx of suburban and other long distance riders who use the TTC to commute to jobs in the downtown core, as well as over capacity concerns on GO Transit, which may push more commuters to use

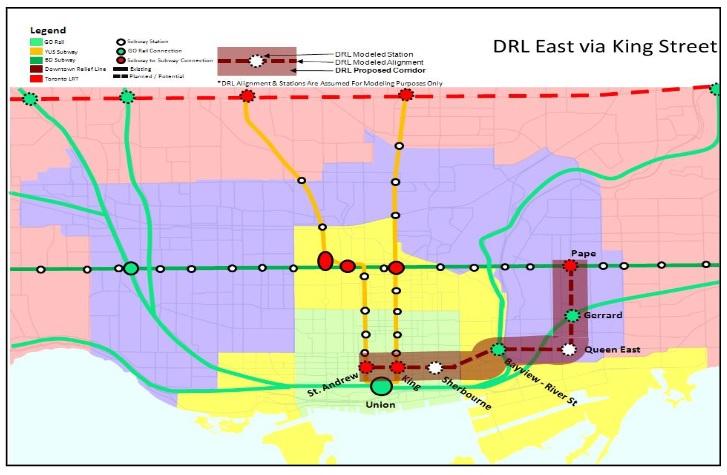
11 the TTC. While ridership across the system is expected to grow in the coming decades, a majority of that ridership will be initiated in the suburbs. The capacity constraints on the Yonge subway line are largely a result of this increase in long-distance journeys essentially the trains are already full by the time they reach outer edge of the downtown area. The push by Metrolinx and other levels of government for extensions of the Yongesubway line and, potentially, the Scarborough subway line will only exacerbate these capacity issues. III: WHAT IS THE DRL? There are a number of different plans for the DRL, but in its most likely form, it would be a subway that runs from Pape station (most likely) on the Bloor-Danforth line to the downtown core. The TTC is currently proposing three different plans for the DRL, each with different costs. Option 1: DRL East via King Street Figure 5:
12 Figure 6:

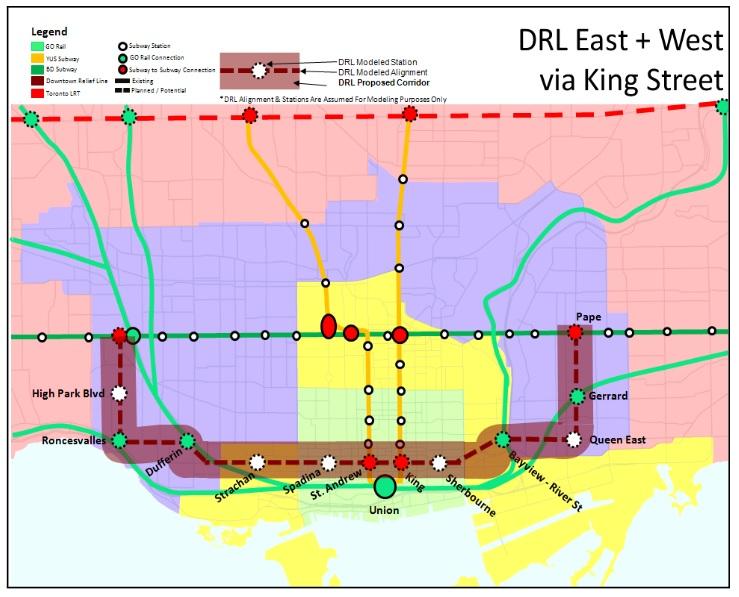
13 Option 2A: DRL East and West along King Street Figure 7:
14 Figure 8:

15 Option 2B: DRL East with Extension to Eglinton Figure 9:

16 Figure 10:

17 Option 3: DRL East and West with Extension to Eglinton Figure 11:

18 Figure 12: What will each proposed DRL cost? Depending on the length of the DRL, it will cost anywhere from $3 billion for the shortest route to as much as $8.2 billion for the longest route, making it one of the most expensive capital projects ever undertaken by the TTC. While those costs are preliminary, the TTC admits that for large infrastructure projects, costs could be 30% higher than original estimates. The current renovation project at Union Station, for example, was first projected to cost $640 million, but has since grown to $800 million. With such overruns, the shortest route could end up costing $4 billion, or more than $600 million per kilometre. Using the shortest route and depending on how frequently the trains run on the new subway line the current 26,000 people per hour capacity or the 38,000 people per hour capacity with the new trains and signalling system the DRL would run at just 45% or
19 30% of its capacity, respectively. For comparison, the controversial Scarborough subway will move more than 9,000 people per hour during the peak morning commute, but will have the capacity to move 30,000 meaning it will be operating at a third of its total capacity. This mismatch between capacity and actual usage will likely make it impossible for the DRL to cover either its operating or capital costs through fares. As a result, it will either drain resources from other parts of the transit system or require further subsidies from all municipal and provincial governments. Figure 13: Cost and Ridership Projections of the DRL 5 1: DRL East via King Street 2A: DRL East and West along King Street 2B: DRL East with Extension to Eglinton 3: DRL East and West with Extension to Eglinton Cost Peak Hour Ridership Increase in Rapid Transit Reduction of Yonge Subway Demand $3 billion 11,700 5% 4,700 (12%) $5.9 billion 13,600 12% 4,800 (13%) $5.3 billion 12,900 5% 5,400 (14%) $8.2 billion 14,900 12% 6,300 (17%) IV: SHIFTING DEMAND THROUGH DISCOUNTED FARES At the heart of the DRL proposal is an effort to limit overcapacity on one part of the subway system during the morning commute. While a subway that costs billions of dollars is being offered as the best solution to that problem (see Figure 12), other transit agencies have shown there are cheaper solutions that are easier to implement, more equitable and will have an immediate impact. One solution that would not cost riders any more than they already pay, and indeed would cost some less, is to offer a discount or even free rides in the hours before or after the morning commute (shoulder periods). Research indicates that offering a discount during 5 Relief Line Preliminary Benefits Case Analysis, Metrolinx -Relief_Line.pdf
20 the shoulder periods would be enough to keep TTC ridership well below capacity until 2031 and beyond. Peak and off-peak fares are already commonly used by transit agencies around the world, with as many as 40% of all major urban public rail networks using them. 6 One common rule of thumb in the transit industry is the Simpson-Curtin Rule, 7 which suggests that every 3% decrease in the price of a ticket will increase ridership by 1%. If this holds true, then a $1 reduction in off peak cash fares on the TTC which would amount to a 33% decrease in cash fares would produce an 11% increase in off-peak ridership. Other evidence from transit agencies around the world shows that many riders are willing to change their commute times if offered a significant discount in off-peak fares. Focus groups undertaken by Transport in London, for example, reported that as many as 41% of travelers arriving during the peak morning commute were willing to switch their schedule, with many respondents saying they would prefer to arrive earlier. 8 In the UK one survey said that 17% of travelers would be willing to commute earlier or later if offered a 20% discount in fares. Another survey done with travelers across the UK showed that nearly one in five commuters who currently travel in the peak hours said they were very or fairly likely to travel outside of busy travel periods if offered a 10% to 20% reduction in fares. They also said that the discounted fares made them feel that they were being rewarded for good behaviour, rather than being punished for bad behaviour. 9 In Sydney, Australia one survey 10 showed that 37% of commuters would travel 30 minutes earlier for a 10% discount on their fare, while 15% would travel 30 minutes later. If the fare discount was increased to 30%, then 52% of travellers would shift their commute 30 minutes earlier, while 25% would travel later. One study, 11 which compiled an average from decades worth of studies on transit elasticities, showed that the overall fare elasticities of travelers during the peak commute over a long period of time (more than two years) was -0.4 to -0.6 (see table below). This means that every 10 percent increase in fares would result in a 4 to 6 percent decrease in ridership. While the elasticities in Figure 14 are for fare increases, research suggests that 6 Spreading peak demand for urban rail through differential fare policy: A review of empirical evidence. Yulin Lie, Phil Charles. 7 Fare Elasticity and Its Application to Forecasting Demand, The American Public Transit Association 8 Edge of morning peak travel Research findings prepared for Passenger Focus by Consolidated, Transport for London 9 Encouraging edge of morning peak travel research findings and policy considerations. Transport for London 10 Surveying Sydney rail commuters willingness to change travel time. Liesel Henn, Neil Douglas and Keith Sloan. 11 Transit Price Elasticities and Cross-Elasticities. Todd Litman
21 you can use the same figure for fare decreases. For example, if a 10% increase in fares produces a 5% decrease in ridership, the reverse would be true if there was a 10% reduction in fares ridership would increase by 5%. Caution should be applied to calculations for elasticities for extreme fare changes (50% lower or higher), as they are less accurate. The study also showed that riders were more willing to switch their schedules over a longer period of time, meaning sustained fare discounts are an effective way of altering travel times. Fare Elasticities The table below gives an estimate of transit elasticities compiled from a number of studies on the topic. The most important figure is the one related to peak travel. According to these figures, free travel in off-peak times could result in as much as 30% of travellers shifting their trip in the short term (1 to 2 years) from the peak period. If the TTC offered discounted fares with $1 or 33% off the cash fare then demand could be expected to shift by anywhere from 4.5% to 9%. Figure : Transit ridership with respect to transit fares Market Segment Short Term (less than 2 years) Long Term Overall -0.2 to to -0.9 Peak to to -0.6 Off-Peak -0.3 to to -0.1 Suburban Commuters -0.3 to to -0.1 Successful examples of discounted and free fares Melbourne, Australia was experiencing a problem of over capacity during the morning commute on its regional trains running into the central business district. Because of these capacity issues, the city s transit agency was considering ordering new trains that would cost tens of millions of dollars. In an effort to find a cheaper way to solve the problem, the agency in 2008 tried something novel: It offered free rides to the downtown core for those riders traveling before 7:00 a.m. In the wake of the new, free fares, research showed that 23% of riders travelling prior to 7:00 a.m. had shifted their travel from the peak period by an average of 42 minutes. 13 Peak demand on the rail system has dropped by as much as 1.5% in the months following 12 See note Design and Impact of a Scheme to Spread Peak Rail Demand Using Pre-Peak Free Fares. Graham Currie.
22 the new, free fare accounting for as much as 3% of peak train capacity. In the medium term over 1 to 2 years take up of the early-bird special grew by 1.7%, while overall rail travel declined by 1.2%. Pushed out over many years, such growth would be substantial and offer significant help in easing over capacity during the peak hour. Data from the project also suggests that longer distance travellers are more likely to change their travel patters and take advantage of the cheaper ticket. Transposing this experience to the TTC would have a dramatic effect, as an overwhelming majority of its growth is long distance riders. When forecast out over multiple years the financial impacts for the Melbourne transit agency are positive (where the loss in revenue is less than buying new trains) or, in a worst case scenario, neutral (where the loss in revenue is equal to the cost of new trains). The difference in the two forecasts depends on how many travellers take up the early bird special over the next 30 years. Moving even a small number of passengers from the peak travel periods saved the agency millions of dollars each year by not having to purchase new trains and shifted enough riders out of the peak morning commute to handle capacity issues. Transit officials in Melbourne called the program a success. The TTC would enjoy far higher economic benefits, as it is proposing building an entirely new subway line to handle peak demand, not just adding new trains. We also propose offering free rides in the hour immediately prior to the 8:00 a.m. peak commute, whereas in Melbourne they offered free rides only between 6:00 a.m. and 7:00 a.m. In Singapore, 14 transit officials offered free rides before 7:45 a.m. to those commuters headed to 16 different subway stations in the downtown core. Those travellers arriving between 7:45 a.m. and 8:00 a.m. would receive 50 cents off of their fare. The transit agency in Singapore also launched a trial offering riders points on their travel cards if they travelled outside of the busy 7:30 to 8:30 morning commute. Those points could be redeemed for prizes and cash rewards. Those who commuted outside of the morning rush received additional bonus points compared to riders in the peak period. One person involved 15 in the program said that 10% of those participating in the trial had shifted their commutes away from rush hour. In the U.S., both the Denver, Colorado, and Trenton, New Jersey, transit systems have offered free bus fares to entice riders to shift their commute to off-peak hours. In both 14 Travel Early, Travel Free on the MRT, 15 Gaming the System to Beat Rush-Hour Traffic, Wall Street Journal,
23 cases the transit agencies were able to reduce peak ridership as a percentage of total ridership from 50% to 30% and 68% and 55%, respectively 16. Section V: HOW MUCH WILL IT COST? Consumer Policy Institute (CPI) examined the cost to the TTC of offering discounted or free rides to commuters traveling outside of the peak morning commute. We did so by looking at the cost of lost revenue to the TTC between now and 2031 from lower fares and compared that to the cost of building the DRL. We present five different scenarios: a $1, $2, $2.70 and $3 discount to all travelers on the Yonge-University and Bloor- Danforth subway lines from when the subway system opens at 6:00 a.m. until the peak morning commute at 8:00 a.m. All our figures are based on estimated transit ridership, as the TTC does offer detailed data and did not respond to our requests. Our fifth and preferred scenario involves a more targeted approach that will be possible once an electronic fare system is in place. Under this solution, we propose offering a $3 discount to riders travelling to the downtown core, while charging riders going in the opposite direction the full fare. In the other $3 discount scenario (in Figure 15) we assume that all riders traveling on the subway regardless of where they are going prior to the peak commute would enjoy a discount. With an electronic fare system that discount can be better targeted just to those riders traveling to the downtown core. We also forecast a $2.70 and $3 fare discount as they present the full cost of a ride using tokens or paying cash, respectively. The table below presents the results from our calculations (See the Appendix for a more detailed discussion of how we reached our conclusions.) In the most extreme scenario opening the gates to the Yonge-University and Bloor- Danforth subway lines for the two hours prior to the peak hour and a sustained change in behaviour by riders the cost to the TTC due to lost revenue over the reference period ( ) is just more than half of the cost of the shortest version of the DRL. If we assume that 1.5% of all peak riders annually shift their commute into the shoulder period or into other off-peak times, then ridership on the crowded Yonge subway line will be about 28,500 by 2031, or nearly identical to today s ridership. With the TTC s new signalling system and longer trains which could increase capacity to 38,000 riders per hour the Yonge subway line would be well under capacity by Transit Pricing and Fares Traveler Response to Transportation System Changes. Brian E. McCollom and Richard H. Pratt.
24 Figure 15: Cost of Offering Discounted Rides in Off-Peak Hours Discount Cost assuming 1% of peak riders shift commute annually from 2014 to 2031 $1 $574,640,848 $592,515,975 Cost assuming 1.5% of peak riders shift commute annually from 2014 to 2031 $2 $1,149,281,697 $1,185,031,949 $2.70 $1,551,530,290 $1,599,793,131 $3 $1,723,922,545 $1,777,547,924 CPI preferred $1,516,944,555 $1,567,872,172 solution 17 From the table above, CPI estimates that the cost to the TTC of implementing reduced fares for the two hours before the peak travel period would be significantly less than building even the smallest version of the DRL, which would cost at least $3 billion. In the table below, we present the savings to the TTC from each of the above options. Even with the most aggressive plan offering free rides on all cash fares on the subway for two hours the TTC would still be saving more than $1.2 billion over the next 17 years. 17 Under our preferred solution, only those riders traveling to the downtown core would enjoy a discounted fare.
25 Figure 16: Savings From Off-Peak Discounts Compared to DRL Savings from DRL East via King Street assuming 1% of peak riders shift commute annually from 2014 to 2031 $1 $ 2,425,359,152 $ 2,407,484,025 Savings from DRL East via King Street assuming 1.5% of peak riders shift commute annually from 2014 to 2031 $2 $ 1,850,718,303 $ 1,814,968,051 $2.70 $ 1,448,469,710 $ 1,400,206,869 $3 $ 1,276,077,455 $ 1,222,452,076 CPI preferred solution $1,483,055,445 $1,432,127,828 Section VI: CONCLUSION Our analysis shows that the TTC and Toronto fare and tax payers and to a lesser extent Queens Park and Ottawa could save billions of dollars by tackling the current and future capacity issues on the Yonge subway line and Bloor-Yonge station by modifying fares. Changing the fare structure has the added benefit of avoiding building an expensive subway through a dense area in the country s largest city an endeavour that is risky and could be riddled with cost overruns. Consumer Policy Institute understands that offering free rides to TTC commuters may seem far-fetched and unlikely. We used the most extreme example to illustrate the expense of building a new subway compared to the readily available cheaper alternatives to alleviating congestion during the morning commute. We believe that steeply discounted fares would be more than enough to shift small percentages of riders out of the peak morning commute over the next decade and beyond. The number of riders switching their commute may seem small at first, but pushed out over many years offer a real solution to the TTC s capacity concerns. And while those reduced fares will have a negative, short-term impact on the TTC s operating budget, they will have a positive impact on the TTC s long-term capital and operating budgets. The TTC could eventually use dynamic and distance-based fares (among other policies) as a way to sustain its operating costs. The DRL would consistently run under-capacity, draining the transit agency s finances. The politicians would then have to make up losses from fare payers and taxpayers. If fares rise high enough, the transit system could go into a death spiral in which fare increases lead to reduced ridership and revenues. Taxpayers eventually have to foot the bill. Our solution avoids this problem.
26
27 APPENDIX: Consumer Policy Institute made a number of assumptions in calculating the potential savings from scrapping the DRL and, instead, offering discounted fares to travelers outside of the peak morning commute. First, we estimate the growth in subway commuters using the TTC s own projections laid out in its study on the DRL. We then make assumptions whether 1%, 1.5% and 5% of riders each year change their commute to outside of the peak hour, yet continue to maintain the increase in peak ridership assumptions made by the TTC. We eliminated the 5% option, as empirical research from other transit agencies showed that was unlikely to occur. We then take the difference between what the TTC forecasts for ridership and the number of riders we expect will change their commute and multiply this by 251 (for the number of business days each year) and the discount offered to those riders now commuting off-peak. For example, if the TTC expected peak hour ridership on the Yonge subway line going south into the downtown core to be 28,792 in 2015, we would then assume 1% of riders would switch their commute if offered a $1 discount. This means that only 28,551 commuters would travel on the Yonge subway line going south during the morning commute. We then take the loss in revenue from those riders switching each day and multiply it by 251. We then do this for all of the other years going out to But because the discount would be applied to all riders on the Yonge-University and Bloor-Danforth lines, we have to do a similar calculation for all riders that would switch their commute. In our preferred scenario we only offer the discount to riders going into the downtown core during the peak morning commute (similar to what Singapore does). Riders travelling in opposite directions would still pay the full fare. We then also have to consider the riders already commuting prior to the peak morning commute and the loss in revenue that this discount would have on the TTC. Because the TTC doesn t offer any of its data and didn t answer requests from Consumer Policy Institute we assume that ridership for the two hours prior to the peak morning commute is the same as that during the morning commute. We should stress that our forecasts are made on assumptions of ridership. The TTC does not offer detailed data on its ridership including data such as how many riders board the subway each hour at individual stations. We had to estimate the ridership on the subway from the limited TTC data that is available. For example, ridership going north on the Yonge subway line is taken from the TTC s study on the DRL, but ridership going north on the University line to Downsview station is not available. We assume ridership on both lines is the same knowing that they are not but we feel that this overestimates the cost to the TTC and allows for greater future ridership on the University line that is likely to occur because of the current extension to Vaughan. This means the savings could be higher than we estimate.
28 We also assume a discount in fares and ignore the potential for fares to increase. For example, we assume a $3 discount in fares would actually offer a free rider to commuters who pay cash. But we don t consider any fare increases between now and 2031 even though that is likely. If fare increases do occur over that time period, then the $3 discount would no longer offer a free ride. To make our calculations simple, we only estimated the cost of the discount and avoided trying to time them to some future fare increases. We also don t inflation adjust our savings over the forecast period. We didn t do so because we feel that the discounts can also be pegged to inflation and so would have limited impact on our study. You can download the full excel model here.
Appendix 1 Transit Network Analysis
 Appendix 1 Transit Network Analysis APPENDIX 1 TRANSIT NETWORK ANALYSIS The purpose of this appendix is to provide an update on the transit network analysis as it pertains to: i. SmartTrack ii. Scarborough
Standing Committee on Policy and Strategic Priorities
 POLICY REPORT Report Date: January 15, 2019 Contact: Steve Brown Contact No.: 604.873.9733 RTS No.: 12955 VanRIMS No.: 08-2000-20 Meeting Date: January 30, 2019 TO: FROM: SUBJECT: Standing Committee on
SMARTTRACK RIDERSHIP ANALYSIS
 SMARTTRACK RIDERSHIP ANALYSIS EXECUTIVE SUMMARY Prepared for the City Manager, City of Toronto by: Eric J. Miller, Ph.D. Professor, Department of Civil Engineering Director, Transportation Research Institute
Cutting Canada s Slowest Rush Hour with Public Transportation
 Cutting Canada s Slowest Rush Hour with Public Transportation Denny Yip September 30 th, 2011 1. Introduction Transportation is a key issue in Canada. In the province of Ontario, the Greater Toronto Area
4 Ridership Growth Study
 Clause 4 in Report No. 15 of Committee of the Whole was adopted, without amendment, by the Council of The Regional Municipality of York at its meeting held on November 16, 2017. 4 Ridership Growth Study
Building a Toronto that Moves
 Building a Toronto that Moves Image courtesy of the City of Toronto Setting Election Priorities for Walking, Cycling & Public Transit Toronto is a fast-paced, dynamic city. It s a city that moves except
Improving Mobility Without Building More Lanes
 Improving Mobility Without Building More Lanes By Mike Salisbury and Will Toor July 2017 Copyright 2017 by Southwest Energy Efficiency Project. All rights reserved. Photo: Courtesy of the Denver Post Anyone
1.221J/11.527J/ESD.201J TRANSPORTATION SYSTEMS FALL 2003 FINAL EXAMINATION. 1. Open-book and open-notes, calculators are fine -- no laptops.
 1.221J/11.527J/ESD.201J TRANSPORTATION SYSTEMS FALL 2003 FINAL EXAMINATION Instructions: PROFESSOR JOSEPH M. SUSSMAN (LECTURER) 1. Open-book and open-notes, calculators are fine -- no laptops. 2. The exam
June 2015 REGIONAL TRANSPORTATION SNAPSHOT
 June 2015 REGIONAL TRANSPORTATION SNAPSHOT THE REGION Who are we? The Greater Toronto and Hamilton Area (GTHA), consisting of Durham Region, Halton Region, the City of Hamilton, Peel Region, the City of
Purpose and Need. Chapter Introduction. 2.2 Project Purpose and Need Project Purpose Project Need
 Chapter 2 Purpose and Need 2.1 Introduction The El Camino Real Bus Rapid Transit (BRT) Project (Project) would make transit and other transportation improvements along a 17.6-mile segment of the El Camino
1999 On-Board Sacramento Regional Transit District Survey
 SACOG-00-009 1999 On-Board Sacramento Regional Transit District Survey June 2000 Sacramento Area Council of Governments 1999 On-Board Sacramento Regional Transit District Survey June 2000 Table of Contents
TORONTO TRANSIT COMMISSION REPORT NO.
 Form Revised: February 2005 TORONTO TRANSIT COMMISSION REPORT NO. MEETING DATE: May 30, 2012 SUBJECT: ADDITIONAL OPERATING RESOURCE REQUIREMENTS TO MEET INCREASING TTC RIDERSHIP ACTION ITEM RECOMMENDATIONS
TRANSPORTATION TOMORROW SURVEY
 Clause No. 15 in Report No. 7 of was adopted, without amendment, by the Council of The Regional Municipality of York at its meeting held on April 17, 2014. 15 2011 TRANSPORTATION TOMORROW SURVEY recommends
Transportation Master Plan Advisory Task Force
 Transportation Master Plan Advisory Task Force Network Alternatives & Phasing Strategy February 2016 BACKGROUND Table of Contents BACKGROUND Purpose & Introduction 2 Linking the TMP to Key Council Approved
WELCOME. City of Greater Sudbury. Transportation Demand Management Plan
 WELCOME City of Greater Sudbury Transportation Demand Management Plan Public Consultation Session St. Andrew s Place, Activity Hall 111 Larch Street Wednesday September 13, 2017 6:00 to 8:00 pm Welcome
Regional Transportation Needs Within Southeastern Wisconsin
 Regional Transportation Needs Within Southeastern Wisconsin #118274 May 24, 2006 1 Introduction The Southeastern Wisconsin Regional Planning Commission (SEWRPC) is the official areawide planning agency
STAFF REPORT ACTION REQUIRED
 STAFF REPORT ACTION REQUIRED 2016 Ridership Update Date: March 23, 2016 To: From: TTC Board Chief Executive Officer Summary This report provides an update of TTC ridership results to the end of February
2 BOLTON COMMUTER RAIL SERVICE FEASIBILITY STUDY
 2 BOLTON COMMUTER RAIL SERVICE FEASIBILITY STUDY The Planning and Economic Development Committee recommends the adoption of the recommendations contained in the following report dated April 15, 2011 from
Mobility and Congestion
 Technical Memorandum Mobility and Congestion Prepared for: Prepared by: September 25, 2013 1 Table of Contents 1. Introduction... 1 2. Congestion Forecasting Process... 1 2.1 Mobility and Congestion Terms...
MEETING DATE: DECEMBER 9, SUBJECT: Use Of Cameras To Enforce Transit Lanes RECOMMENDATIONS. It is recommended that the Commission:
 MEETING DATE: DECEMBER 9, 2002 SUBJECT: Use Of Cameras To Enforce Transit Lanes RECOMMENDATIONS It is recommended that the Commission: 1. Receive this report for information, noting that; several major
2.2 TRANSIT VISION 2040 FROM VISION TO ACTION. Emphasize transit priority solutions STRATEGIC DIRECTION
 TRANSIT VISION 2040 FROM VISION TO ACTION TRANSIT VISION 2040 defines a future in which public transit maximizes its contribution to quality of life with benefits that support a vibrant and equitable society,
BILLIONS FOR BUSES. Draft position of the Bus Riders Union on the proposed Richmond / Airport / Vancouver Skytrain expansion
 BILLIONS FOR BUSES Draft position of the Bus Riders Union on the proposed Richmond / Airport / Vancouver Skytrain expansion Bus Riders Union Planning Committee February 11, 2003 busridersnews@netscape.net
Calgary Transit Route 302 Southeast BRT Year One Review June
 Calgary Transit Route 302 Southeast BRT Year One Review 2011 June Calgary Transit Route 302 Southeast BRT: Year One Review 2011 April Table of Contents 1.0 Executive Summary... 1 2.0 Introduction... 3
Public Consultation Centre For. Transportation Master Plan Update. Information Package
 Public Consultation Centre For Transportation Master Plan Update Information Package Date Location Hours Tuesday, September 12, 2017 Wednesday, September 13, 2017 Tuesday, September 19, 2017 Cambridge
Ridership Growth Strategy. Presentation to the board & beyond 1
 Ridership Growth Strategy Presentation to the board 2018 2022 & beyond 1 Objectives of the Ridership Growth Strategy 1 Retain 2 Increase 3 Attract current customers transit rides per current customer new
Board Strategy Day. January 25, 2018
 Board Strategy Day January 25, 2018 Corporate Plan 2018-2022 & beyond Presentation to the board 2018 2022 & beyond 2 Building on the last five-year plan 2013 2017 21% reduction in subway delay minutes
Here is an outline of this presentation.
 The BIKES ONboard project started in early 2008. Shirley Johnson leads the project as a volunteer. Our objective is to work with Caltrain to improve its onboard bicycle service. There are many volunteers
WHAT IFS: Over the course of
 WHAT IFS: Over the course of the 422plus Project certain questions have arisen multiple times at meetings, briefings and on-line at the website. Most of these questions start with WHAT IF. WHAT IF vehicle
Transportation Assessment
 Transportation Assessment Midtown Open House February 10, 2018 Overview Midtown in Focus Overview & Purpose of Today Transportation Assessment overview Summary of Transportation work to date Review & Analysis
RIVER CROSSINGS: EAST OF SILVERTOWN CROSSINGS
 TRANSPORT FOR LONDON RIVER CROSSINGS: EAST OF SILVERTOWN CROSSINGS SUPPORTING TECHNICAL DOCUMENTATION TRAFFIC IMPACT REPORT Neil Georgeson July 2014 This report examines the traffic impacts that potential
Guidelines for Providing Access to Public Transportation Stations APPENDIX C TRANSIT STATION ACCESS PLANNING TOOL INSTRUCTIONS
 APPENDIX C TRANSIT STATION ACCESS PLANNING TOOL INSTRUCTIONS Transit Station Access Planning Tool Instructions Page C-1 Revised Final Report September 2011 TRANSIT STATION ACCESS PLANNING TOOL INSTRUCTIONS
ROUTES 55 / 42 / 676 BUS RAPID TRANSIT LOCALLY PREFERRED ALTERNATIVE
 ROUTES 55 / 42 / 676 BUS RAPID TRANSIT LOCALLY PREFERRED ALTERNATIVE April, 2012 1 INTRODUCTION The need for transit service improvements in the Routes 42/55/676 corridor was identified during the Southern
VOLUME 5 Technology and Option Evaluation
 VICTORIA REGIONAL RAPID TRANSIT Victoria / West Shore Link VOLUME 5 Technology and Option Evaluation August 2011 Prepared for BC Transit by SNC-Lavalin Inc McElhanney Consulting Services Ltd Errata 1.
Congestion Evaluation Best Practices
 Congestion Evaluation Best Practices Todd Litman Victoria Transport Policy Institute Presented International Transportation and Economic Development Conference 10 April 2014 Congestion Indicators Indicator
Coolest Cities Results Summary
 Coolest Cities Results Summary About Coolest Cities Canada s six largest urban areas provide homes and jobs for almost 15 million people, nearly half of our population. Transporting these citizens to and
Konstantin Glukhenkiy Economic Affairs Officer
 Konstantin Glukhenkiy Economic Affairs Officer Rapid growth of urban areas Very rapid increase in motorisation Substantial increases in traffic congestion Relative decline of public transport usage and
TORONTO TRANSIT COMMISSION REPORT NO.
 Revised: March/13 TORONTO TRANSIT COMMISSION REPORT NO. MEETING DATE: January 28, 2014 SUBJECT: IMPROVING PEDESTRIAN SAFETY AND CUSTOMER JOURNEY TIMES: TRANSIT STOPS ACTION ITEM RECOMMENDATIONS It is recommended
Report Overview Policy versus Performance: Directions for North Carolina s Largest Transit Systems
 For Truth. For Freedom. For the Future of North Carolina Report Overview Policy versus Performance: Directions for North Carolina s Largest Transit Systems By David T. Hartgen Professor of Transportation
REPORT. RECOMMENDATION: 1. That the report on Pilot Results Free Transit for Seniors, dated October 25, 2012, from Oakville Transit be received.
 REPORT MEETING DATE: NOVEMBER 15, 2012 FROM: Oakville Transit DATE: October 25, 2012 SUBJECT: Pilot Results - Free Transit for Seniors LOCATION: Town Wide WARD: Town wide Page 1 RECOMMENDATION: 1. That
WELCOME TO OPEN HOUSE # 1 June 14, 2017
 Langstaff Road Weston Road to Highway 7 Class Environmental Assessment Study WELCOME TO OPEN HOUSE # 1 June 14, 2017 Please sign in and join our mailing list Purpose of Open House #1 & Study Area York
ANNEX1 The investment required to achieve the Government s ambition to double cycling activity by 2025
 ANNEX1 The investment required to achieve the Government s ambition to double cycling activity by 2025 May 2016 About Sustrans Sustrans makes smarter travel choices possible, desirable and inevitable.
Bus Riders of Saskatoon Meeting with City of Saskatoon Utility Services Department October 23, :30pm 2:30pm th Street West, Saskatoon
 Bus Riders of Saskatoon Meeting with City of Saskatoon Utility Services Department October 23, 2014 1:30pm 2:30pm 301 24 th Street West, Saskatoon Bus Riders of Saskatoon Members: Marianne, Chief and Sarina
Benefits for the Bronx, Brooklyn, Queens and Staten Island
 Congestion Pricing for New York: Benefits for the Bronx, Brooklyn, and Staten Island Prepared for the Coalition for Traffic Relief April 007 Schaller Consulting 94 Windsor Place, Brooklyn, NY (78) 768-3487
TOWARDS A BIKE-FRIENDLY CANADA A National Cycling Strategy Overview
 TOWARDS A BIKE-FRIENDLY CANADA A National Cycling Strategy Overview NationalCyclingStrategFrameworkv3.indd 1 Potential for this modal shift can be found in municipalities of all sizes, in every population
2. Transportation in Ottawa Today and Tomorrow
 2. Transportation in Ottawa Today and Tomorrow 2.1 Transportation System Overview The City. The City of Ottawa is the largest municipality in the National Capital Region (NCR). Urban development covers
Tulsa Metropolitan Area LONG RANGE TRANSPORTATION PLAN
 Tulsa Metropolitan Area LONG RANGE TRANSPORTATION PLAN Indian Nations Council of Governments August 2005 CONTACTING INCOG In developing the Destination 2030 Long Range Transportation Plan, INCOG s Transportation
Title VI Fare Change Equity Analysis
 Title VI Fare Change Equity Analysis Evaluation Report Submitted to Dallas Area Rapid Transit Submitted by TranSystems June 2012 Title VI Fare Change Equity Analysis Introduction DART has proposed a schedule
Transit Ridership - Why the Decline and How to Increase. Hosted by the. Virginia Transit Association
 Transit Ridership - Why the Decline and How to Increase Hosted by the Virginia Transit Association Virginia Transit Association 1108 East Main Street, Suite 1108 Richmond, VA 23219 804.643.1166 www.vatransit.com
TRANSIT SIGNAL PRIORITY The Toronto Experience
 TRANSIT SIGNAL PRIORITY The Toronto Experience July 27, 2004 July 27, 2004 1 Warning This presentation contains graphic images depicting serious violations to the coordination of traffic signals and may
6 Screen 3 Analysis and Results
 6 Screen 3 Analysis and Results Introduction This chapter documents the results of the Screen 3 (final) evaluation and screening process. This chapter contains the following elements: Description of the
Congestion Management in Singapore. Assoc Prof Anthony TH CHIN Department of Economics National University of Singapore
 Congestion Management in Singapore Assoc Prof Anthony TH CHIN Department of Economics National University of Singapore anthonychin@nus.edu.sg Introduction 2 Introduction and What is Traffic Congestion?
TRANSIT RIDERSHIP IMPROVEMENT PROGRAM CAPITAL PROJECTS OPERATING PLANS - NEXT NETWORK TRANSIT INFORMATION TECHNOLOGY
 TRANSIT RIDERSHIP IMPROVEMENT PROGRAM CAPITAL PROJECTS OPERATING PLANS - NEXT NETWORK TRANSIT INFORMATION TECHNOLOGY VTA S NEXT NETWORK CONNECT TO BART STATIONS INCREASE RIDERSHIP IMPROVE FAREBOX RECOVERY
Sketch Level Assessment. of Traffic Issues. for the Fluor Daniel I-495 HOT Lane Proposal. Ronald F. Kirby
 Sketch Level Assessment of Traffic Issues for the Fluor Daniel I-495 HOT Lane Proposal Ronald F. Kirby Director of Transportation Planning National Capital Region Transportation Planning Board (TPB) Metropolitan
SMARTTRACK RIDERSHIP ANALYSIS
 SMARTTRACK RIDERSHIP ANALYSIS PROJECT FINAL REPORT Prepared for the City Manager, City of Toronto by: Eric J. Miller, Ph.D. Professor, Department of Civil Engineering Director, Transportation Research
EXECUTIVE SUMMARY OF CALEDON TRANSPORTATION NEEDS STUDY
 EXECUTIVE SUMMARY OF CALEDON TRANSPORTATION NEEDS STUDY The Caledon Transportation Needs Study has been undertaken as a joint project by the Town of Caledon and the Region of Peel to determine the existing
Frequently Asked Questions (FAQ)
") Frequently Asked s (FAQ) Study Process... 2 Rapid Transit Service and Operations... 5 Public Consultation... 8 Business Impacts... 8 Design and Property Impacts... 9 Construction Impacts...12 Traffic,
Frequently Asked s (FAQ) Study Process... 2 Rapid Transit Service and Operations... 5 Public Consultation... 8 Business Impacts... 8 Design and Property Impacts... 9 Construction Impacts...12 Traffic,
Sustainable Campus Transportation in the United States
 Sustainable Campus Transportation in the United States University of Idaho Sustainable Transportation Conference September 2005 Will Toor, Fellow, University of Colorado Environmental Center ; Commissioner,
Executive Summary BEYOND THE B-LINE: RAPID TRANSIT LINE PHASE II - COMMERCIAL DRIVE WEST. Final Draft December 13, Appendix B BROADWAY/LOUGHEED
 BEYOND THE B-LINE: BROADWAY/LOUGHEED RAPID TRANSIT LINE PHASE II - COMMERCIAL DRIVE WEST Appendix B Executive Summary Final Draft December 13, 1999 UMA Lloyd Lindley Davidson Yuen Simpson Architects BROADWAY/LOUGHEED
ORANGE COUNTY TRANSPORTATION AUTHORITY. Metrolink Ridership and Revenue Quarterly Report. Staff Report
 ORANGE COUNTY TRANSPORTATION AUTHORITY Metrolink Ridership and Revenue Quarterly Report Staff Report March 8, 2012 To: From: Subject: Transit Committee Will Kempton, Chief Executive Officer Metrolink Ridership
PARKING REVENUE MODEL AN INFORMATIONAL REPORT. Nitin P. Deshpande Jacobs. Errol K. Stevens Regional Transport District - Denver
 PARKING REVENUE MODEL AN INFORMATIONAL REPORT Nitin P. Deshpande Jacobs Errol K. Stevens Regional Transport District - Denver SUMMARY Denver, Colorado is the seventh 1 most congested large urban area (over
York Region Population and Employment Growth
 March 1, 2016 1 York Region Population and Employment Growth York Region needs to comply with The Provincial Growth Plan and new forecasts introduced to 2036 and 2041 2 Regional Official Plan Review York
PERFORMANCE ANALYSIS of The Draft 2015 CLRP
 Item 9 PERFORMANCE ANALYSIS of The Draft CLRP Presentation to the Transportation Planning Board September 16, CLRP Performance Analysis 1 What is the Long-Range Transportation Plan (CLRP)? The CLRP identifies
KING STREET TRANSIT PILOT
 STREET TRANSIT PILOT Update toronto.ca/kingstreetpilot #kingstreetpilot HIGHLIGHTS PREVIOUS HIGHLIGHTS TRANSIT RELIABILITY TRANSIT TRAVEL TIMES 85% of streetcars arriving within 4 minutes westbound during
2011 Transportation Tomorrow Survey. Data Presentation
 2011 Transportation Tomorrow Survey Data Presentation Participating Agencies Conduct of the Survey Supporting Agencies of TTS Agency 1986 1991 1996 2001 2006 2011 Mininstry of Transportation, Ontario Y
TRANSPORTATION IMPACT STUDY
 Dundas MEP Developments Inc. City of Toronto 219 and 231 Dundas Street East, Proposed Mixed-Use Development TRANSPORTATION IMPACT STUDY 9782/2 April 216 LEA Consulting Ltd. Consulting Engineers & Planners
November 14, Dulles To DC Loop Public-Private Partnership Proposal. Executive Summary
 November 14, 2005 Dulles To DC Loop Public-Private Partnership Proposal Executive Summary Virginia Mobility Associates LLC, a newly established single purpose entity, proposes to privately finance the
WEST AND SOUTH WEST RING ROAD DOWNSTREAM TRAFFIC IMPACTS
 Page 1 of 9 EXECUTIVE SUMMARY Alberta Transportation ( AT ) is preparing to construct the final sections of the Calgary Ring Road. This includes the South West Ring Road ( SWRR ) (from Lott Creek Blvd
Reversible Elevated Express Lanes. A Solution for Urban Traffic Congestion
 Lee Roy Selmon Crosstown Expressway Reversible Elevated Express Lanes A Solution for Urban Traffic Congestion Martin Stone, Ph.D., AICP Director of Planning Tampa-Hillsborough Expressway Authority Pensacola
INTRODUCTION DISCUSSION
 INTRODUCTION A study released by the Toronto Board of Trade reports that Toronto s traffic congestion has grown into a serious and costly problem. It states that Toronto commuters spend about 80 minutes
Typical Rush Hour Commute. PennyforTransportation.com
 Typical Rush Hour Commute In the News Overview of the Plan Collaborative plan with projects in every community Prioritizing connectivity and congestion relief Dedicated transportation-specific funding;
RIDERSHIP PREDICTION
 RIDERSHIP PREDICTION Outline 1. Introduction: route ridership prediction needs and issues. 2. Alternative approaches to route ridership prediction. Professional judgement Survey-based methods Cross-sectional
WHITE PAPER: TRANSIT SERVICE FOR SOUTH SHAGANAPPI
 9/27/2012 TRANSIT PLANNING WHITE PAPER: TRANSIT SERVICE FOR SOUTH SHAGANAPPI 2012 Calgary Transit 1 Table of Contents Purpose... 3 Area of Change... 3 Background... 3 Access to destinations... 5 Connecting
Where We Live and Work Today
 San Diego Forward: The 2019-2050 Regional Plan Network Concepts Transportation Committee Item 4 October 19, 2018 Where We Live and Work Today 2018 2 2019 Regional Plan Transportation Committee Item 4 October
Appendix T 1: Additional Supporting Data
 Appendix T 1: Additional Supporting Data Project Delivery Delays with the implementation of the 2000 TIP became apparent early in the decade. In response to direction among policy officials, ARC began
RE-CYCLING A CITY: EXAMINING THE GROWTH OF CYCLING IN DUBLIN
 Proceedings ITRN2013 5-6th September, Caulfield: Re-cycling a city: Examining the growth of cycling in Dublin RE-CYCLING A CITY: EXAMINING THE GROWTH OF CYCLING IN DUBLIN Brian Caulfield Abstract In the
MORE CONNECTIONS. Redesigning routes for the future of transit in Milwaukee County.
 What is MCTS NEXT? FASTER SERVICE MORE CONNECTIONS INCREASED ACCESSIBILITY Redesigning routes for the future of transit in Milwaukee County. MCTS NEXT is a new way of looking at transit. We re examining
Climate Change Action Plan: Transportation Sector Discussion Paper: Cycling
 Climate Change Action Plan: Transportation Sector Discussion Paper: Cycling ontario.ca/climatechange Contents 1. Minister of Transportation s message... 3 2. Introduction... 5 3. Sector Overview and Support
Submission to Metrolinx on Eglinton LRT - East End. Response to December 2012 Public Meeting
 Submission to Metrolinx on Eglinton LRT - East End Project Response to December 2012 Public Meeting Prepared by: Cycle Toronto, cycleto.ca Authors: John Taranu, Michael Black January 21, 2013 1 Introduction
Moving Cambridge. City of Cambridge Transportation Master Plan Public Consultation Centre. March 7, :00 8:00 PM.
 City of Cambridge Transportation Master Plan Public Consultation Centre March 7, 2018 5:00 8:00 PM Region of Waterloo City of Cambridge Transportation Master Plan Public Consultation Centre March 7, 2018
Understanding Rail and Bus Ridership
 Finance Committee Information Item III-A October 12, 2017 Understanding Rail and Bus Ridership Washington Metropolitan Area Transit Authority Board Action/Information Summary Action Information MEAD Number:
Capital Bikeshare 2011 Member Survey Executive Summary
 Capital Bikeshare 2011 Member Survey Executive Summary Prepared by: LDA Consulting Washington, DC 20015 (202) 548-0205 June 14, 2012 EXECUTIVE SUMMARY Overview This report presents the results of the 2012
Downtown London Member Survey Regarding BRT. May 8, 2017
 Downtown London Member Survey Regarding BRT May 8, 2017 Table Of Contents 1 Description of the Research 3 Objectives 4 Methodology Profile of Respondents 5 6 2 Summary 9 3 Detailed Results Unaided Opinion
Economics of Highway Spending and Traffic Congestion. Todd Litman Victoria Transport Policy Institute Presented Strong Towns Webinar 3 February 2016
 Economics of Highway Spending and Traffic Congestion Todd Litman Victoria Transport Policy Institute Presented Strong Towns Webinar 3 February 2016 Motor Vehicle Travel is Peaking Annual Vehicle Mileage
Extracting Maximum Benefit from Parking Policy - 10 Years Experience in Perth, Australia. By Emmerson Richardson Sinclair Knight Merz
 Extracting Maximum Benefit from Parking Policy - 10 Years Experience in Perth, Australia By Emmerson Richardson Sinclair Knight Merz Snapshot of Perth > Metropolitan Area Population 1.7 million > 3.5 million
CITY OF KINGSTON INFORMATION REPORT TO ENVIRONMENT, INFRASTRUCTURE & TRANSPORTATION POLICIES COMMITTEE Report No.: EITP
 CITY OF KINGSTON INFORMATION REPORT TO ENVIRONMENT, INFRASTRUCTURE & TRANSPORTATION POLICIES COMMITTEE TO: FROM: RESOURCE STAFF: Chair and Members of Environment, Infrastructure & Transportation Policies
APPENDIX B.2 TABLE 2 CITY OF TORONTO PRELIMINARY DRAFT DEVELOPMENT-RELATED CAPITAL PROGRAM TRANSIT (BALANCE) Grants/ Subsidies/Other Recoveries
 Grants/ Subsidies/Other Recoveries") PRELIMINARY DRAFT DEVELOPMENTRELATED CAPITAL PROGRAM Description 0 Related s 2.0 2.1 STREETCAR RELATED INFRASTRUCTURE 2.1.1 Surface Track 2.1.1.1 King/Queen/Roncesvalles Modifications Subtotal Surface
PRELIMINARY DRAFT DEVELOPMENTRELATED CAPITAL PROGRAM Description 0 Related s 2.0 2.1 STREETCAR RELATED INFRASTRUCTURE 2.1.1 Surface Track 2.1.1.1 King/Queen/Roncesvalles Modifications Subtotal Surface
BUILDING THE CASE FOR TRAVEL OPTIONS IN WASHING TON COUNTY. Image: Steve Morgan. Image: Steve Morgan
 BUILDING THE CASE FOR TRAVEL OPTIONS IN WASHING TON COUNTY Image: Steve Morgan Image: Steve Morgan Image: TriMet Image: TriMet WHAT ARE TRAVEL OPTIONS PROGRAMS? Travel options programs encourage residents,
Corporate. Report COUNCIL DATE: June 26, 2006 NO: C012 COUNCIL-IN-COMMITTEE. TO: Mayor & Council DATE: June 22, 2006
 Corporate NO: C012 Report COUNCIL DATE: June 26, 2006 COUNCIL-IN-COMMITTEE TO: Mayor & Council DATE: June 22, 2006 FROM: General Manager, Engineering FILE: 0410-20(MoT/Gate) SUBJECT: Surrey Response on
TRANSPORT CHICAGO: STRATEGIC PUBLIC TRANSIT BUS RELIABILITY IMPROVEMENTS
 TRANSPORT CHICAGO: STRATEGIC PUBLIC TRANSIT BUS RELIABILITY IMPROVEMENTS Presented by David VanderZee and Jack Chalabian Monday, June 02, 2014 Overview of Strategic Route Management CTA Strategic Route
Arterial Transitway Corridors Study. Ave
 Arterial Transitway Corridors Study Ave January 2012 Arterial Transitway Corridors Study Overview Corridor Features and Demographics 11 study corridors, 95 route miles 86,000 daily rides and half of existing
Life Transitions and Travel Behaviour Study. Job changes and home moves disrupt established commuting patterns
 Life Transitions and Travel Behaviour Study Evidence Summary 2 Drivers of change to commuting mode Job changes and home moves disrupt established commuting patterns This leaflet summarises new analysis
MOVEABLE BARRIER. Congestion Management Solutions
 MOVEABLE BARRIER Congestion Management Solutions 1 Portland area morning congestion (AM) 2 Portland area afternoon congestion (PM) 3 30 year planning - Portland Area 100% Growth over 30 years 4 Movable
Highway 217 Corridor Study. Phase I Overview Report
 Highway 217 Corridor Study Phase I Overview Report November 3, 24 BACKGROUND AND OVERVIEW Study purpose The Highway 217 Corridor Study is developing multi-modal transportation solutions for traffic problems
AMETI PANMURE: A SUSTAINABLE TRANSPORT SOLUTION - OR NOT? Phil Harrison, Opus International Consultants
 IPWEA Conference: 7 June 11 June 2015 Abstract AMETI PANMURE: A SUSTAINABLE TRANSPORT SOLUTION - OR NOT? Phil Harrison, Opus International Consultants The AMETI project is a package of multi-modal transport
Public Event 1 Community Workshops
 Public Event 1 Community Workshops Nov. 24 & Dec. 3, 2016 Welcome Workshop Purpose We re looking to you for ideas and insights to help guide future transportation infrastructure planning in the Park Lawn
The Case for New Trends in Travel
 The Case for New Trends in Travel The Future of Cities and Travel Steven E. Polzin, PhD. Center for urban Transportation Research University of South Florida October 19, 2008 Successful Strategies from
Markham Sports, Entertainment and Cultural Centre Transportation Overview
 Markham Sports, Entertainment and Cultural Centre Transportation Overview ARENA LOCATION 2 3 TRANSPORTATION VISION IN MARKHAM On April 12, 2011, Markham Council adopted a long-term Transportation Vision
Cities Connect. Cities Connect! How Urbanity Supports Social Inclusion
 Cities Connect! How Urbanity Supports Social Inclusion Todd Litman Victoria Transport Policy Institute Metropolis Toronto, Canada - 14 June 2006 Cities Connect People with people. People with jobs. People
Travel Patterns and Characteristics
 DRAFT 2006 Transportation Fact Book SECTION 4 Travel Patterns and Characteristics 43 2006 Transportation Fact Book DRAFT 44 DRAFT 2006 Transportation Fact Book Why do we conduct travel surveys? The main
NASHUA REGIONAL PLANNING COMMISSION REGIONAL BICYCLE AND PEDESTRIAN PLAN
 NASHUA REGIONAL PLANNING COMMISSION REGIONAL BICYCLE AND PEDESTRIAN PLAN June, 2005 Prepared by the Nashua Regional Planning Commission 2005 NRPC Regional Bicycle and Pedestrian Plan- JUNE 2005 ACKNOWLEDGEMENTS