Sustrans Scotland: walking and cycling outcomes
|
|
|
- Albert Griffith
- 6 years ago
- Views:
Transcription


1 Sustrans Scotland: walking and cycling outcomes Sustrans' Scottish Government Grant : First Interim Report September 2013
2 About Sustrans Sustrans makes smarter travel choices possible, desirable and inevitable. We re a leading UK charity enabling people to travel by foot, bike or public transport for more of the journeys we make every day. We work with families, communities, policy-makers and partner organisations so that people are able to choose healthier, cleaner and cheaper journeys, with better places and spaces to move through and live in. It s time we all began making smarter travel choices. Make your move and support Sustrans today. Sustrans Rosebery House 9 Haymarket Terrace Edinburgh EH12 5EZ Sustrans 2013 Registered Charity No (England and Wales) SC (Scotland) VAT Registration No Sustrans Scotland: walking and cycling outcomes Sustrans' Scottish Government Grant : First Interim Report September
3 Table of contents 1 Executive Summary... 1 Background Increased levels of walking and cycling Increased levels of purposeful trips made by walking and cycling Increased levels of attainment of recommended physical activity levels through walking and cycling Improved community cohesion and liveability Reductions in the incidence of KSI and perception of level of risk Economic effectiveness and benefits Introduction and Background Overview of Key Outcomes KPI 1: Increased levels of walking and cycling Overview Expansion of NCN Annual usage estimates - NCN Annual usage estimates - site specific Case study illustrating increases in walking and cycling Automatic cycle counters data KPI 2: Increased levels of purposeful trips made by walking and cycling Overview Breakdown of journey types on the NCN Cycling journeys on the NCN Number of purposeful trips at NCN and Community Links sites Case study illustrating change in purposeful trips on the NCN Case study illustrating change in purposeful trips at a Community Links scheme Case study illustrating usage from automatic cycle counter data Travel to school Hands Up Scotland I Bike KPI 3: Increased levels of attainment of recommended physical activity levels through walking and cycling Overview Physical activity levels - route user intercept surveys The impact of routes on increasing levels of physical activity KPI 4: Improved community cohesion and liveability Overview Street Design Household Survey Dores and Dunbeg Sustrans Scotland: walking and cycling outcomes Sustrans' Scottish Government Grant : First Interim Report September
4 8 KPI 5: Reductions in incidence of KSI, and perception of level of risk Overview Street Design Household survey Case studies illustrating perceptions of safety on new routes KPI 6: Economic benefits Benefit to cost ratio (BCR) of Community Links schemes Reductions in greenhouse gas emissions Jobs sustained through Community Links projects Tourism Estimated benefits of active travel on the NCN Next Steps Methodological description Monitoring tools Automatic cycle counters Route user intercept surveys Manual cordon counts Hands-Up survey Household Survey Community Engagement Survey Focus Group Approaches to analysis Expressing changes in levels of cycling activity recorded by automatic cycle counters Investigating diurnal variation in usage growth Estimation of total National Cycle Network usage Estimating usage at a single site using survey data Estimating the extent of usage attributable to specific classes of users Estimation of economic benefits Growth rates Wider economic benefits Maps Sustrans Scotland: walking and cycling outcomes Sustrans' Scottish Government Grant : First Interim Report September
5 1 Executive Summary Background Sustrans Scotland manages funds on behalf of Transport Scotland. These funds are mostly distributed as grants to partner organisations to deliver a variety of practical behaviour change interventions, both hard and soft measures on a 90/10 split, to help grow the numbers of people in Scotland travelling actively; particularly focused towards people making short trips by walking and cycling to help realise the vision of the Scottish Government s Cycling Action Plan for Scotland (CAPS), which is 10% of every day journeys by bike by Sustrans works in partnership with a variety of agencies in Scotland to demonstrate how travel behaviour in Scotland can change by delivering practical interventions to make the built environment more conducive to walking and cycling and engaging with people to present the options available to them to travel actively. Sustrans work is measured through six Key Performance Indicators (KPIs); as follows: 1. Increased levels of walking and cycling Using data from 26 counters on the NCN in Scotland there was an increase of 2.6% on average in cycling with an annual usage estimate (AUE) of 34.3m cycling trips in The overall annual usage estimate for all trips in 2012 is 62.5m. Community Links showed a positive picture with increases in walking and cycling between 2011 and 2012 seen at the six Community Links schemes which had follow up surveys in Increased levels of purposeful trips made by walking and cycling Results from the route user intercept surveys indicated that 24.0% of cyclists and 9.0% of pedestrians on the NCN were commuting in 2012; this compares to 16.8% of cyclists and 6.8% of pedestrians in Comparison of the Hands Up Scotland results over the last five years ( ) show that national results for primary, secondary, SEN and independent schools show a slight increase in pupils travelling by park and stride, with little change between levels of motorised and non-motorised travel. There was a 1.2 percentage point increase in pupils cycling to school every day and a 14.6 percentage point decrease in school children never cycling to school recorded in I Bike Hands Up surveys. 3. Increased levels of attainment of recommended physical activity levels through walking and cycling Results from the route user intercept surveys indicated that 60.5% of users on the NCN in 2012 completed 30 minutes or more of physical activity on five or more days in the past week, compared to 58.7% in The benefits of the NCN to increasing physical activity levels was demonstrated by a 16.0 percentage point increase in pedestrians on the NCN stating that the route has helped them increase their levels of physical activity between 2011 and
6 4. Improved community cohesion and liveability The results of household surveys for Street Design projects indicate a positive impact on residents. In Elgin 94% of respondents felt that the speed of traffic had been reduced and 83% felt that there was space in the street to socialise. Community Links projects have supported improved community cohesion and liveability with members of the community stating how they use the path and the impact on their community. In Dunbeg feedback included The children want to walk more; my child always asks to walk rather than go in the car and They (the children) take pride in it; they see it as their path. 5. Reductions in the incidence of KSI and perception of level of risk Perception of risk has been measured in Street Design projects and projects along the NCN. In the Street Design project in Elgin 94% of respondents felt that the street was pedestrian friendly compared to 50% before the project as did 73% of respondents in Katrine Crescent in Kirkcaldy compared to 50% before the project. Feedback from the community of Duror highlighted a change in the perception of safety, Before the path children had to be dropped at a safe place near to school and escorted; now they can walk safely along the new route. In Dores qualitative feedback indicated that the project had made residents feel safer Since living here for the last two years it s really dangerous; I ve seen fatalities on that road. Now the path s here we don t need to go anywhere near that road. 6. Economic effectiveness and benefits The present value of the mean annual benefit attributable to walking and cycling on the NCN is estimated to be 23.2 million for walking and 48.3 million for cycling trips using the World Health Organisation s Health Economic Assessment Tool (HEAT). The estimated indicative value of leisure cycling and cycle tourism is 168 million. Estimates of the benefit to cost ratios (BCR) at the Community Links sites analysed indicate a range of BCRs from 2:1 to 9.5:1. An estimated 17.3 FTE jobs have been sustained through the creation of the Community Links routes. Environmental benefits are shown through a reduction in greenhouse gases demonstrated at Community Links and NCN sites analysed with Stockingfield Junction, Glasgow showing a reduction of 28 tonnes of greenhouse gases. Based on average car emissions, the potential carbon dioxide saving of the journeys on the NCN was 115,009 tonnes. 2
7 2 Introduction and Background Sustrans Scotland manages funds on behalf of Transport Scotland. The bulk of these funds are distributed as grants to partner organisations to deliver a variety of practical interventions to help grow the numbers of people in Scotland making short trips by walking and cycling and particularly to help realise the vision of the Government s Cycling Action Plan for Scotland (CAPS), which is 10% of trips by bike by Sustrans works in partnership with a variety of agencies in Scotland to demonstrate how travel behaviour in Scotland can change by delivering practical interventions to make the built environment more conducive to walking and cycling and engaging with people to present the options available to them to travel actively. This report builds on previous annual reports of usage on the National Cycle Network (NCN) in Scotland, other statistics and reports gathered and published by Sustrans Scotland and Sustrans UK. Increased funding to Sustrans Scotland, made by the Scottish Government in 2011, with additional top-up funding in 2012, has allowed us to broaden our project range and gather more detailed research than previously. The work has been completed by Sustrans Research & Monitoring Unit (RMU), which is based in Newcastle upon Tyne. Unless stated otherwise, this report has been gathered and written by the RMU. The series of six Key Performance Indicators (KPIs), highlighted above, allow us to work towards delivering a set of Outcomes, detailed below. Our funding allows us to work in partnership with a variety of public and statutory agencies and communities to deliver practical projects that help demonstrate how Scotland can work towards a more active population, making more short trips by walking and cycling and helping deliver 10% of trips by bike by The funding that Sustrans Scotland agrees is matched by each recipient, thus doubling the annual budget of circa 10M to circa 20M a year. We believe that the figures set out in this report help to illustrate the effectiveness of the interventions we deliver and show how Scotland could change its transport culture towards increasing the number of people travelling actively. John Lauder, National Director, Sustrans Scotland, July 2013 Sustrans RMU has produced this first interim report for the funding period based on the monitoring we have carried out to date on the activities and programmes delivered by Sustrans Scotland. The monitoring data we gathered has highlighted some notable successes including an annual usage estimate on the NCN of 34.3m cycling trips in 2012 and an increase in usage at all six Community Links sites which had follow up surveys in Analysis on the data using the World Health Organisation s Health Economic Assessment Tool (HEAT) has enabled us to estimate the present value of the mean annual benefit attributable to walking and cycling on the NCN at 23.2 million for walking and 48.3 million for cycling trips. We will continue to monitor the programmes and activities using a wide range of monitoring tools and techniques to provide feedback on progress against the key outcomes. Andy Cope, Director Sustrans Research and Monitoring Unit, July
8 3 Overview of Key Outcomes Following the continuation of funding to Sustrans Scotland from the Sustainable Transport Team in Transport Scotland, Sustrans Research and Monitoring Unit (RMU) has been tasked with monitoring the progress Sustrans Scotland makes against the key walking and cycling outcomes agreed between Transport Scotland and Sustrans Scotland: Increased levels of walking and cycling Increased levels of purposeful trips made by walking and cycling Increased levels of attainment of recommended physical activity levels through walking and cycling Improved community cohesion and liveability Reductions in the incidence of KSI and perception of level of risk This report also expresses the economic effectiveness and the benefits derived from the investment in walking and cycling through the evidence presented. Progress against these outcomes is assessed using a range of indicators derived from a variety of data types. Data are collected from automatic cycle counters, route user intercept surveys (RUIS), manual counts, the annual Hands Up Scotland survey of school children, I Bike Hands Up surveys completed in schools participating in the I Bike programme and beneficiary surveys. More details on the specific methodologies are in Appendix One. This report is the first in a series of interim reports covering with a final report being produced at the end of the funding period in The most up to date data available is used in this report. However because of the timescales for project delivery and monitoring some of this data is from
9 4 KPI 1: Increased levels of walking and cycling RMU monitors a variety of infrastructure schemes such as the National Cycle Network (NCN) 1 and Community Links 2, to provide data on changes in levels of walking and cycling over time or following a specific intervention. To demonstrate increases in walking and cycling a variety of monitoring tools were utilised, primarily route user intercept surveys, manual counts and automatic cycle counters on the NCN and Community Links schemes. The methodology used to obtain the annual usage estimate (AUE) for Scotland overall and at specific sites is given in Appendix One. 4.1 Overview NCN 118.8km of additional NCN route were built/upgraded/redesignated between December 2010 and December 2012 on an individual site basis, 17 of 26 counter sites on the NCN in Scotland recorded an increase in counts between 2011 and 2012 across the 26 sites, the average change in counts of cyclists between 2011 and 2012 was +2.6% an increase in usage was recorded at four of seven locations on the NCN where repeat iterations of route user intercept surveys were performed Other schemes analysis of data collected from 20 counters located on routes outside the NCN, together with data from the 26 sites on the NCN indicates an average change of +2.1% between 2011 and 2012 increases in walking and cycling were seen at all Community Links schemes surveyed in Expansion of NCN Continued investment in the NCN in Scotland has led to an additional 118.8km of traffic-free (TF) and on-road (OR) route being built/upgraded/redesignated since December 2010 (Table 4-1). Table 4-1 : Scotland Open NCN in km Urban TF Urban OR Rural TF Rural OR Dec km 234.2km 515.2km 2,108.3km Dec km 237.2km 583.5km 2,132.7km Continued investment has led to improvements in access with 39.9% 3 of the Scottish population now living within 0.5 miles of the NCN, a 1.5 percentage point increase from 2010 figures. In addition to this, 13.6% of survey respondents on the NCN in 2012 reported that they had travelled under one mile to access the network compared to 6.9% in As the length of the NCN increases, 1 The NCN is a 2,000 mile signed, mapped and promoted network of routes throughout Scotland that aim to provide a range of active travel options from everyday commuting to longer, leisure adventures. 2 Community Links are links of 3 miles or less that allow people to make every day trips to the places they want to get to under their own steam. In the year 67 projects were delivered across Scotland making up the largest capital intervention Sustrans Scotland manages. Each Community link is a partnership initiative with grant recipients matching the funding award from Sustrans on a cash basis. Each project is governed by an MoU, which clarifies the technical standards, timescales and qualities of each project. 3 The figures are derived from OS postcode household data and ONS super output area population data (updated 2007). 5
10 availability of local routes is improved and could account for the increase in respondents travelling shorter distances to access the NCN. 4.3 Annual usage estimates - NCN In order to get a more detailed picture of route usage on the NCN in Scotland and the UK as a whole, annual usage estimates can be generated. Two different approaches are applied. In the first approach, overall use of the NCN is estimated using data from automatic count sites in Scotland only. When volumes of cyclists recorded at 26 automatic count sites on the NCN in Scotland are compared there is an overall 2.6% increase in cycle flows between 2011 and Applying growth factors based on Scottish counters to the 2011 AUE gives an AUE for 2012 of 62,521,340. Using this methodology the estimated breakdown of usage by cycling and walking trips is indicated in Table 4-2. Table 4-2 : Annual usage estimates of pedestrian and cyclist trips on the NCN in Scotland Annual usage estimate (AUE) total AUE cyclists AUE pedestrians million 33.4 million 27.9 million million 34.3 million 28.3 million % change +2.0% +2.6% +1.3% The second approach uses automatic cycle counters from across the UK to estimate the overall usage and annual growth for the UK wide NCN network. The estimate is then divided between nations based on their proportion of NCN route length. This approach gives an annual usage estimate on the NCN in Scotland for 2012 of 59.6 million trips; 32.8 million of these are cycling trips and 26.8 million walking trips, which is a slight decrease from However, this approach, being based on a sample of over 300 automatic cycle counters of which only 26 are located in Scotland, is heavily influenced by changes in usage in the rest of the UK. We believe that the first approach provides a better estimate for the annual usage and growth in Scotland, and the weight of evidence points to a growth in usage of the NCN in Scotland. The second approach does however provide sufficient data to illustrate substantial growth in use on the NCN in Scotland since 2007, illustrated in Chart 4-1, and the changes on different types of track presented in Table
11 Chart 4-1 : Annual usage estimate of pedestrian and cyclists on the NCN in Scotland 4 35,000,000 30,000,000 25,000,000 20,000,000 15,000,000 10,000,000 5,000, AUE cyclists AUE pedestrians Whilst overall the number of cycling and walking trips on the NCN was slightly lower in 2012 than in 2011 when using this approach, it does indicate a growth in cyclist and pedestrian usage on some routes types. Cycling trips increased by 2.0% on rural traffic free routes and by 3.1% on rural roads between 2011 and There has also been an increase in pedestrian trips on rural traffic free routes of 2.0% as shown in Table 4-3. Table 4-3 : NCN AUE by Route Types 2011 AUE 2012 AUE % change Cyclists urban traffic free 19,460,889 18,610, % Cyclists urban road 5,808,523 5,796, % Cyclists rural traffic free 2,603,502 2,656, % Cyclists rural road 5,513,951 5,686, % Pedestrian urban traffic free Pedestrian rural traffic free 25,684,915 24,562, % 2,218,755 2,263, % Total 61,290,534 59,574, % 4 NCN usage figures for previous years have been adjusted to ensure consistency with the current methodology. 7
12 4.4 Annual usage estimates - site specific In addition to an overall figure for annual usage in Scotland an estimated annual usage at specific sites can be calculated where a route user intercept survey (RUIS) was carried out. Seven route user intercept surveys were commissioned to be undertaken during August (school holiday) and September (term time) in 2012 across the NCN at sites previously surveyed. The 2012 data together with the data from the previous survey at each location are summarised in Table 4-4. Four sites show an increase in usage: Seton Sands in East Lothian, Bathgate in West Lothian, Stockingfield Junction in Glasgow and Irvine to Kilmarnock in Ayrshire. An example of this increase is the site at Bathgate which is on a traffic-free path linking Bathgate town centre with the local railway station and NCN National Route 75. This location has seen an estimated 232.1% increase in usage since A further six pre and post intervention surveys were completed on Community Links schemes. The 2012 surveys were commissioned for August/September 2012 and data together with the data from the previous survey at each location in 2011 are summarised in Table 4-5. All the Community Links schemes surveyed showed an increase in the annual usage estimate for both cycling and walking trips, following the completion of the projects. 8
13 Table 4-4 : Breakdown of annual usage estimates (AUE) reported from repeat RUIS on the NCN Survey site Year 5 AUE cyclists AUE pedestrians AUE overall Year AUE cyclists AUE pedestrians AUE overall Scheme Site description Overall change Seton Sands, East Lothian 2008 N/A* N/A 31, ,239 46, ,415 NCN National Route 76, traffic-free Ganavan, Argyll & Bute ,505 27,149 36, ,729 22,356 33,000 NCN NCN 78, Rural traffic-free Bathgate, West Lothian ,361 28,548 49, ,414 78, ,973 NCN NCN 75, trafficfree Rodney Street Tunnel, Edinburgh , , , , , ,779 NCN NCN 75, Urban traffic-free Broughty Ferry, Dundee , , , ,832 74, ,016 NCN NCN 1, traffic-free route into Dundee Stockingfield Junction, Glasgow ,703 15,044 46, ,812 32, ,854 NCN National Route 754, Urban trafficfree Irvine to Kilmarnock, Ayrshire ,119 21,051 28, ,646 24,620 39,103 NCN National Route 73, traffic-free *Due to a low response rate at Seton Sands in 2008 it is not possible to separate data by cyclists and pedestrians. Part of the route was closed during summer 2012 for repair/upgrade. 5 Year one in all tables represents the last available survey data for that survey location. An example is Bathgate where the last survey to be undertaken at this location was
14 Table 4-5 : Breakdown of annual usage estimates (AUE) reported from repeat RUIS on Community Links schemes Survey site Year AUE cyclists AUE pedestrians AUE overall Year AUE cyclists AUE pedestrians AUE overall Scheme Site description Overall change St Mary s Industrial Estate, Dumfries ,046 17,993 24, ,995 34,618 48,064 Community Links Urban trafficfree Goose Green, Musselburgh ,304 17,581 35, ,044 45,118 85,167 Community Links Urban trafficfree Inveralmond Park Link, Perth ,133 1, ,364 4,790 11,260 Community Links Urban roadadjacent Golf Course Link, Troon , , , , , ,546 Community Links Urban trafficfree Uddingston Grammar School, Uddingston ,216 47,641 56, ,702 62,991 78,382 Community Links Urban trafficfree Bells Burn Path, Linlithgow ,521 87, , ,379 89, ,668 Community Links Urban trafficfree 10
15 4.5 Case study illustrating increases in walking and cycling One of the Community Links schemes in Table 4-5, Goose Green in Musselbrough, demonstrates the impact a relatively small scheme can have on walking and cycling levels. The four day manual count for before and after the construction of a 115 metre-long section of tarmac-surfaced path to replace a muddy desire-line is shown in Chart 4-2. Chart 4-2 : Breakdown of four day 12 hour manual count of users at Goose Green, Musselburgh Manual count data collected alongside intercept surveys showed a 115% increase in cyclists on the route. Although some of this increase may be due to route users replacing a journey they would have made on an alternate route (via a tarmaced path that loops around the upgraded route), the new path now provides more direct access to National Route 76 which is part of the Coasts and Castles route along with being part of the John Muir Way and wider North Sea Cycle Route. 4.6 Automatic cycle counters data Data were gathered from a total of 46 counters in Scotland, both on the NCN and other routes. Of these, an increase in the counts was recorded between 2011 and 2012 for 27 counter locations. Data from two sites: North Edinburgh Access Road, West Granton and Willockston Road, Troon show an increase in levels of cycling trips which are shown in Charts 4-3 and 4-4. A total of 24 months of data are available from a counter located near to the North Edinburgh Access Road, West Granton. The counter is on a traffic-free section of path, part of the Roseburn-Craigleith- Crewe Toll which crosses the Red Bridge and links to NCN National Route One. Chart 4-3 shows that the median weekday total of cycling trips has increased year-on-year with a clearly defined peak in summer


16 Chart 4-3 : Median monthly daily totals at North Edinburgh Access Road, West Granton A total of 17 months of data are available from a counter located next to Willockston Road, Troon. The counter is on a traffic-free path that links to Marr College and NCN National Route Seven. Chart 4-4 shows the median hourly change between 2011 and Although overall usage is low the data suggest a year-on-year increase of cycling trips by hour with a small peak during afternoon commuting times. Chart 4-4 : Median hourly total change at Willockston Road, Troon 12
17 5 KPI 2: Increased levels of purposeful trips made by walking and cycling Purposeful trips are defined as the ordinary, everyday short trips currently made, in the main, by car. In the context of this report a purposeful trip includes commuting, shopping and travelling to school/education. Data from route user intercept surveys on the NCN and other routes as well as from other activities in communities and I Bike in schools were used to provide information on the types of purposeful journeys. Automatic cycle counter data is used to demonstrate change in usage during commuting periods at a specific site. 5.1 Overview NCN 13.5% of all users were commuting on the NCN in 2012; in 2011 this figure was 9.6% when responses were split by user type 24.0% of cyclists and 9.0% of pedestrians surveyed on the NCN were commuting, this compares to 16.8% of cyclists and 6.8% of pedestrians in 2011 there has been a 1.8 percentage point increase in users travelling on the NCN for shopping; 5.4% in 2011 increasing to 7.2% in 2012 peaks during commuting periods are evident at a number of automatic cycle counter locations including Middle Meadows Walk in Edinburgh Other schemes 12.4% of all users were commuting in 2012, compared to 10.2% in 2011 a 1.2 percentage point increase in pupils cycling to school every day and a 14.6 percentage point decrease in school children never cycling to school was recorded in I Bike Hands Up surveys 5.2 Breakdown of journey types on the NCN Aggregated data from all route user intercept surveys completed on the NCN in Scotland in 2011 and 2012 indicate increases in the percentage of commuting and shopping trips on the network as shown in Table
18 Table 5-1 : Trips by journey type on the NCN in 2011 and (%) 2012 (%) Overall percentage point change Commuting % Education % Shopping % Other escort % Personal business % Leisure % Other % Total Cycling journeys on the NCN The way in which cyclists use the NCN has changed between 2011 and Although leisure still accounts for 65.6% of trips on the NCN there has been a slight reduction in the percentage of leisure trips and an increase in the percentage of purposeful trips such as commuting, and shopping as shown in Chart 5-1. This change is not as marked on the wider network with commuting increasing at a slower rate from a higher base (18.6% to 22.6%) and shopping journeys decreasing (5.9% to 5.6%). 14
19 Chart 5-1 : Cyclists on the NCN responses to question on current journey purpose 5.4 Number of purposeful trips at NCN and Community Links sites Data from nine sets of baseline and follow-up route user intercept surveys on the NCN and at Community Links schemes have been analysed to provide data on the numbers of trips for commuting, shopping or to / from schools / colleges/ universities. The 2012 data showing the estimated number of purposeful trips compared to those identified in the previous survey are summarised in Table
20 Table 5-2 : Estimated annual numbers of purposeful trips 6 reported at NCN and Community Links sites Year Estimated annual commuter total Estimated annual shopper total Estimated annual education total Year Estimated annual commuter total Estimated annual shopper total Estimated annual education total Scheme St Mary s Industrial Estate, Dumfries Inveralmond Park Link, Perth Golf Course Link, Troon Uddingston Grammar, Uddingston Bells Burn Path, Linlithgow Stockingfield Junction, Glasgow Ganavan, Argyll & Bute Rodney Street Tunnel, Edinburgh Broughty Ferry, Dundee ,031 5, ,980 3,413 2, ,268 3, ,181 29,890 3, ,345 30,357 4, ,639 1, ,997 1, ,353 29,621 8, ,216 33,391 5, ,098 1, ,570 2, , ,432 1, ,912 96, ,577 90,939 1, ,132 7, , Community Links Community Links Community Links Community Links Community Links National Cycle Network National Cycle Network National Cycle Network National Cycle Network 6 Estimated annual commuter/shopper/education totals are derived by applying the journey purpose % from survey data to the overall AUE for each site as shown in Table 4-4 and Table
21 5.5 Case study illustrating change in purposeful trips on the NCN Analysis of responses from route user intercept surveys indicates a change in the breakdown of journey types on the NCN at Stockingfield Junction, Glasgow. The surveys took place in 2008 and in 2012, before and after various surface upgrades. Comparing the two survey iterations indicated an increase in the percentage of commuting journeys on the route (Chart 5-2). Chart 5-2 : Baseline and repeat journey purpose data from Stockingfield Junction, Glasgow 5.6 Case study illustrating change in purposeful trips at a Community Links scheme Route user intercept survey data collected before and after the completion of a Community Links scheme at Inveralmond Park Link, Perth (linking an industrial estate with the local community) indicates a marked change in journey types. Baseline journey purposes were split equally between leisure (50%) and commuting (50%). A comparison of Pre/Post journey purpose in Chart 5-3 shows a much wider spread of journey types post completion of the route. 17
22 Chart 5-3 : Pre/post journey purpose from Inveralmond Park Link, Perth Changes in the Pre/Post journey purpose at Inveralmond Park, Perth could be attributed to the clearing of overgrown vegetation and laying of new tarmac path giving direct and safe access from Ruthvenfield Road to the industrial estate and surrounding areas. 5.7 Case study illustrating usage from automatic cycle counter data A counter located on Middle Meadows Walk, Edinburgh (a series of traffic-free paths located in central Edinburgh) demonstrates that usage on the route has been consistent during 2011 and 2012 (Chart 5-4). However, Chart 5-5 indicates that there are peaks in cycle flows at specific times of day and suggests a year-on-year increase in commuting. 18


23 Chart 5-4 : Median monthly daily totals at Middle Meadows Walk, Edinburgh Chart 5-5 : Median Hourly averages at Middle Meadows Walk, Edinburgh 5.8 Travel to school Sustrans carries out the Hands Up survey annually. Starting in 2008 this is the largest national dataset to look at travel to school across Scotland and collects data from schools regardless of whether there are any walking or cycling activities currently being delivered. In 2011 and 2012 Hands Up Scotland data were given as Official Statistics in Scotland. Sustrans delivers the I Bike programme of activities in schools in Dumfries, East Dunbartonshire, Edinburgh, Fife and Perth which is covered in section In addition, Sustrans runs an annual project to match fund the installation of cycle parking at schools across Scotland. 19
24 5.8.1 Hands Up Scotland Table 5-3 shows the modal share for travel to school by school types in Scotland for 2011 and Table 5-3 : Hands Up Scotland Survey: Travel modes by school type 2011 and 2012 School type Year Walk Cycle Scooter/ Skate Park & Stride Driven Bus Taxi Other Total Nursery % 1.8% 1.7% 4.3% 46.4% 3.0% 0.7% 0.5% 14, % 3.0% 3.0% 4.3% 43.9% 2.8% 0.7% 0.3% 19,411 Primary % 4.0% 1.5% 9.6% 26.6% 7.7% 1.6% 0.2% 266, % 4.1% 2.5% 9.8% 26.5% 7.5% 1.6% 0.2% 282,468 Secondary % 1.3% 0.2% 4.0% 15.3% 35.5% 1.3.% 0.6% 157, % 1.1% 0.2% 4.3% 14.1% 35.8% 1.3% 1.0% 166,169 SEN % * 0.0% * 4.8% 56.8% 34.6% 1.1% 1, % * 0.0% * 3.6% 20.5% 59.0% 15.0 % 1,555 Independent % 0.3% * 3.9% 45.9% 30.2% * 1.1% 2,275 SEN Special Education Needs *Suppressed data due to low responses In 2012, over 475,000 children from 1,982 schools and 523 nurseries took part in the survey from all 32 local authorities in Scotland. 49.7% of pupils in Scotland said they normally travel to school actively, without using any form of motorised transport. Scooting has become an increasingly popular method of travel and there has been an increase in the number of children who park and stride to school in other words they are driven part of the way to school and walk the rest with their parent/guardian. This is an optimistic indicator that parents are now considering the need for them and their children to incorporate active travel into their daily routines. Park and stride has increased each year of the survey from 6.1% in 2008 to 7.8% in I Bike % 0.8% 1.1% 11.0% 42.3% 27.8% 0.2% 2.0% 7,296 The overarching aim of I Bike is to increase the number of pupils cycling to school. Specific aims of the project are to counter the decline in cycling levels as pupils move from primary school to 20
25 secondary school and to recognise and support the differing needs of male and female pupils regarding cycling. In , hands up style pupil surveys were conducted with 24 schools in their first year of the project. 5,367 pupils took part in the pre survey (2,677 male and 2,690 female) and 4,660 in the post survey (2,330 male and 2,330 female). Pupil survey data collected from I Bike schools in show a 5.6 percentage point increase in pupils regularly cycling to school and 0.6 percentage point increase in pupils walking regularly 7 to school after their first year of engagement with the project. Funding for the project in was secured and I Bike will continue in Edinburgh, Perth and Fife, with the project now expanded to include Dumfries and East Dunbartonshire. Due to timescales for data collection this report includes data with the data for being available in late Chart 5-6 shows the changes in frequency of cycling at I Bike schools between Chart 5-6 : Responses to the question How often do you cycle to school? In addition to the aggregated data for all the I Bike projects operating in as indicated in Chart 5-6 there were some notable achievements in each project. Fife pupil survey results show that regular cycling to school increased from 6.7% before I Bike to 12.4% after one year of engagement in the project 7 Once a week or more 21
26 Perth regular 8 cycling to school among girls more than doubled from 4.9% before the project to 10.3% after one year of engagement similar increases were seen among boys with 8.6% regularly cycling to school before I Bike and 14.5% after the percentage of pupils cycling to school every day increased from 3.0% before I Bike to 4.2% after engagement in the project the percentage of pupils regularly cycling to school was relatively high prior to engagement in the programme, at 22.0%. This increased to 24.3% after engagement in the project the percentage of pupils who never cycle to school dropped 19.5 percentage points, from 58.1% before I Bike to 38.6% after Edinburgh the percentage of pupils cycling to school every day increased from 3.1% before I Bike to 5.2% after engagement in the project the percentage of pupils regularly 9 cycling to school increased from 12.2% before I Bike to 18.1% after engagement in the project the percentage of female pupils cycling to school every day increased from 2.5% before I Bike to 3.8% after engagement in the project, while regular cycling to school increased from 11.4% before I Bike to 17.4% after the equivalent percentage for male pupils cycling to school regularly increased from 13.0% before to 18.8%, while the percentage of male pupils cycling to school every day increased from 3.7% before I Bike to 6.5% after engagement The I Bike School Champion and Head Teacher survey was conducted in May 2012 in schools in Edinburgh, Fife and Perth. 21 surveys were received in total from representatives at 16 schools engaged in I Bike during Responses to the teacher survey indicate that the increase in active travel has had a positive impact on pupils levels of physical activity. All teachers thought I Bike made pupils at their school more physically active, with 76% saying the project s impact in this area was good or excellent. The I Bike Parent & Guardian survey was also conducted in May and June 2012 with parents of children attending I Bike schools in Scotland. 287 responses were received from parents of pupils at 21 I Bike schools. The parent survey indicates that pupils parents are more active since their children participated in I Bike, 12% of respondents thought their own physical activity levels had increased, demonstrating the wider impact of I Bike in promoting active travel and increasing levels of physical activity beyond the target audience. Some parents linked their increase in active travel to the I Bike project: I was inspired to cycle to work more as we were all getting our bikes out. Therefore the project is contributing to the target of increases in purposeful journeys directly by encouraging more pupils to cycle to school but also by encouraging more adults to cycle to work. When comparing results for I Bike schools compared to non-i Bike schools, Hands Up Scotland 2012 data shows that 5.2% of primary school pupils who have been involved in the I Bike normally cycle to 8 Once a week or more 9 Once a week or more 22
27 school, compared to only 4.0% of pupils at primary schools that have had no involvement in the project (or had been engaged for less than one month of the project). 10 In secondary schools, 2.0% of pupils cycle to schools which have worked with I Bike whereas only 1.1% of pupils normally cycle to school at those schools that have not worked with the I Bike project (or had been engaged for less than one month of the project). 10 Schools that engaged in I Bike for the first time from the start of the school year (i.e. August 2012) have not been included as I Bike schools as they have only been engaged in the project for less than one month 23
28 6 KPI 3: Increased levels of attainment of recommended physical activity levels through walking and cycling In 2012, 58.5% of the intercept survey respondents on Sustrans routes reported that they had completed 30 minutes or more of physical activity on five or more days in the past week (one way of demonstrating attainment of Chief Medical Officer s recommended physical activity levels). 6.1 Overview NCN 60.5% of users on the NCN in 2012 completed 30 minutes or more of physical activity on five or more days in the past week, compared to 58.7% in percentage point increase in pedestrians on the NCN stating that the route has helped them increase their levels of physical activity Other schemes 58.5% of users in 2012 reported that they had completed 30 minutes or more of physical activity on five or more days in the past week (58.6% in 2011) the proportion of pedestrians on the wider network stating that the route has helped them increase their levels of physical activity increased by14.5 percentage points 6.2 Physical activity levels - route user intercept surveys Aggregate data from route user intercept surveys carried out in 2011 and 2012 suggests that levels of physical activity amongst route users (as measured by the completion of 30 minutes or more of physical activity on five or more days in the past week) have remained constant (58.6% in 2011 and 58.5% in 2012). Considering surveys on NCN routes only, the percentage of respondents meeting this level of physical activity increased slightly (58.7% in 2011 to 60.5% in 2012). A route user intercept survey completed at Montrose, Angus (a traffic-free section of NCN National Route 1) was conducted during August and September % of respondents surveyed had completed the recommended levels of physical activity in the previous seven days. Table 6-1 shows the percentage of respondents who had completed 30 minutes or more of physical activity on five or more days in the past week, as recorded in both baseline and post completion surveys of Community Links schemes. Table 6-1 : Percentage of respondents completing the recommended level of physical activity over seven days at Community Links schemes 5 days (%) 6 days (%) 7 days (%) Percentage point change of respondent completing 5 or more days St Mary's Industrial Estate, Dumfries Pre Post % 24
29 Bells Burn Path, Linlithgow Goose Green, Musselburgh Inveralmond Park Link, Perth Golf Course Link, Troon Uddingston Grammar, Uddingston Pre Post Pre Post Pre Post Pre Post Pre Post % -10% -31% +19% +17% 6.3 The impact of routes on increasing levels of physical activity Survey respondents were asked the question Has the presence of this route helped you increase the amount of physical activity that you regularly take? Comparing aggregated data from all surveys in Scotland undertaken in 2011 and 2012 indicated a 9.1 percentage point increase in respondents benefiting from the route in terms of increased levels of physical activity (14.5 percentage points for pedestrians and 3.7 percentage points for cyclists). Data from surveys on the NCN in Scotland in 2011 and 2012 shows similar results, with a 10.3 percentage point increase in respondents benefiting from the route (16.0 percentage points for pedestrians and 4.2 percentage points for cyclists). Although the routes have helped both cyclists and pedestrians increase their levels of physical activity, data collected from pedestrians on the NCN suggests a marked increase in these respondents using the route to increase their levels of physical activity as shown in Table 6-2. Table 6-2 : Responses by pedestrians on the NCN to the question Has the presence of this route helped you to increase the amount of physical activity that you regularly take? 2011 (%) 2012 (%) Overall percentage point change Yes, by a large amount Yes, by a small amount No These figures indicate the importance of the routes in providing locations where individuals can exercise which could contribute to an improvement in health. 25
30 % of respondents 7 KPI 4: Improved community cohesion and liveability Data from Street Design projects in Elgin (Cockmuir Place) and Kirkcaldy (Katrine Crescent) indicate that local resident participation in the projects has led to an improved sense of community and liveability with 100% of respondents in Elgin agreeing the street is good/attractive following completion of the work. Local streets which are less dominated by motorised traffic can be a contributing factor to a feeling of community cohesion and liveability. Additional supporting data is available from projects in Dores and Dunbeg as well as responses to a community engagement survey in Kirkcaldy. 7.1 Overview 94% of respondents from the Street Design project in Elgin thought that the speed of traffic had been reduced the modal share of motorised traffic travelling to and from the nearby school decreased by 2% following the Street Design project in Elgin 85% of respondents as part of the Street Design project in Elgin said they know three or more individual people in their street following the project, compared to 50% before the project 32.1% of respondents to the Make your move Kirkcaldy (MYMK) survey had met members of their community for the first time at a MYMK event 7.2 Street Design Household Survey Households were surveyed at the beginning of the project and after the work had been completed. Results from these surveys indicate how the Street Design projects have had a positive impact in the area. Chart 7-1 provides information on the positive change the project has had at Cockmuir Place, Elgin. Chart 7-1 : Change in percentage of respondents agreeing and strongly agreeing with statements on their street at Cockmuir Place, Elgin 100% 90% 80% 70% 60% 50% 40% 30% 20% 10% 0% 43% 100% The appearance of the street is good/attractive Before 83% 36% 38% There is space in the street for people to socialise 59% I have a say in decisions made about my street and local area After The residents of Katrine Crescent in Kirkcaldy were also asked how strongly they agreed that there was space in the street to socialise. Before the project 27% of respondents either agreed or strongly agreed and this increased to 53% post completion of the project. 26
31 In addition Table 7-1 shows the opinions of participants on how they will be involved in the community following completion of the project. Table 7-1 : Opinions about community participation after the project at Cockmuir Place, Elgin Percentage of respondents who agree or strongly agree I feel more confident participating in community activities 56% I will be proactive in the community in the future as a result of the project 39% I have learned new skills through the street design project 28% Residents were asked about their perceptions on traffic speed and volume in household surveys undertaken following the completion of the project and the results are shown in Table 7-2. Table 7-2 : Percentage of respondents who agreed/strongly agreed with the statements Cockmuir Place, Elgin Katrine Crescent, Kirkcaldy The amount of traffic has been reduced 53% 28% The speed of traffic has been reduced 94% 41% Qualitative feedback from residents on the impact of the project on community cohesion and liveability suggest the positive impact of the project: Definitely people are spending more time outdoors and speaking more. It has brought people together. Resident Kirkcaldy It is much safer for people to walk and bike to school because of the paths being wider and the speed bumps Pupil, Elgin The kids have got somewhere they can actually go; they can walk to school Resident, Elgin I know more of the neighbours now from going to the meetings. I didn't know them all before and I lived here twenty years Resident Elgin I work as a child minder and a lot of my kids come along here (new wooden street furniture) and use it like a gymnastics beam which is good to see. Resident Kirkcaldy It is wheelchair friendly which is nice as it s the same height as the pavement and wheelchairs used to have to bump down which wasn t very comfortable Pupil, Elgin 27
32 The results above suggest that these projects have contributed to a feeling of community cohesion and liveability and this may have contributed to an increase in residents cycling or walking: in Cockmuir Place the modal share of child cyclists travelling to and from school has increased by 8% in Katrine Crescent 38% of residents surveyed have walked more since the project 7.3 Dores and Dunbeg One of the main aims of the paths in Dores and Dunbeg was to provide safe routes off the main road to the schools providing an alternative for cyclists and pedestrians. The perceptions of safety are discussed in Section 8, however feedback from focus groups carried out with the pupils and parents at the local primary schools suggest that the paths have contributed not only to improved perceptions of safety but also to improved community cohesion and liveability. Qualitative feedback from Dores included: It s widened their accessibility to play with their friends without parents having to get into their cars. The path meant that the children could cycle to the top of the hill to watch the Loch Ness Marathon runners come past. The route means there is now more awareness of the school in the community. It has made the school part of the community. Qualitative feedback from the parents at Dunbeg included: The children want to walk more; my child always asks to walk rather than go in the car. They take pride in it; they see it as their path I meet a lot of people on the path that I wouldn t have met on the road. When there are events at the school we all hook up and walk in together. They enjoy the path; they don t come quickly along it the children like to take their time walking along the path to and from school, they chat and socialise. In school they re always taking about who they saw or spoke to on the path. 28
33 8 KPI 5: Reductions in incidence of KSI, and perception of level of risk Positive impacts by projects upon perceptions of levels of risk have been demonstrated at Street Design projects in Elgin and Kirkcaldy and by projects in Dores and Duror which focused on routes in or linking communities. Indicators for these impacts are perceived changes in speed and volume of traffic, increases in active travel, and perceptions of safety upon streets and routes at Street Design locations by comparing pre and post household surveys. Additional qualitative data is available via online surveys/focus groups at Dores and face-to-face interviews undertaken in Duror. 8.1 Overview 94% of residents surveyed in Cockmuir Place, Elgin thought that the speed of traffic had been reduced following the project 46% of residents surveyed in Katrine Crescent, Kirkcaldy thought the street was now safe for children to play, compared to 7% before the project 8.2 Street Design Household survey Residents of Cockmuir Place and Katrine Crescent completed household surveys before and after the projects to describe what they liked and disliked about their streets, and the impact of the projects as recorded in the surveys. Key results are shown in Table 8-1. Table 8-1 : Percentage of respondents who agreed/strongly agreed with the statements Cockmuir Place, Elgin Katrine Crescent, Kirkcaldy The amount of traffic has been reduced 53% 28% The speed of traffic has been reduced 94% 41% The street is safe for children to play 83% 46% The street is pedestrian friendly 94% 73% 8.3 Case studies illustrating perceptions of safety on new routes The Dores project near Inverness focussed on improving safety for children and adults travelling to and from their local primary school and village as well as offering an alternative route for cyclists, taking users away from the busy main road. The new path greatly improved perceptions of safety when travelling in the area and encouraged active travel. Despite a low response to the user survey, feedback was overwhelmingly positive with respondents agreeing that the feeling of safety influenced their use of the new path. The increased perception of safety was also apparent in the comments from participants in the focus groups. Parents and pupils were asked a series of questions about how the new link has impacted on how they travel and in particular how they feel about cycling on the link. Qualitative feedback included: I think it s good because when I cycle I feel safer and more relaxed. I would let my kids come up from the village to the school and up the path and back again because I know it s safe. 29
34 People are more likely to take that route now that there is the path. It will take a lot of people off the main road. It will make a big difference. Since living here for the last two years it s really dangerous; I ve seen fatalities on that road. Now the path s here we don t need to go anywhere near that road. The Duror South Bridge project focussed on developing a traffic-free section of route and installation of a bridge on NCN78 the Caledonian Way. The path also links the small community of Duror with the local primary school providing a safe route away from any major roads for the pupils to travel between home and the school. When asked how children travelled to school before the path the head teacher stated a lot by car. All children had to travel by the road and be dropped at the school. The head teacher developed this point when discussing Active Walk to School Week and she described how the children travel to school Before the path children had to be dropped at a safe place near to school and escorted; now they can walk safely along the new route. The travel plan for the school has now been updated. 30
35 9 KPI 6: Economic benefits A series of economic benefits of the interventions delivered by Sustrans in Scotland can be calculated from data collected in These include benefit to cost ratio, jobs sustained, benefits from tourism and the overall estimated benefits of active travel on the NCN. 9.1 Benefit to cost ratio (BCR) of Community Links schemes Data collected via pre and post intervention surveys at locations where Community Links schemes have been delivered have been used within standard tools and calculations for estimating the economic value of the benefits of the scheme to users. In total five schemes were evaluated, overall outputs are outlined in Table 9-1 and detailed outputs from two of the schemes are presented in Tables 9-2 and 9-3. Table 9-1 : Estimated benefit to cost ratio of Community Links schemes Total Benefits Total Costs BCR St Mary s Industrial Estate, Dumfries Golf Course Link, Troon Inveralmond Park Link, Perth Bells Burn Path, Linlithgow 500, , :1 458, , :1 90, , :1 241, , :1 Uddingston Grammar, Uddingston 929, , :1 *BCR is defined as a ratio attempting to identify the relationship between the cost and benefits of a project for example at St Mary s Industrial Estate for every 1 spent the return on investment would be Bells Burn Path, Linlithgow is a new, traffic-free link that connects the community to a series of amenities on the site of a previous desire line across a field. Table 9-2 : Summary of estimated benefits attributed to Bells Burn Path, Linlithgow Value (, total over ten year appraisal period) Benefit Cyclists Pedestrians Total Health 14,812 41,473 56,285 Absenteeism 2,972 6,165 9,137 Amenity 68,110 84, ,224 Greenhouse Gases 1,019 1,174 2,193 Accidents 2,232 2,571 4,803 31
36 Decongestion 11,929 13,740 25,669 Air quality Noise Infrastructure reduced maintenance Indirect Taxation Lost taxes ,273-4,922-9,195 Total 97, , ,882 Upgrading of the NCN75 outside of Uddingston Grammar School, Uddingston involved the overlaying and replacing of the current route with a flexible footpath construction overlay to prevent flooding which the path was previously prone too. Improved signage on the route was also included. Table 9-3 : Summary of estimated benefits attributed to Uddingston Grammar, Uddingston Value (, total over ten year appraisal period) Benefit Cyclists Pedestrians Total Health 100, , ,285 Absenteeism 20,379 76,581 96,960 Amenity 113,287 41, ,765 Greenhouse Gases 153 2,211 2,365 Accidents 336 4,843 5,179 Decongestion 4,703 67,791 72,494 Air quality Noise Infrastructure reduced maintenance Indirect Taxation Lost taxes ,043-10,740 Total 238, , , Reductions in greenhouse gas emissions WebTAG may be used to estimate reductions in the tonnes of greenhouse gases (GHG) emitted on a site-by-site basis (Table 9-4). 32
37 Table 9-4 : Estimated reduction in total tonnes of greenhouse gases emitted at Community Links and NCN sites Pedestrians Cyclists Overall Additional car km removed Total tonnes GHG removed Additional car km removed Total tonnes GHG removed Additional car km removed Total tonnes GHG removed Dumfries 5, ,967 1 Perth 2, , ,585 1 Troon -19, , Uddingston 19, , ,033 4 Linlithgow 10, , ,508 4 Stockingfield Junction, Glasgow 6, , , Based on average car emissions, the potential carbon dioxide saving of the journeys on the NCN was 115,009 tonnes. 9.3 Jobs sustained through Community Links projects Additional data from 67 Community Links schemes which received funding during 2011/2012 can be used to calculate the number of Full Time Equivalent (FTE) jobs that would be sustained through the creation of the routes. The data is presented in Table 9-5. Table 9-5 : Estimated FTE sustained through Community Links schemes Outputs FTE 17.3 Total km 29.5 FTE per km Tourism Using the Cycle Route Economic Impact Model, Sustrans can estimate the economic impact of cycle tourism. Route user intercept surveys were carried out on ten sites on the NCN in Outputs from the survey were analysed using the model and Table 9-6 shows the estimated revenue generated by cyclists on the routes and the number of jobs that are supported by that revenue. 11 A sizeable increase in cyclists using the junction combined with a higher proportion of cyclists who could have used a car, but chose not between survey periods has led to a mass reduction in estimated levels GHG. 33
38 Table 9-6 : Summary of tourism revenue estimates for route user intercept surveys completed on the NCN in 2012 Site Spend per head Spend per year Total spend per year Home Tourist Home Tourist based based FTE roles Ganavan ,434 40,444 73, Broughty Ferry Rodney Street Tunnel, Edinburgh 6.97* ,829 9, , , , Seton Sands , , , Bathgate , , Dreghorn ,418 12,815 87, Loanhead ,163-81, Montrose ,879-86, Ormiston ,333-68, Stockingfield Junction ,516 10, , * The low spend is due to a low average group size. The estimated indicative value of leisure cycling and cycle tourism in 2012 on the NCN and adjoining links was 168m. 9.5 Estimated benefits of active travel on the NCN The estimated health benefits of walking and cycling on the NCN have been estimated using the World Health Organisation s Health Economic Assessment Tool (HEAT). An online tool it requires input date from route user intercept surveys including frequency of travel, number of trips and average distance to generate a simple output expression. The present value of the mean annual benefit attributable to walking and cycling on the NCN is estimated to be 23.2 million for walking and 48.3 million for cycling trips. 34
39 10 Next Steps This report is the first interim report for the funding period An interim report will also be produced in 2014 and a final report in RMU will continue to use a range of monitoring tools to collect data over the remaining funding period to measure progress against the walking and cycling outcomes identified in the report. The continued use of automatic cycle counters, route user intercept surveys and manual counts will allow for the usage of the NCN and other routes to be tracked and for an overall annual usage estimate to be produced as well as an annual usage estimate at specific sites. We will continue to use counter data from automatic cycle counters to provide an overall usage estimate but also identify trends such as peaks in commuting periods at specific locations. This existing counter data will be supplemented by data from the ten new digital display counters which are being installed from August The initial three locations will be at Edinburgh, Glasgow and Stirling and approximately six to eight months of data from these new digital display counters should be available for analysis and inclusion in the next interim report. It is anticipated that future route user intercept survey locations will be on a variety of route types; urban, rural, short links and longer distance cycle routes. They will also be a mix of pre-surveys, ie where an improvement to an existing path is planned, and follow up surveys at sites where infrastructure improvements have been completed. Surveys will take place at Community Links sites, on the NCN and in Kirkcaldy as part of the Make Your Move Kirkcaldy monitoring. Follow up surveys allow changes in numbers and types of users to be identified along with any changes in journey types. The data from these surveys will therefore allow us to report on findings at varied sites. The Scotland Hands Up survey will continue and it is hoped that this will acquire National Statistics status in the future. Additional monitoring which is scheduled for 2013 will include a workplace travel survey in Edinburgh. This online survey includes questions on current travel mode, journey times and distance. These questions help to ascertain the mode share for the journey to work by walking or cycling. A count of parked bikes at Drumgelloch, Caldercruix, Armadale and Bathgate stations on a quarterly basis is scheduled for This will provide an indication of the number of multi-mode cyclists who cycle to and from the station for work or leisure purposes. A survey with a main contractor on the Oban to Fort William route is planned to help assess the benefits to the local economy of the work contracted by Sustrans in the development of the route. Sustrans Scotland has also received funding for a pilot e-bikes project in the Cairngorms running until November The project s aims include increasing cycling in the National Park through the promotion of electric bikes to locals and visitors which would then result in fewer car journeys as visitors use electric bikes to travel round the park. Results from the monitoring of this project would also be used to inform progress against outcomes in the next interim report. Future monitoring will take into account the recent Cycling Action Plan for Scotland (CAPS) refresh and aim to address the CAPS outcomes and indicators when finalised. 35
40 APPENDICES 1 Methodological description Subheading 1.1 highlights the range of methods that are required to assess progress towards the outcomes addressed in this report. 1.1 Monitoring tools Automatic cycle counters Data are collected from a network of automatic cycle counters across Scotland. Growth in the National Cycle Network and creation of Community Links schemes has been accompanied by the installation of automatic cycle counters in numerous locations. Counters are typically inductive loop based technology, recording continuous counts of cyclists on an hourly basis however; recent Community Links projects have installed a series of combined counters that recorded both cyclists and pedestrians on an hourly basis. These counters provide valuable data on cycle usage over time. While the monitoring period is for , data have been accessed from an extended period (January 2006) to enable a more robust analysis of annual change from levels prior to Route user intercept surveys Route user intercept surveys are intercept surveys conducted over four 12-hour periods at a particular site, providing 48-hours of coverage. Surveys are conducted over both term time (one weekday and weekend day) and during the school holidays (one weekday and weekend day). Where possible, surveys were undertaken during August and September for all years. The surveys count all users passing the survey site, intercepting as many as possible over the age of sixteen to be interviewed. A manual count is conducted concurrently with the survey, recording all movements for each user category (age, mode and gender). Manual cordon counts Manual counts are conducted to provide before and after snapshots of movements of different users around or across (screen lines) a given location. The manual counts can be used to look at changing patterns of usage as a result of an intervention. The counts typically take place on a weekday during term time over a twelve hour period. Data are presented in terms of changes in level of use and different user groups. Hands-Up survey Hands-Up surveys in this report are those conducted as part of the annual national Hands-Up Scotland project which began in September The survey involves requesting that each school in Scotland participates in a Hands-Up survey in a given week during September. The project is a partnership between Sustrans and School Travel Co-ordinators working in local authorities across Scotland. The survey asks about usual mode of travel to school. School Travel Co-ordinators work with schools and collate the data for their authority. Sustrans Research and Monitoring Unit collate, analyse and report on the dataset. The fifth iteration of the survey took place in the autumn of Sustrans plans to continue delivering this survey in order to create a unique source of longitudinal data which can be used to monitor and evaluate walking and cycling interventions with young people over time. In 2011 and 2012 Hands Up Scotland data were given as Official Statistics in Scotland. Official Statistics in Scotland are produced by the Scottish Government, Crown Bodies and a number of other public bodies named by Parliamentary Order. The primary aim of Official Statistics in Scotland 36
41 is to provide an accurate, up-to-date, comprehensive and meaningful picture of the economy and society to support the formulation and monitoring of economic and social policies by government and others 12. A Parliamentary Order was passed designating Sustrans as Official Statistics Providers as of 1 st June Additional survey data collected through the I Bike project uses the same survey process as the Hands Up survey but is not classed as Official Statistics by the Scottish Government. Household Survey Household surveys can be manually delivered or ed to household directly impacted by Sustrans projects either before and after the project or upon completion of the work. Information captured includes views on: community engagement levels and residents involvement in the project perceptions of safety, traffic, parking, street appearance, litter and access to what extent the Street Design project overcame problems highlighted by the residents levels of active travel and perceptions of whether Street Design has enabled and encouraged more travel by active modes. Community Engagement Survey Community Engagement Surveys are designed to engage with the local community to understand how the work that Sustrans does impacts on community cohesion and liveability. For this report surveys were hosted on Bristol Online Surveys (BOS) and completed informally in-person. For BOS surveys a link was sent to willing participants to capture information on how the Make your move Kirkcaldy project has improved community cohesion as well as demographic information and awareness of the project. In-person surveys were undertaken at Duror Bridge South where local residents attending the opening were asked how the event and the route had impacted on the local community. Focus Group Focus Groups in this report were post-project groups using post-it notes to collect opinions on the impact of the project in for example Street Design, Dunbeg Community Link and the Dores project. Informal interviews with residents were conducted at street events (predominantly on the opening weekend) to gauge opinions about the changes that had taken place and the process as a whole. Semi-structured interviews were conducted using video and sound recordings at events, and were followed up by more formal telephone conversations. These interviews focused on the process of engaging the community and the changes made to the street. 1.2 Approaches to analysis Expressing changes in levels of cycling activity recorded by automatic cycle counters Year-on-year comparisons of continuous automatic cycle count data can indicate changes in levels of cycling over the longer term. Crude mechanisms which simply compare annual average daily totals (the standard form of output from proprietary packages handling cycle count data) disregard seasonality and weather effects, and are considered to under-represent levels of change in cycling activity. To quantify changes over time, techniques which allow for such seasonal cycles should be applied
42 The preferred approach to generating an expression of change for a single continuous data sequence (i.e. for a single automatic cycle counter) is the seasonal slope estimator (Gilbert, O.R. 1987, Statistical Methods for Environmental Pollution Monitoring ). The slope estimator generates a value, Q i which represents an expression of annual change in levels of cycling activity (effectively additional cycle trips per day), and is used to generate an expression representing the level of change over time. Q i is calculated as follows: xilx Qi lk where x il is the count (either total count or some expression of average count) in month i of year l, and x ik is the count in month i of year k, where l>k. It is calculated for each possible pair of years in the time series (whilst observing the rule l>k), and the median value represents the overall change across the time series. The Q i values for each location are converted to an expression of percentage change for that location using a baseline value. This baseline value is the median daily count at the given site over the entire time period for which data are available. The resulting values are therefore the percentage change in the number of cycles counted per day for any given year within the time period for which data are available. Calculated in this way, the percentage change relates only to the point on the route at which the cycle counter is located over the period of time for which data are available. The value does not reflect change in levels of use of the overall route or network of routes. An estimate of annual change across all count sites has been calculated by summing the 7-day median, summing the Q i and expressing the summed Q i as a percentage of the summed 7-day median. In addition to their use in analysing overall levels of change, seasonal slope estimators were also applied to the data to determine the magnitude of changes in total counts recorded by a single counter at different times of day. The application permits some analysis to be made regarding the times of day at which any increase in counts occurs. Investigating diurnal variation in usage growth By analysing data collected from automatic cycle counters in terms of the distribution of counts over the course of the day, we can make inferences about the relative changes in different user typologies, e.g. commuting cyclists, leisure cyclists. Generally, hourly flows of cycles tend to show one of two patterns. In the first, there are distinct peaks during the morning (typically between 6am and 9am) and afternoon (typically between 3pm and 6pm), with a drop off in counts recorded between these times. Such sites provide a useful basis for analysis of activity, with changes in the rate of growth in cycling levels within these key periods provide the basis for investigation. The second pattern shows a gradual increase in the number of cycle counts recorded towards early afternoon, followed by a decline into the early evening. Estimation of total National Cycle Network usage ik Current mechanisms for generating total National Cycle Network usage are crude. UK-wide estimates of use are made by taking basal measures of usage per kilometre derived from route user intercept surveys, and applying factors to reflect changes in levels of cycling activity to this basal measure on a year-on-year basis. These factors are derived from the year to year change observed in the annual average daily count recorded by automatic cycle counters. Whilst this mechanism applies different values for trafficked and traffic-free routes, and for urban and rural areas, there is no distinction made in the base levels of activity for the different parts of the UK, particularly with respect to the devolved nations. The National Cycle Network usage estimate for 38
43 Scotland reported herein was generated based on a weighting value that reflects the proportion of the National Cycle Network and additional links located in Scotland. In 2012 the number of trips on the NCN in Scotland was estimated using two methods. The first approach was derived using change in volumes of use at count sites in Scotland. The average percentage change in counts was applied to the 2011 usage estimate to give an approximation of use in The second is derived from the UK-wide NCN usage estimate (as mentioned early in this section). This is calculated based on change in volumes of use at count sites across the UK together with the network length. Estimated use of the NCN in Scotland is calculated from the UK wide figure by adjusting for the proportion of NCN and additional links route length located in Scotland. Estimating usage at a single site using survey data Count data collected during route user intercept surveys are used to generate annual usage estimates. These are calculated by comparing the manual counts conducted over four days with observed distributions of use from continuous counts at site which are comparable. The number of users recorded over the four 12-hour periods is considered in the context of an annual distribution of activity either a locally sourced pattern from, for example, a continuous cycle counter located close to the survey site, or using a proxy distribution based on continuous count data from other count locations on similar route types. The expected observed count on any given day in the corresponding month is used as the basis for estimating total annual usage using relative proportions of user activity. Weighting mechanisms are applied to refine the annual usage estimate and giving estimates by age, gender and activity. Responses by age, gender and type of activity are used to adjust the weighting to reflect changes throughout the year. For some surveys an insufficient number of responses are collected for weighting to be performed. Estimating the extent of usage attributable to specific classes of users Within the assembled reported material describing proportions of user categories, there is considerable reliance on the outputs from route user intercept survey material. This material is collected as described for route user intercept surveys in the section above, but the means of presentation varies with details of aggregation and weighting. At an individual site level, data are weighted to better represent the actual levels of usage by different categories of users. The weighting mechanism adjusts for the volume of responses relative to the counts of users recorded concurrently with the surveys, with particular reference to gender, activity (cycling or walking, or other), and day type. In some cases the proportions of particular user groups are reported based on this weighted analysis for an individual survey site. In other cases groups of surveys are aggregated and reported collectively. Survey data from multiple sites are aggregated for one of two reasons. Firstly, for the purposes of comparing groups of pre-and-post surveys, or secondly for the purposes of describing data accumulated in any given calendar year. In the case of the former, groups of survey sites are collated irrespective of the year in which the survey was conducted, but on the basis of there being a matched pair of pre-and-post survey iterations at the same site. Usage is reported as either absolute (weighted) usage figures or by proportion. In the case of the latter, data are combined based on the date of the survey falling within a particular year, irrespective of whether the data represent pre, post or one-off survey events. Usage is reported on a by-proportion basis. 1.3 Estimation of economic benefits Input parameters calculated using route user intercept survey data are shown below. 39
44 Overview of approach The methodology adopted in estimating the benefit to cost ratio of the Community Links schemes are consistent with the WebTAG unit concerning walking and cycling 13. The elements included in the appraisal and the derivation of options for input values are summarised in the following sections. Estimation of numbers of users benefiting from the intervention In order to estimate the value of the health benefit we have used the World Health Organisation s HEAT 14 model. To use this it is necessary to estimate the number of individual users who actually benefit. The total annual usage estimate of cyclists and pedestrians is adjusted for return journeys and frequency of trip to give an estimate of the number of individual. The total number of trips travelling in any direction is first converted to a number of individual trips based on the assumption that 90% of the users counted are making return journeys (so would effectively be counted twice) and the remaining 10% are making a one way journey on the route. The estimated number of trips per week is converted to individuals based on the proportion of those trips reported to be made daily, 2-5 times per week, weekly, fortnightly or monthly. Estimation of trip length Average cycle and walking trip lengths by trip purpose from the NTS were obtained from the Department for Transport (DfT). Data for the period were combined in order to give a sufficient sample size across trip purpose categories. A weighted average trip length is calculated using the proportion of trips of each purpose as recorded in the route user intercept survey and the NTS trip distance for that purpose and mode. The following modifications are made to the NTS trip length data: Leisure trips recorded in the NTS do not match the route user intercept survey definition of leisure trips, insomuch as walking and cycling trips made solely for leisure purposes are not included in the former. We therefore use the average leisure trip distance from aggregated responses to surveys performed on the National Cycle Network in 2011 for this journey purpose category (two miles and eight miles for walking and cycling respectively). In the NTS data, sample sizes for cycling for escort to education, other escort, holiday base and other were too small to be used individually. The average trip length for all purposes is applied for these journey purpose categories (2.5 miles). These purpose categories generally make up a small proportion of trips recorded. We therefore feel that this is a reasonable assumption. Trip lengths by purpose applied in the calculations are summarised in Table 1-1. Table 1-1 : Walking and cycling trip length by purpose (NTS, ) Purpose Walking trip length (miles) Cycling trip length (miles) Commute Leisure a In course of work DfT WebTAG WHO, Health Economic Assessment Tool. 40
45 Education Shopping Personal business Visit friends/family Social/entertainment Holiday base b Escort to school b Other escort b Other b a Leisure trip length taken from survey of users of the National Cycle Network in 2011 b Average cycling NTS trip length applied to the journey purpose categories holiday base, escort to school, other escort and other due to small sample size Estimation of car kilometres replaced An estimation of the number of car kilometres replaced is required to estimate the following values: CO 2 reduction, decongestion, accident benefits, local air quality, local noise, and infrastructure. The number of car kilometres abstracted from the road network is calculated using the percentage of respondents stating that they did not use a car to make any part of their journey; and the percentage stating that they could have used a car or van instead of walking or cycling for their current journey This was then applied to the trip length and the difference between car kilometres abstracted for the pre and post survey is taken to represent the total car kilometres abstracted as a result of the intervention. Estimation of time travelled The estimation of amenity benefits requires an estimation of the time spent on the intervention (for cyclists). To estimate the time spent on the intervention, an average trip time is calculated by dividing the trip distance by a default speed. This is then multiplied by the total number of trips for the pre and post survey. The difference between these two values is taken as the additional time spent on the intervention by new users. Applying values to benefits The following values were used in the calculation: benefits to health were calculated using the online HEAT tool amenity benefit to existing cyclists is valued at 4.73 p/min (the WebTAG value for an off road segregated cycle path) or 2.01 p/min (the WebTAG value for an on road segregated cycle path) amenity benefit to new pedestrians is valued at 7.6 p/km (the sum value for amenity benefit to pedestrians from street lighting, kerb level and pavement evenness, directional signage and new benches) amenity benefit to new users is valued at 3.8 p/km, half that to existing users 41
46 the values of the marginal benefits associated with the abstraction of car km benefit was calculated using the WebTAG rate for the appropriate road type using the Marginal External Costs spreadsheet 15 carbon savings as a result of reduce car kilometres are valued using DECC values ( 53 per tonne carbon dioxide equivalent) absenteeism benefits are valued based on average daily salary Growth rates accident benefits are valued based on costs per casualty from WebTAG The calculations assume that the period of build up in demand for use of the intervention is the same as the period between the pre and post survey. After the period of build up in demand, a 5% growth rate is assumed. This is in line with the annual average levels of growth that are observed on the National Cycle Network. 1.4 Wider economic benefits As well as standard WebTAG benefits, Sustrans have attempted to value the wider benefits of walking and cycling. Estimation of jobs sustained Investment in cycling generates jobs, both in the construction of infrastructure and through the delivery of soft measure interventions. Sustrans estimates that 11.0 jobs are created for every 1 million of investment in sustainable transport infrastructure 16. Data provided about the delivery of the project from the local authority Community Links reports can be used to estimate the number of jobs sustained through Sustrans schemes. Full Time Equivalent (FTE) jobs sustained are based on the accumulation of man hours worked during construction of the project. One FTE = 8 * 220 days. Each FTE is sustained because the level of investment supports one year s worth of employment hours. Economic impact of cycle tourism Sustrans and the University of Central Lancashire have developed an economic impact model for touring and leisure cycling 17. The purpose of the model is to enable us to estimate the impact of cycle tourists on National Cycle Network routes or other routes of interest where sufficient supporting information is available. The model uses information on the number of tourist groups using a cycle route and the characteristics of these groups to estimate the economic impact. The inputs required by the model are: average trip duration; average group size; percentage of tourist users; percentage of leisure users; total annual usage. This information can come from route user intercept surveys or other similar sources of information that may be collected by other organisations. The output from the model is an estimate of total spending by home-based recreational users, total spending by tourist users, an overall average spend per head, and spending in different sectors (accommodation, food and drink, etc). The revenue spend is then converted into an equivalent number of full time equivalent jobs that it can be expected to support and direct and induced jobs are calculated from input/output tables. Full Time Equivalent (FTE) jobs for tourism are calculated using the average estimated income required to support one full time equivalent job. Based on previous research figure 15 DfT WebTAG Sustrans (2012) Sustrans job creation study: interim report, Sustrans. 17 Institute of Transport & Tourism, Downward and Sustrans (2007) The economic impact of cycle tourism in North East England 42
47 this was taken to be 62, This figure was adjusted for inflation before being applied to this work. 18 This figure was derived from the recent One NorthEast report on Cruise Tourism in the North East of England (2004). These in turn were calculated from a combination of figures reported in The economic impact of tourism in England s North East (2002) and regional multipliers published by the Scottish Executive. 43
48 2 Maps Map 1: Sites of Community Links route user intercept surveys performed in Scotland between 2011 and 2012 Map 2: Location of automatic cycle counters demonstrating increases/decreases in usage between 2011 and 2012 Map 3: Location of automatic cycle counters across central Scotland demonstrating increase/decreases in usage between 2011 and
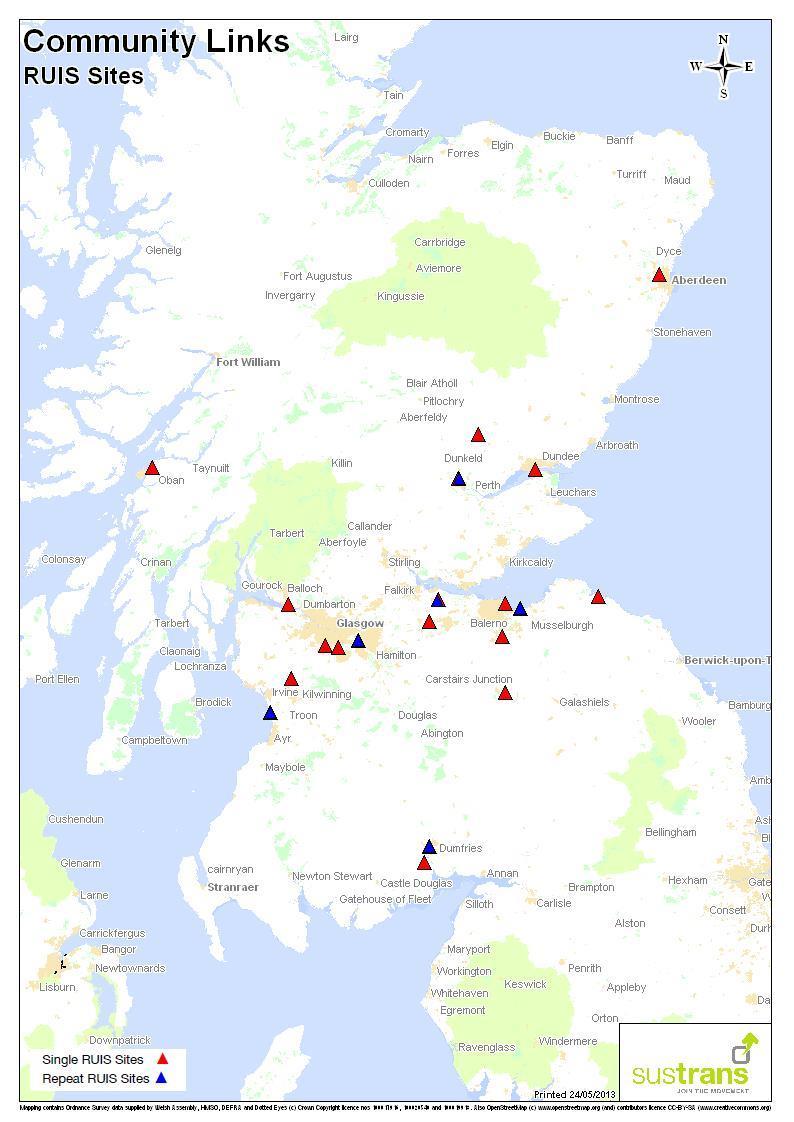
49 45
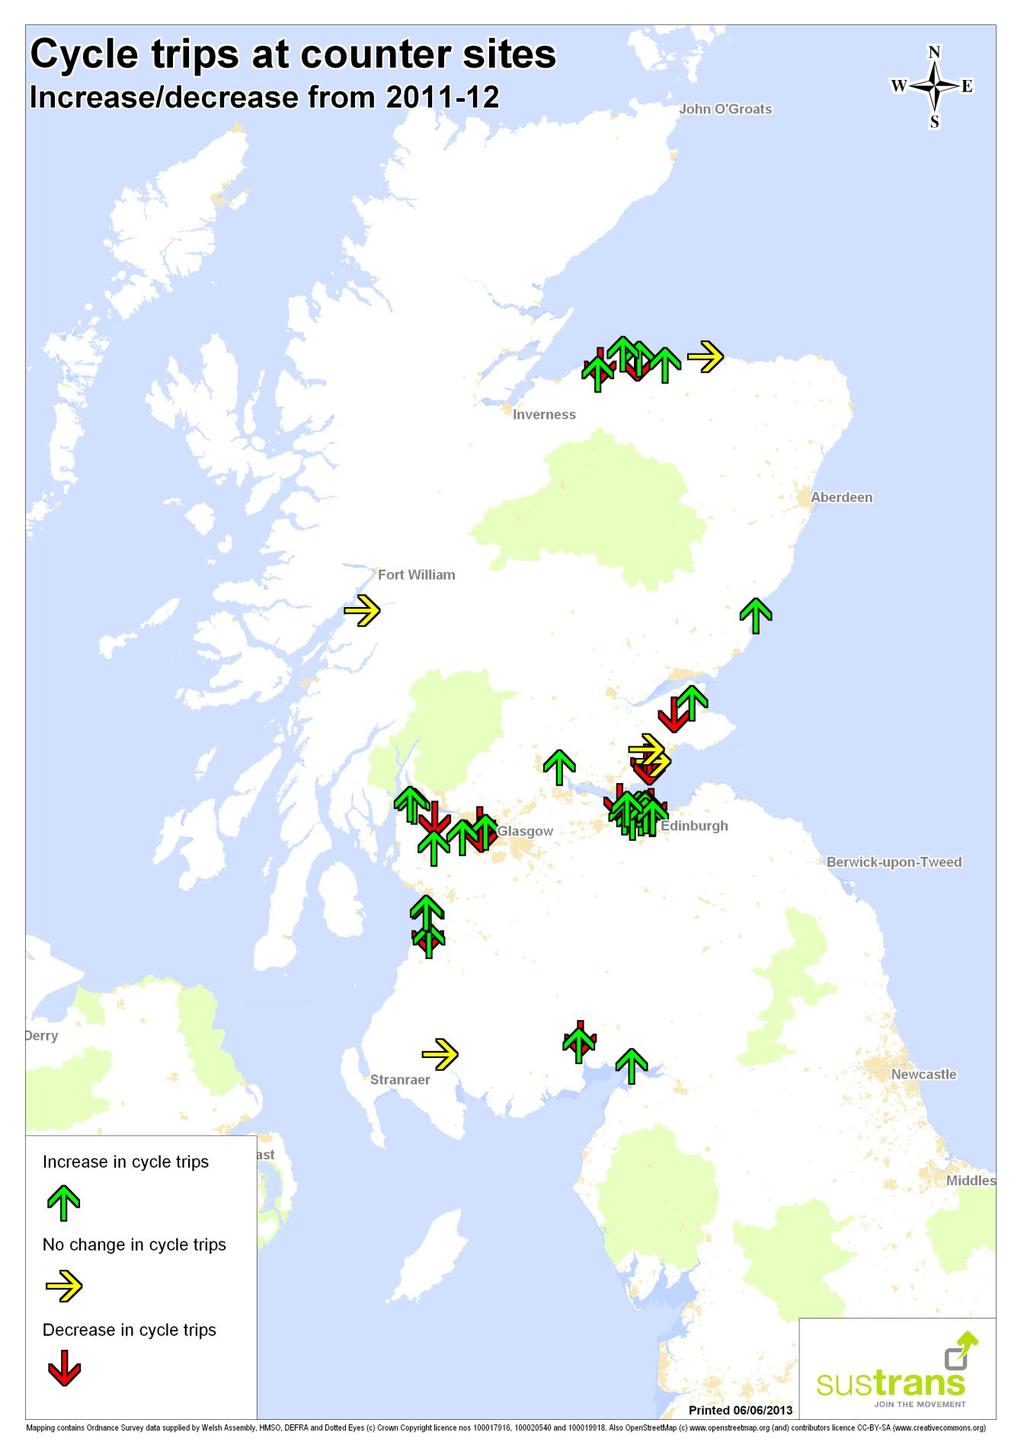
50 46
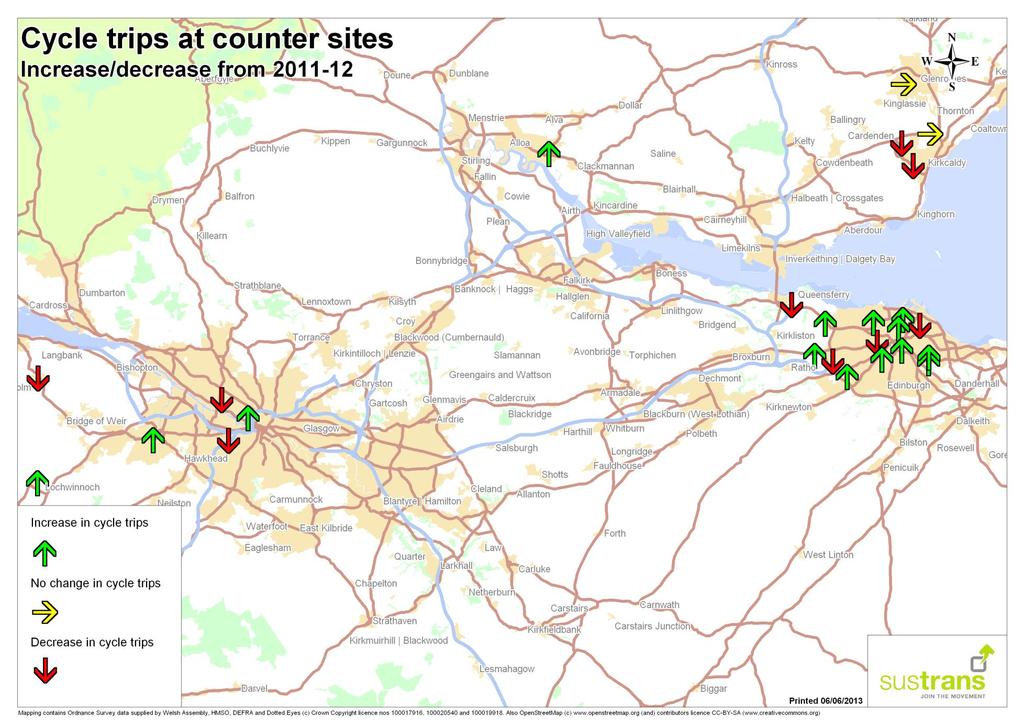
51 47
ANNEX1 The investment required to achieve the Government s ambition to double cycling activity by 2025
 ANNEX1 The investment required to achieve the Government s ambition to double cycling activity by 2025 May 2016 About Sustrans Sustrans makes smarter travel choices possible, desirable and inevitable.
Route User Intercept Survey Report
 Route User Intercept Survey Report Hills Road, Cambridge Fieldwork: October 2016 Report published: December 2016 1 About Sustrans Sustrans makes smarter travel choices possible, desirable and inevitable.
Transport Poverty in Scotland. August 2016
 Transport Poverty in Scotland August 2016 About Sustrans Sustrans makes smarter travel choices possible, desirable and inevitable. We re a leading UK charity enabling people to travel by foot, bike or
DOE Climate Change Proposals
 DOE Climate Change Proposals Sustrans response to Proposals for Taking Forward NI Climate Change Legislation January 2016 About Sustrans Sustrans makes smarter travel choices possible, desirable and inevitable.
CYCLING SCOTLAND SCOTTISH CHARITY NO.SCO Annual Cycling Monitoring Report
 CYCLING SCOTLAND SCOTTISH CHARITY NO.SCO29760 Annual Cycling Monitoring Report 2018 Annual Cycling Monitoring Report 2018 4 CYCLING SCOTLAND Annual Cycling Monitoring Report 2018 National cycling.scot
Active Travel Strategy Dumfries and Galloway
 Active Travel Strategy Dumfries and Galloway Our Active Travel Strategy The agreed Interventions for Dumfries and Galloway Council s Local Transport Strategy includes an action to Develop an Active Travel
Stepping up a gear. Our vision for cycling in Cardiff
 Stepping up a gear Our vision for cycling in Cardiff Cardiff is growing fast in fact, over the last 10 years its population has grown quicker than any UK city outside London and this rate of expansion
GD 0043/18 ACTIVE TRAVEL STRATEGY
 GD 0043/18 ACTIVE TRAVEL STRATEGY 2018-2021 May 2018 Minister s Introduction There is strong evidence that regular physical activity reduces the risk of a range of health conditions. The best way to increase
University of Leeds Travel Plan
 University of Leeds Travel Plan 2015-2018 Contents 1: Introduction 1.1 What is a Travel Plan? 1.2 Why do we need one? 1.3 Sustainability Strategy 2: Overview 2.1 The bigger picture 2.2 The City scale 2.3
Transport Poverty in Scotland. August 2016
 Transport Poverty in Scotland August 2016 About Sustrans Sustrans is the charity making it easier for people to walk and cycle. We connect people and places, create liveable neighbourhoods, transform the
Our journey a 20 year Transport Manifesto for the North East
 Our journey a 20 year Transport Manifesto for the North East Sustrans submission to North East Combined Authority (NECA). March 2016 Summary Sustrans is a leading UK charity enabling people to travel by
Westminster s Joint Health and Wellbeing Strategy
 Westminster s Joint Health and Wellbeing Strategy 2013 2016 Response from Sustrans General comments From a strategic perspective, Sustrans welcomes the Health and Wellbeing Strategy s focus on encouraging
Walking and Cycling Action Plan Summary. A Catalyst for Change The Regional Transport Strategy for the west of Scotland
 Walking and Cycling Action Plan Summary A Catalyst for Change The Regional Transport Strategy for the west of Scotland 2007-2021 Strathclyde Partnership for Transport Contents Purpose...2 Issues, Constraints
Smarter Choices, Smarter Places
 Smarter Choices, Smarter Places Reducing car use Increasing walking, cycling & public transport www.pathsforall.org.uk/scsp Paths for All More people more active leisure, transport. We want to create a
Scottish Parent Teacher Council School Travel Survey Introduction
 Introduction Scottish Parent Teacher Council (SPTC) is a membership organisation and charity whose purpose is to make parental involvement in children's education as good as it possibly can be. Sustrans
Active travel and economic performance: A What Works review of evidence from cycling and walking schemes
 1 Making the economic case for active travel Active travel and economic performance: A What Works review of evidence from cycling and walking schemes Active Travel Toolkit Slide Pack July 2017 Active travel
The Infrastructure Impact Tool
 1 The Infrastructure Impact Tool Guidance notes Delivered by Sustrans in partnership with: 2 About Sustrans Sustrans is the charity making it easier for people to walk and cycle. We are engineers and educators,
NCN 78 Dalnatrat to Duror Summary
 NCN 78 Dalnatrat to Duror Summary Traffic-free Route Options Appraisal Summary Report Final Draft August 2016 About Sustrans Sustrans Scotland makes smarter travel choices possible, desirable and inevitable.
An introduction to the benefits of - a we developed monitoring process. Cycling Without Borders Conference. 19 th September 2014
 An introduction to the benefits of - a we developed monitoring process Cycling Without Borders Conference 19 th September 2014 Sustrans Research and Monitoring U Team of 30 - data collection experts Monitor,
Easton Safer Streets - Final Project Report BRISTOL
 - Final Project Report BRISTOL A Sustrans Community Street Design Project in partnership with Bristol City Council February 07 About Sustrans Sustrans makes smarter travel choices possible, desirable and
Active Travel Towns Funding Scheme Project Proposal. Sligo. Sligo Local Authorities
 Active Travel Towns Funding Scheme 2014-2016 Project Proposal for Sligo by Sligo Local Authorities Introduction Over the last two years, Sligo Local Authorities have implemented years 1 & 2 of their 5
Update June 2018 OUR 2017 PUBLIC ENGAGEMENT
 Update June 2018 Hi, Let s Get Wellington Moving (LGWM) is developing a Recommended Programme of Investment (RPI) that meets our programme objectives and supports the city s and region s growth. As part
PERSONALISED TRAVEL PLANNING IN MIDLETON, COUNTY CORK
 PERSONALISED TRAVEL PLANNING IN MIDLETON, COUNTY CORK Elaine Brick Principal Transport Planner AECOM Abstract Smarter Travel funding was awarded to the Chartered Institute of Highways and Transportation
Cycle journeys on the Anderston-Argyle Street footbridge: a descriptive analysis. Karen McPherson. Glasgow Centre for Population Health
 Cycle journeys on the Anderston-Argyle Street footbridge: a descriptive analysis Karen McPherson Glasgow Centre for Population Health March 2017 Key points: There were 116,334 cycle journeys made using
BRIEFING PAPER 29 FINDINGS SERIES. Children s travel to school are we moving in the right direction?
 BRIEFING PAPER 29 FINDINGS SERIES Children s travel to school are we moving in the right direction? February 2011 FINDINGS SERIES 29 BRIEFING PAPER KEY FINDINGS National surveys show that while the level
Safe Routes to School
 Safe Routes to School Paul Osborne, Safe Routes to Schools Project Director, Sustrans The Danesmead Wing, 33 Fulford Cross, York YO10 4PB, UK paulo@sustrans.org.uk Summary Safe Routes to Schools is a practical
NCN 78 Benderloch to Ledaig Summary
 NCN 78 Benderloch to Ledaig Summary Traffic-free Route Options Appraisal Summary Report Final Draft August 2016 About Sustrans Sustrans Scotland makes smarter travel choices possible, desirable and inevitable.
Travel Plan Monitoring Report. Bourton View, Wellingborough - Residential
 Travel Plan Monitoring Report Bourton View, Wellingborough - Residential Prepared by: Developer Eyes Property and Estate Management, Broughton Grange Business Centre, Headlands, Kettering, Northants, NN15
Cambridgeshire floating bus stops interaction analysis
 Cambridgeshire floating bus stops interaction analysis Final report December 2015 About Sustrans Sustrans makes smarter travel choices possible, desirable and inevitable. We re a leading UK charity enabling
Department for Transport
 Improving UK evidence on health and environmental (low carbon) behaviours John Cummings Department for Transport 4 th November, 2015 CYCLING AND WALKING POLICY TEAM, OFFICIAL, 1st DRAFT 1 Walking and cycling
2. Context. Existing framework. The context. The challenge. Transport Strategy
 Transport Strategy Providing quality connections Contents 1. Introduction 2. Context 3. Long-term direction 4. Three-year priorities 5. Strategy tree Wellington City Council July 2006 1. Introduction Wellington
The One Path Initiative
 About Sustrans 2017, Livia Lazar/Sustrans, all rights reserved Sustrans is the charity making it easier for people to walk and cycle. We are engineers and educators, experts and advocates. We connect people
Baseline Survey of New Zealanders' Attitudes and Behaviours towards Cycling in Urban Settings
 Baseline Survey of New Zealanders' Attitudes and Behaviours towards Cycling in Urban Settings Highlights 67% of urban New Zealanders, 18 years of age or more own or have access to a bicycle that is in
Outcomes of the Cycling City and Towns programme: monitoring project report
 Outcomes of the Cycling City and Towns programme: monitoring project report Individual town results: Leighton Linslade April 2017 Report authors: Andy Cope, Research and Monitoring Unit, Sustrans Angela
Outcomes of the Cycling City and Towns programme: monitoring project report
 Outcomes of the Cycling City and Towns programme: monitoring project report Individual town results: Blackpool April 217 Report authors: Andy Cope, Research and Monitoring Unit, Sustrans Angela Kennedy,
Sandwell General Hospital Travel Plan 2014
 Sandwell General Hospital Travel Plan 2014 Travel Plan Survey Dated 24 th June 2013 Travel plan finalised March 2014 Prepared by Michael Raynor, JMP Consultants Ltd Site Address Lyndon, West Bromwich,
Bristol City Council has produced a draft Bristol Transport Strategy document.
 Bristol Transport Strategy Summary Document Introduction Bristol City Council has produced a draft Bristol Transport Strategy document. The Strategy fills a gap in transport policy for Bristol. We have
March Maidstone Integrated Transport Strategy Boxley Parish Council Briefing Note. Context. Author: Parish Clerk 2 March 2016
 Context. Author: Parish Clerk 2 The Draft Integrated Transport Policy (DITS) sets out a vision and objectives, and identifies a detailed programme of interventions to support the Maidstone Borough Local
Appendix 21 Sea angling from the shore
 Appendix 21 Sea angling from the shore LUC SMRTS2015 Final Report 342 March 2016 Appendix 21 Sea angling from the shore Table A21.1: Summary of sample confidence levels Responses Spatial data Questionnaire
COUNT ME IN PEDESTRIAN COUNTERS CASE STUDY ABOUT THIS CASE STUDY:
 COUNT ME IN PEDESTRIAN COUNTERS CASE STUDY ABOUT THIS CASE STUDY: Getting hold of good data on the number of pedestrians is invaluable to plan and prioritise walking-friendly streets. This case study explains
CAIRNGORMS NATIONAL PARK AUTHORITY FOR DECISION
 CAIRNGORMS NATIONAL PARK AUTHORITY FOR DECISION Title: Prepared by: A9 Dualling Project: Dalraddy to Slochd Murray Ferguson, Director of Planning and Rural Development and Gavin Miles, Head of Planning
Determining bicycle infrastructure preferences A case study of Dublin
 *Manuscript Click here to view linked References 1 Determining bicycle infrastructure preferences A case study of Dublin Brian Caulfield 1, Elaine Brick 2, Orla Thérèse McCarthy 1 1 Department of Civil,
Tackling Social Inequality by Promoting Sustainable Transport. Huw Thomas, Smarter Choices Programme Manager
 Tackling Social Inequality by Promoting Sustainable Transport Huw Thomas, Smarter Choices Programme Manager Agenda Sustrans who are we? Transport and Social Inequality Group work how to inform and change
TYPES OF CYCLING. Figure 1: Types of Cycling by Gender (Actual) Figure 2: Types of Cycling by Gender (%) 65% Chi-squared significance test results 65%
 Figure 2: Types of Cycling by Gender (%) 65% Chi-squared significance test results 65%") TYPES OF CYCLING 1,980 responses were received to this question (multiple answers were allowed), 727 female (41%) and 1,242 (71%) from male respondents. The most common responses for both genders were
TYPES OF CYCLING 1,980 responses were received to this question (multiple answers were allowed), 727 female (41%) and 1,242 (71%) from male respondents. The most common responses for both genders were
Outcomes of the Cycling City and Towns programme: monitoring project report
 Outcomes of the Cycling City and Towns programme: monitoring project report Individual town results: Colchester April 2017 Report authors: Andy Cope, Research and Monitoring Unit, Sustrans Angela Kennedy,
The real cycling revolution. How the face of cycling is changing
 The real cycling revolution How the face of cycling is changing Contents Cycling steps up a gear on the National Cycle Network 3 Lower costs, no queues, and free exercise are driving change 4 The National
Queensbury Tunnel. Estimating the economic impact of reopening walking and cycling routes around Queensbury Tunnel. June 2017
 Queensbury Tunnel Estimating the economic impact of reopening walking and cycling routes around Queensbury Tunnel June 2017 About Sustrans Sustrans makes smarter travel choices possible, desirable and
Wayfinding and Walking in London. Lilli Matson Transport for London May 2013
 Wayfinding and Walking in London Lilli Matson Transport for London May 2013 I want to make walking in London as attractive and enjoyable as possible by making walking count Mayor of London Boris Johnson
The case study was drafted by Rachel Aldred on behalf of the PCT team.
 Rotherhithe Case Study: Propensity to Cycle Tool This case study has been written to use the Propensity to Cycle Tool (PCT: www.pct.bike) to consider the impact of a bridge in South-East London between
Douglas Land Use and Transportation Strategy (DLUTS) Summary. August 2013
 Summary. August 2013") Douglas Land Use and Transportation Strategy (DLUTS) Summary August 2013 Background Douglas is a large and popular residential suburb of approximately 30,000 persons on the periphery of Cork City along
Douglas Land Use and Transportation Strategy (DLUTS) Summary August 2013 Background Douglas is a large and popular residential suburb of approximately 30,000 persons on the periphery of Cork City along
What s the issue for transport in Cardiff?
 Demand for travel The number of commuters travelling to work in Cardiff has increased from 190,000 in 2001 to 198,000 in 2010, with some 124,000 Cardiff residents travelling across the city daily to their
Cycle traffic and the Strategic Road Network. Sandra Brown, Team Leader, Safer Roads- Design
 Cycle traffic and the Strategic Road Network Sandra Brown, Team Leader, Safer Roads- Design Highways England A Government owned Strategic Highways Company Department for Transport Road Investment Strategy
This note provides information on the extent of path provision in Scotland and highlights deficiencies in current provision.
 THE PROVISION OF PATHS IN SCOTLAND This note provides information on the extent of path provision in Scotland and highlights deficiencies in current provision. Why are paths important? Paths are important
SUSTAINABLE TRAVEL TOWNS: RESULTS AND LESSONS
 SUSTAINABLE TRAVEL TOWNS: RESULTS AND LESSONS Joe Finlay Sustainable Travel Team Department for Transport (UK) Introduction I will: Give brief background on the Sustainable Travel Towns and the projects
Paper submitted to the Scottish Transport Studies Group (STSG) April 2004
 April 2004") A SURVEY OF TRAVEL BEHAVIOUR IN EDINBURGH Paper submitted to the Scottish Transport Studies Group (STSG) April 2004 Tim Ryley Research Fellow Transport Research Institute Napier University 1. Introduction
A SURVEY OF TRAVEL BEHAVIOUR IN EDINBURGH Paper submitted to the Scottish Transport Studies Group (STSG) April 2004 Tim Ryley Research Fellow Transport Research Institute Napier University 1. Introduction
Promoting Active Travel to School: Progress and Potential
 Promoting Active Travel to School: Progress and Potential Foreword Public Health responsibilities will transfer from the NHS to local authorities over the next four years. As a result, local authorities
ABERDEEN: CITY OF THE FUTURE
 ABERDEEN: CITY OF THE FUTURE A contribution towards discussions on a future transport strategy for Aberdeen and its Region Prepared by the Centre for Transport Research University of Aberdeen June 2010
Cycle journeys on the South-West City Way: a descriptive analysis. Karen McPherson. Glasgow Centre for Population Health
 Cycle journeys on the South-West City Way: a descriptive analysis Karen McPherson Glasgow Centre for Population Health March 2017 Key points: There were 107,000 journeys made using the route during the
Using a Mixed-Method Approach to Evaluate the Behavioural Effects of the Cycling City and Towns Programme
 1 of 25 Using a Mixed-Method Approach to Evaluate the Behavioural Effects of the Cycling City and Towns Programme Kiron Chatterjee (Centre for Transport & Society, UWE) with acknowledgements to research
London Cycle Network Annual Report 2000
 London Cycle Network Annual Report 2000 A cycle network for London by 2005 A cycle network for London by 2005 The London Cycle Network will: provide local links between residential neighbourhoods, railway
Horses on the National Cycle Network
 Horses on the National Cycle Network Technical Information Note No. 28 September 2011 About Sustrans Sustrans makes smarter travel choices possible, desirable and inevitable. We re a leading UK charity
LONG DISTANCE COMMUTING IN SCOTLAND David Connolly Lucy Barker MVA Consultancy
 LONG DISTANCE COMMUTING IN SCOTLAND David Connolly Lucy Barker MVA Consultancy 1. INTRODUCTION This report summarises the results of a study commissioned by the Scottish Executive to investigate long distance
This objective implies that all population groups should find walking appealing, and that it is made easier for them to walk more on a daily basis.
 Walking for life The Norwegian Walking Strategy Guro Berge Norwegian public Roads Administration "Walking for life" is the slogan for the National Walking Strategy that is now being formulated in Norway.
Land Use and Cycling. Søren Underlien Jensen, Project Manager, Danish Road Directorate Niels Juels Gade 13, 1020 Copenhagen K, Denmark
 Land Use and Cycling Søren Underlien Jensen, Project Manager, Danish Road Directorate Niels Juels Gade 13, 1020 Copenhagen K, Denmark suj@vd.dk Summary: Research about correlation between land use and
KEY FINDINGS OF THE INTERIM EVALUATION OF THE SMARTER TRAVEL AREAS PROGRAMME
 Proceedings 1st - 2nd September 2016 BRICK, CANTWELL, SWIFT: Smarter Travel Areas KEY FINDINGS OF THE INTERIM EVALUATION OF THE SMARTER TRAVEL AREAS PROGRAMME Elaine Brick Associate Director AECOM Mairead
Launceston's Transport Futures. Greater travel options for the people of Launceston
 Launceston's Transport Futures Greater travel options for the people of Launceston Final Draft 13 Jan 2014 1 Page Number Executive summary 3 What is Transport Futures? 4 Vision 6 Economy, access and liveability
Regional Cycle Programme Update
 Agenda Item 10 (ii) Regional Cycle Programme Update Glossary Auckland Council Auckland Transport Cycle Action Auckland New Zealand Transport Agency Regional Cycle Network (AC) (AT) (CAA) (NZTA) (RCN) Executive
Local Sustainable Transport Fund
 I II III Sustainable travel in Greater Manchester: The journey to a low carbon economy Greater Manchester has a vision of sustainable commuting at the heart of its blueprint for a low carbon economy, as
TRAVEL TO SECONDARY SCHOOL
 TRAVEL TO SECONDARY SCHOOL A STUDY OF ACTIVE TRAVEL INTERVENTIONS AND INFLUENCES ON TRAVEL CHOICE TO SECONDARY SCHOOLS IN SCOTLAND ABOUT THIS CASE STUDY: This study reviews the background and data trends
Reflections on our learning: active travel, transport and inequalities
 Reflections on our learning: active travel, transport and inequalities Jill Muirie Glasgow Centre for Population Health Active travel definition Active travel refers to walking, cycling or using some other
Loughborough University Travel Planning
 Document Ti tle Client Name Loughborough University Travel Planning Loughborough University Travel Plan Executive Summary 2015-2020 23 December 2015 Loughborough University Travel Planning Project no:
21/02/2018. How Far is it Acceptable to Walk? Introduction. How Far is it Acceptable to Walk?
 21/2/218 Introduction Walking is an important mode of travel. How far people walk is factor in: Accessibility/ Sustainability. Allocating land in Local Plans. Determining planning applications. Previous
The Scottish Collaboration for Public Health Research and Policy; and 20mph speed limits
 The Scottish Collaboration for Public Health Research and Policy; and 20mph speed limits Dr Ruth Jepson and Dr John McAteer Wellington, Jan 2018 SCPHRP* Scottish Collaboration for Public Health Research
Our Cycle Promise. northernrailway.co.uk. Produced in partnership with Sustrans. July 2017
 Our Cycle Promise Produced in partnership with Sustrans July 2017 northernrailway.co.uk Contents Welcome 3 Working with others 4 Making your journey easier 5 to and from your local station 5 at the station
Part 3: Active travel and public transport planning in new housing developments
 1 Linking active travel and public transport to housing growth and planning Part 3: Active travel and public transport planning in new housing developments Active Travel Toolkit Slide Pack July 2017 Linking
Transport Workshop Dearbhla Lawson Head of Transport & Infrastructure Policy & Funding University of the Third Age.
 Transport Workshop Dearbhla Lawson Head of Transport & Infrastructure Policy & Funding University of the Third Age 30 th March 2015 1 Presentation Overview Roles and responsibilities Snapshot of Key Challenges
European Levels of Investment in Cycling: Results and Insights
 Shifting Gears European Levels of Investment in Cycling: Results and Insights UWE, 2 July 2013 Dr Kiron Chatterjee Kiron.Chatterjee@uwe.ac.uk Associate Professor in Travel Behaviour Centre for Transport
Your views are important. Please fill in a form before you leave. Or alternatively
 Drum Property Group is delighted to welcome you to this exhibition which sets out our initial proposals for a mixed-use development at Stead s Place, Edinburgh. We are keen to hear the views of local people
Policy factsheet 2 MOBILITY MANAGEMENT MEASURES FOR SCHOOLS.
 Information for schools boards, officials, regional and national mobility and educational associations Policy factsheet 2 MOBILITY MANAGEMENT MEASURES FOR SCHOOLS The Traffic Snake Game (TSG) is a campaign
Birmingham Connected. Edmund Salt. Transportation Policy Birmingham City Council
 Birmingham Connected Edmund Salt Transportation Policy Birmingham City Council www.birmingham.gov.uk/connected Birmingham Connected the story so far Broadly following EU Guidance We ve done all of this
Staff Travel Survey 2015 Key Findings
 Staff Travel Survey Key Findings Introduction Between February and April, staff were asked to take part in the University of St Andrews Staff Travel Survey. The travel survey has been conducted approximately
Transforming local travel. The benefits of enabling people to walk and cycle for everyday journeys
 Transforming local travel The benefits of enabling people to walk and cycle for everyday journeys Connecting people to places Enabling people to walk and cycle for more of their everyday journeys is good
Travel Plan Monitoring Report. Buttercross Park, Whittlesey - Residential
 Travel Plan Monitoring Report Buttercross Park, Whittlesey - Residential Prepared by: Developer Eyes Property and Estate Management Limited Headlands, Kettering, Northants NN15 6XA Company Registration
Creating liveable and inclusive environments through Street Design. Emily Davie, Sustrans Scotland
 Creating liveable and inclusive environments through Street Design, 1 Introduction When thinking about improving neighbourhoods, a vital but often overlooked element in the design process is involving
Investment in Active Transport Survey
 Investment in Active Transport Survey KEY FINDINGS 3 METHODOLOGY 7 CYCLING INFRASTRUCTURE 8 Riding a bike 9 Reasons for riding a bike 9 Mainly ride on 10 Comfortable riding on 10 Rating of cycling infrastructure
A journey of inspiration and opportunity
 Our vision for women s cycling 2013-2020 1 A journey of inspiration and opportunity Our vision for women s cycling 2013-2020 Supported by 2 A Journey of Inspiration and Opportunity Our vision for women
Outcomes of the Cycling City and Towns programme: monitoring project report
 Outcomes of the Cycling City and Towns programme: monitoring project report Individual town results: Shrewsbury April 2017 Report authors: Andy Cope, Research and Monitoring Unit, Sustrans Angela Kennedy,
The Value of Cycle Tourism
 The Value of Cycle Tourism Opportunities for the Scottish economy SUMMARY REPORT Ivan Zovko June 2013 www.scottishviewpoint.com Executive Summary BACKGROUND, SCOPE AND PURPOSE OF THE REPORT This report
Introducing Bike Life. Forward motion. Our vision for cycling in Edinburgh. There are substantial benefits to Edinburgh from people cycling
 2017 Introducing Bike Life Forward motion Our vision for cycling in As a city, has a strong record of transforming its urban environment to encourage people to walk and cycle for more of the journeys they
Agenda 8. Active Travel progress update. Committee. Strategy and Programmes. Date of meeting 13 June 2014 Date of report 20 May 2014
 Agenda 8 Active Travel progress update Committee Strategy and Programmes Date of meeting 13 June 2014 Date of report 20 May 2014 Report by Assistant Chief Executive (Operations) 1. Object of report To
New Funding Set to Build Safer Routes to Schools in 2014/15
 Safe Routes to schools Issue 23 Scotland New Funding Set to Build Safer Routes to Schools in 2014/15 Walking and cycling to and from school is about to get that little bit easier thanks to Sustrans Scotland
TOWARDS A BIKE-FRIENDLY CANADA A National Cycling Strategy Overview
 TOWARDS A BIKE-FRIENDLY CANADA A National Cycling Strategy Overview NationalCyclingStrategFrameworkv3.indd 1 Potential for this modal shift can be found in municipalities of all sizes, in every population
RESTRICTED ROADS (20 MPH SPEED LIMIT) (SCOTLAND) BILL. 1. Is reducing the speed limit to 20mph the best way of achieving the aims of the Bill?
 (SCOTLAND) BILL. 1. Is reducing the speed limit to 20mph the best way of achieving the aims of the Bill?") RURAL ECONOMY AND CONNECTIVITY COMMITTEE RESTRICTED ROADS (20 MPH SPEED LIMIT) (SCOTLAND) BILL SUBMISSION FROM CYCLE STIRLING Questions 1. Is reducing the speed limit to 20mph the best way of achieving
RURAL ECONOMY AND CONNECTIVITY COMMITTEE RESTRICTED ROADS (20 MPH SPEED LIMIT) (SCOTLAND) BILL SUBMISSION FROM CYCLE STIRLING Questions 1. Is reducing the speed limit to 20mph the best way of achieving
TRAVEL PLAN Charlwood Village Infant School Chapel Road Charlwood Horley Surrey RH6 0DA
 TRAVEL PLAN 2015-2016 Charlwood Village Infant School Chapel Road Charlwood Horley Surrey RH6 0DA www.charlwood.surrey.sch.uk Victoria Lanham Head teacher April 2016 Travel planning policy Management of
RE-CYCLING A CITY: EXAMINING THE GROWTH OF CYCLING IN DUBLIN
 Proceedings ITRN2013 5-6th September, Caulfield: Re-cycling a city: Examining the growth of cycling in Dublin RE-CYCLING A CITY: EXAMINING THE GROWTH OF CYCLING IN DUBLIN Brian Caulfield Abstract In the
CYCLING CHARTER ACTION PLAN EXECUTIVE SUMMARY
 CYCLING CHARTER ACTION PLAN EXECUTIVE SUMMARY THE VISION OF THE CYCLING CHARTER To realise the full potential of cycling s contribution to the health and wealth of the West Midlands creating more sustainable
City of Perth Cycle Plan 2029
 Bicycling Western Australia s response City of Perth Cycle Plan 2029 2012-2021 More People Cycling More Often ABOUT BICYCLING WESTERN AUSTRALIA Bicycling Western Australia is a community based, not-for-profit
Nottingham Cycle City Frequently Asked Questions
 Nottingham Cycle City Frequently Asked Questions About the scheme How much money is to be spent on cycling? And where is the money from? We have 6.1 million in Growth Fund which we will be investing directly
12. School travel Introduction. Part III Chapter 12. School travel
 12. School travel 12.1 Introduction This chapter presents the evidence on changes in travel patterns for the journey to school in the three towns over the period of the Sustainable Travel Town project.
Evaluation. Monitoring and 8.0
 8.0 Monitoring and Evaluation 8.1 Introduction The Cycling Strategy is a dynamic document that will evolve over the 10 year timeframe in line with the changing land-use and transport environment in Lake