GET VICTORIA MOVING. A Super Highway for Melbourne. + Traffic light removal project
|
|
|
- Esther Gibbs
- 5 years ago
- Views:
Transcription
1 GET VICTORIA MOVING A Super Highway for Melbourne - Building an East West Link and a North East Link + Traffic light removal project - Fixing 55 of Melbourne and Geelong s busiest, most congested intersections
2


3 INTRODUCTION A Liberal Nationals Government will build an East West Link and a North East Link to create Australia s biggest Super Highway for Australia s fastest growing city. Melbourne s population is about to hit the 5 million mark. Melbourne is jam- packed. We need to stop playing catch-up with infrastructure and start getting ahead. Only the Liberal Nationals will build an East West Link AND a North East Link, developed in tandem with both expected to be completed in 2026 and 2027 respectively. MATTHEW GUY MP Leader of the Opposition Only the Liberal Nationals will remove traffic lights and roundabouts through grade separations at 55 of Melbourne and Geelong s busiest, most congested intersections. Only the Liberal Nationals will deliver a record number of jobs in the construction of an East West Link, a North East Link and the removal of 55 intersections. Only the Liberal Nationals have a comprehensive congestion-busting plan for Melbourne s highways and arterial roads. Our comprehensive plan for a Super Highway and removing 55 of Melbourne and Geelong s busiest, most congested intersections will mean people like tradies, couriers and salespeople who use the roads to get between jobs, will be able to do so more quickly. That s good for small businesses and good for jobs. Recently released census data shows that 74% of Melburnians drive to work every day. That s why more of Daniel Andrews same band-aid approach won t work and it s why we are offering a clear choice at the next election. PETER WALSH MP Leader of the Nationals The details for our plan for building a new Super Highway and unclogging our arterial roads - the biggest combined congestion-busting project in Australia are laid out in this booklet and can be found on our website www. Yours sincerely, DAVID HODGETT MP Shadow Minister for Roads and Infrastructure MATTHEW GUY MP Leader of the Opposition PETER WALSH MP Leader of the Nationals DAVID HODGETT MP Shadow Minister for Roads and Infrastructure 1
4 2
5 CONTENTS INTRODUCTION...1 THE PROBLEM Population growth...4 Increase in vehicles...5 Congestion...5 People who travel to work by car...7 Peak hours are busier and longer...8 Impact on people...9 Impact on business productivity and jobs...9 The costs to small business...10 A SUPER HIGHWAY...12 Melbourne is jam-packed Building an East West Link...13 Building a North East Link...14 A congestion-busting plan for new highways and suburban arterial roads...15 Jobs and labour capacity...15 Community consultation...15 Productivity and economic growth...15 Decentralising Victoria s population...16 Super Highway estimates...16 A COMPREHENSIVE PLAN TO CUT CONGESTION...20 Easing the squeeze...20 Getting Victoria Moving...20 TRAFFIC LIGHT REMOVAL PROJECT...21 Benefits of trafficlight removals...22 Less congestion...22 Safer local roads...22 More jobs...22 Lower emissions...22 Building cities forthe future...23 MAP OF TRAFFIC LIGHT REMOVALS...24 CASE STUDIES Princes Highway and Springvale Road North Road and Nepean Highway Lower Heidelberg Road and Banksia Street Settlement Road and Barwon Heads Road

6 THE PROBLEM Population growth Latest statistics show Melbourne is overtaking Sydney for the worst traffic congestion in Australia. Unless we take radical action now, traffic congestion is expected to cost Melbourne s economy up to a staggering $10.2 billion a year by Melbourne s crippling traffic congestion is due to our city s unprecedented population growth. Since 2014, Melbourne s total population has surged by over 365,000 people an 8.2% increase. That s the equivalent of the entire population of Canberra moving into Melbourne in just over three years. It s no wonder Melburnians are feeling the pressure of this explosive population growth. Much of this unprecedented growth continues to occur in Melbourne s urban fringe, which exemplifies the type of population pressures our city is facing. For example, since 2001, the population of the City of Casey has increased by 146,936 people (or 81.4%), Cardinia Shire by 55,796 people (119.4%), 5 million Greater Melbourne Population Growth CHART 1 Projected to eclipse 10 million by million 4 million 3.5 million 3 million 2.5 million
7 Melton by 96,392 people (188.8%), and Wyndham by 155,298 people (183.6%), to name but a few. must be well placed to handle this activity as effectively as possible. These figures also show that Melbourne is one of the top ten fastest-growing major cities in the developed world with a growth rate faster than Vancouver, Mexico City, London and New York. Melbourne cannot continue growing at this pace until our roads, transport and services infrastructure catches up. 6 million 5 million 4 million Victorian Registered Motor Vehicles CHART 2 Increase in vehicles Because there s a huge increase in population in recent years, there s also been a corresponding huge increase in the number of vehicles on our roads. Conservative estimates indicate there s an additional 512,000 vehicles on Victoria s roads since 2012 a staggering 11.9% increase. In combination with an additional 4.8 million train and 27.1 million tram passenger trips since 2014, Melbourne s existing transport infrastructure network is now at the point where it struggles to manage its fundamental role of getting people to and from work safely and efficiently, thus impacting upon our city s liveability and economic productivity. When it comes to economic productivity, it is not just about moving everyday Melburnians across the road network in a safe and efficient manner. It is predicted that Victoria s freight task will double by 2050, putting immense pressure on an already clogged network courtesy of more trucks than ever being required to shift goods between the Port of Melbourne and the city s industrial hubs. Indeed, in line with strong population growth, throughput at the Port of Melbourne is expected to continue growing strongly. This will mean a significant increase in the current 10,000 heavy trucks trips a day which are required to service the operations at the port. With the efficient movement of freight being critical to Melbourne s productivity, connectedness and liveability, our road network 3 million 2 million 1 million Congestion The former Liberal Nationals Government built and funded 13 level crossing removals from 2010 to 2014 and that work has continued under the current state Government. The latest round of level crossing removals under the current government has received bipartisan support. The Liberal Nationals also helped pass legislation that provided the funding for this important program. However, congestion remains a massive problem in Melbourne and our regional cities. And with Victoria s population growing by over 100,000 people every year, traffic congestion will continue to get a lot worse unless we invest in much more road and transport infrastructure. Congestion means more time stuck in frustrating traffic which means less time with family and friends and that has a big impact on our quality of life. Congested roads are also very dangerous, especially at busy intersections where a combination of high volumes of vehicles and frustrated drives can be a fatal combination. 5


8 Median Traffic volumes in October 2017 Total Vehicle Movements in a 15 minute period Weekday Weekend CHART 3 Traffic congestion also affects our work lives and means higher running costs for businesses and that means less money to invest in growth and create more jobs. As Chart 3 shows, according to VicRoads data on traffic that passes through major intersections, on an average weekday in October 2017, up to 2.5 million vehicle movements were recorded during the afternoon peak. Peak periods range from 6:30am to 9:30am in the mornings, and from 3:00pm until 6:15pm in the evenings. Source: VicRoads Traffic Signal Volume Data Congestion means more time stuck in frustrating traffic which means less time with family and friends. Outside of the morning and evening peaks, congestion is worse on weekends than it is on weekdays, with VicRoads recording 2 million vehicle movements during the average weekend lunch time peak.that s why the Andrews Government s decision to tear up the East West Link contract at a cost to taxpayers of $1.3 billion to not build the road, makes no sense. If Daniel Andrews hadn t cancelled the East West Link contract, this vital piece of infrastructure would now be nearly built. Before the last election, Daniel Andrews said his $500 million Western Distributor project was shovel ready. But just a few months after the election, it was revealed that the cost had blown-out to $680 million and it wasn t shovel ready, and years away from commencing construction. The Andrews Government then scrapped plans for the Western Distributor and instead accepted an unsolicited bid from Transurban to build the West Gate Tunnel, but to be funded by increasing the 6
9 tolls on the Monash and Tullamarine Freeways. In other words, a road for the western suburbs would be funded by more tolls to be paid by motorists in the northern, the eastern and south-eastern suburbs. Fixing public transport is an important part of building a city for the future. But the fact remains that 1.3 million Melburnians take a car to work every day, according to the most recent Census data. In other words, three quarters of Melburnians take a car to work every single day. People who travel to work by car Three in every four people in Melbourne travel to and from work by car every day. That s over 1.3 million people, and it doesn t include the hundreds of thousands of parents who are also on the road in the same periods doing the school run. As the 2016 ABS census data opposite shows, the Melbourne average of 74% is higher in some LGAs. The City of Casey, in Melbourne s south-east, is one of Australia s biggest growth corridors where nearly 80% of people travel to work by car every day. And while improved public transport services and infrastructure will encourage more patronage, the reality is it s not going to result in a dramatic decline in traffic. LGA 2016 ABS Census - Travel to work Banyule 66.4% Bayside 63.4% Boroondara 57.4% Brimbank 75.1% Cardinia 77.0% Casey 79.2% Darebin 55.7% Frankston 78.5% Glen Eira 61.1% Greater Dandenong 76.8% Hobsons Bay 67.4% Hume 77.0% Kingston 71.5% Knox 78.4% Manningham 71.3% Maribyrnong 56.6% Maroondah 73.7% % of people who travelled to work by car as driver or passenger Melbourne 23.6% Melton 78.2% Monash 68.1% Moonee Valley 63.2% Moorabool 74.1% Moreland 53.2% Nillumbik 73.2% Port Phillip 45.7% Stonnington 47.7% Whitehorse 64.6% Whittlesea 76.9% Wyndham 73.1% Yarra 36.2% 7


10 Peak hours are busier and longer In the last three years alone, peak hour in Melbourne and Geelong s arterial roads have become busier and longer. For example, Chart 4 for the intersection at Springvale and Dandenong Roads from October 2014 to October 2017, shows peak hour traffic has increased by over 50% from 1,000 cars in every 15 minute period to about 1,600. Chart 4 also shows that the current length of peak hour traffic in this particular case study of Springvale and Dandenong Roads, extends by around 30 minutes in daily peak hour traffic compared to October cars passing through this intersection every 15 minutes compared to three years ago. Similarly, at 6:15pm there is also an extra 250 cars every 15 minutes. Springvale Road/Dandenong Road Median Traffic volumes in October 2014 and 2017 Total Vehicle Movements in a 15 minute period CHART 4 But a concerning new trend is that congestion in so-called non-peak periods is rapidly getting worse the fluctuations between peak and nonpeak in terms of the number of vehicles through intersections is becoming shallower. If this trend continues we could see a situation where traffic volumes peak from early morning all through the day to early evening. Another case study, the intersection of North and Warrigal Roads also shows that over the last three years, peak hour traffic is busier and extending for longer, especially in the afternoon peak period. In both daily peak periods, just over 1,500 cars are passing through this intersection every 15 minutes that s 100 cars a minute. Chart 5 shows that at the intersection of North and Warrigal Roads at 6:30am, there are an extra Source: VicRoads Traffic Signal Volume Data We could see a situation where traffic volumes peak from early morning all through the day to early evening. 8

11 North Road/Warrigal Road Median Traffic volumes in October 2014 and 2017 Total Vehicle Movements in a 15 minute period CHART 5 Tradies, couriers, salespeople and many others in jobs that require travel on our roads know that time stuck in traffic congestion means they aren t earning money. Inevitably, that cost is passed onto consumers. It also means that those small and large businesses losing money due to reduced productivity because of traffic congestion often can t afford to expand and employ more staff, or have to cut jobs to cut costs. According to a 2015 report, Traffic and congestion cost trends for Australian capital cities by BITRE, (Chart 4) the cost of congestion to the Victorian economy will be $5.54 billion in The cost to our economy is accelerating at such a pace that in the following two years, that cost will increase by almost another billion dollars. By the end of the next term of government, that annual cost will be a staggering $7.28 billion. Source: VicRoads Traffic Signal Volume Data Impact on people With Victoria s population growing by well over 100,000 every year, there are more cars on the road which means peak hour is getting longer and we are spending more time frustrated in traffic. The impact of increased travel time is being felt across the board. People are leaving for work earlier and getting home later. It s the same for parents who drop their kids off at school later in the morning and pick them up again. It wasn t very long ago that people looked forward to the relatively quiet traffic conditions of weekends. But lately it feels as though weekend traffic is almost as bad as weekday peak. Victorians are wasting hours in congestion every week. That s time that could be better spent with family and friends, enjoying recreational activities to keep mentally and physically active, fit and healthy. Traffic is also more unpredictable than ever. The program to remove level crossings that was started by the previous Liberal Nationals Government and continuing under the current government, is helping to reduce the unpredictability of traffic congestion, but there is still much more to be done. But we can all agree on one thing, that the rate of growth of traffic congestion is unsustainable. Impact on business productivity and jobs Our worsening traffic congestion isn t just impacting on our quality of life, it s costing our economy and it s costing jobs. These aren t just figures on a spread sheet. These are lost jobs and lost opportunities for thousands of Victorian small businesses, tradies, couriers and salespeople. Year 2011 $ $ $ $ $ $ $ $ $ $ $ $ $ $ $ $ $ $ $ $10.19 Cost of Congestion ($ Billions) 9


 By the end of the next term of")
12 The costs to small business For smaller businesses, the costs of transporting goods and services can be the difference between making a profit or a loss. It can be the difference between growth and stagnation. Cost of congestion ($ billions) CHART 6 If courier and road transport costs continue to skyrocket because of worsening congestion, that is going to have a big impact on businesses and jobs in Victoria. Victorians are wasting hours in congestion every week. That s time that could be better spent with family and friends. Source: BITRE Traffic and congestion cost trends for Australian capital cities (2015) By the end of the next term of government, the annual cost of congestion will be a staggering $7.28 billion. 10
13 GET VICTORIA MOVING A Super Highway for Melbourne Building an East West Link and a North East Link 11

14 An East West Link + A North East Link 12

15 A SUPER HIGHWAY A Liberal Nationals Government will build the biggest connected super highway in Australia and get Victoria moving again. A Liberal Nationals Government will build an East West Link AND a North East Link, developed in tandem with both expected to be completed in 2026 and 2027 respectively. Melbourne is jam-packed Melbourne s population is about to hit the 5 million mark and it s growing by over 120,000 people every single year. That s more than the equivalent of the city of Ballarat moving into Melbourne each year. We need to stop playing catch-up with infrastructure and start getting ahead. Recent reports indicate that Melbourne has now taken the mantle as Australia s most congested city and the fifty-eighth most congested city globally. That s why we have a plan for building a new Super Highway and unclogging our arterial roads through the removal of 55 of our busiest intersections - the biggest combined congestionbusting project in Australia. In our first 100 days of government a North East Link Authority will be re-tasked to manage the delivery of both an East West Link and a North East Link. Building an East West Link A Liberal Nationals Government will build an East West Link so we can fix the end of the Eastern Freeway before completing the construction of a North East Link which will put an extra 100,000 more cars on to the Eastern Freeway. Daniel Andrews wants to build his North East Link without fixing the Eastern Freeway and that s a plan for 24 hour gridlock. Previous Labor and Liberal Nationals Governments have recognised the need to complete the missing links in Melbourne s freeway system to transform it into a true continuous orbital network. Since 2008 when the Brumby Labor Governmentcommissioned the East West Link Needs Assessment report, this road has been identified as an essential missing piece of infrastructure to improve passenger vehicle and freight linkages between Melbourne s eastern, northern and western suburbs. Under the Liberal Nationals plan construction on an East West Link will commence in following final determination of the route in consultation with the Office of Projects Victoria. It is expected that construction of an East West Link will be fully completed in
16 Building an East West Link and a North East Link to create Australia s biggest Super Highway for Australia s fastest growing city. City Link Metropolitan Ring Road North East Link East West Link Central route option Southern route option Eastern Freeway West Gate Tunnel Monash Freeway A Liberal Nationals Government will consult with the Office of Projects Victoria on two proposed routes for an East West Link. The first proposed route is through a central corridor broadly connecting from the Eastern Freeway through to CityLink north of the City. The second proposed route is through a southern corridor connecting from the Eastern Freeway through to the Westgate Tunnel. The construction of the West Gate Tunnel makes this southern corridor option a consideration as it otherwise provides for the Western Interchange and integration with CityLink despite the comparatively longer tunnel length to the southern corridor configuration. Daniel Andrews and Labor don t support an East West Link and wasted $1.3 billion of taxpayers money when he tore up the contract after promising voters it wasn t worth the paper it was written on. If an East West Link project went ahead it would now be almost complete and ready for a North East Link to connect to the Eastern Freeway. Building a North East Link In tandem with the construction of an East West Link, a Liberal Nationals Government will continue with the development of a North East Link consistent with the current timeline but including an immediate review to improve the design, including portal location and property acquisitions. The review would also look at consultation work undertaken to address community concerns about the impacts on property, land use and loss of parkland. The recommendations of this review are likely to see changes to improve the current design such as tunnel length, interchange design, property acquisitions and protecting parkland. A Liberal Nationals Government will also assess the current procurement strategy and phasing of key North East Link project components such as staging the procurement to ensure that the project is delivered in an economically responsible way. This will also allow a Liberal Nationals Government to ensure that the staging of a North East Link and an East West Link is economically and logistically efficient. A Liberals National Government will build an East West Link so we can fix the end of the Eastern Freeway before completing the construction of a North East Link which will put an extra 100,000 more cars on to the Eastern Freeway. Daniel Andrews wants to build his North East Link without fixing the Eastern Freeway and that s a plan for 24 hour gridlock. Under the Liberal Nationals plan, both an East West Link and a North East Link would be developed in tandem. 14
17 A congestion-busting plan for new highways and suburban arterial roads Census data shows that 74% of Melburnians take a car to work every day. That s why more of Daniel Andrews and Labor s band-aid approach to roads won t cut it anymore. Only the Liberal Nationals have a comprehensive congestion-busting plan for Melbourne s highways and arterial roads. Only the Liberal Nationals will remove traffic lights and roundabouts through grade separations at 55 of Melbourne and Geelong s busiest, most congested intersections. Only the Liberal Nationals will deliver a record number of jobs in the construction of an East West Link, a North East Link and the removal of 55 congested suburban intersections. Melbourne s population is about to hit the 5 million mark. Melbourne cannot continue growing at this pace until our roads, transport and services infrastructure catches up. Melburnians have never before felt under so much pressure. We are spending more time at work, more time stuck in traffic and less time with family and friends. Traffic congestion makes our roads dangerous for all road users. Traffic congestion costs our economy around $5.54 billion a year. Traffic congestion causes delays and frustrations which means we have less time to spend with family and friends. We can t keep playing this game of infrastructure catch-up. We have no time to lose to start getting ahead. Jobs and labour capacity The Liberal Nationals biggest congestion-busting new highway and arterial road projects in Australian history will create an estimated 19,000 jobs. Under the Andrews Labor Government, Victoria s unemployment rate has been consistently higher than New South Wales. For 18 consecutive months in 2017 and 2018, Victoria s unemployment rate was higher than the national average. The New South Wales economy continues to stride ahead while Victoria remains at the back of the pack weighed down by Daniel Andrews 12 new taxes and over $24 billion in budget blowouts. The Victorian economy needs this sort of turbo-charged superproject to get people out of the unemployment queues and back into work. Consistent with the current North East Link business case, this component of our super-project will create just over 10,300 jobs during construction. Construction of an East West Link will create between 3,500 and 4,500 jobs depending on the final alignment and tunnel length. The traffic light intersection removal project will create an estimated 5,000 jobs. The investments in these projects over construction years will also generate thousands more indirect jobs as well as a significant number of new apprenticeships. These projects will also have significant support for regional Victoria supplying materials for construction such as Benalla and Kilmore. Community consultation In our first 100 days of government the North East Link Authority will be re-tasked to manage the delivery of both an East West Link and a North East Link projects and asked to review the community consultation work undertaken with a particular focus on community concerns about the impacts on property, land use and loss of parkland. In determining the final route for an East West Link, a Liberal Nationals Government will work with the Office of Projects Victoria to assess which option will cut congestion and improve traffic flow, reduce property acquisitions and provide the best value for taxpayers. Assessments will also be made on the best option from an environmental perspective including parkland impacts and consequent cuts in exhaust fumes by removing traffic light intersections. A critical part of that process will include community consultation. Productivity and economic growth A report by the Bureau of Infrastructure, Transport and Regional Economics shows that the cost of congestion in Victoria will be $5.54 billion in
18 By 2022 that annual cost will be a staggering $7.28 billion a year. We have no time to lose. Every year wasted by not building this super-infrastructure will have the effect of putting a handbrake on our economy. There are hundreds of thousands of jobs that are affected by congested roads that impact on productivity. Time stuck in traffic congestion means they aren t earning money. That lost time and the cost of that is passed onto consumers or these small businesses are required to let staff go to keep costs down. In the case of Victorian retailers, transport and courier costs represent a significant component of their business costs. When growing traffic congestion results in higher transport costs, retailers have little choice to either pass on the cost to customers or reduce staff costs. Victorians are already facing enormous cost of living pressures and can t afford to be paying more for goods and services because retailers have to pass on extra freight costs. Cutting traffic congestion with new highways and removing 55 of Melbourne and Geelong s most congested intersections, will result in more efficient transport of goods and services which will boost productivity and keep business costs more competitive and allow businesses to grow and employ more staff. Decentralising Victoria s population The Liberal Nationals plan to ease the squeeze on Melbourne s population growth will improve quality of life for Victorians that spend too much time in congestion and promote economic productivity and growth. health and education services and good job opportunities in the regions. We can t just hope people will want to live and work in the regions, the state government must provide incentives like great jobs, services and infrastructure. Super Highway estimates The Liberal Nationals will allocate at least $2 billion as initial funding from the Victorian Government towards the construction of an East West Link and a North East Link during the next term. It is anticipated that further monies may be needed in future forward estimates. Further funding will be provided by the Australian Government, with contributions of $3 billion and $1.75 billion expected towards an East West Link and a North East Link respectively. Unlike Daniel Andrews and Labor, we will not increase tolls on any existing roads or increase tolls on existing roads, including the Eastern Freeway, to fund the construction of the Super Highway. The final contracting strategy and project staging of both an East West Link and a North East Link will be informed by the Office of Projects Victoria s review and analysis. This will also inform any additional financial contributions from the Victorian Government for build completion. This will ensure that both Links are built efficiently and provide value-for-money for Victorians. The Liberal Nationals vision to manage Melbourne s surging population growth focuses on a growing economy with more and better jobs for the regions, better urban and regional roads and public transport and more health and education services across all of Victoria. Victoria s population has grown by over 400,000 since Daniel Andrews was elected but he still doesn t have a plan to decentralise our population. The Liberal Nationals are committed to creating push and pull factors like better infrastructure, 16

19 We need to stop playing catch-up with infrastructure and start getting ahead. 17

20 18
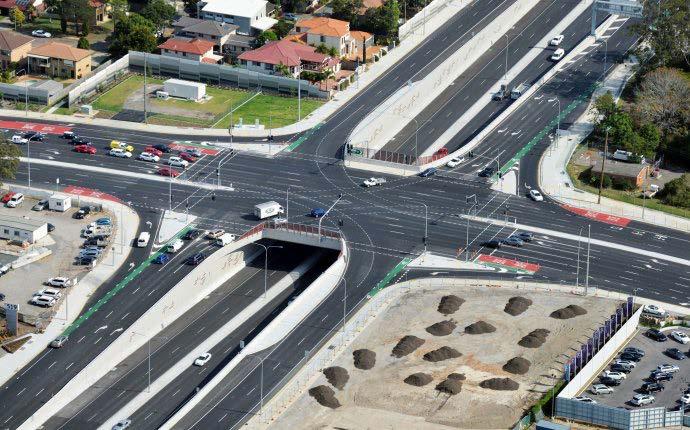
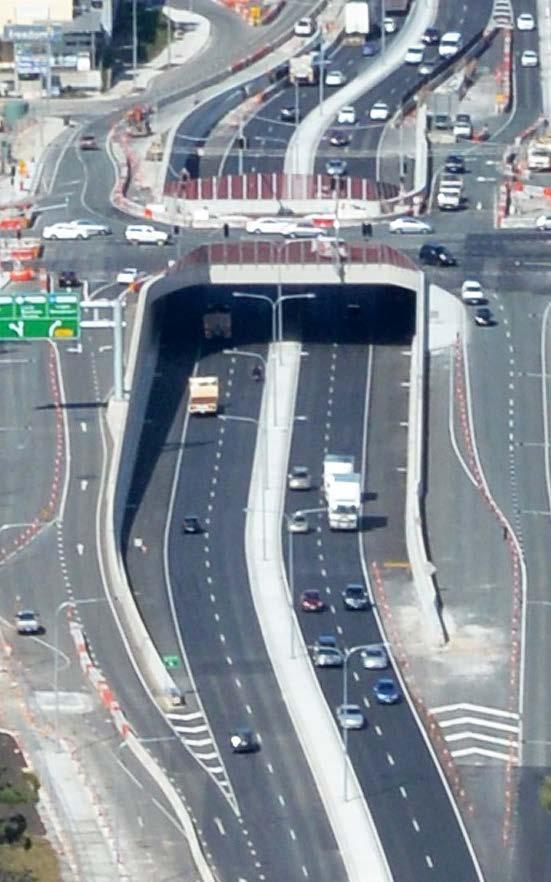
21 GET VICTORIA MOVING Traffic light removal project Fixing 55 of Melbourne and Geelong s busiest, most congested intersections 19
22 A COMPREHENSIVE PLAN TO CUT CONGESTION Removing traffic lights or roundabouts with grade separations at busy and congested intersections Better and more reliable public transport Level crossing removals Traffic signal systems will be modernised to ensure traffic flow is optimised on corridors where intersections are removed Easing the squeeze Bottlenecks on our arterial roads are choking Melbourne and Geelong. That s why I ve developed a new plan to ease the squeeze on our most congested arterial roads. Everyone agrees the removal of level crossings will help to free up Melbourne s traffic congestion, but it s only part of the solution. Another key part is to remove Melbourne s most congested and frustrating traffic intersections, using grade separations. Preference for grade separations will be an underpass construction with consultation with the community, local government and engineering experts, determining the final design. The grade-separation configurations will be a closed diamond model of intersection removal. These will not be freeway style, clover interchanges. As part of this project, traffic signal systems will be modernised to ensure traffic flow is optimised on corridors where intersections are removed. That s why we are committing between $4.1 billion to $5.3 billion to remove traffic lights from 55 of Melbourne s busiest, most congested intersections. Recently released census data shows that 74% of Melburnians take a car to work every day. Despite the level crossing removal program s benefits to traffic along Melbourne s train lines, over one million people continue to sit in gridlocked traffic on other parts of the road network. That means tradies, couriers and salespeople are losing money while sitting in gridlock. It means mums and dads spending more time on their commute and less time at home with their families. Getting Victoria Moving Our Plan will help to fix that. It will ease the squeeze on our roads. it will make our roads safer. It will make our roads more efficient for those who use them to do business. Our plan will create thousands of jobs in the construction phase. It will accommodate Melbourne s ongoing population growth. Itwill help mums and dads get home quicker. And our Plan will get Melbourne and Geelong moving. At the next election, Victorians will have a clear choice. They can choose more of the same from Daniel Andrews or they can choose our comprehensive plan to relieve traffic congestion across the state. There s only one certainty. If you are stuck with Daniel Andrews, you are going to be stuck in traffic. People often comment that Melbourne is a city with 1980 s infrastructure but with a 2017 population. My vision is to make a city with 2050 infrastructure and a 2020 population. Better public transport is important, but as the most recent census data shows, 74% of Melburnians take a car to work every day that s 1.3 million people on the roads travelling to and from work every single day. That number is only going to continue to grow as our population grows. And whilst the bipartisan level crossing removal program is an important tool in the toolbox for decongesting Melbourne traffic, it is only relevant to those roads along the rail corridors. There are many congested suburbs throughout Melbourne and Geelong that will not benefit from level crossing removals. That s why we need a plan that goes much further and builds on the level crossing removals done by the former and current governments. 20

23 To get Melbourne and Geelong traffic flowing again we have a comprehensive plan that includes better and more reliable public transport, new freeway infrastructure like an East West Link, level crossing removals and grade separations at our busiest and most congested intersections. Preference for grade-separations will be an underpass construction with consultation with the community, local government and engineering experts, determining the final design. The grade-separation configurations will be a closed diamond model of intersection removal. These will not be freeway style, clover interchanges. The Liberal Nationals are committed to a comprehensive plan to tackle Melbourne and Geelong s crippling congestion problem. This plan will include finishing the level crossing program that started under the former Liberal Nationals Government and is continuing under the current Government. This multifaceted strategy to cut congestion also includes improving public transport and building new freeways like East West Link. TRAFFIC LIGHT REMOVAL PROJECT for grade separation, which will remove traffic lights and allow arterial roads traffic to flow. Over the next 12 months our team will continue to study the comprehensive VicRoads data as well as working with local communities to identify the remaining 20 of 55 traffic light intersections to be removed. Our consultation process will include listening to local people about their concerns about traffic congestion in their area. We will also be listening to community leaders, stakeholders and third-parties for their insights and ideas. Preference for grade separations will be an underpass construction with consultation with the community, local government and engineering experts, determining the final design. Following consultations, we will continue to announce the details of the remaining 20 locations in addition to the 35 already nominated. As part of this project, traffic signal systems will be modernised to ensure traffic flow is optimised on corridors where intersections are removed The Liberal Nationals team has identified 35 of Victoria s worst and most congested intersections 21
24 Benefits of traffic light removals Less congestion Safer local roads More jobs Productivity and economic growth Building for the future Less congestion Removing Victoria s 55 worst intersections by building grade separation that removes traffic lights will keep traffic flowing and reduce frustrating bottlenecks on arterial roads. Removing traffic lights at these busy intersections through grade separations will significantly cut peak hour travel times for the 74% of Melburnians who take a car to and from work and parents who do the daily school run. Removing our 55 worst intersections will complement the level crossing removals program by significantly reducing traffic bottlenecks across Melbourne. The effect will be faster moving traffic that helps motorists move around the city more efficiently. Safer local roads Removing traffic lights at congested intersections will mean safer roads and reduce the number of accidents and injuries on these busy roads. Congested traffic intersections, particularly where motorists are making left or right turns, are dangerous and sometimes fatal. Many accidents are the result of errors in judging oncoming traffic, or driver frustration caused by congestion. Sadly, in recent years in Victoria there hasn t been the sort of continuing decline in road fatalities that we have seen in recent decades. Whilst there are many reasons for this tragic trend, there is no doubt that congestion and errors caused by driver frustration are a contributing factor. Building more freeways and removing traffic lights at intersections will make our roads safer. More jobs In 2017, Victoria has recorded some of the worst unemployment figures of any state. At the time of this policy launch, Victoria s unemployment rate is 1.1% greater than NSW s. This major infrastructure project is estimated to create around 5,000 new jobs in addition to indirect jobs. Lower emissions There is a direct correlation between heavy traffic congestion, high fuel consumption and emissions. The start and stop nature of heavy traffic congestion on our suburban roads means higher fuel consumption and that means higher emissions. A road network that cuts congestion and ensures more free-flowing traffic, reduces fuel consumption and pollution from emissions.productivity and economic growth A report by BITRE shows that the cost of congestion in Victoria will be $5.54 billion in By the end of the next term of government ( ), that annual cost will be a staggering $7.28 billion a year. That s why we have no time to lose and take decisive action. There are hundreds of thousands of jobs that are affected by congested roads impacting on productivity. Tradies, couriers, salespeople and others that require travel on our roads need to get between jobs efficiently. Time stuck in traffic congestion means they aren t earning money. Inevitably, that cost is passed onto consumers or these small businesses are required to cut jobs to keep costs down. Traffic congestion also results in lost opportunities. Reduced productivity due to traffic congestion prevents small and medium sized businesses from expanding and employing more staff. For Victorian retailers, transport and courier costs 22
25 are a significant proportion of their business costs. When increasing traffic congestion results in higher transport costs, retailers are likely to pass on the cost to customers or reduce staff costs. Cutting traffic congestion will result in more efficient transport of goods and services throughout Melbourne and regional cities which will boost productivity, keep business costs more competitive, and allow businesses to grow and employ more staff. Building cities for the future The Liberal Nationals plan to ease the squeeze on Melbourne s population growth will improve quality of life for Victorians and promote economic productivity and growth. Today, Melbourne s ageing road infrastructure is struggling under the weight of our growing population. We need an ambitious program of road infrastructure construction that will service Melbourne s growing population for tomorrow. This $4.1 billion to $5.3 billion construction and jobs program will remove 55 of our most dangerous and congested suburban intersections. 23

26 MAP OF TRAFFIC LIGHT REMOVALS GET VICTORIA MOVING Traffic light removal project fixing 55 road intersections

27 Traffic Light Removal Program 1 Torquay Road and Settlement Road, Belmont 2 Barwon Heads Road and Settlement Road, Belmont 3 Point Cook Road and Princes Hwy, Point Cook 4 Geelong Road and Somerville Road, West Footscray 5 Ballarat Road and McIntyre Road, Sunshine 6 Ballarat Road and Geelong Road, Footscray 7 Gap Road and Horne Street, Sunbury 11 8 Mickleham Road and Broadmeadows Road, Gladstone Park 9 Sydney Road and Cooper Street, Somerton 10 Sydney Road and Mahoneys Road, Campbellfield 11 Plenty Road and McDonalds Road, South Morang 12 St Georges Road and Bell Street, Preston Albert Street and Bell St, Preston 14 Banksia Street and Lower Heidelberg Road, Heidelberg Fitzsimons Lane and Main Road, Eltham 16 Fitzsimons Lane and Porter Street, Templestowe 17 Williamsons Road and Foote Street, Templestowe 18 Whitehorse Road and Springvale Road, Nunawading Springvale Road and Burwood Hwy, Vermont South 20 Springvale Road and Ferntree Gully Road, Glen Waverley 21 Princes Hwy, Springvale Road and Police Road, Mulgrave Stud Road and Wellington Road, Rowville 23 Princes Hwy and North Road, Clayton Dandenong Road and Warrigal Road, Oakleigh 25 Nepean Hwy and Glenhuntly Road, Elsternwick 26 Nepean Hwy and North Road, Brighton East 27 Nepean Hwy and South Road, Bentleigh 28 Warrigal Road and South Road, Moorabbin 29 Nepean Hwy, Warrigal Road, Lower Dandenong Road, Mentone Boundary Road and Governor Road, Mordialloc 31 Heatherton Road and Hallam Road, Endeavour Hills Racecourse Road and Bald Hill Road, Pakenham 33 Thompsons Road and Western Port Hwy, Lyndhurst 34 Hall Road and Western Port Hwy, Cranbourne West 35 Moorooduc Hwy and Cranbourne Road, Frankston Another 20 intersections will be identified following community consultation and feedback. You can have your say on which intersection you think needs to be fixed at: 25

28 GET VICTORIA MOVING Giving you... More time to spend with family and friends. 26

.")
29 Case Study 1 The intersection of Princes Highway and Springvale Road, Mulgrave Case Study 1 the weekends, see Chart 9. The intersection of Princes Highway and Springvale Road is located in Melbourne's South-East. Throughout October 2017, including weekends, more traffic passed through this intersection than on the average day in October On Fridays, the volume of traffic is more than 80% greater than it was three years ago (Chart 10). Princes Highway/Springvale Road, Mulgrave Number of crashes by year Dangerous Between January 2006 and October 2017, there have been 161 crashes at the Springvale Road & Princes Highway intersection. CHART 5 88 people have been seriously injured in crashes at this intersection in this period and 164 people have received other injuries. Despite ongoing road safety initiatives over the past decade, the number of crashes by year has remained consistent, see Chart 7. Congested Although traffic in the very early morning has decreased through this intersection, peak period congestion has increased substantially, as demonstrated in Chart 10, which shows the average number of vehicles using the intersection in each fifteen-minute period throughout the day, contrasting the average traffic volumes in 2014 (blue) and 2017 (red). Traffic has also substantially increased on 88 people have been seriously injured at this intersection and 164 people have received other injuries. 27
 2014 2017 CHART 9 Princes Highway/Springvale Road Median Traffic")

30 CHART 8 Princes Highway/Springvale Road, Mulgrave Median Traffic volumes in October 2014 and 2017 Total Vehicle Movements in a 15 minute period (weekdays) CHART 9 Princes Highway/Springvale Road Median Traffic volumes in October 2014 and 2017 Total Vehicle Movements in a 15 minute period (weekends) CHART 10 Princes Highway/Springvale Road, Mulgrave Total Daily Traffic in October 2017 Sources: VicRoads Traffic Signal Volume Data 28


31 Case Study 2 The intersection of North Road and Nepean Highway Case Study 2 The intersection of North Road and Nepean Highway is located in Melbourne s South. Dangerous Between January 2006 and October 2017, there have been 24 crashes at the North Road & Nepean Highway intersection. Throughout October 2017, the median daily volume of traffic passing through this intersection was approximately 7% greater than it was three years ago, an increase of more than 2% per year (Chart 14). North Road/Nepean Highway, Gardenvale Number of crashes by year CHART people have been seriously injured in crashes at this intersection in this period and 13 people have received other injuries. Despite ongoing road safety initiatives over the past decade, the number of crashes by year has remained consistent, see Chart 11. Congested As demonstrated in Chart 12, the traffic volumes at this intersection have increased slightly during morning peak, however are much higher throughout the day and in the afternoon peak period. The plot compares the average number of vehicles using the intersection in each fifteenminute period throughout the day, contrasting the average traffic volumes in 2014 (blue) and 2017 (red). Traffic has also increased on the weekends, see Chart people have been seriously injured at this intersection and 13 people have received other injuries. 29

 2014 2017 CHART 14 North Road/Nepean")

32 CHART 12 North Road/Nepean Highway, Gardenvale Median Traffic volumes in October 2014 and 2017 Total Vehicle Movements in a 15 minute period (weekdays) CHART 13 North Road/Nepean Highway, Gardenvale Median Traffic volumes in October 2014 and 2017 Total Vehicle Movements in a 15 minute period (weekends) CHART 14 North Road/Nepean Highway, Gardenvale Total Daily Traffic in October 2017 Sources: VicRoads Traffic Signal Volume Data 30


33 Case Study 3 The intersection of Lower Heidelberg Road & Banksia Street Case Study 3 The intersection of Lower Heidelberg Road and Banksia Street is located in Melbourne s inner North-East. Lower Heidelberg Road/Banksia Street, Heidelberg Number of crashes by year CHART 15 Dangerous Between January 2006 and October 2017, there have been 38 crashes at the Lower Heidelberg Road & Banksia Street intersection. 13 people have been seriously injured in crashes at this intersection in this period and 42 people have received other injuries. Congested As demonstrated in Chart 16, the traffic volumes at this intersection have increased slightly during morning peak and afternoon peak, and are higher throughout the day. The plot compares the average number of vehicles using the intersection in each fifteen-minute period throughout the day, contrasting the average traffic volumes in 2014 (blue) and 2017 (red). The volume of traffic was also higher on weekends during October, compared to three years ago, see Chart 17. Throughout October 2017, the median daily volume of traffic passing through this intersection was approximately 5.3% greater than it was three years ago (Chart 18). 13 people have been seriously injured at this intersection and 42 people have received other injuries. 31
 2014 2017 CHART 18 Lower Heidelberg Road/Banksia Street,")
34 CHART 16 Lower Heidelberg Road/Banksia Street, Heidelberg Median Traffic volumes in October 2014 and 2017 Total Vehicle Movements in a 15 minute period (weekdays) CHART 17 Lower Heidelberg Road/Banksia Street, Heidelberg Median Traffic volumes in October 2014 and 2017 Total Vehicle Movements in a 15 minute period (weekends) CHART 18 Lower Heidelberg Road/Banksia Street, Heidelberg Total Daily Traffic in October 2017 Sources: VicRoads Traffic Signal Volume Data 32


35 Case Study 4 The intersection of Settlement & Barwon Heads Roads Case Study 4 The intersection of Settlement and Barwon Heads Roads is located in Geelong. Settlement Road/Barwon Heads Road, Belmont Number of crashes by year CHART 19 Dangerous Between January 2006 and October 2017, there have been 49 crashes at the Settlement & Barwon Heads Roads intersection. 16 people have been seriously injured in crashes at this intersection in this period and 50 people have received other injuries. Congested As demonstrated in Chart 20, the traffic volumes at this intersection have increased slightly during morning peak and afternoon peak, and are higher throughout the day. The plot compares the average number of vehicles using the intersection in each fifteen-minute period throughout the day, contrasting the average traffic volumes in 2014 (blue) and 2017 (red). Throughout October 2017, the median daily volume of traffic passing through this intersection was approximately 4% greater than it was three years ago. 16 people have been seriously injured at this intersection and 50 people have received other injuries. 33
 2014 2017 CHART 21 Settlement Road/Barwon Heads Road, Belmont Median")

36 CHART 20 Settlement Road/Barwon Heads Road, Belmont Median Traffic volumes in October 2014 and 2017 Total Vehicle Movements in a 15 minute period (weekdays) CHART 21 Settlement Road/Barwon Heads Road, Belmont Median Traffic volumes in October 2014 and 2017 Total Vehicle Movements in a 15 minute period (weekends) CHART 22 Settlement Road/Barwon Heads Road, Belmont Total Daily Traffic in October 2017 Sources: VicRoads Traffic Signal Volume Data 34

37 GET VICTORIA MOVING Giving you... More time for the next job. 35
38 36


39 37
40 For more information go to Office of the Leader of the Opposition Level 1, 157 Spring Street, Melbourne Victoria 3002 Authorised and printed by N Demiris, 104 Exhibition Street, Melbourne Victoria 3000.
Your club and Tennis Victoria Growing the game together
 Your club and Tennis Victoria Growing the game together Message from the CEO It s been an exciting period of growth for tennis in Victoria. The game changing new affiliation model introduced in 2014/15
30 years of travel in Melbourne: 1978/79 and 2007/08
 Australasian Transport Research Forum 2011 Proceedings 28 30 September 2011, Adelaide, Australia Publication website: http://www.patrec.org/atrf.aspx 30 years of travel in Melbourne: 1978/79 and 2007/08
2. Context. Existing framework. The context. The challenge. Transport Strategy
 Transport Strategy Providing quality connections Contents 1. Introduction 2. Context 3. Long-term direction 4. Three-year priorities 5. Strategy tree Wellington City Council July 2006 1. Introduction Wellington
2015 Victorian Road Trauma. Analysis of Fatalities and Serious Injuries. Updated 5 May Page 1 of 28. Commercial in Confidence
 2015 Victorian Road Trauma Analysis of Fatalities and Serious Injuries Updated 5 May 2016 Page 1 of 28 Commercial in Confidence VICROADS_n3445896_2015_Victorian_Trauma_Report_- _updated_may_2016.docx 2015
KEEPING METRO TRAFFIC MOVING
 KEEPING METRO TRAFFIC MOVING A STRONG PLAN FOR REAL CHANGE 1 We re ready. Over the last four years, we ve been working hard developing our vision for the future of South Australia. Not just policies, but
Mobility and Congestion
 Technical Memorandum Mobility and Congestion Prepared for: Prepared by: September 25, 2013 1 Table of Contents 1. Introduction... 1 2. Congestion Forecasting Process... 1 2.1 Mobility and Congestion Terms...
Congestion Evaluation Best Practices
 Congestion Evaluation Best Practices Todd Litman Victoria Transport Policy Institute Presented International Transportation and Economic Development Conference 10 April 2014 Congestion Indicators Indicator
Capital Beltway HOT Lanes - Frequently Asked Questions
 Capital Beltway HOT Lanes - Frequently Asked Questions December 20, 2007 1. What is the cost of the project? The fixed-price design-build cost is approximately $1.4 billion. 2. Why have the project costs
HAMILTON BIKING PLAN OUR VISION: A BIKE FRIENDLY CITY
 HAMILTON BIKING PLAN 2015-2045 OUR VISION: A BIKE FRIENDLY CITY INTRODUCTION Biking as a travel option is experiencing a resurgence internationally and in New Zealand, growing as a familyfriendly and healthy
Progress with the Road Investment Strategy
 Report by the Comptroller and Auditor General Department for Transport and Highways England Progress with the Road Investment Strategy HC 1056 SESSION 2016-17 22 MARCH 2017 4 Key facts Progress with the
West Tamar Highway Priority Upgrades
 West Tamar Highway Priority Upgrades A MAJORITY LIBERAL GOVERNMENT WILL: Reconstruct and widen a number of sections along the West Tamar Highway Construct overtaking lanes in both directions north of Exeter
Public Transport Congestion Relief Measurement A New Framework and Its Impacts (8)
") Australasian Transport Research Forum 2015 Proceedings 30 September - 2 October 2015, Sydney, Australia Publication website: http://www.atrf.info/papers/index.aspx Public Transport Congestion Relief Measurement
Australasian Transport Research Forum 2015 Proceedings 30 September - 2 October 2015, Sydney, Australia Publication website: http://www.atrf.info/papers/index.aspx Public Transport Congestion Relief Measurement
Planning Daily Work Trip under Congested Abuja Keffi Road Corridor
 ISBN 978-93-84468-19-4 Proceedings of International Conference on Transportation and Civil Engineering (ICTCE'15) London, March 21-22, 2015, pp. 43-47 Planning Daily Work Trip under Congested Abuja Keffi
REDUCING ACCIDENTS MEANS SAVING LIVES.
 REDUCING ACCIDENTS MEANS SAVING LIVES. "Almost 3500 people lose their lives on the world's roads every single day. It's a shocking figure. We can raise road safety standards significantly, and save lots
AUTOMATED AND ZERO EMISSION VEHICLES HOW THEY MIGHT RESHAPE OUR STREETS
 AUTOMATED AND ZERO EMISSION VEHICLES HOW THEY MIGHT RESHAPE OUR STREETS STURT ST BALLARAT WATERGARDENS TAYLORS LAKES SIMPSON ST YARRAVILLE CHAPEL ST SOUTH YARRA RINGWOOD STATION MONASH FREEWAY SA NSW VIC
Estimated community value of Melbourne s bus services,
 News. Evidence. Opportunities. Cost Effective. Demand Responsive. Issue 04. March 2011 A new bus lane on Wellington Road is making buses more reliable and cutting peak period travel time by up to 8 minutes.
21.07 TRANSPORT CONNECTIVITY AND INFRASTRUCTURE
 21.07 TRANSPORT CONNECTIVITY AND INFRASTRUCTURE 21.07-1 Connectivity and Choice Transport connectivity and mode choice are critical to achieving productive, sustainable and socially just cities. Travel
Typical Rush Hour Commute. PennyforTransportation.com
 Typical Rush Hour Commute In the News Overview of the Plan Collaborative plan with projects in every community Prioritizing connectivity and congestion relief Dedicated transportation-specific funding;
FACTS AND FIGURES: MAKING THE CASE FOR COMPLETE STREETS IN LEE COUNTY
 FACTS AND FIGURES: MAKING THE CASE FOR COMPLETE STREETS IN LEE COUNTY Safety: Close to 5,000 pedestrians and bicyclists die each year on U.S. roads, and more than 70,000 are injured. [Mean Streets, Surface
Active travel and economic performance: A What Works review of evidence from cycling and walking schemes
 1 Making the economic case for active travel Active travel and economic performance: A What Works review of evidence from cycling and walking schemes Active Travel Toolkit Slide Pack July 2017 Active travel
The Region s Most Expensive Commutes:
 The Region s Most Expensive Commutes: Congested Corridors in the Lehigh Valley-Reading Area and Steps Needed to Relieve Traffic Congestion June 2013 Washington, DC Phone: (202) 466-6706 www.tripnet.org
Improving Melbourne for wheels, paws and feet
 Improving Melbourne for wheels, paws and feet September 208 Authorised and published by the Victorian Government, Treasury Place, Melbourne Greensborough Road walking and cycling paths. Artist impression
Findings on the Effectiveness of Intersection Treatments included in the Victorian Statewide Accident Black Spot Program
 Findings on the Effectiveness of Intersection Treatments included in the Victorian Statewide Accident Black Spot Program Nimmi Candappa, Jim Scully, Stuart Newstead and Bruce Corben, Monash University
MOBILITY RESULTS AREA. Budgeting For Outcomes Council Presentation January 12, 2007
 MOBILITY RESULTS AREA Budgeting For Outcomes Council Presentation January 12, 2007 Mobility Results Team Members 2 Hammond Perot, OED, Co-Team Leader Bonnie Meeder, DEV (returning), Co-Team Leader Peer
saving lives SWARCO The Better Way. Every Day.
 Reducing Accidents means saving lives SWARCO The Better Way. Every Day. Shutterstock REDUCING ACCIDENTS MEANS SAVING LIVES Almost 3500 people lose their lives on the world's roads every single day. It's
Men s State League Structures 2019
 Men s State League Structures 2019 LEAGUE 1 FFA Cup Entry: Round 3-9 March* Men's State League 1 North-West Men's State League 1 South-East Altona City SC Beaumaris SC Banyule City SC Casey Comets FC MSL2NW
Highway 217 Corridor Study. Phase I Overview Report
 Highway 217 Corridor Study Phase I Overview Report November 3, 24 BACKGROUND AND OVERVIEW Study purpose The Highway 217 Corridor Study is developing multi-modal transportation solutions for traffic problems
Transportation Master Plan Advisory Task Force
 Transportation Master Plan Advisory Task Force Network Alternatives & Phasing Strategy February 2016 BACKGROUND Table of Contents BACKGROUND Purpose & Introduction 2 Linking the TMP to Key Council Approved
ROAD SAFETY PRIORITIES AUSTRALIAN AUTOMOBILE ASSOCIATION ELECTION 2016
 ROAD SAFETY PRIORITIES AUSTRALIAN AUTOMOBILE ASSOCIATION ELECTION 2016 CONTENTS A CONTINUING TRAGEDY ON OUR ROADS 3 ROAD SAFETY IMPORTANT FOR THE ECONOMY AND THE COMMUNITY 4 SAFER ROADS A LONG-TERM AND
Improving Mobility Without Building More Lanes
 Improving Mobility Without Building More Lanes By Mike Salisbury and Will Toor July 2017 Copyright 2017 by Southwest Energy Efficiency Project. All rights reserved. Photo: Courtesy of the Denver Post Anyone
Take the Bus. Project Proposal AUSTRALIA. Bus Industry Confederation. Take the Bus. Bus Australia Network WARTA. BusS. Bus & Coach Association SA
 Project Proposal Bus Industry Confederation Bus Australia Network BusS Bus & Coach Association SA WARTA Bus Australia Network BusS Bus & Coach Association SA 2 Project Proposal Bus Industry Confederation
1 Croydon 1 2 Clayton 1 3 Yarraville Footscray 1 4 Mitcham 1 5 Essendon 1 6 Altona 1 7 MCC 1 8 Mentone 1 9 Melbourne 1 10 Bundoora RSL 1
 TAYLOR BOWLS PREMIER DIVISION 1 Croydon 1 2 Clayton 1 3 Yarraville Footscray 1 4 Mitcham 1 5 Essendon 1 6 Altona 1 7 MCC 1 8 Mentone 1 9 Melbourne 1 10 Bundoora RSL 1 DIVISION 1 1 Altona Sports 1 1 Yarra
Cycling for the Future A Fresh Approach for WA
 WA LABOR Cycling for the Future A Fresh Approach for WA WA Labor Policy February 2017 CYCLING FOR As a father of three young children in Rockingham, I know how enjoyable cycling can be for WA families.
Bristol City Council has produced a draft Bristol Transport Strategy document.
 Bristol Transport Strategy Summary Document Introduction Bristol City Council has produced a draft Bristol Transport Strategy document. The Strategy fills a gap in transport policy for Bristol. We have
New Seward and 36 th Avenue Intersection Conceptual Design
 University of Alaska Anchorage New Seward and 36 th Avenue Intersection Conceptual Design Prepared By: Zaid S. Hussein Dana Menendez Galen Jones Civil Engineering Department Prof. Osama Abaza CE A404 Highway
Measuring the Distribution and Costs of Congestion. Tim Lomax Texas Transportation Institute
 Measuring the Distribution and Costs of Congestion Tim Lomax Texas Transportation Institute http://mobility.tamu.edu The Congestion Measurement Story Travel time, variations, compare to goals WHAT? WHY?
20mph. We want to make Edinburgh a better and safer place to live, work and play.
 20mph CREATING A BETTER SAFER EDINBURGH We want to make Edinburgh a better and safer place to live, work and play. That s why on 13 January 2015 Councillors approved a new speed limit network for Edinburgh
Melbourne Transport Strategy
 Melbourne Transport Strategy Submission from the Public Transport Users Association Inc. 30 September 2005 Public Transport Users Association Inc. 247 Flinders Lane Melbourne VIC 3000 Ph: 03 9650 7898
NETBALL VICTORIA. Statewide Facilities Strategy
 NETBALL VICTORIA Statewide Facilities Strategy Netball remains the most popular team sport for girls and women in Australia, and participation numbers continue to rise. Foreword Netball remains the most
Living Streets response to the Draft London Plan
 Living Streets response to the Draft London Plan Contents Living Streets response to the Draft London Plan... 1 About Living Streets... 2 Summary... 2 Consultation response... 3 Chapter 1: Planning London
FUTURE MOBILITY IN TEXAS: The Cost of Meeting the State s Need for Safe and Efficient Mobility
 FUTURE MOBILITY IN TEXAS: The Cost of Meeting the State s Need for Safe and Efficient Mobility OCTOBER 2012 202-466-6706 www.tripnet.org Founded in 1971, TRIP, of Washington, DC is a nonprofit organization
Community engagement guide May 2018
 Community engagement guide May 2018 Greater Wellington Regional Council (GWRC), Hutt City Council (HCC) and the New Zealand Transport Agency (NZTA) are working together to achieve some big improvements
Purpose and Need. Chapter Introduction. 2.2 Project Purpose and Need Project Purpose Project Need
 Chapter 2 Purpose and Need 2.1 Introduction The El Camino Real Bus Rapid Transit (BRT) Project (Project) would make transit and other transportation improvements along a 17.6-mile segment of the El Camino
ABERDEEN: CITY OF THE FUTURE
 ABERDEEN: CITY OF THE FUTURE A contribution towards discussions on a future transport strategy for Aberdeen and its Region Prepared by the Centre for Transport Research University of Aberdeen June 2010
Speed Limits in the Hoddle Grid
 Speed Limits in the Hoddle Grid Recent History of speed limits March 2013 Docs # 7738485 1 Introduction Muncipalities have power to Erect speed limit signs BUT Municipalities DO NOT have the power to approve
Cycling and Walking Investment Strategy & Local Cycling and Walking Infrastructure Plans
 Cycling and Walking Investment Strategy & Local Cycling and Walking Infrastructure Plans 1 Investing in cycling and walking contributes to a broad range of cross-cutting policy objectives Cycling and walking
Transport Priorities
 Transport Priorities Contents Page What is the Eastern Transport Coalition? 3 Investing in the East is investing in Victoria 4 P riorities 5 Projects Train and Tram 7-14 Bus 15-19 Roads 20-24 Walking and
Appendix T 1: Additional Supporting Data
 Appendix T 1: Additional Supporting Data Project Delivery Delays with the implementation of the 2000 TIP became apparent early in the decade. In response to direction among policy officials, ARC began
Berwick Health and Education Precinct: Casey Amendment C207 (Part 1) Submission to Planning Panels Victoria
 Submission to Planning Panels Victoria") Berwick Health and Education Precinct: Casey Amendment C207 (Part 1) Submission to Planning Panels Victoria August 2018 CONTENTS 1 Executive summary... 1 2 Summary of the amendment... 2 3 Submission...
Berwick Health and Education Precinct: Casey Amendment C207 (Part 1) Submission to Planning Panels Victoria August 2018 CONTENTS 1 Executive summary... 1 2 Summary of the amendment... 2 3 Submission...
CONGESTED LOS ANGELES
 CONGESTED LOS ANGELES Prepared For: Mayor Antonio Villaraigosa and City Council City of Los Angeles Prepared By: Jacki Murdock Transportation Analyst LADOT December 11 th, 2011 Outline What causes congestion?
WINNIPEG S PERIMETER HIGHWAY: DISASTER BY DESIGN
 (FB042) SEPTEMBER 2006 WINNIPEG S PERIMETER HIGHWAY: DISASTER BY DESIGN Executive Summary Winnipeg is the only major urban area in the developed world without freeways. Although they are unpopular with
Nottingham Cycle City Frequently Asked Questions
 Nottingham Cycle City Frequently Asked Questions About the scheme How much money is to be spent on cycling? And where is the money from? We have 6.1 million in Growth Fund which we will be investing directly
TOWARDS A BIKE-FRIENDLY CANADA A National Cycling Strategy Overview
 TOWARDS A BIKE-FRIENDLY CANADA A National Cycling Strategy Overview NationalCyclingStrategFrameworkv3.indd 1 Potential for this modal shift can be found in municipalities of all sizes, in every population
2.2 TRANSIT VISION 2040 FROM VISION TO ACTION. Emphasize transit priority solutions STRATEGIC DIRECTION
 TRANSIT VISION 2040 FROM VISION TO ACTION TRANSIT VISION 2040 defines a future in which public transit maximizes its contribution to quality of life with benefits that support a vibrant and equitable society,
London Cycle Network Annual Report 2000
 London Cycle Network Annual Report 2000 A cycle network for London by 2005 A cycle network for London by 2005 The London Cycle Network will: provide local links between residential neighbourhoods, railway
PEDALING FORWARD. A Glance at the SFMTA s Bike Program for SFMTA.COM
 PEDALING FORWARD A Glance at the SFMTA s Bike Program for 2017-2021 SFMTA.COM INTRODUCTION About This Booklet More people from all walks of life see their bicycle as a more convenient way to get where
Current Travel Needs and Operating Conditions (See pages 4 9 of the Discussion Guide)
") Phase 1 Consultation: Understanding the Need Feedback Form Thank you for participating in this phase of planning for the George Massey Tunnel Replacement. Your feedback is important to us. Input received
Phase 1 Consultation: Understanding the Need Feedback Form Thank you for participating in this phase of planning for the George Massey Tunnel Replacement. Your feedback is important to us. Input received
Submission Cover Sheet Mordialloc Bypass Project EES IAC
 Submission Cover Sheet Mordialloc Bypass Project EES IAC 61 Request to be heard?: yes Full Name: Organisation: Affected property: Attachment 1: Attachment 2: Attachment 3: Comments: Lucinda Bertram Aspendale
These draft test specifications and sample items and other materials are just that drafts. As such, they will systematically evolve over time.
 t h e redesigned sat These draft test specifications and sample items and other materials are just that drafts. As such, they will systematically evolve over time. These sample items are meant to illustrate
Governor s Transportation Vision Panel
 Office of Governor Kate Brown Governor s Transportation Vision Panel JLA Public Involvement Project Overview The is a yearlong effort to develop a series of recommendations for the Governor that address
WILMAPCO Public Opinion Survey Summary of Results
 Wilmington Area Planning Council WILMAPCO Public Opinion Survey Summary of Results Prepared by: 2955 Valmont Road, Suite 300 Boulder, Colorado 80301 t: 303-444-7863 f: 303-444-1145 www.n-r-c.com Table
Congestion Management Report
 Congestion Management Report F.E. EVERETT TURNPIKE (NORTH), MERRIMACK Segment Length: 7.0 miles Daily Traffic Volumes: 60,000-69,000 Analysis Period: May 2015 Number of Traffic Signals: 0 Number of travel
# Southeastern Wisconsin Regional Freeway System Reconstruction Study and Preliminary Recommended Plan
 #70421 Southeastern Wisconsin Regional Freeway System Reconstruction Study and Preliminary Recommended Plan Public Information Meetings and Hearings May June 2002 1 Reason for Freeway System Study 270-mile
Auckland Council: Electric bicycle CBD trial
 Auckland Council: Electric bicycle CBD trial This business case has been written to support the purchase of electric bicycles (ebikes) as a trial for business travel by staff at Auckland Council s CBD
Konstantin Glukhenkiy Economic Affairs Officer
 Konstantin Glukhenkiy Economic Affairs Officer Rapid growth of urban areas Very rapid increase in motorisation Substantial increases in traffic congestion Relative decline of public transport usage and
McKenzie Interchange Project Fall 2015 Engagement. Appendix 2: Engagement Materials and Feedback Form
 Fall 2015 Engagement Appendix 2: Engagement Materials and Feedback Form Welcome to the McKenzie Interchange Project Open House! Purpose of Open House To provide you with information regarding the project
BUS RAPID TRANSIT. A Canadian Perspective. McCormick Rankin International. John Bonsall P.Eng
 BUS RAPID TRANSIT A Canadian Perspective Why choose BRT? Because it is a practical and cost effective rapid transit solution for the most common types of land use in urban Canada Operating experience shows
Transit Priority Program: Putting Buses First
 Case Studies in Sustainable Transportation OTTAWA, ONTARIO CASE STUDY 1 Transit Priority Program: Putting Buses First Organization City of Ottawa Transportation, Utilities and Public Works Department Status
City of Perth Cycle Plan 2029
 Bicycling Western Australia s response City of Perth Cycle Plan 2029 2012-2021 More People Cycling More Often ABOUT BICYCLING WESTERN AUSTRALIA Bicycling Western Australia is a community based, not-for-profit
Traffic Congestion in Houston. Presented by Bill King
 Traffic Congestion in Houston Presented by Bill King www.billkinghouston.com The Travel Time Index Defined 1.36 30 Minute Trip = 41 Minute Trip (+ 36%) The History of Congestion in Houston Growing Congestion
A127/A130 Fairglen Interchange Improvement Schemes. Information Leaflet February 2017
 A127/A130 Fairglen Interchange Improvement Schemes Information Leaflet February 2017 1 2 Foreword By Councillor Kevin Bentley Essex is continuing to grow as a vibrant economic hub and as a fantastic place
PRELIMINARY DRAFT FIRST AMENDMENT TO VISION 2050: A REGIONAL LAND USE AND TRANSPORTATION PLAN FOR SOUTHEASTERN WISCONSIN
 PRELIMINARY DRAFT FIRST AMENDMENT TO VISION 2050: A REGIONAL LAND USE AND TRANSPORTATION PLAN FOR SOUTHEASTERN WISCONSIN ESTABLISHING TARGETS FOR FEDERAL PERFORMANCE MEASURES: HIGHWAY SAFETY SOUTHEASTERN
Investment in Active Transport Survey
 Investment in Active Transport Survey KEY FINDINGS 3 METHODOLOGY 7 CYCLING INFRASTRUCTURE 8 Riding a bike 9 Reasons for riding a bike 9 Mainly ride on 10 Comfortable riding on 10 Rating of cycling infrastructure
Memorandum. Fund Allocation Fund Programming Policy/Legislation Plan/Study Capital Project Oversight/Delivery Budget/Finance Contract/Agreement Other:
 Memorandum Date: November 20, 2017 To: Transportation Authority Board From: Eric Cordoba Deputy Director Capital Projects Subject: 12/5/17 Board Meeting: San Francisco Freeway Corridor Management Study
PERFORMANCE ANALYSIS of The Draft 2015 CLRP
 Item 9 PERFORMANCE ANALYSIS of The Draft CLRP Presentation to the Transportation Planning Board September 16, CLRP Performance Analysis 1 What is the Long-Range Transportation Plan (CLRP)? The CLRP identifies
Report to Cabinet. 18 May 2016
 Agenda Item 8 Report to Cabinet 18 May 2016 Subject: Presenting Cabinet Member: Proposed CCTV Enforcement of Traffic Contraventions in a Bus Lane (Key Decision Ref. No. HE030) Highways and Environment
Welcome to the McKenzie Interchange Project Open House!
 Welcome to the McKenzie Interchange Project Open House! Purpose of Open House To provide you with information regarding the project and for you to have the opportunity to share your input on design concepts.
Crash Patterns in Western Australia. Kidd B., Main Roads Western Australia Willett P., Traffic Research Services
 Crash Patterns in Western Australia Kidd B., Main Roads Western Australia Willett P., Traffic Research Services Abstract Examination of crash patterns is one way of identifying key factors on which focus
AUTOMATED AND ZERO EMISSION VEHICLES HOW THEY MIGHT RESHAPE OUR STREETS
 AUTOMATED AND ZERO EMISSION VEHICLES HOW THEY MIGHT RESHAPE OUR STREETS BACKGROUND: This study is a collaboration between Urban Circus (Visualisation) and Ethos Urban (Urban Design) Ideas were workshopped
Welcome! San Jose Avenue Open House August 25, 2015
 Welcome! San Jose Avenue Open House August 25, 2015 Vision Zero The City and County of San Francisco adopted Vision Zero San Francisco Vision Zero High Injury Network as a policy in 2014, committing an
Regional Transportation Needs Within Southeastern Wisconsin
 Regional Transportation Needs Within Southeastern Wisconsin #118274 May 24, 2006 1 Introduction The Southeastern Wisconsin Regional Planning Commission (SEWRPC) is the official areawide planning agency
BICYCLE NETWORK CRASH REPORT
 BICYCLE NETWORK CRASH REPORT 2012-2016 Prepared July 2017 1. Executive Summary With more than 50,000 members, Bicycle Network is Australia s largest bike riding organisation. Through our advocacy, membership,
North American Forging Shipment Forecast (Using FIA bookings information through December 2013)
") North American Forging Shipment Forecast 2014-2018 (Using FIA bookings information through December 2013) Percent Change Year Ago Best leading indicator combination for impression die bookings used to
North American Forging Shipment Forecast 2014-2018 (Using FIA bookings information through December 2013) Percent Change Year Ago Best leading indicator combination for impression die bookings used to
Congestion Management in Singapore. Assoc Prof Anthony TH CHIN Department of Economics National University of Singapore
 Congestion Management in Singapore Assoc Prof Anthony TH CHIN Department of Economics National University of Singapore anthonychin@nus.edu.sg Introduction 2 Introduction and What is Traffic Congestion?
Corporate. Report COUNCIL DATE: June 26, 2006 NO: C012 COUNCIL-IN-COMMITTEE. TO: Mayor & Council DATE: June 22, 2006
 Corporate NO: C012 Report COUNCIL DATE: June 26, 2006 COUNCIL-IN-COMMITTEE TO: Mayor & Council DATE: June 22, 2006 FROM: General Manager, Engineering FILE: 0410-20(MoT/Gate) SUBJECT: Surrey Response on
WELCOME TO OPEN HOUSE # 1 June 14, 2017
 Langstaff Road Weston Road to Highway 7 Class Environmental Assessment Study WELCOME TO OPEN HOUSE # 1 June 14, 2017 Please sign in and join our mailing list Purpose of Open House #1 & Study Area York
9. Parking Supporting Statement
 9. Parking Supporting Statement Content 1. Setting the Scene 2. Vision 3. Parking and the Shared Priorities 4. Issues 5. Delivery Programme in the first Plan Period 2001/02 2005/06 6. Good Practice 7.
BANYULE BICYCLE STRATEGY
 BANYULE BICYCLE STRATEGY 2010 2020 BANYULE BICYCLE STRATEGY 2010-2020 1 Contents 1. Introduction 6 1.1 Banyule City Plan 6 1.2 Banyule Integrated Transport Strategy 7 1.3 North East Integrated Transport
Regional Cycling Plan
 Adopted December 2008 Quality for Life Adopted December 2008 For more information, contact: Greater Wellington 142 Wakefield Street PO Box 11646 Manners Street Wellington 6142 T 04 384 5708 F 04 385 6960
Victorian Country Racecourse and Training Facilities Infrastructure Plan. For the three year period 2015/16 to 2017/18
 Victorian Country Racecourse and Training Facilities Infrastructure Plan For the three year period 2015/16 to 2017/18 Overview Executive Summary The need to develop a plan which provides for efficient
INNOVATIVE INTERSECTION DESIGN
 INNOVATIVE INTERSECTION DESIGN J. Eddie Valtier, P.E. ELP TP&D Director Introduction Why Do We Need To Start Looking For Innovative Intersection Designs? Congestion is worsening and traffic volumes and
Fast Affordable Sustainable Transportation
 Fast Affordable Sustainable Transportation Bay Area October 2017 PC: Dllu Waking up from our traffic nightmare Transportation in the Bay Area has reached a crisis point. There is grinding congestion on
I-25 PEL: CO Springs Denver South Connection. Presentation to Castle Rock Town Council
 I-25 PEL: CO Springs Denver South Connection Presentation to Castle Rock Town Council June 20, 2017 An Important Corridor to Colorado Links the state s two major metropolitan areas and communities between
Strategies to Re capture Lost Arterial Traffic Carrying Capacities
 Strategies to Re capture Lost Arterial Traffic Carrying Capacities Chalap K. Sadam, P.E. and Albert L. Grover, P.E. Over the years, many arterials that were initially designed to carry tens of thousands
Update June 2018 OUR 2017 PUBLIC ENGAGEMENT
 Update June 2018 Hi, Let s Get Wellington Moving (LGWM) is developing a Recommended Programme of Investment (RPI) that meets our programme objectives and supports the city s and region s growth. As part
Birmingham Connected. Edmund Salt. Transportation Policy Birmingham City Council
 Birmingham Connected Edmund Salt Transportation Policy Birmingham City Council www.birmingham.gov.uk/connected Birmingham Connected the story so far Broadly following EU Guidance We ve done all of this
Standing Committee on Policy and Strategic Priorities
 POLICY REPORT Report Date: January 15, 2019 Contact: Steve Brown Contact No.: 604.873.9733 RTS No.: 12955 VanRIMS No.: 08-2000-20 Meeting Date: January 30, 2019 TO: FROM: SUBJECT: Standing Committee on
THE 2007 URBAN MOBILITY REPORT
 THE 2007 URBAN MOBILITY REPORT David Schrank Associate Research Scientist and Tim Lomax Research Engineer Texas Transportation Institute The Texas A&M University System http://mobility.tamu.edu September
Men s Metropolitan League Structures 2019
 Men s Metropolitan League Structures 2019 LEAGUE 1 Metro 2 NW Metro 2 SE Metropolitan League 1 Melbourne University Soccer Club Blues Melbourne University Soccer Club Rangers Mill Park SC North Sunshine
Dear City Council Members,
 From: Bob Kenyon [mailto: ] Sent: Monday, February 08, 2016 10:20 AM To: City Clerk Subject: Please prioritize Caltrain and a complete transit network Thank you for prioritizing bringing BART to San Jose