REPORT TO THE LEGISLATURE
|
|
|
- Angel Bishop
- 5 years ago
- Views:
Transcription

1 REPORT TO THE LEGISLATURE 2016
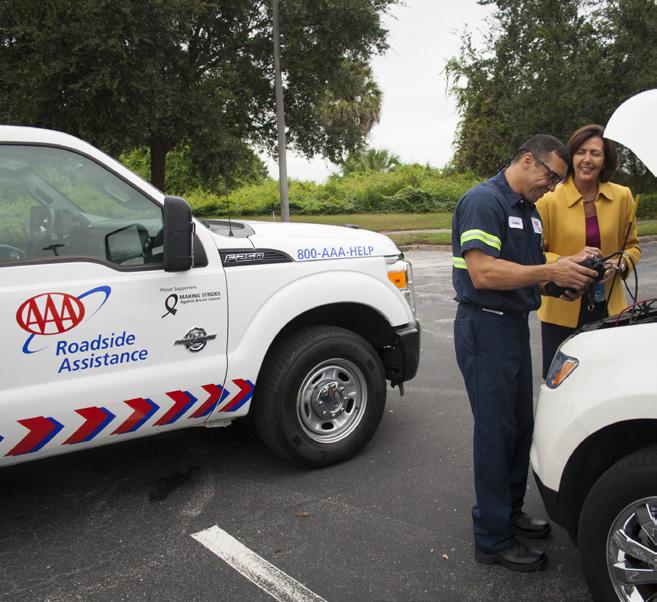
2 TABLE OF CONTENTS COVER PHOTO CREDITS: Top Left: ide Assistance Provider & AAA Member, AAA Top Right: Child in Rear-Facing Car Seat, NHTSA Image Gallery Middle: I-95 / Rt. 1&9 Approach to GWB, Fort Lee (Stokes Design Group, Inc.) Courtesy of NJ Alliance for Action Bottom: Mt. Olive Township, near Drake s Brook (Stokes Design Group, Inc.) Courtesy of NJ Alliance for Action Introduction AAA, An Overview The AAA Clubs of New Jersey AAA Member Benefits & Services Report to the Legislature 2016 Keeping Our Roadways Safe Road Conditions and the Commute Mass Transit Investment in Infrastructure Safety on Our Roadways Driving Under the Influence Distractions Factors Affecting Traffic Safety Senior Mobility Teen Driver Safety Driver and Passenger Safety Child Car Seats Slow Down, Move Over Automated Enforcement Contact Information
3 INTRODUCTION For more than 110 years, AAA has been a champion for motorists by advocating for better roads and safer travel. Today more than ever, the AAA Clubs of New Jersey are committed to the promise of safe travel and better commutes, to our two million members and the general public. Our advocacy efforts are far reaching from supporting safety programs in local communities and schools to advocating for our members in the halls of the statehouse. In New Jersey, we base our advocacy efforts on AAA s studies and data-driven analysis. Bi-annually, the AAA Clubs of New Jersey poll motorists to gauge their opinions on key issues likely to be debated by the Legislature. The survey gives us a snapshot of our members concerns. This data is then used to create the Report to the Legislature, which guides AAA s efforts in Trenton during the next legislative session. In the past this Report has helped us in achieving legislation that makes our roadways safer, and is used to help us continue to push for sensible safety measures that the public supports. We continue to use data from the Report to advocate for better education for our teen drivers and to require additional real world practice on the road prior to full licensure. As we continue to grow and expand, the issues covered in our surveys change. Previously we added questions about driving under the influence of prescription drugs because we saw it as a growing concern. In just two years, concern about this issue has increased, and being armed with data will help us continue to find ways to address this growing traffic safety concern. to ensure they are fit for the road. The data gathered helps us better serve our members concerns and effectively address constantly evolving issues changing with society. The data collected over the last decade also helps evaluate trends. Because we track motorists perceptions of the roadways and their commutes over long periods of time, we can see the steady decline that has been accelerating over the last few years. This decline has led to us continuing to educate our members and the Legislature on the importance of a stable, sustainable and dedicated funding stream for transportation infrastructure. We saw the public s hesitation in increasing monetary costs, but the true cost is the steadily declining road conditions. Motorists have seen that lack of funding has led to an erosion of the roadways, jeopardized their safety and has contributed to a decline in New Jerseyans quality of life. This year we see that those costs outweigh concerns about increasing monetary costs. If proper measures are taken, and safeguards and dedications are put in place, motorists will be willing to pay more to address the issues of our crumbling infrastructure. Our poll data helps ensure that AAA is aligned with our members needs, while showing elected officials that the majority of New Jersey motorists stand behind AAA when it comes to protecting their rights and keeping our roadways safe. To those who have partnered with us over the years to bring about safety advances, we thank you and ask for your continued support. For those new to the transportation area, we look forward to working with you to improve safety and mobility in the Garden State. This year new questions pertaining to retesting senior drivers have received overwhelming support but there continue to be concerns about overstepping such authority. AAA continues to work to keep seniors on the roads safer and longer but we need to find ways to address a growing desire to retest drivers 2 3
4 AAA, AN OVERVIEW AAA is a not-for-profit, fully tax-paying federation of motor clubs serving more than 56 million members in the United States and Canada. It is the largest leisure travel organization in North America. AAA regards public service on behalf of the traveling public as the cornerstone of what we are as an organization. While advocacy may not be the primary reason members join AAA, we take our commitment to promote the safety and mobility of our members seriously. Policy-makers at all levels rely on AAA, thanks to our objective research, nonpartisan approach and representation of a large motoring constituency. We work hard to ensure that the public service and educational programs we initiate are well supported by scientific data. THE AAA CLUBS OF NEW JERSEY In New Jersey, AAA is more than two million members strong, accounting for one of every three licensed drivers in the Garden State. There are four AAA Club affiliates in New Jersey, each providing a variety of services, including travel, automotive, insurance and financial services. The four AAA Clubs of New Jersey headquarters are: AAA North Jersey Wayne, Passaic County AAA Northeast Florham Park, Morris County AAA Mid-Atlantic, Northern Region Hamilton, Mercer County AAA South Jersey Voorhees, Camden County AAA MEMBER BENEFITS & SERVICES Nationwide ide Assistance Personalized Travel Planning Insurance Services AAA Diamond Rating Process Financial Services Discounts & Rewards Programs Legislative & Community Services REPORT TO THE LEGISLATURE2016 Every two years, the AAA Clubs of New Jersey undertake this comprehensive transportation survey at the start of each new legislative session to gauge and understand the thoughts of New Jersey motorists. We share the results of the survey with the Legislature and use it as a foundation for our legislative and advocacy efforts. The following summary represents current data, along with data collected over the past 12 years. The survey information was gathered through phone surveys of 600 randomly selected New Jersey motorists, both AAA members and non-members in November 2015 (margin of error +/- 4.0 percentage points). KEEPING OUR ROADWAYS SAFE At the core of all AAA s legislative efforts is the fundamental belief that our roadways need to be safe for all motorists, passengers, bicyclists and pedestrians. From ensuring that our infrastructure is sound to making sure drivers focus on the road, and that there are tools to help address the needs of drivers in all stages from learning to drive to preparing to give up the keys AAA is there advocating on our members behalf. Today, improving safety on our roadways has never been more critical as traffic crashes killed more than 32,000 people in 2013 alone, according to NHTSA s National Center for Statistics and Analysis. The single biggest threat to the safety of our roadways is the state of our infrastructure. Over the last decade, the Transportation Trust Fund (TTF) has been eaten up by bond repayment. As general funds grew scarce, the dedicated funds in the TTF were leveraged for bonds and re-financed repeatedly. 4 5


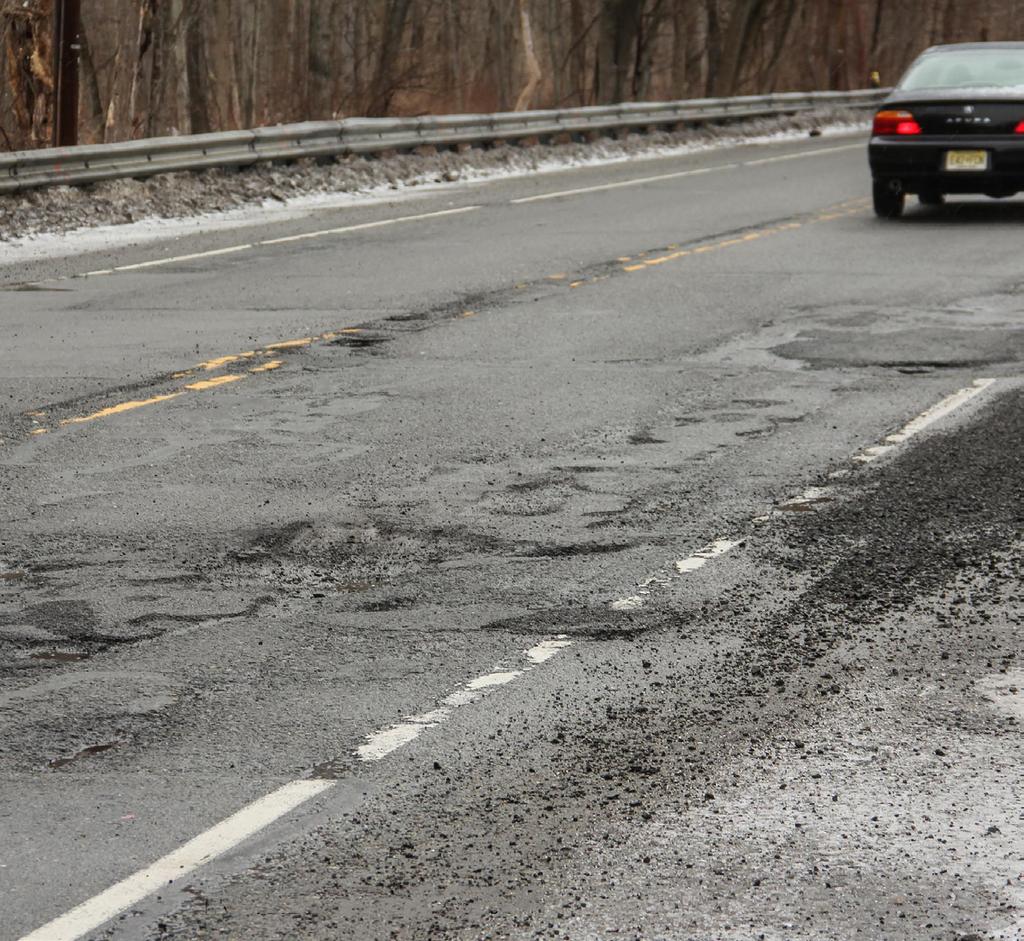
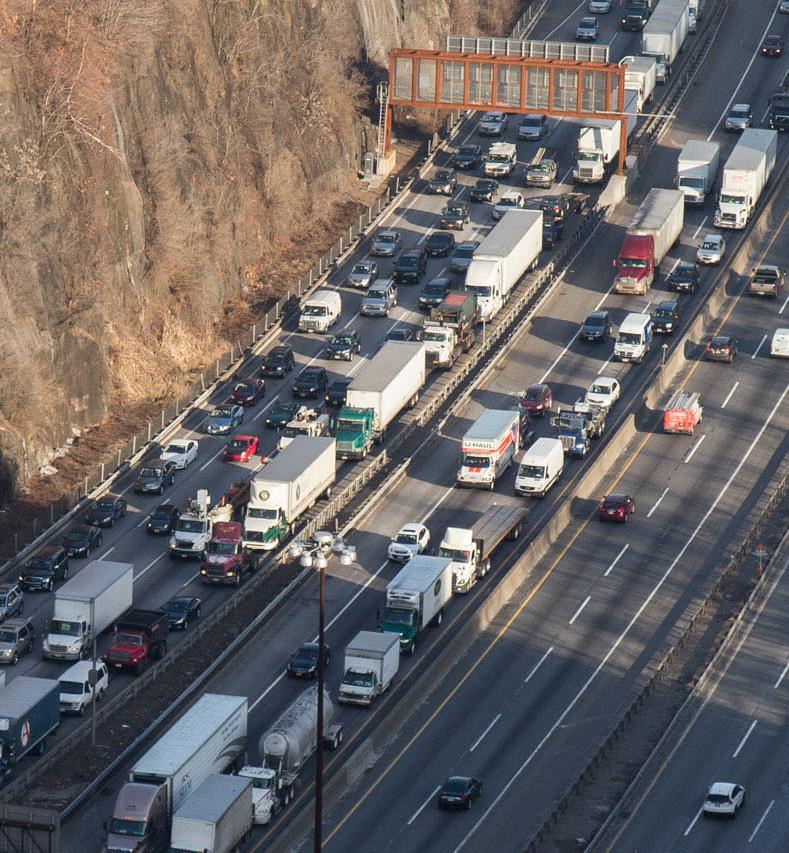
5 At this point, in order to repay the bonds the fund must rely on nearly $400 million in additional funds beyond the dedicated funds before even working on any new projects. New Jersey s infrastructure is crumbling, bridges and spans that have been overlooked for decades and are reaching critical points. New Jersey currently has 1,717 (26.2 percent) functionally obsolete bridges and 651 (9.9 percent) structurally deficient bridges. Without an increase to funding in over 25 years the fund has been overburdened with rising costs and decreasing revenues as cars become more fuel efficient. Drivers have seen the impact this lack of investment has had on our roadways and are ready to pay for better roads as long as they are confident the money is getting to the right place. The ratings that drivers give their commute has trended poorly, especially in recent years. 35% 33% 8% Nov 2007 Nov 2009 Nov 2011 Nov 2013 Nov 2015 Better 39% 34% 36% 33% 5% 5% Worse 37% 35% Same 45% 32% 3% 3% Motorists in Central Jersey were more likely to say that the commute had gotten worse than in any other part of the state. Commuters who travel on state highways and toll roads are more likely to rank their commutes as having gotten worse. While commutes may have worsened, toll roads and major interstates continue to receive the highest ratings in terms of road conditions. New Jersey s toll roads, such as the Turnpike and Garden State Parkway, received the highest ratings with 64% of drivers rating them as Good or Excellent. Cinnaminson, near Pompeston Creek Stokes Design Group, Inc. Courtesy of NJ Alliance for Action ROAD CONDITIONS AND THE COMMUTE Motorists have increasingly noticed the deteriorating conditions of our roadways. When asked to rate their satisfaction with their regular commutes, 45 percent say that their commute has gotten worse. Since 2007, the worse rankings have risen from 35 percent to an all-time high of 45 percent. Rt. 3 / I-495 / Paterson Plank Road, Secaucus Stokes Design Group, Inc. Courtesy of NJ Alliance for Action 6 7
: 8% 54% 25% 7% Major Interstate Highways 9% 47% 29% 8% Major Interstate Highways Road conditions by region 13% 11% 48% 30% Toll 52% Toll 63% 26% 5% NORTH")
6 Ratings on New Jersey s roadways saw few variations across the state (see p.25 for breakdown of counties by region): 8% 54% 25% 7% Major Interstate Highways 9% 47% 29% 8% Major Interstate Highways Road conditions by region 13% 11% 48% 30% Toll 52% Toll 63% 26% 5% NORTH CENTRAL 7% SOUTH 1% 34% 31% 19% Major Numbered 1% 4% 27%41% 29% Local 40% 36% 33% 28% 25% 25% Major Numbered 5% Local 53% 49% 47% 28% 29% 23% 28% 21% 8% 15% 5% 7% 2% 1% 2% the TTF has had to be used for debt repayment, rather than infrastructure investment. Local roads account for a majority of the roads in New Jersey, with towns responsible for 64 percent of roads and counties controlling 22 percent of the roadways. Together, local governments are responsible for 39 percent of all bridges and carry 55 percent of all traffic. With over 35,000 center line miles of roadways under local control, a large portion of the TTF should be dedicated to funding their maintenance. MASS TRANSIT Riders using mass transit for their commutes fare no better than motorists, with 65 percent saying their commutes have gotten worse. For transit riders, the fare increases have been an additional pressure, with 20 percent of riders saying the fare increase is changing their commuting habits. If 20 percent of mass transit riders were to move back onto the roadways, that would be more than 180,000 additional cars on the roadways each week. Mass transit users have remained relatively consistent about 10 percent of respondents, but the mode of transportation has changed. Self-reported bus ridership as part of the commute has increased to 57 percent, up from 51 percent two years ago and a low of 31 percent in At the same time, selfreported train ridership as part of the commute declined to 54 percent from a high of 71 percent in Major Interstate Highways Toll Major Numbered Local Excellent Good Fair Poor Local roadways fared worst of all, with 31 percent rating them as poor, up from 23 percent in 2013 and nearly doubled since 2003; 40 percent rate local roadways as fair. The dismal rankings for local roadways has been caused by years of neglect as less and less state money has gotten to municipalities, as 8 9

7 Clearly, transportation funding of roadways and/or mass transit plays a large role in motorists commutes. Well-maintained, properly-funded transportation systems help commuters get to and from work efficiently and safely. While AAA s top priority is the safety and mobility of motorists, we recognize that in New Jersey we must invest in mass transit in order to ease the burden on our roadways and to offer alternative transportation options to commuters. INVESTMENT IN INFRASTRUCTURE Underlying the poor rankings of road conditions and worsening commutes is a lack of funding. Over the years, motorists have come to have a greater understanding of the crisis facing transportation funding. When asked, 59 percent of respondents were aware that New Jersey has one of the lowest gas taxes in the country, up from 47 percent ten years ago. While motorists want to see the funding crisis solved, without any other information about the funding crisis, increasing the gas tax is the least attractive option with restoring earmarked funding the most popular solution. A majority of drivers (69 percent) want the TTF exclusively used for transportation improvements. The importance of the dedication of these funds is compounded when coupled with the fact that 57 percent believe that gas tax funds are being diverted to other purposes. Drivers tend to not believe that all funds from the gas tax are dedicated to the TTF Please tell me if the following statement is true or false, to the best of your knowledge: All of the money from the gas tax in New Jersey is dedicated to the Transportation Trust Fund. 21% TRUE 57% FALSE An overwhelming majority of those polled support an amendment to the state Constitution to fully dedicate the gas tax to the TTF, with 71 percent in favor and 73 percent in favor when they are told that the funds are not currently dedicated. This is why AAA strongly supported a constitutional amendment to fully dedicate the gas and petroleum tax revenues to the TTF. This question will be on the ballot in November 2016 and AAA urges all members to support this dedication. Regardless of the level of information they are given on the TTF, drivers favor a dedicated funding stream for the TTF Would you support or oppose an amendment to the State Constitution that dedicates all revenue derived from the gas tax to be dedicated to the Transportation Trust Fund? 71% 28% 43% SUPPORT 16% 7% 9% OPPOSE 13% DON T KNOW Long Branch, near Troutman s Creek Stokes Design Group, Inc. Courtesy of NJ Alliance for Action Strongly Support Somewhat Support Strongly Oppose Somewhat Oppose 10 11

8 When provided with information about the current crisis, including the fact that debt repayment now outpaces dedicated monies raised by the gas tax, motorists are prepared to support an increase in the gas tax if the proper safeguards are put in place. Support for a dedicated increase to the gas tax climbed to 63 percent. This year, armed with information about the current state of the TTF, support nearly doubled from where it was two years ago when a similar question was asked. When residents know more about the funding crisis facing the TTF there is significant support to raise the gas tax to pay infrastructure. It s clear from these numbers that motorists are increasingly aware of the transportation funding crisis in the state and understand that infrastructure investment is necessary to improve their quality of life. I would support a reasonable increase in the gasoline tax to be dedicated to the Transportation Trust Fund, so long as there are safeguards in place to ensure there is no waste, abuse or diversion of the money. 69% 29% 66% 32% May 2005 May 2011 Nov 2013 Nov 2015 Agree 57% 37% Disagree 63% 32% SAFETY ON OUR ROADWAYS Given the amount of time New Jersey motorists spend behind the wheel, the AAA Clubs believe improving safety on our roadways must be a priority. Impaired, distracted, aggressive and drowsy drivers, as well as congested roadways and unfavorable weather conditions, all affect motorists safety. Driving under the influence During our survey, motorists were asked to rate the seriousness of various traffic concerns. Drunk driving remains the top concern for New Jersey motorists, with 97 percent considering this a top safety issue on New Jersey roads. Drunk driving remains a serious concern, but how the courts deal with drunk driving offenses needs to change behavior rather than just punish offenders. Long-term license suspension can lead serious offenders to drive without a license, oftentimes while impaired. Which is why after much research, AAA has endorsed the use of interlock devices for all offenders. Interlock devices have the ability to help change behavior by ensuring that drivers cannot operate a vehicle while impaired. Legislation that requires interlock devices for all offenders should include: a mechanism for oversight and monitoring of all installed devices; a requirement that offenders have a clean period of installation prior to the device being removed; a requirement that all vehicles primarily operated by the offender have a device installed; and a mechanism to address offenders who cannot afford the device. At the same time that respondents will support an increase to the gas tax, 69 percent also would support a fee for alternative fuel vehicles to be dedicated to the Transportation Trust Fund. AAA is calling on the Governor and Legislature to work toward a long-term solution to the state s current transportation funding crisis. Relying on quick fixes in particular, debt refinancing has underminded the integrity of the state s transportation system and negatively impacted New Jersey s economy, quality of life, safety and security

9 While drinking and driving is commonly cited as dangerous behavior, driving under the influence of prescription drugs is a less known danger. Respondents have a growing awareness of this issue 91 percent cited it as a serious concern, up from 85 percent two years ago. Prescription drugs can impact driving, particularly when combined with other medication. AAA created RoadwiseRX to help drivers learn about potential dangerous combinations and make informed choices. AAA will continue to educate our members and the public about the dangers of impaired driving. Distractions With people spending an average of two-and-a-half hours in their vehicles every day, other activities, from talking to the kids to eating dinner, often take place behind the wheel. Experts estimate that drivers are engaged in potentially distracting activities more than 15 percent of the time that their vehicles are in motion. Driver distractions play a large role in traffic safety. According to NHTSA s National Center for Statistics and Analytics, 3,154 people lost their lives and an estimated 424,000 people were injured in 2013 in police-reported crashes in which at least one form of driver distraction was reported on the accident report. NHTSA reports that 16 percent of all crashes involve distraction. At any given daylight moment across America, approximately 660,000 drivers are using cell phones or manipulating electronic devices while driving, a number that has held steady since (National Occupant Protection Use Surveys) When New Jersey motorists were asked to rank distractions, the top distractions were those that required the driver to look away from the road or take their hands away from the steering wheel. AAA research has found that the cognitive distraction of a conversation and using technology is more dangerous than first thought, and may distract drivers up to 27 seconds after they hang up the phone. While driver infotainment systems those in-vehicle systems that allow drivers to access the internet and other functions have become more popular in new vehicles, 34 percent of those surveyed listed them as a serious distraction. Texting/ ing and Reading while Driving are seen as the biggest distractions to drivers on New Jersey roads. Texting or ing While Driving Reading While Driving Hair Brushing, Shaving or Putting on Makeup Talking on a Cell Phone While Driving Eating or Drinking While Driving Using a GPS or Car s Infotainment System Other Drivers DVD Systems in Car or Van Pets in the Car Changing a CD or Mp3 Player or Tuning Radio Distractions Outside The Car Listening to an Audio Book Children in the Car Talking with Other Passengers 6% 12% 10% 10% 18% 16% 15% 19% 19% 49% 63% 82% 80% Motorists continue to believe that they are not as distracted by their cell phones as other drivers are. Thirty percent of drivers felt they were distracted while talking on a phone, but 93 percent believed that other drivers are distracted by talking on their phones

10 We see the same pattern when it comes to texting, although far more drivers report that they do not text and drive. How distracted do you feel while driving and texting on your cell phone? 26% 5% 21% DISTRACTED 4% 1% 3% NOT DISTRACTED Very Distracted Somewhat Distracted 69% I DON T TEXT & DRIVE How distracted do you feel other drivers are while driving and texting on their cell phones? 97% 12% 85% DISTRACTED 3% 1% 1% NOT DISTRACTED Not Distracted At All Not Too Distracted drowsy, 9 percent admit to exchanging unpleasantries and/ or making rude gestures to another driver, and 5 percent are text messaging or using other hand-held devices while driving. Young drivers were found to be more likely than older drivers to text message or while driving, but there was a sharp decline in use from two years ago. FACTORS AFFECTING TRAFFIC SAFETY Senior Mobility Seniors represent one of the fastest-growing segments of our population. The great majority of seniors are skillful, responsible, safe drivers, but the aging process takes a toll on the physical abilities drivers need most, including vision, hearing, strength and flexibility. Although older drivers generally do not pose a great threat to other people on the road, they themselves are at greater risk of sustaining serious or fatal injuries, even in crashes of relatively low severity. Retesting senior drivers is often discussed as a way to keep seniors and the roads safer, despite data that shows seniors are among the safest drivers. This year, AAA asked questions about retesting for the first time. A majority (69 percent) of those asked support retesting, 44 percent of those asked believe that retesting should start at age 70. Women are more likely to support retesting, and support for retesting in general declines to 57 percent with drivers over the age of 65. While retesting is supported, revoking licenses based on age is not supported. An overwhelming majority agree that texting while driving is dangerous with 69 percent of drivers saying they do not text while driving, 26 percent reporting being distracted while texting, and 97 percent believing that others are distracted while texting. The AAA Clubs remain committed to educating the public about the dangers of driving while impaired and aggressive driving. The goal is more important than ever, considering nine percent of Garden State motorists admit to driving while 16 17
11 A majority of those who support driver retesting believe it should be done after the age of 70. Would you personally support or oppose a new law in New Jersey that would require mandatory retesting of drivers once they reach a certain age? DriveSharp A revolutionary online program that is clinically proven to help drivers see more, react faster and cut crash risk by up to 50 percent. It allows seniors to train their brain to keep driving longer and more safely. Roadwise Review A computer-based self-assessment tool that measures the eight functional abilities shown to be the strongest predictors of crash risk among seniors. 69% 27% 42% SUPPORT Strongly Support Somewhat Support 26% 12% 14% OPPOSE Strongly Oppose Somewhat Oppose CarFit A free check to ensure a senior s vehicle meets his or her needs. SeniorDriving.AAA.com A newly revamped website that offers tips and general safe driving information for seniors and their families. Supporters were asked at around what age should the restesting of drivers begin? 4% 39 2% 5% Finding ways to keep seniors safely mobile is a top priority for the AAA Clubs of New Jersey: Continuing education and refresher training will help maintain mobility, independence, and keep seniors driving in a safe manner for a longer period of time. That s why the AAA Clubs of New Jersey partner with community colleges throughout the state and partcipate in the New Jersey Motor Vehicle Commission s Wisdom Behind the Wheel program to bring AAA s senior driving tools to over a thousand motorists annually. 25% 44% 17% Teen Driver Safety Motor vehicle crashes are the leading cause of teen death in New Jersey and the U.S., with more than 2,100 teens killed and 243,000 injured each year nationwide. In 2014, there were 37,980 crashes involving teen drivers in New Jersey. Despite being seven percent of the driving population, they account for 11 percent of all crashes. While most of these crashes resulted in minor injuries and/or property damage, 23 teen drivers and 15 teen passengers being driven by treens were killed. Speed, distraction, inexperience and lack of seat belt use were prevalent factors in these fatal crashes. In some cases, the teen driver had multiple violations on his or her driving record, according to the New Jersey Division of Highway Traffic Safety. New Jersey has a licensing system that is unique in the United States. The licensing age is 17, compared with 16 in most states. New Jersey s graduated driver licensing (GDL) system, introduced in 2001, includes provisions for novices of all ages and is one of the most comprehensive in the nation. The learner permit must be held for at least six months; the probationary license prohibits driving between11:01 p.m. and 5 a.m. and establishes a one-passenger limit, regardless of a familial 18 19

12 affiliation, unless a parent or guardian is in the vehicle. New Jersey also has the nation s first decal law, which requires all novice drivers to display a red decal to alert police that the driver has restrictions. While New Jersey s licensing policies for young drivers are a model for the nation, we must continue to improve and enhance the state s GDL program to further reduce teen driver crashes in our state. The latest traffic safety report cards from the Centers for Disease Control (CDC) and Advocates for Highway & Auto Safety have ranked New Jersey lower for not having stricter nighttime driving restrictions and for the lack of required practice hours. AAA proposes several programs, including parent/teen orientation; holding a permit for a minimum of one year; minimum 50 hours of certified practice driving (10 of those hours must be at night) or a minimum of 100 hours of certified practice driving (20 of these hours must be at night) without behindthe-wheel training; and limit of one passenger regardless of relationship to driver. Motorists are in favor of many of AAA s policy initiatives. Seventy-two percent of those surveyed support a law that would require parents and teens to attend a driver s education class together or online, and 77 percent support requiring teens to log 50 hours of practice driving before obtaining their license. Drivers strongly support a 90-minute course for parents and teens who are ready to drive. Would you personally support or oppose a new law that would require parents and teens to attend a 90- minute driver s education session together or online. 72% 30% 42% SUPPORT Strongly Support Somewhat Support 24% OPPOSE Strongly Oppose Somewhat Oppose Support for the 50 practice hour law is high overall. Would you personally support or oppose a new law in New Jersey that would require teens to log 50 practice hours of driving before they obtain their license? 77% 24% 53% SUPPORT 9% 14% 17% 9% 8% OPPOSE Strongly Support Somewhat Support Strongly Oppose Somewhat Oppose DRIVER AND PASSENGER SAFETY Seat belts and frontal air bags are among the most important safety devices available, together saving thousands of lives each year. The National Highway Traffic Safety Administration quantifies the benefits of these devices by estimating the number of people saved by each device, the number who 20 21

13 would have lived if more occupants had buckled up, and the savings and loss in financial terms. In 2013, an estimated 12,584 lives were saved by seat belts and 2,388 lives were saved by airbags. Primary seat belt laws are the most effective way to ensure seat belt use. New Jersey front seat belt laws are a primary offense, but backseat belt use remains a secondary offense. Making all seat belt use primary would move New Jersey toward the goal of 100 percent usage. Child Car Seats Motor vehicle crashes are the number one cause of the death of children over the age of six months in the United States. The proper use of child car seats is one of the simplest and most effective methods available for protecting the lives of our young children in the event of a motor vehicle crash. However, three out of every four children in child safety seats are not properly secured, or worse, not restrained at all. Only the correct use of child car seats will offer the protection a child needs according to NHTSA s National Center for Statistics and Analysis. harness. The law, which went into effect in September 2015, is still not well known to many. When asked at what age children must remain rear-facing until, the most popular answer (32 percent) was over the age of two, however 54 percent of respondents either did not know or provided an age yonger than two. A plurality of drivers recall that children must be in rear-facing car seats for two years. 28% 43% 11% 14% 2% 18 Months & Younger 45% 32% 13% 24 Months & Older 27% 6 Months 12 Months 18 Months 24 Months Over 2 Years 9% 7% Don t Know AAA will continue to work to enhance education on this important law. The Clubs continue to regularly sponsor free child safety seat checks, and fund training programs for law enforcement, emergency and medical professionals, as well as AAA associates to become nationally certified experts in child passenger safety. AAA was happy to support New Jersey s first-in-the-nation law to require children to be in car seats in accordance with the American Academy of Pediatrics recommendations. Children under 2 years and 30 pounds must remain rear-facing, those under 4 years and 40 pounds must remain in a five-point SLOW DOWN, MOVE OVER In 2010, AAA, along with a coalition of emergency service workers and government entities, saw our hard work pay off with the creation of the Move Over law. The law protects emergency workers by requiring motor vehicle operators to reduce their speed and change lanes when approaching authorized vehicles displaying emergency lights. When safely changing lanes is not possible, drivers must slow down below the posted speed limit

14 With some of the busiest highways in the country, New Jersey roadways are particularly dangerous for emergency personnel working on the side of the road. The law should make the roads safer for emergency and maintenance vehicles, tow trucks and official motorist aid vehicles displaying amber emergency lights. Unfortunately, not enough drivers are aware of the law, which is why AAA continues to advocate for additional education and signage. AAA supports this education effort and will continue to work to ensure the safety of all on our roadways. AAA also supports expanding the Move Over law to include pedestrians and bicyclists. Having a uniform Move Over law will make vulnerable road users safer and will help to ingrain the behavior in all drivers. AAA believes successful red light camera programs are beneficial to reducing accidents in intersections, but should only be installed if the goal is increased safety in the community and not increased revenue. Support for the program continued to decrease each year the program was in place. Support for the program peaked in 2007 with 77 percent; in 2015, only 51 percent supported red-light cameras. While red-light cameras may not be popular, 87 percent of those polled would support cameras on school buses. AUTOMATED ENFORCEMENT In December 2014, New Jersey ended a pilot red-light camera program. While the program has ended, a final report has not yet been issued. The red-light cameras are designed to deter motorists from running red lights by taking a picture of the license plate of any vehicle breaking the law, thus reducing traffic accidents in intersections. The law required that each municipality conduct a safety impact study when selecting to use the cameras. NORTH, CENTRAL & SOUTH REGION BREAKDOWNS: NORTH: Bergen, Essex, Hudson, Morris, Passaic, Sussex, Union & Warren CENTRAL: Hunterdon, Mercer, Middlesex, Monmouth, Ocean & Somerset SOUTH: Atlantic, Burlington, Camden, Cape May, Cumberland, Gloucester & Salem 24 25

 989-5885 gene@cignj.com (973) 245-4869 clewis@aaanortheast.")
15 CONTACT INFORMATION Bergen, Hudson & Passaic Counties AAA North Jersey Stephen Rajczyk Manager, Public & Government Services 418 Hamburg Turnpike Wayne, NJ (973) Essex, Morris & Union Counties AAA Northeast Cathleen Lewis Director, Public & Government Affairs 1 Hanover Road Florham Park, NJ Camden, Cumberland, Gloucester & Salem Counties AAA South Jersey Richard Bradley Public Affairs Supervisor 700 Laurel Oak Road Voorhees, NJ (856) rbradley@aaasj.com Public Affairs Counsel Capital Impact Group Gene J. Mulroy Principal 134 West State Street Trenton, NJ (609) gene@cignj.com (973) clewis@aaanortheast.com Atlantic, Burlington, Cape May, Hunterdon, Mercer, Middlesex, Monmouth, Ocean, Somerset, Sussex & Warren Counties AAA Mid-Atlantic, Northern Region Tracy Noble Manager, Public & Government Affairs 700 Horizon Drive Hamilton, NJ (609) tnoble@aaamidatlantic.com 26 27
16 NOTES: 28
17
REPORT TO THE LEGISLATURE
 REPORT TO THE LEGISLATURE 2016 COVER PHOTO CREDITS: Top Left: Roadside Assistance Provider & AAA Member, AAA Top Right: Child in Rear-Facing Car Seat, NHTSA Image Gallery Middle: I-95 / Rt. 1&9 Approach
AAA ON THE ISSUES
 AAA ON THE ISSUES 2 0 1 7 TABLE OF CONTENTS Introduction About AAA Traffic Safety Distracted Driving Impaired Driving Occupant Protection Steer It, Clear It Automated Enforcement Infrastructure Autonomous
New Jersey infrastructure poll March 21-27, 2019 Stockton Polling Institute Weighted frequencies
 New Jersey infrastructure poll March 21-27, 2019 Stockton Polling Institute Weighted frequencies Q1. Overall, how would you rate the condition of roads and highways in New Jersey: Valid Excellent 8 1.2
Transportation Issues Poll for New York City
 2016-17 Transportation Issues Poll for New York City 82% support Vision Zero and reducing traffic deaths 72% on average, support more street space for children to play, protected bike lanes and other safety
OLDER PEDESTRIANS AT RISK
 OLDER PEDESTRIANS AT RISK A TEN-YEAR SURVEY AND A LOOK AHEAD August 0 The population of older adults is growing in the U.S. and in the tri-state region. According to AARP, one in three Americans is now
New Jersey Crossing Guard Training and Resources Program 2016
 New Jersey Crossing Guard Training and Resources Program 2016 BACKGROUND Trainings 2013 (pilot) Essex, Middlesex, and Burlington 75 officers 2014 Mercer, Monmouth, Bergen, Atlantic, and Union 179 participants
Canadian Association of Chiefs of Police Association canadienne des chefs de police
 WHAT S IN THE KIT? Media Advisory Template To be used to invite the media to an event during Operation Impact. We suggest you reproduce this on your own police agency letterhead. News Release Template
POLICY AGENDA For Elder Pedestrian Safety
 POLICY AGENDA For Elder Pedestrian Safety Older adults and people with disabilities often have mobility, cognitive, and sensory limitations that affect their behavior as pedestrians and place them at risk
Occ c u c pa p n a t pro r t O ec e t c i t O i n
 Occupant Protection Occupant Protection Introduction Buckling up or being buckled in is the most effective protection during a car crash. The simple truth is that the great majority of people ejected from
Older Pedestrians at Risk And How States Can Make it Safer and Easier for Older Residents to Walk
 Older Pedestrians at Risk And How States Can Make it Safer and Easier for Older Residents to Walk Tri-State Transportation Campaign August 2012 Introduction Key Findings 435 older pedestrians have been
Charles Brown, MPA. Complete Streets The Intersection of Health and Planning October 26, :30AM 12:30PM
 Charles Brown, MPA COMPLETE STREETS IN NEW JERSEY: A WINNING STRATEGY Complete Streets The Intersection of Health and Planning October 26, 2016 8:30AM 12:30PM Purpose Share Strategies from New Jersey s
Purpose and Need. Chapter Introduction. 2.2 Project Purpose and Need Project Purpose Project Need
 Chapter 2 Purpose and Need 2.1 Introduction The El Camino Real Bus Rapid Transit (BRT) Project (Project) would make transit and other transportation improvements along a 17.6-mile segment of the El Camino
Carjacking Offense Report
 NEW JERSEY STATE POLICE 1921 STATE OF NEW JERSEY Carjacking Offense Report For the year ending December 31, 2007. New Jersey State Police Uniform Crime Reporting Unit 2007 FIFTEENTH ANNUAL CARJACKING OFFENSE
November 2, Government takes on the challenge of improving traffic safety
 November 2, 2006 Government takes on the challenge of improving traffic safety Edmonton... The Alberta government has taken on the challenge of improving traffic safety by moving ahead with a comprehensive,
CARJACKING. in New Jersey
 CARJACKING in New Jersey 2 01 6 TWENTY-FOURTH ANNUAL CARJACKING OFFENSE REPORT 2016 Honorable Gurbir S. Grewal Attorney General State of New Jersey Patrick J. Callahan Colonel New Jersey State Police Major
CDRT. Child Death Review Team Dallas County. Brief Report Traffic-related Child Deaths OVERVIEW
 Dallas County CDRT Child Death Review Team 2013 Brief Report Traffic-related Child Deaths 2006-2011 OVERVIEW In Dallas County, traffic-related injury death rates among children are typically less than
MTCF. Michigan Traffic Crash Facts FACT SHEETS
 FACT SHEETS This page left intentionally blank GENERAL FACTS The driver, the roadway, and the motor vehicle contribute in some measure to every crash. A preponderance of evidence, however, points to driver
CARJACKING. in New Jersey. New Jersey State Police Uniform Crime Reporting Unit. For the year ending December 31, 2008
 2008 CARJACKING in New Jersey For the year ending December 31, 2008 New Jersey State Police Uniform Crime Reporting Unit NEW JERSEY STATE POLICE 1921 SIXTEENTH ANNUAL CARJACKING OFFENSE REPORT 2008 Honorable
Department of Transportation
 Department of Transportation I. Internal Scan The number of older drivers in the United States will double over the next 30 years. By 2030 one in five Americans will be age 65 or older. On a licensed-driver
2011 Countywide Attitudinal and Awareness Survey Results
 2011 Countywide Attitudinal and Awareness Survey Results Purpose of Study Establish baseline for measuring future performance Identify perceptions about transportation system, issues, priorities Assess
April 30 th, Reducing the Risks to Child Pedestrians
 April 30 th, 2018 Reducing the Risks to Child Pedestrians Technical Tips Audio is broadcast through computer speakers Download resources in the File Share pod (above the slides) If you experience audio
CARJACKING. in New Jersey FOR THE YEAR ENDING DECEMBER 31, 2015 NEW JERSEY STATE POLICE UNIFORM CRIME REPORTING UNIT
 2015 CARJACKING in New Jersey FOR THE YEAR ENDING DECEMBER 31, 2015 NEW JERSEY STATE POLICE UNIFORM CRIME REPORTING UNIT TWENTY-THIRD ANNUAL CARJACKING OFFENSE REPORT 2015 Honorable Christopher S. Porrino
Most Dangerous Roads for Walking And How States Can Make them Safer. Route 110, Long Island, New York Image by Dougtone
 Most Dangerous Roads for Walking And How States Can Make them Safer Route 110, Long Island, New York Image by Dougtone Tri-State Transportation Campaign February 2013 Introduction Key Findings More than
CARJACKING. In New Jersey FOR THE YEAR ENDING DECEMBER 31, 2010 NEW JERSEY STATE POLICE UNIFORM CRIME REPORTING UNIT
 2010 CARJACKING In New Jersey FOR THE YEAR ENDING DECEMBER 31, 2010 NEW JERSEY STATE POLICE UNIFORM CRIME REPORTING UNIT EIGHTEENTH ANNUAL CARJACKING OFFENSE REPORT 2010 Honorable Paula T. Dow Attorney
MTCF. Michigan Traffic Crash Facts FACT SHEETS
 FACT SHEETS This page left intentionally blank GENERAL FACTS The driver, the roadway, and the motor vehicle contribute in some measure to every crash. A preponderance of evidence, however, points to driver
Carjacking IN NEW JERSEY FOR THE YEAR ENDING DECEMBER 31, 2012 NEW JERSEY STATE POLICE UNIFORM CRIME REPORTING UNIT
 2012 Carjacking IN NEW JERSEY FOR THE YEAR ENDING DECEMBER 31, 2012 NEW JERSEY STATE POLICE UNIFORM CRIME REPORTING UNIT TWENTIETH ANNUAL CARJACKING OFFENSE REPORT 2012 Honorable John J. Hoffman Acting
Carjacking IN NEW JERSEY FOR THE YEAR ENDING DECEMBER 31, 2013 NEW JERSEY STATE POLICE UNIFORM CRIME REPORTING UNIT
 Carjacking IN NEW JERSEY FOR THE YEAR ENDING DECEMBER 31, 2013 NEW JERSEY STATE POLICE 2013 UNIFORM CRIME REPORTING UNIT TWENTY-FIRST ANNUAL CARJACKING OFFENSE REPORT 2013 Honorable John J. Hoffman Acting
FACTS AND FIGURES: MAKING THE CASE FOR COMPLETE STREETS IN LEE COUNTY
 FACTS AND FIGURES: MAKING THE CASE FOR COMPLETE STREETS IN LEE COUNTY Safety: Close to 5,000 pedestrians and bicyclists die each year on U.S. roads, and more than 70,000 are injured. [Mean Streets, Surface
Policies That Improve the Environment and Environmental Public Health (Chapter 1)
") Executive Summary Introduction The public road system in the U.S. is the world s busiest, sustaining more than 3 trillion vehiclemiles of travel each year on a network of more than 4 million miles of roads
Executive Summary Introduction The public road system in the U.S. is the world s busiest, sustaining more than 3 trillion vehiclemiles of travel each year on a network of more than 4 million miles of roads
Beaverton Police Department Traffic Safety Team
 Traffic Safety Team November 1, 2010 Executive Summary The Beaverton Police Department takes pride in the distinction as being one of the safest cities in the northwest. Being a safe city is more than
We believe the following comments and suggestions can help the department meet those goals.
 The Honorable Secretary Anthony Foxx The Secretary of Transportation United States Department of Transportation 1200 New Jersey Avenue, SE Washington, DC 20590 August 30, 2013 Dear Secretary Foxx, Thank
TSTC s analysis of federal transportation data reveals that in the three years from 2010 through 2012:
 THE REGION S Tri-State Region KEY FINDINGS TSTC s analysis of federal transportation data reveals that in the three years from through :, pedestrians lost their lives on Connecticut, Jersey and downstate
Typical Rush Hour Commute. PennyforTransportation.com
 Typical Rush Hour Commute In the News Overview of the Plan Collaborative plan with projects in every community Prioritizing connectivity and congestion relief Dedicated transportation-specific funding;
INFORMATION TOOL KIT
 CANADA ROAD SAFETY WEEK 2017 INFORMATION TOOL KIT Thank you for being involved in Canada Road Safety Week. With your participation, we can spread the word about this special week and why it is an important
Figure 1. Indiana fatal collisions by young driver involvement,
 INDIANA TRAFFIC SAFETY FACTS YOUNG DRIVERS 2016 MAY 2017 ISSUE 17-C06 IN 2016: In 2016, 13.4 percent of all drivers involved in Indiana collisions were young drivers. Young drivers were involved in 105
Older Pedestrians at Risk And How States Can Make it Safer and Easier for Older Residents to Walk
 Older Pedestrians at Risk And How States Can Make it Safer and Easier for Older Residents to Walk Tri-State Transportation Campaign June 2011 Introduction Older pedestrians in the tri-state region are
ATV use and Safety Recommendations
 ATV use and Safety Recommendations The following are some recommendations for choosing an ATV for Utility use and safety training resources available to insure your riders are adequately trained to use
Shenango Valley MPO. State Transportation Commission 2015 Twelve Year Program Development
 State Transportation Commission 2015 Twelve Year Program Development Regional results of the survey and public feedback from August thru November 2013 Shenango Valley MPO Version 01-2014 Mobility Concerns
National Stop on Red Week August 5 th -11 th August/ September 2007
 BROOME COUNTY TRAFFIC SAFETY BOARD NEWSLETTER Broome County Health Department 225 Front St. / Binghamton, NY 13905 Christine Muss, Traffic Safety Coordinator Telephone: 607-778-2807 / Fax: 778-3998 / Email:
NEW JERSEY LAW ENFORCEMENT LIAISON NEWSLETTER
 NEW JERSEY LAW ENFORCEMENT LIAISON NEWSLETTER SEPTEMBER 2017/12 WWW.NJSACOP.ORG DRIVE SOBER OR GET PULLED OVER NJ DIVISION OF HIGHWAY TRAFFIC SAFETY The mission of the Division of Highway Traffic Safety
NASHUA REGIONAL PLANNING COMMISSION REGIONAL BICYCLE AND PEDESTRIAN PLAN
 NASHUA REGIONAL PLANNING COMMISSION REGIONAL BICYCLE AND PEDESTRIAN PLAN June, 2005 Prepared by the Nashua Regional Planning Commission 2005 NRPC Regional Bicycle and Pedestrian Plan- JUNE 2005 ACKNOWLEDGEMENTS
BICYCLING ON ROADWAYS
 Massachusetts State Police Academy Training Bulletin 2017-11 BICYCLING ON ROADWAYS Legal Update: Effective April 2017, Chapter 456 of the Acts of 2016 adds section 4D to Chapter 89 of the General Laws,
Capital Beltway HOT Lanes - Frequently Asked Questions
 Capital Beltway HOT Lanes - Frequently Asked Questions December 20, 2007 1. What is the cost of the project? The fixed-price design-build cost is approximately $1.4 billion. 2. Why have the project costs
When you drive defensively, you drive safely to save lives, time, and money, despite the conditions around you and the actions of others
 Defensive Driving When you drive defensively, you drive safely to save lives, time, and money, despite the conditions around you and the actions of others PPT-SM-DD 2015 2 We are on the road every day
Civil Society. Dialogue for Progress
 By Madona Gasanova It took George, 15, about two years to rebuild his life aſter getting hit by a car on his way to school. He is lucky to still be alive; other people are not so lucky. In George's words,
TOOLKIT STOP ON RED. National. Week August 6-12, 2017 RED-LIGHT RUNNING FACT. #StopOnRed2017 to spread the message!
 National STOP ON RED Week August 6-12, 2017 RED-LIGHT RUNNING FACT In 2015, 771 people were killed due to red-light running and an estimated 137,000 were injured. Source: IIHS TOOLKIT Learn more about
WILMAPCO Public Opinion Survey Summary of Results
 Wilmington Area Planning Council WILMAPCO Public Opinion Survey Summary of Results Prepared by: 2955 Valmont Road, Suite 300 Boulder, Colorado 80301 t: 303-444-7863 f: 303-444-1145 www.n-r-c.com Table
Pedestrian Safety Campaign
 Pedestrian Safety Campaign 2017-18 Traffic Safety Plan PART OF THE DRIVE FOCUS LIVE TRAFFIC SAFETY PLAN Table of Contents Background. 1 Pedestrian Collision Stats.... 2-3 Goals.. 4 Objectives.. 5 Implementation
Florida Class E Knowledge Exam Road Rules Practice Questions
 1. If you are being followed too closely while driving, you should: A. Drive closer to the car in front of you. B. Speed up to increase the distance between you and the following vehicle. C. Slow down
Kentucky s Surface Transportation System
 Kentucky s Surface Transportation System ROAD AND BRIDGE CONDITIONS, TRAFFIC SAFETY, TRAVEL TRENDS, AND NEEDS MARCH 2018 PREPARED BY WWW.TRIPNET.ORG Founded in 1971, TRIP of Washington, DC, is a nonprofit
17th Annual California Senior Injury Prevention Educational Forum
 17th Annual California Senior Injury Prevention Educational Forum Alameda County Emergency Medical Services Senior Injury Prevention Partnership June 6, 2017 1 Pedestrian Safety Workshop Grant funding
Toward Zero Deaths: Proactive Steps for Your Community
 Est. Dec. 2014 Toward Zero Deaths: Proactive Steps for Your Community Presented by: Brian Roberts, P.E., National Association of County Engineers Marie Walsh, Ph.D., Louisiana Local Technical Assistance
Transportation and Public Works Annual Motor Vehicle Collision Report
 Transportation and Public Works 22 Annual Motor Vehicle Collision Report Table of Contents Table of Contents.. 2 Introduction.. 3 22 Collision Summary. 4 Demographics 5 Collisions by Severity.. 5 Personal
Institute of Transportation Engineers Safety Action Plan
 I Institute of Transportation Engineers Safety Action Plan 1. Introduction 2. Intersection Crashes 3. Keep Vehicles on the Road 4. Minimize Consequences When Vehicles Leave the Road 5. School Crossing
1 WPIX-TV CH 11 (CW) 01/15/ :30 AM - 06:00 AM
 01/15/ :30 AM - 06:00 AM") Monitoring Report Future Mobility in New York: the Condition and Use of New York s Surface Transportation System January 14, 2010 1 CW11 Morning News DMA: 1 WPIX-TV CH 11 (CW) New York 01/15/2010 05:30
Monitoring Report Future Mobility in New York: the Condition and Use of New York s Surface Transportation System January 14, 2010 1 CW11 Morning News DMA: 1 WPIX-TV CH 11 (CW) New York 01/15/2010 05:30
Comprehensive Measures to Reduce Traffic Accident Fatalities
 Comprehensive Measures to Reduce Traffic Accident Fatalities Outcomes: 4,621 people died as a result of traffic accidents in 2015. It represents 4% decrease compared to 2014. Year 2012 2013 2014 2015 Traffic
Understanding Rail and Bus Ridership
 Finance Committee Information Item III-A October 12, 2017 Understanding Rail and Bus Ridership Washington Metropolitan Area Transit Authority Board Action/Information Summary Action Information MEAD Number:
DKS & WASHINGTON COUNTY Washington County Transportation Survey
 PREPARED FOR: DKS & WASHINGTON COUNTY Washington County Transportation Survey April 2013 PREPARED BY: DHM RESEARCH (503) 220-0575 239 NW 13 th Ave., #205, Portland, OR 97209 www.dhmresearch.com 1 INTRODUCTION
People killed and injured per million hours spent travelling, Motorcyclist Cyclist Driver Car / van passenger
 Cyclists CRASH FACTSHEET 27 CRASH STATISTICS FOR THE YEAR ENDED 31 DEC 26 Prepared by Strategy and Sustainability, Ministry of Transport Cyclists have a number of risk factors that do not affect car drivers.
Lane Area Transportation Safety and Security Plan Vulnerable Users Focus Group
 Lane Area Transportation Safety and Security Plan Vulnerable Users Focus Group Agenda 1. Planning Process Review 2. What are Emphasis Areas? 3. Your Role Today 4. Data Review 5. Small group discussion
What s Health Got to Do With It? Health and Land Use Planning
 What s Health Got to Do With It? Health and Land Use Planning CANDACE RUTT, PH.D. EXECUTIVE DIRECTOR APRIL 13 TH, 2016 Planning and Public Health Planning + Public Health Healthy Communities Healthier
Mobility and Congestion
 Technical Memorandum Mobility and Congestion Prepared for: Prepared by: September 25, 2013 1 Table of Contents 1. Introduction... 1 2. Congestion Forecasting Process... 1 2.1 Mobility and Congestion Terms...
PRELIMINARY DRAFT FIRST AMENDMENT TO VISION 2050: A REGIONAL LAND USE AND TRANSPORTATION PLAN FOR SOUTHEASTERN WISCONSIN
 PRELIMINARY DRAFT FIRST AMENDMENT TO VISION 2050: A REGIONAL LAND USE AND TRANSPORTATION PLAN FOR SOUTHEASTERN WISCONSIN ESTABLISHING TARGETS FOR FEDERAL PERFORMANCE MEASURES: HIGHWAY SAFETY SOUTHEASTERN
Real-Life Cost of Incomplete Streets
 Real-Life Cost of Incomplete Streets Presented by: Sheree Davis New Jersey Department of Transportation State Bicycle & Pedestrian Coordinator 609.530.6551 sheree.davis@dot.state.nj.us 2011 New Jersey
Walking & Bicycling Questionnaire for Candidates
 Walking & Bicycling Questionnaire for Candidates This Walking & Biking Questionnaire for State Candidates was developed by Hawaii Bicycling League, Kauai Path, Maui Bicycling League, and PATH - Peoples
MTP BICYCLE ELEMENT UPDATE. November 2017
 MTP BICYCLE ELEMENT UPDATE November 2017 TIME FOR AN UPDATE Bicycle Element adopted in July 2008 Almost 10 years old Many planned facilities have been implemented 10 years more experience in planning,
Briefing Paper #1. An Overview of Regional Demand and Mode Share
 2011 Metro Vancouver Regional Trip Diary Survey Briefing Paper #1 An Overview of Regional Demand and Mode Share Introduction The 2011 Metro Vancouver Regional Trip Diary Survey is the latest survey conducted
Building a Toronto that Moves
 Building a Toronto that Moves Image courtesy of the City of Toronto Setting Election Priorities for Walking, Cycling & Public Transit Toronto is a fast-paced, dynamic city. It s a city that moves except
SLOW DOWN A STUDY OF SPEEDING ON MCGUINNESS BLVD
 SLOW DOWN A STUDY OF SPEEDING ON MCGUINNESS BLVD ACKNOWLEDGEMENTS This report was prepared by Shawn Macias, in consultation with the McGuinness Boulevard Working Group. This report would not have been
Stop as Yield Idaho Stop Law
 Stop as Yield Idaho Stop Law Considerations for Fort Collins Bicycle Advisory Committee August 12, 2013 1 Presentation overview Process for collecting information Overview of the Stop as Yield Law Case
Alberta. Traffic Collision Statistics. Office of Traffic Safety Transportation Services Division May 2017
 Traffic Collision Statistics Office of Traffic Safety Transportation Services Division May 217 This page was intentionally left blank. 2 Table of Contents Traffic Collisions... 4 Traffic Collision Rates...
Welcome! San Jose Avenue Open House August 25, 2015
 Welcome! San Jose Avenue Open House August 25, 2015 Vision Zero The City and County of San Francisco adopted Vision Zero San Francisco Vision Zero High Injury Network as a policy in 2014, committing an
Welcome and Introductions Overview of the Study to Date Community Involvement Intersection Improvement Concepts Bike-Ped Recommendations ITS
 Welcome and Introductions Overview of the Study to Date Community Involvement Intersection Improvement Concepts Bike-Ped Recommendations ITS Recommendations Transit Recommendations Next Steps Inventoried
Idaho Driver Education and Training
 Idaho Driver Education and Training Strategies for Controlled Access Highways Part I M13-1 Introduction to Controlled Access Highways Plans for the Interstate System," began in the late 1930s The system
TOWARD ZERO DEATHS: A NATIONAL STRATEGY ON HIGHWAY SAFETY
 TOWARD ZERO DEATHS: A NATIONAL STRATEGY ON HIGHWAY SAFETY June 2014 Dear Highway Safety Stakeholder: As associations that represent government agencies with a professional role in highway safety, we are
INSURANCE INSTITUTE FOR HIGHWAY SAFETY 1005 NORTH GLEBE ROAD ARLINGTON, VA PHONE 703/ FAX 703/
 Statement before the Virginia House of Delegates Militia, Police, and Public Safety Committee Red light violations and red light cameras Stephen L. Oesch INSURANCE INSTITUTE FOR HIGHWAY SAFETY 1005 NORTH
City of Edmonton Office of Traffic Safety
 Overview About OTS Vision 0 Key Facts Speed Management Committee and Speed Management Plan Evidence on Speed and Speeding Complaint Process Data Collection Speed Surveys Collision Review Speed Management
1999 On-Board Sacramento Regional Transit District Survey
 SACOG-00-009 1999 On-Board Sacramento Regional Transit District Survey June 2000 Sacramento Area Council of Governments 1999 On-Board Sacramento Regional Transit District Survey June 2000 Table of Contents
INSURANCE INSTITUTE FOR HIGHWAY SAFETY 1005 NORTH GLEBE ROAD ARLINGTON, VA PHONE 703/ FAX 703/
 Statement before the Virginia House of Delegates Militia, Police, and Public Safety Committee Red light violations and red light cameras Stephen L. Oesch INSURANCE INSTITUTE FOR HIGHWAY SAFETY 1005 NORTH
REGIONAL HOUSEHOLD TRAVEL SURVEY:
 Defining the Vision. Shaping the Future. REGIONAL HOUSEHOLD TRAVEL SURVEY: Profile Why we travel How we travel Who we are and how often we travel When we travel Where we travel How far and how long we travel
2. Context. Existing framework. The context. The challenge. Transport Strategy
 Transport Strategy Providing quality connections Contents 1. Introduction 2. Context 3. Long-term direction 4. Three-year priorities 5. Strategy tree Wellington City Council July 2006 1. Introduction Wellington
America THINKS 2017 Survey Compilation
 America THINKS 2017 Survey Compilation AMERICANS VIEWS ON U.S. TRANSPORTATION ISSUES 25% 15% Combination of tolls and higher taxes Tolls and other fees for using roads, bridges or tunnels Higher taxes
London Safety Camera Partnership
 London Safety Camera Partnership Between 2001 and 2003 over 17,000 speed related collisions occurred in London, of which 2,000 people lost their lives or were seriously injured. Excessive and inappropriate
The I-85 Express Lanes Project NASCIO Recognition Award Nomination
 The I-85 Express Lanes Project 2012 NASCIO Recognition Award Nomination Submitting Agency: State Road and Tollway Authority Nomination Category: Information Communications Technology Contact: Malika Reed
Deaths/injuries in motor vehicle crashes per million hours spent travelling, July 2007 June 2011 (All ages) Mode of travel
 Mode of travel") Cyclists CRASH STATISTICS FOR THE YEAR ENDED 31 DECEMBER 211 Prepared by the Ministry of Transport CRASH FACTSHEET 212 Cyclists have a number of risk factors that do not affect car drivers. The main risk
Cyclists CRASH STATISTICS FOR THE YEAR ENDED 31 DECEMBER 211 Prepared by the Ministry of Transport CRASH FACTSHEET 212 Cyclists have a number of risk factors that do not affect car drivers. The main risk
Road Safety Partnership
 Cambridgeshire and Peterborough Road Safety Partnership Cambridgeshire and Peterborough Road Safety Partnership Introduction Road accidents can have a devastating impact not only for the people directly
An Easier Commute. Learn how to use I-77 Express to save you time.
 An Easier Commute Learn how to use I-77 Express to save you time PUBLIC-PRIVATE PARTNERSHIP I-77 Express is the first-ever toll lane public-private partnership with NCDOT I-77 Mobility Partners is financing,
ROUTES 55 / 42 / 676 BUS RAPID TRANSIT LOCALLY PREFERRED ALTERNATIVE
 ROUTES 55 / 42 / 676 BUS RAPID TRANSIT LOCALLY PREFERRED ALTERNATIVE April, 2012 1 INTRODUCTION The need for transit service improvements in the Routes 42/55/676 corridor was identified during the Southern
Purdue Road Show IN-TIME Executive Session March 8, 2016
 Purdue Road Show IN-TIME Executive Session March 8, 2016 Sources of Congestion Traffic Congestion and Reliability. FHWA (September 2005) Traffic Congestion and Reliability. FHWA (September 2005) 2 Secondary
Maine Highway Safety Facts 2016
 Maine Highway Safety Facts 216 216 MAINE HIGHWAY SAFETY FACTS The Bureau of Highway Safety and the Maine Department of Transportation are pleased to present the 216 edition of Maine Highway Safety Facts.
2018 Transportation Survey October 17, Prepared by:
 Transportation Survey October 17, Prepared by: Overview Methodology Systemwide results Strengths/Weaknesses by mode Importance of possible improvements Conclusions Methodology 500 Chittenden County residents
Walking & Bicycling Questionnaire for Candidates
 Walking & Bicycling Questionnaire for Candidates This Walking & Biking Questionnaire for State Candidates was developed by Hawaii Bicycling League, Kauai Path, Maui Bicycling League, and PATH - Peoples
13,351. Overall Statewide Results. How was the survey taken? Do you own or lease a personal vehicle? What is your primary means of transportation?
 Overall Statewide Results 3 1 Houston 2 Dallas 3 Fort Worth 4 San Antonio 2 11 12 Austin 6 Laredo / Pharr 7 Corpus Christi / Yoakum 8 Bryan / Waco 9 Atlanta / Beaumont / Lufkin / Paris / Tyler Amarillo
Governor s Transportation Vision Panel
 Office of Governor Kate Brown Governor s Transportation Vision Panel JLA Public Involvement Project Overview The is a yearlong effort to develop a series of recommendations for the Governor that address
Strategic Highway Safety Plan
 SAFETY CULTURE CONNECTION INSIDE Sidewalk Safety Decals Installed Rising Motor Vehicle Fatalities What s Trending: Twinkle Treat Baskets Zero Fatalities for Children 1 2 3 4 Calendar 5 Always Buckle Up
DANGEROUS BY DESIGN WISCONSIN. Solving the Epidemic of Preventable Pedestrian Deaths (And Making Great Neighborhoods)
") DANGEROUS BY DESIGN 2011 WISCONSIN Solving the Epidemic of Preventable Pedestrian Deaths (And Making Great Neighborhoods) DANGEROUS BY DESIGN 2011 Wisconsin T4AMERICA.ORG Dangerous by Design 2011: Wisconsin
DANGEROUS BY DESIGN 2011 WISCONSIN Solving the Epidemic of Preventable Pedestrian Deaths (And Making Great Neighborhoods) DANGEROUS BY DESIGN 2011 Wisconsin T4AMERICA.ORG Dangerous by Design 2011: Wisconsin
EAST VILLAGE SHOPPERS STUDY A SNAPSHOT OF TRAVEL AND SPENDING PATTERNS OF RESIDENTS AND VISITORS IN THE EAST VILLAGE
 EAST VILLAGE SHOPPERS STUDY A SNAPSHOT OF TRAVEL AND SPENDING PATTERNS OF RESIDENTS AND VISITORS IN THE EAST VILLAGE CONTENTS 2 4 5 6 7 16 17 19 SUMMARY INTRODUCTION BACKGROUND METHODOLOGY RESULTS CONCLUSION
August NW Glisan St, Suite 401 Portland, OR (503)
") August 2017 618 NW Glisan St, Suite 401 Portland, OR 97209 (503) 226 0676 www.thestreettrust.org headlines New year, new name, broader mission In January, the Bicycle Transportation Alliance became The
August 2017 618 NW Glisan St, Suite 401 Portland, OR 97209 (503) 226 0676 www.thestreettrust.org headlines New year, new name, broader mission In January, the Bicycle Transportation Alliance became The
Frequently asked questions
 Frequently asked questions Improving recreational boating safety Who will be most affected by these reforms? The primary focus of the reforms is the estimated 676 000 recreational marine licence holders
APPENDIX C. Systems Performance Report C-1
 APPENDIX C Systems Performance Report C-1 System Performance Report & Requirements According to the FAST Act, a long range transportation plan needs to include a system performance report and subsequent