Canadian Mark Recovery Program CWT Sampling, Coordination, Lab Operations and Reporting Year 1
|
|
|
- Jessie Clarke
- 5 years ago
- Views:
Transcription
1 Canadian Mark Recovery Program CWT Sampling, Coordination, Lab Operations and Reporting Year 1 October, 2016 Prepared by: K. Fraser Fisheries and Oceans Canada, Pacific Biological Station, Nanaimo, BC Prepared for: Pacific Salmon Commission Under the collaborative agreements: Canadian Mark Recovery Program CWT Sampling and Coordination Canadian Mark Recovery Program CWT Dissection and Reporting 1
2 Glossary All terms that are specific to PSC management are indicated as (PSC) AABM Aggregate Abundance Based Management (PSC) CoTC Coho Technical Committee (PSC) CC Central Coast portion of NC (Areas 6-10) CGSB Canadian General Standards Board CTC Chinook Technical Committee (PSC) CWT Coded Wire Tag CWTIP CWT Improvement Program (PSC) CWTIT Joint CWT Implementation Team (PSC) DFO / Department of Fisheries and Oceans Canada The Department DIT Double Index Tagging DSWG Technical Committee Data Sharing Data Standards Working Group (PSC) ISBM Individual Stock Based Management (PSC) ETD Electronic tag detection FSC First Nations Food Social and Ceremonial fisheries FOS DFO Fisheries Operations Database MRP Mark Recovery Program MRPIS DFO Mark Recovery Program Information System MM Mass Marking MSF Mark Selective Fishing MOU PST Memorandum of Understanding (PSC) NBC Northern British Columbia NC North Coast portion of NBC including Areas 1-5 PFMA Pacific Fishery Management Area PSC Pacific Salmon Commission PSMFC Pacific States Marine Fisheries Commission PST Pacific Salmon Treaty (PSC) RMIS PSMFC CWT database Regional Mark Information System SBC Southern British Columbia TCDS Technical Committee on Data Sharing (PSC) TR18 PSC Technical Report 18 Report of the Expert Panel on the Future of the CWT Program (PSC) TR25 PSC Technical Report 25 An Action Plan in Response to CWT Expert Panel Recommendations (PSC) TR33 PSC Technical Report 33 5-year Synthesis Report of the CWTIP (PSC) WCVI West Coast Vancouver Island 2
3 Table of Contents Glossary...2 List of Tables...4 List of Figures Introduction Background Objectives Study Area Methods Sampling Design and Procedures Estimates of Total Catches and Sample Rates Lab Operations Data Collection, Management and Analysis Results Sampling Effort Estimates of Total Catches Sample Rates Lab Operations Data Collection, Management and Analysis Summary and Project Evaluation Acknowledgements References...31 Appendices...34 Appendix 1. DFO Pacific Fishery Management Areas...34 Appendix 2. DFO Commercial Salmon License Areas...35 Appendix and 2016 Statistical Week Calendars...37 Appendix 4. Chronological Commercial and First Nations Economic Fishery Openings by Gear, Period, and Species...38 Appendix 5. Mark Recovery Sample Form...39 Appendix 6 Head Labels and Container Labels...40 Appendix 7 Freezer Troll Bag Labels and Head Delivery Records...43 Appendix 8. Recreational Fisheries - Salmon Head Recovery Program Public Relations, Sampling Materials, and Procedures...44 Appendix 9 Financial Statement
4 List of Tables Table 1 - Pacific Salmon License Areas...7 Table Protocols for CWT Detection Method in Canadian Commercial and First Nations Economic Fisheries Table 3 - Strata and corresponding Pacific Fishery Management Areas (PFMAs) by Fishery/Gear type Table 4 - Number of Chinook sampled, CWTs recovered, and Mark Incidence by Sampling Location in BC Commercial Fisheries in BC Table 5 - Number of Sport Samples Collected by Area and Month in Table 6 - Comparison of 2014 and 2014 Percentage Sampling Rates and Catch in Canadian by Fisheries Table 7 - Number of salmon heads dissected by category in 2013, 2014, and Table 8 - Number of 2015 commercial fishery sample records entered by month Table 9 - Number of sport caught salmon heads receive by month from nglers and guides in the 2015 calendar year Table 10 - Summary of sport head recoveries submitted and processed in 2015 by species and capture year List of Figures Figure 1 The main components of the data exchange protocols between the Canadian and U.S. CWT database systems Figure 2 - Salmon Head Recovery Depot Locations Figure 3 - Recoveries by Pacific Fishery Management Area
5 1. Introduction This report documents the results of the Canadian Mark Recovery Program(MRP) conducted in British Columbia from April 2015 to March 2016 to conduct a coded-wire tag (CWT) sampling and recovery program to implement Chapter 3 of the Pacific Salmon Treaty(PST) and to support domestic and international stock assessment and sustainable fisheries management. In 2014, the Pacific Salmon Commission (PSC) recognized that management agencies in Canada and the U.S. preparing for the fishing seasons were facing financial challenges in meeting obligations for stock assessment and data collection and would be unable to build existing PSC programs into their agency budgets. Fisheries and Oceans Canada (DFO) had faced increasing budget pressures since 2009 and alternative funding sources such as the CWT Improvement Program (CWTIP) were used increasingly to maintain catch monitoring, CWT sampling, the indicator stock program. Looking forward, anticipated cuts were expected to reduce the extent of fishery monitoring and indicator stocks to levels much less than those that led the PSC to convene the CWT Expert Panel in With the CWTIP ending in 2013 in Canada and in 2014 in the U.S., the PSC Joint Technical Committees, supported by the PSC, identified this project as a very high priority chinook project to address Chapter 3 data needs. The Mark Recovery Program completed its forty-third year of operation in This is year one of a multi-year collaborative project to maintain the MRP to sample, dissect, read, and report statistically-reliable and timely CWT data from British Columbia (BC) fisheries, hatcheries and spawning grounds. 1.1 Background The PST, signed by Canada and the United States in 1985, provides the framework through which the two countries work together to manage and conserve Pacific salmon. A high degree of bilateral cooperation is required to achieve harvest sharing agreements and to help ensure conservation. Pacific salmon are highly migratory and, over the course of their lifecycle, fish originating in the rivers of one country are often subject to the fisheries of the other. With the development of comprehensive evaluations of science-based management regimes on interception fisheries and on the stocks which contribute to those fisheries under the PST, Canada and the U.S. considered it necessary to maintain a CWT tagging and recapture program designed to provide statistically reliable data (PST MOU 1985). Over the last 30 years, a high level of cooperation has occurred between Canada and the U.S. to develop coast wide standards for use of CWTs in tagging projects, for sampling fisheries, tag recovery, data collection and data exchange. DFO relies on the CWT Program to provide stock and fishery specific information for chinook and coho salmon, to evaluate salmon enhancement activities, and to support domestic fisheries management (PSC Reports TCCOHO (13)-1, TCCHINOOK (15)-1, TCCHINOOK (15)-2). The Department also uses the data to determine stock status (Wild Salmon Policy), forecast stock 5
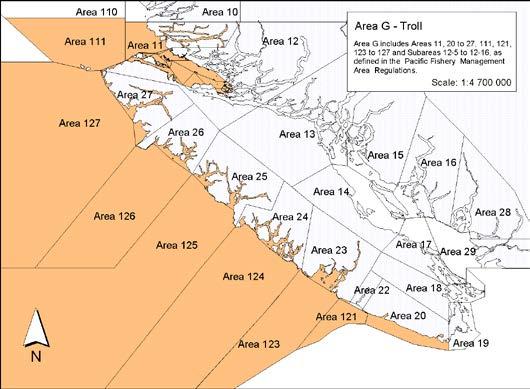
6 abundance, and monitor trends in regional survival patterns for ecosystem-based assessment to support domestic and international sustainable fisheries management. Since the early 2000s, DFO and U.S. agencies have been challenged to maintain the CWT Program given declining resources, increasing fisheries management complexity including the introduction of mass marking (MM) and mark selective fisheries (MSFs). In 2004, as a result of growing concern over the statistical reliability of the CWT Program, the PSC convened an Expert Panel to review the CWT Program (PSC TR18) In 2008, a bilateral Working Group was formed to develop an Action Plan in response to the review. (PSC TR25) In 2009, the comprehensive renewal of Chapter 3 (Chinook) of the PST established a $15,000,000 5-year CWT Improvement Fund to support the CWT Program. (PSC PST) In 2014, with the sun setting of the CWT Improvement Fund, the PSC Commissioners identified this project as a very-high-priority project in response to bilateral concerns over the maintenance of CWT Program improvements that were achieved. (PSC TR32) 1.2 Objectives The specific objectives of this project were: 1) Develop 2015 Statement of Work and negotiate contract for MRP contractual activities, by March 31, ) Complete CWT sampling at sufficient levels (weighted average of 20%) and data entry of commercial, recreational and First Nations fisheries by January 15, ) Complete CWT lab and data entry activities for commercial, recreational and First Nations fisheries, and escapement data by January 15, ) Complete integration of data sources and computer analyses associated with the calculation of stratified CWT estimates by Jan 5) 31, ) Publish data to Pacific States Marine Fisheries Commission (PSMFC) for validation and upload into the U.S. Regional Mark Information System (RMIS) to meet PST data sharing commitments and make data widely available to the PSC Chinook Technical Committee for analysis by Feb 15, ) Complete final project report to PSC for project activities and budget expenditures by Feb 29, Modifications to Objectives 2) Complete CWT sampling and data entry of British Columbia commercial, recreational and First Nations sales fisheries by January 15, This objective was not fully stated. Sampling of Yukon, First Nations Food, Social and Ceremonial (FSC) fisheries, First Nations Demonstration fisheries, and Test fisheries was not within the scope of this project as these activities are the responsibility of DFO Area- Based personnel; However, sampling supplies are provided by the Mark Recovery Unit for consistency in program delivery. 6
7 5) Complete final project report to PSC for project activities and budget expenditures by November 20, For the first year of the project, it was recognized that the schedule for the final report was over-optimistic and was modified to provide a more reasonable time line to balance the workload to provide a meaningful synthesis of results, with the workload within the Mark Recovery Unit to meet PSC commitments, DFO financial year-end obligations, and pre-season and in-season project activities for year 2 of the project. 2. Study Area The study area was the province of British Columbia, Canada. The North Coast Area (NBC) includes tidal waters stretching from the Alaskan boundary in the north to Cape Caution in the south and incorporates the non-tidal waters that flow into this area. This includes Pacific Fishery Management Areas (PFMAs) 1 to 10 and offshore waters as well as adjacent freshwater watersheds. The South Coast Area (SBC) includes tidal waters stretching Cape Caution in the north to the Washington boundary in the south and incorporates the non-tidal waters that flow into this area. This includes PFMAs and offshore waters as well as adjacent freshwater watersheds. Commercial fisheries are also described by License Area as described in Table 1. Pacific Salmon License Area Gear Corresponding Pacific Fisheries Management Areas (PFMA) Salmon Area A Seine Areas 1 to 10, Subarea Salmon Area B Seine Areas 11 to 29 and 121 Salmon Area C Gill net Areas 1 to 10, Subarea Salmon Area D Gill net Areas 11 to 15 and Salmon Area E Gill net Areas 16 to 22, 28, 29 and 121 Salmon Area F Troll Areas 1 to 10, 101 to 110, 130 and 142 Salmon Area G Troll Areas 11, 20 to 28, 111, 121, 123 to 127 and Subareas 12-5 and 12-6 Salmon Area H Troll Areas 12 to 19, 28 and 29 Table 1 - Pacific Salmon License Areas Maps of DFO Commercial Salmon License Areas (Areas A-F) and Pacific Fishery Management Areas (Areas) are provided in Appendices 1 and Methods 3.1 Sampling Design and Procedures The DFO Mark Recovery Unit conducted this project from April 2015 Mar In addition to commercial, First Nations economic, and recreational fisheries sampling conducted under this project, area-based DFO personnel were engaged in CWT sampling in Test Fisheries, with First Nations Food, Social and Ceremonial (FSC) fisheries, and escapement sampling. 7
8 Because fisheries sampling is required throughout year in remote geographic areas and priorities can change quickly to respond to fishery dynamics, often on short notice, DFO conducted this this project using a contracted service provider. The service provider, J.O. Thomas and Associates, was selected through a Public Works and Service Canada open competition, was listed with the Canadian General Standards Board (CGSB 2015b), met ISO 9001 quality management standards (CGSB 2015e), and was designated by Fisheries and Oceans Canada as a certified provider of dockside monitoring services. A bi-laterally accepted sample target of 20% has been established to provide an adequate number of CWT recoveries to meet statistical criteria to estimate fishery and stock parameters (PSC TR25). In 2015, sampling for CWTs was designed to sample 20% of the catch for all Canadian fisheries which allowed legal retention of chinook or coho in BC waters in which salmon with CWT indicator stocks would be intercepted. BC fisheries were CWT sampled using a stratified sampling design by dividing the fisheries into non-overlapping subpopulations by fishery geographic regions (catch regions) and period fished (weeks, months) that are similar in the stock composition of the population present. Under this assumption, estimates of the number of tagged fish harvested in the strata are unbiased for each tag code (TR ). Sample design and methods for Canadian CWT programs varied across fishery types as a result of different DFO catch monitoring programs and different conduct of the fisheries. The definition of the spatial-gear-time strata for sampling was determined by the conduct of the fisheries and the associated DFO catch monitoring program Commercial and First Nations Economic Fisheries For all commercial and First Nations economic fisheries, representative samples were taken at fishery landing stations or processing sites, aligning to the fishery temporal and spatial dynamics with a target sample of 20% of the total landed catch in the fishery within each gear type (troll, seine, and gillnet), Pacific Fishery Management Area and statistical week (beginning Sunday). The sample unit was the entire catch of a selected vessel to reduce the risk of bias by sampling partial offloads. Pacific Fishery Management Areas and statistical week calendars are provided in Appendix 2 and 3. See Appendix 4 for a listing of sampled commercial fishery openings. Southern B.C. area 29 (Fraser River) fisheries, primarily targeting chum during fall fisheries, had a sample target of 30% to increase the likelihood to acquire tags from Fraser River indicator stocks. Historic fishery catch and effort by area, day, and week was modelled and used as a tool to develop sample plans and set weekly sample or daily quotas to adjust for in-season fishery dynamics. Sample opportunities were identified using fishery notices, daily phone-ins, electronic catch and offload reports from vessels, and direct contact with DFO fishery managers and primary buyers to confirm times and locations for sample events. In some fisheries, conditions of license provided designated offload locations. 8
9 Samplers were deployed to primary offload sites but occasionally operate in secondary processors in Nanaimo or Vancouver for cost effective program delivery in net fisheries. At primary offload sites, the sample unit is the catch of an entire vessel to reduce the risk of bias by sampling partial offloads. At secondary processors, if the catch from individual vessels has been mixed, the sample unit is the truck. Access to fish in commercial and First Nations economic fisheries is ensured by the Fishery (General) Regulations (DFO 1993) which state: When requested, the master or owner of fishing vessels and the owner or any person who has the care, charge or control or a fish landing station must permit access to the catch and provide CWT samplers with assistance that is reasonably necessary to enable them to perform their duties according to DFO-approved sampling protocols including: (i) Making the fish readily accessible to the CWT samplers, (ii) Providing samplers with a suitable work area, and (iii) Permitting CWT samplers to remove the head from the fish free of charge. For commercial landings selected for CWT sampling, the sampling event included a vessel operator interview designed to collect vessel identification information, fishing period, and fishing location. Samplers counted and sampled all of the landed fish, and collected all heads with tags following DFO protocols for visual sampling or full electronic sampling. Heads of CWTtagged fish were recovered, labelled with durable bar-coded and numbered waterproof tags. Each tag recovery was measure for length. All data associated the landing and head recoveries were recorded on uniquely numbered waterproof Mark Recovery Sample Forms which were delivered to the Project office within one week of field sampling. Samples were packaged and labelled with waterproof container labels and shipped or delivered to the CWT Head Lab for processing within one week of field sampling. Mark Recovery Sample forms and Commercial head labels and container labels can be found in Appendix 5 and 6. Detection Method In all commercial and First Nations economic fisheries, the method for CWT detection is dependent upon the presence of mass marked or double index tagged fish in the fishery. A requirement for all sampling was that each fish in a sample was inspected and that all heads identified as potentially containing a CWT are collected for lab processing. Visual sampling requires a fish to be inspected for a missing adipose fin to indicate that there is a CWT. Electronic sampling requires all fish in the sample to be inspected, regardless of adipose clip status, with electronic tag detection (ETD) by passing the fish through a tube detector or using a handheld wand. Visual sampling is the cost effective method to CWT sample for fisheries which do not encounter mass-marked Chinook or Coho because the adipose-clip is a cue to recognize that a fish contains a CWT. Full electronic sampling is required in all fisheries that encounter large proportions of mass-marked (MM) Chinook or Coho and intercept doubled index tag (DIT) stocks to ensure all tags in the sample are acquired because the is no visual cue 9
10 to indicate a fish contains a tag. Visual sampling combined with electronic screening is effective in reducing the effort to sample, the impact on the harvester or buyer, and the cost to ship heads in fisheries that encounter large proportions mass-marked Chinook or Coho but do not encounter DIT stocks. Detection methods by geographic fishing area are provided in Table Chinook MM fish present DIT fish present Detection Method NC & SC marine mixed stock fisheries Y Y E NC & SC inshore terminal fisheries N N V WCVI marine mixed stock fisheries Y Y E WCVI inshore terminal fisheries (Areas 21, Nitinat, Clayquot Sound, N N V Nootka/Esperanza, Kyuquot Soutnd, Quatsino) WCVI inshore and terminal Robertson Creek fisheries (Area 23 Barkley Sound and Alberni Inlet) N N V SC Inside Areas (Johnstone Strait, Strait of Georgia), Juan de Fuca Strait) Y Y E Fraser River terminal fisheries N N V Table Protocols for CWT Detection Method in Canadian Commercial and First Nations Economic Fisheries Custom sampling infrastructure such as sorting tables, stands and receiving tables that can accommodate electronic tube detectors have been integrated into many fish offload sites or processing operations to facilitate positive relationships with industry to minimize disruption to the industry s offloading and grading processes. Freezer Trollers To ensure freezer troll caught heads are available to sample, the Department has established a condition of license for all troll vessels that remove heads at sea prior to freezing to retain and land heads with their catch. With this condition of license, the legal mechanism to select a random sample of vessels to retain heads can be put in place through a fishery notice that exempts randomly selected vessels from the condition of license (thus designating the remainder to keep heads). For the Northern BC Area F troll fishery, 70% of the fleet was exempted from the condition of license (30% sample target). This higher sample target was established in recognition that that historically, the compliance rate to provide samples that meet MRP quality assurance standards has been about 70%, resulting in an adjusted post-compliance sample target of 21%. Recognizing that vessels may have space limitations for retaining heads, the Department allowed the alternative of retaining only the portion of the head likely to contain the CWT, referred to as the snout and provided instructions that, at a minimum, the portion of each head retained must include the upper portion of the head extending from the tip of the snout to a cut travelling from the top of the head, passing 1 centimeter behind the eye, and ending at the back corner of the mouth. The 2015 conditions of license required the following protocols for head storage: Heads must be stored in DFO-supplied heavy weight Salmon Head Recovery Program.
11 Heads must be kept frozen until delivery and each bag must contain only the heads from a single week of fishing (where weeks run from Sunday to Saturday). All bags must be labelled completely with DFO-supplied Freezer Troll Bag labels and securely closed. The vessel master shall ensure that all bags containing heads are offloaded at the first designated fish landing station at which chinook or coho catch is offloaded. All freezer heads that were landed were sampled electronically to acquire CWTs. Essential sample information included the recording of compliance data to support enforcement using Freezer Troll Delivery Record and Mark Recovery Sample forms, to support tracking and adjudication, to collect data to ensure that samples meet DFO standards for quantity (> 95% heads landed vs. # bodies landed) and quality (> 80% heads landed frozen with correct head cut > 1 cm behind eye), and to provide sample resolution at the individual bag level. All data associated the landing, the sampling of bags, and tag recoveries were delivered to the Project office within one week of field sampling. Freezer Troll Bag Labels and Freezer Troll Delivery Records can be found in Appendix 7. T aaq-wiihak and Kamloops Lake Demonstration Economic Fisheries CWT sampling for First Nations demonstration fisheries was not within the scope of this project, while sampling supplies are provided by the Mark Recovery Unit for consistency in program delivery. In 2015, the Kamloops Lake Demonstration fishery had a higher requirement for catch monitoring by the Department, which included CWT sampling of 100% of the catch. In 2015, the WCVI T aaq-wiihak fishery had the same target sample rate and sampling methods, using the same contracted service provider, as all other commercial and economic fisheries. While are procedures were the same, with Mark Recovery Unit personnel involved in training and audits for quality assurance/quality control Test Fisheries CWT sampling for Test fisheries is not within the scope of this project, while sampling supplies are provided by the Mark Recovery Unit for consistency in program delivery. In 2015, DFO and PSC fisheries were required to sample 100% of their catch visually. CWT sampling protocols and MRP Research Head Labels were provided to DFO area-based project leads, who were responsible for CWT sampling, attaching barcoded waterproof labels to head recoveries, labelling boxes or containers of samples with MRP Container labels, shipping or delivering the containers to the DFO Head and data entry of research sample data into the DFO Fisheries system. Research head labels can be found in Appendix Recreational Fisheries 11
12 For all recreational fisheries, samples are provided to DFO through fisher submissions to Salmon Head Recovery Depots throughout BC. The target sample rate is 20% of the estimated marked catch in the fishery within each catch region and month. Because of the reliance on fisherprovided samples, sample rates are also known as submission rates in recreational fisheries. It is cost-prohibitive to acquire the 20% sample target through direct sampling of recreational fisheries due to the wide distribution of the fishery throughout the year and throughout BC. For all recreational fisheries, the sampling method involved public relations and promotion of the sampling requirements to support future fisheries. Samples were acquired by requesting marinas, tackle stores, fishing lodges, and hatcheries to sign-up as Salmon Head Recovery Head Depots and by requesting anglers, guides or lodges to use visual sampling protocols to identify samples, label heads with DFO-supplies water-proof labels, and submit the head to a network of Salmon Head Depots. More than 250 Salmon Head Depots were located throughout BC, and Salmon Head Depot operators provided sampling supplies to anglers and stored the samples in freezers or buckets containing a brine solution to preserve them. Scheduled servicing and maintenance of Salmon Head Depots was performed by J.O. Thomas and Associated under contract or by area-based DFO personnel. All samples picked up from depots were labelled in batches with barcoded DFO container labels to associate the samples to the service event. Maintaining positive public relations is essential in this sampling regime so the Department maintained a toll-free line for inquiries or issues, maintained detailed records of servicing, provided feedback to Depots regarding servicing events via a Depot Service Log and Postcard, and provided letters with CWT results to anglers, guides, and depots at regular intervals through the season. Recreational Head Labels and Container Labels can be found in Appendix 6. Additional Salmon Head Recovery Program public relations and sampling materials are provided in Appendix First Nations Food Social and Ceremonial (FSC) and Treaty Fisheries CWT sampling methods varied in these fisheries due to the variation in area-based delivery of catch monitoring programs in FSC and Treaty fisheries and regional differences in priorities for CWT sampling. Collaboration with First Nations fisheries managers and communities is essential to access samples. In some FSC fisheries, CWT sampling was integrated into the catch monitoring program and samples were acquired by First Nations monitors as fish were landed. In other fisheries, samples were acquired as they are for recreational fisheries by requesting aboriginal harvester to use visual sampling protocols to identify samples, label heads with DFO-supplied water-proof labels, and submit the head to a fishery monitor, guardian, or to a Salmon Head Depot. 12
13 As in all other fisheries, each head sample was labelled with a barcoded waterproof label and all samples were shipped or delivered to the DFO head lab with barcoded waterproof container labels to associate the samples to the service event. FSC Head Labels can be found in Appendix 6. CWT sampling for these fisheries is not within the scope of this project, while sampling supplies are provided by the Mark Recovery Unit for consistency in program delivery. 3.2 Estimates of Total Catches and Sample Rates In order to estimate the total number of tagged fish in harvest, the sampled tags are expanded for the fraction sampled by strata (area, gear, and period). The sample fraction is the number sampled over the total available for sample, i.e., the total catch. Catch data for each chinook and coho fishery was collected and assembled by DFO resource managers and stock assessment programs from a variety of sources such as logbooks (paper and electronic), fishery phone-in hails, harvester/creel surveys, aerial or on-water gear counts, on-board observers, dockside monitoring/validation tallies, individual quota fishery reports, landing slips, and buyer fish slips. The extent and intensity of the monitoring requirements varied significantly with the fishery s size and location, particular management risks and information challenges, and other factors. (DFO 2012). While the form of catch monitoring may vary across fisheries, all DFO catch monitoring programs collected data to support an estimate of the total pieces of chinook or coho caught in the fishery by Pacific Fishery Management Area. DFO Recreational and First Nations FSC catch monitoring programs had the additional objective to estimate the mark rate for adipose clipped chinook and coho harvested by Pacific Fishery Management Area. 3.3 Lab Operations All fish head samples collected in fisheries and DFO escapement sampling programs were processed to recover and decode CWTs at the DFO-contracted J.O.Thomas and Associates CWT dissection lab in Vancouver. This process involved the management of all samples received and the dissection, reading (decoding) the tag using microscopes electronically equipped with LCD screens, transcribing the tag information to appropriate forms, and data entry. Dissection required the use of a specialized electronic metal detector that indicates which portion of the snout the CWT is in after successive sectioning of the sample. If no tag was found, the sample was passed through a magnetic field to re-magnetize the tag (if present). Tag dissection schedules were structured to process sport and commercial recoveries within six weeks of receipt. Commercial recoveries were processed by sampling location and by statistical week, while sport recoveries were processed by area and month of recovery. Escapement heads were processed on the basis of priorities established by DFO stock assessment and hatchery personnel to ensure completion of milestones for analysis by January and February. 13
14 The lab maintained quality control checks on the reading of CWTs to ensure that tags were accurately read and data entered. To check the accuracy of tag reading, each tag was initially read by a technician and the read a second time by a different technician to verify the first reading. Several error checks were run, including verification that the tagcode is legitimate (ie, was previously released) and that the species is correct and the age is reasonable. 3.4 Data Collection, Management and Analysis All personnel responsible for sampling received training in the purpose and methods for the surveys and were supervised by experienced staff for quality control/quality assurance. Standard forms and data collection processes were developed to optimize field data collection, and all forms were manually reviewed by field chiefs and office staff to ensure that obviously erroneous data were corrected. For commercial and First Nations economic fishery sampling, the Mark Recovery Sample Forms were designed to record incomplete or problem samples as an addition quality control measure. All samples were managed with barcoded container labels and head labels. Data forms were delivered from all programs within a week of sampling, where they were sorted by data prior to data entry. Custom J.O. Thomas and Associates data entry applications were used throughout the season to input and validate field data. DFO audit procedures of field work and data entry were performed for early checking of the quality of the data collection process. Data was uploaded and validated by the MRP Information System (MRPIS) at regular intervals and further validated against an extensive set of checks to verify the in integrity and accuracy of the data. The rules are specified in the PSC Data Standards Workgroup (DSWG) database specification report (PSC-DSWG 2014). Data Analysis was conducted using the MRPIS system to integrate sample data with lab data and post-season catch estimates from January Feb Kuhn et al. (1988) summarize formulae utilized by the MRPIS to calculate CWT tag estimates, stratified by gear, geographic area and time. All samples from direct sampling programs in commercial, test and First Nations economic fisheries were expanded to the estimated total catch in the fisheries. Samples mark catch from submission sampling programs were expanded to the estimated total of marked catch in the fisheries. Upon completion of the CWT estimation process, CWT data was available to users directly from the MRPIS. Upon completion of the data exchange with the PSMFC, validated datasets of summary Canadian CWT recoveries, catch and samples are available to U.S. users through RMIS. Likewise, U.S. CWT recoveries, catch and samples provided by the PSMFC is imported into the MRPIS. The data flow process for the MRPIS and RMIS are documented in Figure 2 (PSC TR25). 14
15 Figure 1 The main components of the data exchange protocols between the Canadian and U.S. CWT database systems 4. Results 4.1 Sampling Effort Commercial and First Nations Economic Fisheries All BC commercial and First Nations salmon fisheries with retention of Chinook or Coho as target species or by-catch were sampled consistently over the entire season. See Appendix 4 for a list of sampled commercial fishery openings in Commercial catches are landed and processed at a wide variety of locations, landing sites, and processing plants. The extremely complex mixture of net and troll fisheries which occur simultaneously for salmon, the large number of processors involved at different locations, and the differing processing and grading systems used by these processors all combined to make the task of obtaining representative samples from each statistical area for each type of gear a very difficult undertaking. A further complication is the requirement for electronic detection sampling, and the availability of physical space. Allocation of resources to meet sampling 15
16 requirements was accomplished by a dynamic Coordinated Location Sampling Strategy. This method relies on the experience of several key management personnel as well as senior staff coordinating schedules in each of the field sample locations to achieve necessary sample quotas. Project managers allocate sampling effort based on past and present experience of fishery dynamics and in-season reports from DFO to predict probable vessel landing locations and known processors where fish would be landed. Sampling crews kept in constant contact with project managers to ensure that sampling quotas were being met and to coordinate sampling effort between different locations. This system ensured coastwide, representative catch and biological sampling by MRP crews in an efficient and cost-effective manner. Net and troll fisheries present different problems in estimating catches and therefore required different catch assessment procedures. Net fisheries operate in a more restrictive spatial and temporal profile from those of troll fisheries. The primary process to establish quotas is to first acquire information on the fleet size by gear, and second, determine the catch of the target species. Most net fisheries target on more abundant species like sockeye, pink or chum salmon. For gillnet fisheries, sample quotas are set on sampling a prescribed number of boat deliveries, as well as a number and weight of the target species catch. Seine fisheries are generally sampled to a specified number of vessel landings. Sampling levels are established to acquire 20% of troll and net vessel deliveries and account for the unloading of approximately 20% of the target species catch, respectively by gear type. For troll fisheries, quotas and sample rates are generally calculated and monitored by evaluating weekly and accumulated boat days sampled. Geographic strata used in the MRP divides the British Columbia coast into 14 net and six troll fishery specific strata (Table 3). Each stratum may contain one or more Pacific Fishery Management Areas (PFMAs). Fishery/Gear Fishery Strata PFMAs Commercial/Troll Northern Troll 1 to 5,101 to 105,2W,142 North Central Troll 6,106,7,107,8,108,9,109 South Central Troll 10,110,11,111,12 Georgia Strait Troll 13 to 18, 29 Southwest Vancouver Is Troll 21,121,23,123,24,124 Northwest Vancouver Is Troll 25,125,26,126,27,127 Commercial Net, First Northern Net 1 to 5,101 to 105,2W,142 Nations Economic & Test Fisheries Central Net (excluding PFMA 8 terminal) 6,106,7,107,9,109,10,110 Central Net Terminal PFMA 8, 108 8,108 Johnstone Strait Net 11,12,13 Georgia Strait Net 14 to 18 Juan de Fuca Net 20 Northwest Vancouver Is Net 25 to 27 Fraser Seine 29-3,29-4,29-6 Fraser Gillnet & Test Fisheries 29 Skeena Test Fishery 4 South Taaq-wihak Economic Fishery 23,123,24,124 North Taaq-wihak EO Fishery 25,125,26,126 SW Vancouver Is Net excl. Alberni Inlet 21, 24 Alberni Inlet Gillnet + Tsu-mass Economic Fishery 23 Table 3 - Strata and corresponding Pacific Fishery Management Areas (PFMAs) by Fishery/Gear type 16
17 Commercial sampling effort was distributed throughout BC at 3 ports and 7 landing sites in Northern BC and at 9 ports and 16 landing sites in Southern BC. Distribution of sampling effort closely followed fishing effort during the season. In NBC fisheries, the sampling period extended from June to September, while in SBC fisheries, the sampling period was year round. The MRP program sampled 68,813 commercially caught for CWTs in In 2015, 67% in NBC and 4% in SBC froze Chinook catch at sea. The majority (58%) of commercial landings of chinook were sampled in North Coast locations in Port Edward, Masset, and Prince Rupert sampled 34%, 23%, and 1% of all samples, respectively. The remaining 42% of samples were obtained in Ucluelet/Tofino/Nanaimo/French Creek (16%), Vancouver/Richmond/Delta (13.5%), and Coal Harbour/Port Hardy/Zeballos (12.5%). A total of 3,568 CWTs were detected and recovered from chinook and coho from random commercial fishery samples in The distribution of samples and CWT recoveries for chinook and coho by fishery is provided in Table 4. The vast majority of chinook samples (91%) and CWT recoveries (90%) originated from troll fisheries in Random samples in net fisheries represented 9% of all samples and 10% of the CWT recoveries. Table 4 - Number of Chinook sampled, CWTs recovered, and Mark Incidence by Sampling Location in BC Commercial Fisheries in BC 2015 Freezer Trollers When fish were landed to port,sample crews were required to intercept the offloads of all designated freezer trollers to maximize the recovery of heads retained. Vigilant communication with processors who receive troll deliveries was also required in order to intercept and sample all the freezer troll vessels designated for head retention. This process was aided during the 17
18 Area F chinook ITQ fishery because, under a separate individual quota management contract with harvesters, fishers are required to hail in to a JO Thomas toll-free phone number before delivering their fish to a port processor. Freezer troll offloads were also visually sampled for the presence of adipose fin-clipped fish in addition to the electronic sampling of any heads that were retained by the vessel to obtain mark rates. If a freezer vessel retained all of the heads, the offload was to obtain the total number of fin-clips in the sample; however, the fin-clip status for each head that contained a CWT was unknown as it is impossible to determine which body the head originated from. Occasionally, a less desirable situation occurred when the vessel selectively retained the heads of only adipose fin-clipped fish. This resulted in a non-random sample that could not be utilized for analysis. MRP sampling involved visual identification and counting of all mixed chinook and coho bodies delivered by a vessel. All bagged freezer heads were sampled for CWTs by the MRP crew by thawing out the heads and putting them through the R9500 detector, segregated by bag data where provided. The corresponding heads from that vessel were also counted by species and adjudicated for cut quality basically a tally of good (head cuts that met DFO criteria) and bad (head cuts that did meet DFO criteria) was made. The data comparing the number of chinook/coho heads to the number of chinook/coho bodies delivered and the percent of good and bad head cuts are key to the determination of an acceptable quality sample or not. Good quality samples that had greater than 95% of heads retained and good quality head criteria resulted in the sample being defined as Random. Samples of less than 95% of heads retained and an unacceptable proportion (>20% bad head cuts) rendered a non-compliant sample, and was designated as a Select sample Recreational Fisheries Recreational sampling effort occurred primarily from May September. Sport anglers provided head samples of adipose fin-clipped salmon to 259 Sport Head Recovery Program s Salmon Head Recover Depots located throughout the province at marinas, resorts, tackle shops, DFO offices, or DFO Hatcheries. Depots were provided with an information package at the beginning of the season which contained head labels and promotional materials. They were also provided a letter summarizing the origins of all the heads that were returned to them in the previous year. In many sport fishing locations, chest freezers and associated infrastructure (freezer and bucket enclosures, sign boards, and posters) were supplied by DFO and distributed and maintained by the contractor. 18
 in 2015. Of this total, 9,724 heads were from chinook and 3,060 were from coho.")
.")
19 Figure 2 - Salmon Head Recovery Depot Locations Figure 3 - Recoveries by Pacific Fishery Management Area A total of 12,845 salmon head recoveries were submitted by sport anglers and collected through the MRP Sport Head Recovery Program (SHRP) in Of this total, 9,724 heads were from chinook and 3,060 were from coho. The remaining heads were comprised of six chum, six steelhead, and 49 that were pink, sockeye or unknown species. The total number of sport heads collected or submitted in 2015 was 18% fewer than the number of heads received in 2014 (15,594). A breakdown of the number of heads received by month and area is presented in Table 5. The majority of heads originating from recreational fisheries were caught and submitted in the summer months from June to Sept ( Figure 3.1) and originated from the west coast of Vancouver Island (Areas 23-27, ), the Queen Charlotte Islands (Areas 1, 101, 2W, 142), and the Strait of Juan de Fuca (Areas 19, 20) sport fisheries. The number of sport recoveries in 2015 is comparable to historic highs seen in the early 1990s (10,000+ recoveries annually). The number of heads submitted to the program dropped dramatically in the mid-1990s as a result of lowered overall abundance and the introduction of mass marking. 19
20 Table 5 - Number of Sport Samples Collected by Area and Month in 2015 Dedicated contractor MRP sport samplers picked up heads from and serviced all depots with supplies along the Strait of Georgia, west coast Vancouver Island, and the Fraser Valley and maintained visitation and service records. Depots in the North and Central coast and Interior BC were maintained and serviced by contracted field staff in Prince Rupert and Masset. DFO Fishery Officers or representatives from regional DFO offices also received head submissions and shipped them to the DFO-contracted head lab. For remote locations and lodges in Areas 12, 13 in Johnstone Strait, and Areas 26, 126 and 25, 125, 27 and 127 in Northern West Coast Vancouver Island, Salmon Head Recovery Depots were serviced with support from DFO offices in 20
21 Campbell River and Port Hardy. The contracted sport sampler arranged pick up of heads from these fisheries through staging depots in Port Hardy for Areas 12, 13, 26, 126, 27, and 127 and Campbell River for Areas 12, 13, 25, and 125. Table 5 provides a total of Chinook and Coho heads submitted by the Sport Sector in Fisher-provided samples may introduce bias in the CWT data. Anglers who return tags may not represent the fishing patterns of all anglers, resulting in some tag groups being overestimated and others underestimated. There is no recovery of unmarked tags (from double index tag (DIT) groups). 4.2 Estimates of Total Catches Northern British Columbia (NBC) Fisheries NBC Chinook Aggregate Abundance-Based Management (AABM) The pre-season abundance index for NBC troll and Haida Gwaii recreational chinook fisheries in 2015 was 1.23, which permitted a total allowable catch of 160,400 chinook salmon in these fisheries. Catch estimates indicated a total catch of 158,302 chinook salmon; 106,702 caught in commercial troll fisheries and 51,600 in the Haida Gwaii recreational fishery (Queen Charlotte Islands Areas 1 and 2). In 2015, 67% of the fleet froze their catch at sea. NBC Chinook Individual Stock-Based management (ISBM) Fisheries included in this category are commercial net fisheries throughout north and central BC, First Nations FSC fisheries in both marine and freshwater areas, marine recreational fisheries along the mainland coast, and freshwater recreational. The NBC troll fishery was opened for chinook fishing from June 18 to July 30 and from August 25 to September 30. Of the total 160,400 caught, over 80,000 pieces were landed in the first two weeks of the fishery while 24,015 were landed prior to July 30 and 2,683 were landed during the second opening. North Coast commercial gill net catches totalled 2,413 chinook from Areas 3 to 5 (from hailed catch data). Central Coast commercial gill net catches totalled 5,333 chinook with 5,328 from Area 8 and 23 from Area 7. A total of 787 chinook and jacks were caught in the Tyee Test fishery on the Skeena River. AABM recreational catch in Areas 1-2 were estimated at 51,600. Preliminary estimates for tidal recreational catches near the mainland coast of NBC in were 12,760 from a creel survey conducted in Areas 3 and 4 in Approximately 11,930 chinook were retained at lodges operating in Smiths Inlet, Rivers Inlet, Hakai Pass and Bella Bella in areas 6-9 of the central coast in In the North Coast, Haida catches on Haida Gwaii were estimated at 2,530 chinook, Nisga'a and Gitanyow catches from the Nass River were 8,503 chinook and catches by First Nations fisheries in the Skeena River were estimated at 6,491 chinook. Catches by First Nations in the tidal portion of the Central Coast were reported as 180 chinook. The non-tidal catches included 2,598 Atnarko River chinook (Area 8) from May September and 2 chinook from Rivers Inlet (Area 9). 21
22 Southern British Columbia Fisheries For the 2014/2015 chinook year (October 2014 to September 2015), fisheries were shaped by conservation concerns for the following domestic stocks: natural WCVI, Lower Strait of Georgia (LGS), and Fraser River Spring 4 2, Spring 5 2, Summer 5 2 chinook and Interior Fraser River coho. Commercial measures included barbless hooks, time and area closures, gear restrictions, mandatory use of revival tanks, daily catch reporting, mandatory logbooks and non-retention provisions for most fisheries. Recreational measures included barbless hooks, time/area closures, size restrictions and mark selective fisheries. In 2015, recreational fisheries in freshwater areas were also closed for parts of the summer in many parts of SBC due to high water temperatures. FSC management actions included time and area closures and reduced fishing times. SBC Chinook Aggregate Abundance-Based Management (AABM) For the period October 2014 through September 2015, the forecast chinook abundance index was 0.85 of the PST base period. Therefore, under treaty provisions, the maximum allowable catch was 127,278 chinook for WCVI AABM fisheries. SBC Chinook Individual Stock Based management (ISBM) Fisheries included in this category are commercial net fisheries throughout SBC, marine recreational fisheries along the inside areas, freshwater recreational, and First Nations FSC fisheries in both marine and freshwater areas. Catch estimates indicate a total catch of 54,260 caught in the Area G commercial troll fishery. In 2015, 4% of the fleet froze their catch at sea in the WCVI troll fishery. In 2015 there were no seine fisheries; however an Area D gillnet opening in Alberni Inlet in early September targeting chinook returns to Robertson Creek Hatchery had a total catch of 438 pieces and an Area D gillnet opening in Tlupana Inlet targetting chinook returns to the Conuma River hatchery had a catch of 9,615 pieces. There were no Area E gillnet fisheries in Georgia Strait in 2015.The total number of chinook harvested during the Fraser River Albion test fishery from April to October was 2,655. An additional 1,124 adults and 61 jacks were harvested in the Fraser River PSC test fisheries at Whonnock, Cottonwood, and Qualark. The WCVI AABM recreational chinook catch and effort are largely driven by abundance and weather, and together both can affect annual harvests. The fishery primarily takes place in offshore Areas from June to September. Chinook catch in the AABM recreational fishery is estimated through several catch monitoring programs, including a creel survey, and a logbook program. In 2015 marine recreational fisheries were monitored by creel surveys in five main areas: 1) Johnstone Strait including Areas 11 to 13; 2) The Strait of Georgia including Areas 14 through 18, that portion of Area 19 north of Cadboro Point, Areas 28 and 29; and West Coast Vancouver Island; 3) Juan de Fuca including Victoria (south of Cadboro Point), 22
23 4) Juan de Fuca Strait through Subareas 20-1, 5) WCVI, and 6) Fraser River. Monitoring of these fisheries has been fairly consistent from year to year using an access point (landing site) survey for collecting catch and CPUE, combined with an aerial survey for effort counts. In addition, logbook programs, directed at estimating the recreational catch by fishing guides during guided trips, were conducted in the Campbell River, Victoria and WCVI Areas in In 2015, the total recreational catch was 196,817. First Nations Economic In 2015, the Department authorized an AABM chinook salmon economic fishery for the T aaqwiihak Nations between July and September. This fishery was monitored by T aaq-wiihak fishery monitors and DFO staff. Both the WCVI troll fishery and the T aaq-wiihak fishery were verified by J.O. Thomas and Associates, a company that provides independent certified dockside monitoring services. 6,234 chinook were caught in the T aaq-wiihak economic fishery In 2015, in the WCVI inshore area, there was a First Nations economic fishery in Alberni Inlet in early September targeting small male chinook salmon returns to Robertson Creek Hatchery with an estimated catch of 6,692 chinook, and a T aaq-wiihak economic fishery in Nootka Sound targeting enhanced returns to Conuma River and Burman River with a catch of 54 chinook from Conuma and 978 chinook from Burman. In the Lower Fraser Area, a total of 22 chinook were harvested as bycatch in pink and chum economic fisheries in September. In the B.C. Interior, the Secwepemc Fisheries Commission harvested 2,493 chinook on Kamloops Lake in September. First Nations Food Social and Ceremonial (FSC) and Treaty Total AABM chinook reported for First Nations FSC and domestic fisheries was 3,946. The 2015 WCVI Nuu-chah-nulth Tribal Council (NTC) AABM FSC chinook reported catch was 996, and catch from Maa-nulth Nations domestic fisheries was estimated at 3,384. Catches by First Nations fisheries in Johnstone Strait, Strait of is estimated at 261 and 4 respectively. Catches by First Nations in the Fraser and Thompson watershed were 20,
24 4.3 Sample Rates Chinook Salmon Retention Fishery Area % Sample Rate Northern BC (Areas 1-5, , 142) 1 AABM Troll 20.3% 32.7% 2 AABM Sport Haida Gwaii (Areas 1, 2W) 60.9% 27.3% 3 ISBM Net Area 3 & 4 Gillnet 6.9% 31% 4 ISBM Sport Nass/Skeena Tidal (Areas 3-5) 12.4% 34.3% 5 ISBM Troll No Fishery No Fishery 6 ISBM First Nations Food, Social, Ceremonial (FSC) 1 0% 0% 7 ISBM Test Fishery Skeena Tyee Gillnet % 85% Central BC (Areas 6-10, , 130) 8 ISBM Net Area 7 & 8 Gillnet 39.2% 17.5% 9 ISBM Sport Areas % 78.5% 10 ISBM Troll Areas 6-10 No Fishery No Fishery 11 ISBM First Nations Nuxalk Bella Coola R FSC 2 100% 100% West Coast Vancouver Island (Areas 21-27, ) 12 AABM Troll 26.5% 29% 13 AABM Sport 17.1% 26.7% 14 AABM First Nations Commercial T aaq-wiihak % 46.1% 15 ISBM Net No Fishery No Fishery 16 ISBM Sport 26.6% 29.1% 17 ISBM First Nations Economic Tsu-Ma-Uss Alberni Inlet 0.6% 28.3% Johnstone Strait (Area 11-13) 18 ISBM Net No Fishery No Fishery 19 ISBM Sport 35.8% 31.9% 20 ISBM First Nations FSC 1 0% 0% Strait of Georgia (Areas 14 18, 28, 29) 21 ISBM Net No Fishery No Fishery 22 ISBM Sport 20.2% 22% 23 ISBM First Nations FSC 1 0% 0% Strait of Juan de Fuca (Areas 19, 20) 24 ISBM Net No Fishery No Fishery 25 ISBM Sport 15.8% 8.2% Fraser River 26 ISBM Net Area E Gillnet 25% No Fishery 27 ISBM Sport 14.9% 8.3% 28 ISBM First Nations FSC 2 8.6% 14.7% 29 ISBM Test Fishery Albion, Cottonwood, Whonnock, Qualark 2 90% 99.5% 1 Multiple complex First Nations Food, Social and Ceremonial (FSC) harvest agreements with no First Nations catch monitoring and low catch. 2 Sampling programs for these fisheries are funded through alternate DFO resources. CWT sampling is small incremental cost to Test Fishery programs. Table 6 - Comparison of 2014 and 2014 Percentage Sampling Rates and Catch in Canadian by Fisheries 24
25 4.4 Lab Operations The MRP dissection laboratory processed 30,251 salmon head samples in 2015, representing a 19% decrease from the previous year (37,309 heads processed in 2014) (Table 7). Table 7 - Number of salmon heads dissected by category in 2013, 2014, and 2015 Commercial head dissections, which included samples from Test Fisheries (Albion, Cottonwood, Whonnock, Qualark (Fraser River); Tyee (Skeena River); and Yukon (lower Stikine River)), and First Nations Economic and Demonstration fisheries, decreased by 10% in 2015 compared to The highest increase by category was observed in the Miscellaneous/Small Projects/Research category. There was a five-fold increase in the number of heads received from this category in 2015 compared to Part of the reason for this increase was the receipt of 247 samples that were not dissected in 2014 after the CWTIP period that were recovered in the DFO Sardine Trawl survey in 2013 and Other projects included the Hake Trawl Incidental Salmon Catch Program (Archipelago Marine Research), WCVI Acoustic Trawl Survey, La Perouse Juvenile Chinook Study, Tyee Club Research, Kyuquot/Brooks Peninsula Chinook Research, and the Capilano River Hatchery Chinook Study. First Nation FSC samples were approximately the same as the previous two years; down about 7% and 13% in 2015 compared to the 2014 and 2013, respectively. Sport head recoveries were down modestly by 13% in 2015 compared to those processed in Escapement samples were also down by about 31% in 2015 compared to those received in The lab processed 207 heads from DFO and PSC Test Fisheries in 2015; 131 from Albion (DFO Fraser River), 14 from Whonnock/Cottonwood (PSC Fraser River), 39 from Tyee (DFO Skeena River), 20 from the Yale First Nations Qualark Creek Test Fishery (Middle Fraser River), and three (3) from the Taku coho Test Fishery in the Yukon. Very few tags that are initially identified by technicians are subsequently lost during or after dissection. There were a total of 24 (<0.1%) Lost Pins out of 30,251 heads dissected by lab staff in 2015, which represents approximately one lost pin for every 1,260 heads dissected. 25
26 Approximately half (46%) of these lost pins were associated with escapement samples which can be problematic for lab staff due to mineral and metallic contaminants in the samples originating from the spawning grounds. Some of these samples can also be heavily decomposed and therefore can be difficult or impossible to dissect and recover the pin. Whenever tags were perceived to be lost during dissection, laboratory staff made every attempt to recover them using earth magnets and conducting systematic searches of the surrounding dissection area. If a tag is found, it is recorded as a lost and found status as a quality control measure should there be an inquiry as to the validity of the tag read. Laboratory procedures included observations on the specific location of tags recovered within each fish head. This information is important as a measure of tagging quality. 4.5 Data Collection, Management and Analysis Commercial and First Nations Economic Fisheries Data Management The processing and data entry of 2015 commercial and First Nations fisheries began in April 2015 and continued through to November 2015, coinciding with the beginning and conclusion of the commercial salmon fishing season in each of these months, respectively. Subsequent entries in 2015 and through to March of 2016, were primarily latent data from DFO Test Fisheries and the Area G WCVI chinook troll fishery that occurred during the winter and spring months. The timing of data entry of commercial CWT sample and recovery data are presented in Table 8. Table 8 - Number of 2015 commercial fishery sample records entered by month 26
27 Batch uploading of 2015 commercial and sport sample and recovery data from the project office to the DFO MRP database occurred on the following dates: Commercial data progressed through a rigorous system of error checks and coding procedures. Pre-entry tasks included checking data for completeness and integrity. Another key task during coding is examining the relationship of statistical week landed versus the date of landing. It is critical that samples from trucks and packers are properly backdated to attribute samples to the correct week of catch. Backdating is most common for truck deliveries of troll samples as troll fisheries can and often overlap two or more statistical weeks while most net fisheries are of much shorter duration and occur within one particular statistical week. Proper allocation of samples is critical to catch sample ratios, and CWT estimate calculations. Online edits focused on the legitimacy of the tag code compared to the reported species as well as the validity of the tag code itself and whether the brood year provided by the code is feasible for that species. Fish length is also checked against valid ranges for each species. Additionally, coding of geographic area and timing are checked against valid fishery openings. Records which did not meet acceptable entry criteria were isolated and reviewed by senior program personnel. All questionable tag codes were re-read. Species conflicts were evaluated by 27
28 reviewing the size and age relationships of the tag and the associated biological data collected. When a tag was discovered to be outside of its normal temporal and geographic distribution of recovery, the recovery data was scrutinized to ensure the accuracy of this data and rule out any transcription errors Recreational Fisheries Data Management Sport fishery sample data was processed by the contracted Sport Data Technician. Primary duties included correspondence with anglers, data entry and editing, and production of data summaries and in-season and post-season reports that are used for checking and editing data as well as providing updates to DFO and feedback to anglers that submit data to the program. A total of 12,851 submissions from anglers were received and processed in 2015 (Table 9). The total number of submissions decreased by almost 17% over those received in 2014 (15,498 heads). Table 10 provides a comparison of sport head submissions for each species in 2015 by capture year. Table 9 - Number of sport caught salmon heads receive by month from nglers and guides in the 2015 calendar year 28
29 Table 10 - Summary of sport head recoveries submitted and processed in 2015 by species and capture year CWT Estimates All analysis was completed by Mark Recovery Unit staff, following standard algorithms for the calculation of CWT estimates, using the MRP Information System to synthesize catch, sample, recovery, and lab data across multiple DFO systems. Canada submitted all observed and estimated CWT tag recovery data and associated catch and sample data to the PSMFC for validation and upload into RMIS on February 3, Summary and Project Evaluation Under this collaborative project, the Canadian Mark Recovery Program was successful in meeting its project objectives to conduct a statistically reliable and timely CWT sampling and recovery program to support domestic and international stock assessment and sustainable fisheries management. 1) Did the intended activities take place within scope, within budget? Yes. All objectives of the project were achieved. See Appendix 9 for the Financial Statement for the project. As this was the first year of the joint project, some errors were made in the budget phase resulting in some categories of expenditures were over-estimated or underestimated. For example, DFO salary was overestimated by 38K, travel was overestimated by 125K, sampling materials were overestimated by 43K and disposal of waste was overestimated by 19K. Contractor salary was underestimated by 72K and lab rentals of 56.6K were erroneously not included in the budget. However, the project was under-budget by $123,730 and a total of $45,803 was returned to the Pacific Salmon Commission. 2) Were the resources allocated in the most efficient and effective manner, or given the results would a different allocation have been more appropriate, and if so will be considered for any potential future projects as applicable? In future years, the budget will be modified to better reflect the actual expenditures. 29
30 3) Were the milestones achieved? All milestones, with the exception of the final report, were achieved. 4) Were the deliverables of the project delivered? All deliverables of the project were delivered as planned. 5) Did the collaboration achieve its purpose? Yes an overall sample rate of 20% was achieved and data was delivered to the U.S. CWT data repository according to agreed schedules for use by PSC Committees. 6) Were there any difficulties encountered within the performance of the project and if so, how were they managed to achieve resolution? Workload and unclear reporting requirements and authority to define them resulted in delays in the provision of a meaningful in-season and final report. This has been fully resolved with input from the Northern Endowment Fund Committee. 6. Acknowledgements Fisheries and Oceans Canada is grateful for the financial support for this project from the Pacific Salmon Commission Endowment Fund. The author wishes to thank the DFO Core Stock Assessment Mark Recovery Program Unit biologists and technicians - Nicholas Komick, Brenda Ridgway, Doug Herriott and Erik Grundmann - for their commitment and hard work for all aspects of the project, as well as the various DFO Regional resource management, stock assessment staff, and salmon enhancement program for their valuable roles in regional catch monitoring program delivery and CWT sampling, and J.O.Thomas and Associates in performing fisheries sampling and CWT lab operations. Finally, thanks to the many thousands of harvesters who participate in all aspects of DFO catch monitoring providing catch data and biological samples to support sustainable fisheries management. 30
31 7. References Bernard, D.R., and Clark, J.E Estimating salmon harvest with coded-wire tags. Can. J. Fish. Aquat. Sci. 53: Cochran, W. G. (1977). Sampling Techniques. 3rd ed. New York: John Wiley & Sons. Canadian General Standards Board (CGSB), [internet], 2015a, [cited 01/02/2016], About the Canadian General Standards Board Resources. Available from Canadian General Standards Board (CGSB), [internet], 2015b, [cited 01/02/2016] Dockside Monitoring Companies. Available from Canadian General Standards Board (CGSB), [internet], 2015c, [cited 01/02/2016] Assessing 1S Quality Management Systems. Available from Fisheries and Oceans Canada (DFO), [internet], 1993, [cited 01/02/2016] Fishery (General) Regulations (SOR/93-53). Available from Fisheries and Oceans Canada (DFO), [internet], 2012, [cited 01/02/2016] Strategic Framework for Fishery Monitoring and Catch Reporting in the Pacific Fisheries. Available from Johnson, J. K., Regional overview of coded wire tagging of anadromous salmon and steelhead in northwest America. Fish-Marking Techniques (7): p Johnson, J. K., Regional overview of coded wire tagging of anadromous salmon and steelhead in northwest America. Paper updated from 1989 to current year Kuhn, B.R., The MRP-Reporter Program: A data extraction and reporting tool for the mark recovery program database. Can. Tech. Rep. Fish. Aquat. Sci. No. 1625, 145 p. Kuhn, B.R., Lapi, L., Hamer, J.M., An introduction to the Canadian database on marked pacific salmonids. Can. Tech. Rep. Fish. Aquat. Sci. No. 1649, 56 p. Mark Recovery Program [database], Continuously since 1977, Nanaimo (BC): Fisheries and Oceans Canada. Nandor, G.F., Longwill, J.R., Webb, D.L., 2010, Overview of the coded wire tag program in the Greater Pacific Region of North America. Pacific Northwest Aquatic Monitoring Partnership Special Publication , chap. 2, p
32 Pacific Salmon Commission Expert Panel on the Future of the Coded Wire Tag Program for Pacific Salmon Report. Pacific Salmon Comm. Tech. Rep. No. 18: 230 p. Pacific Salmon Commission Coded Wire Tag Workgroup An action plan in response to Coded Wire Tag (CWT) Expert Panel Recommendations. Pacific Salmon Comm. Tech. Rep. No. 25: 170 p. Pacific Salmon Commission Joint CWT Implementation Team Five-year synthesis report of the Pacific Salmon Commission Coded Wire Tag (CWT) Improvement Program. Pacific Salmon Comm. Tech. Rep. No. 33: 48 p. Pacific Salmon Commission Joint Chinook Technical Committee Annual Report of Catch and Escapement for 2014: Report TCCHINOOK (15)-2: 230 p. Pacific Salmon Commission Joint Chinook Technical Committee Exploitation Rate Analysis and Model Calibration. Volume One: Report TCCHINOOK (15)-1 V.1: 146 p. Pacific Salmon Commission Joint Chinook Technical Committee Exploitation Rate Analysis and Model Calibration. Volume Two Appendix Supplement: Report TCCHINOOK (15)-1 V.2: 172 p. Pacific Salmon Commission Joint Coho Technical Committee Periodic Report. Revised: Report TCCOHO (13)-1: 160 p. Pacific Salmon Commission Joint Technical Committee on Data Sharing (PSC-TCDS) Joint Working Group on Mark Recovery Databases, 1989, Information content and data standards for a Coastwide Coded-Wire Tag Database: Report TCDS (89)-1, 183 p. Pacific Salmon Commission Joint Technical Committee on Data Sharing Data Standards Work Group (PSC-DSWG), 2014, Specifications and definitions for the exchange of coded wire tag data for the North American Pacific Coast, Pacific Salmon Commission Format, Version 4.1., xx pp. July 2014: 102 p. available from Pacific Salmon Commission, Treaty Between the Government of Canada and the Government of the United States of America Concerning Pacific Salmon, Available from Pacific Salmon Commission, Pacific Salmon Treaty: Memorandum of Understanding Data Sharing, January 28, 1985, pp , Available from Regional Mark Information System Database [online database], Continuously since 1977, Portland (OR): Regional Mark Processing Center, Pacific States Marine Fisheries Commission, URL:< 32
33 Schubert, N.D Angler Effort and Catch in the Lower Fraser River Sport Fishery. Canadian Manuscript Report of Fisheries and Aquatic Sciences No Schubert, N.D Angler Effort and Catch in Four Fraser River Sport Fisheries, Canadian Manuscript Report of Fisheries and Aquatic Sciences Solomon, D.J., 2005, Coded Wire Tag Project Manual, Guidelines on the use of coded wire tags and associated equipment: Northwest Marine Technology, Inc., Shaw Island, Washington, March Tadey, J., and Mahoney. J Fraser Stock Assessment Lower Fraser Area Recreational Fishery Assessessments. Available from Thomas, J. O. and Associates Ltd. MS Title, Salmonid Catch Sampling and Mark Recovery Program 2014 Operations Summary Report. Prep. For Fisheries and Oceans Canada, Vancouver, Canada. 101 p. 33

34 Appendices Appendix 1. DFO Pacific Fishery Management Areas 34


35 Appendix 2. DFO Commercial Salmon License Areas 35


36 Appendix 3 - cont d. DFO Commercial Salmon License Areas 36
37 Appendix and 2016 Statistical Week Calendars DFO STATWEEK CODE PSC STATWEEK CODE FROM TO DFO STATWEEK CODE PSC STATWEEK CODE FROM TO Jan-16 2-Jan Jan-16 9-Jan Jan Jan Jan Jan Jan Jan Jan-16 6-Feb Feb Feb Feb Feb Feb Feb Feb-16 5-Mar Mar Mar Mar Mar Mar Mar Mar-15 4-Apr Mar-16 2-Apr Apr Apr Apr Apr Apr Apr Apr-15 2-May May-15 9-May May May May May May May May-15 6-Jun Jun Jun Jun Jun Jun Jun Jun-15 4-Jul Jul Jul Jul Jul Jul Jul Jul-15 1-Aug Aug-15 8-Aug Aug Aug Aug Aug Aug Aug Aug-15 5-Sep Sep Sep Sep Sep Sep Sep Sep-15 3-Oct Oct Oct Oct Oct Oct Oct Oct Oct Nov-15 7-Nov Nov Nov Nov Nov Nov Nov Nov-15 5-Dec Dec Dec Dec Dec Dec Dec Dec Dec-15 37

38 Appendix 4. Chronological Commercial and First Nations Economic Fishery Openings by Gear, Period, and Species 38

39 Appendix 5. Mark Recovery Sample Form 39


40 Appendix 6 Head Labels and Container Labels Head Labels Commercial, First Nations Economic, Test Fisheries, and Escapement Container Labels Used for all shipments of samples to the Lab 40

41 Appendix 6 - cont d. Head Labels and Container Labels Head Labels - Recreational Fisheries (front and back) 41

42 Appendix 6 - cont d. Head Labels and Container Labels Head Labels - Food, Social, and Ceremonial Fisheries (front & back) 42
43 Appendix 7 Freezer Troll Bag Labels and Head Delivery Records Chinook/Coho Head Delivery Record 43

44 Appendix 8. Recreational Fisheries - Salmon Head Recovery Program Public Relations, Sampling Materials, and Procedures Poster 44
45 Appendix 8 cont d. Recreational Fisheries - Salmon Head Recovery Program Public Relations, Sampling Materials, and Procedures Depot Sign-up Form 45


46 Appendix 8 cont d. Recreational Fisheries - Salmon Head Recovery Program Public Relations, Sampling Materials, and Procedures Depot Service Form Generic Depot Service Log Sticker Generic Servicing Record for Depot - Postcard 46

47 Appendix 8 cont d. Recreational Fisheries - Salmon Head Recovery Program Public Relations, Sampling Materials, and Procedures Depot Instructions 47

48 Appendix 9 Financial Statement 48
2018 Fraser River Fishery Summary to Accompany December 2018 Presentation for FORUM
 2018 Fraser River Fishery Summary to Accompany December 2018 Presentation for FORUM Chinook... 1 Coho... 3 Chum... 4 Sockeye... 5 Pink... 6 Chinook FSC Chinook directed fisheries were open year round Below
PRE-SEASON PLANNING FOR FRASER SALMON and STOCKS OF CONCERN. Forum on Conservation and Harvest Planning for Fraser Salmon January 22, 2010
 PRE-SEASON PLANNING FOR FRASER SALMON and STOCKS OF CONCERN Forum on Conservation and Harvest Planning for Fraser Salmon January 22, 2010 2 Outline South Coast Chinook Status Management Actions Recovery
South Coast Salmon Bulletin August 30, 2018 Assessment Update Barkley/Alberni (Area 23) Terminal Chinook
 Terminal Chinook") 1 South Coast Salmon Bulletin August 30, 2018 Assessment Update Barkley/Alberni (Area 23) Terminal Chinook Pre-season Expectations Somass/Robertson Creek Hatchery chinook: The forecast terminal return
1 South Coast Salmon Bulletin August 30, 2018 Assessment Update Barkley/Alberni (Area 23) Terminal Chinook Pre-season Expectations Somass/Robertson Creek Hatchery chinook: The forecast terminal return
PACIFIC REGION 1996 SALMON NET MANAGEMENT PLAN AREAS B, D, AND E SOUTH COAST AND FRASER RIVER
 , " PACIFIC REGION 1996 SALMON NET MANAGEMENT PLAN AREAS B, D, AND E SOUTH COAST AND FRASER RIVER This Salmon Net Management Plan is intended for general purposes only. Where there is a discrepancy between
Rivers Inlet Salmon Initiative
 Rivers Inlet Salmon Initiative 5-YEAR BUSINESS PLAN C AS E F O R S U P P O R T M AR C H 2 0 1 5 Dedication Rick Hansen had been inspired to go to Rivers Inlet in July 2010 by his good friend, and fellow
Proposed 2018 Fisheries Management Measures to Support Recovery of Interior Fraser River Steelhead
 Proposed 2018 Fisheries Management Measures to Support Recovery of Interior Fraser River Steelhead 22-March-2018 Spawning escapements of two Interior Fraser River steelhead stocks, Thompson and Chilcotin
Kirt Hughes Washington Department of Fish and Wildlife Region 6 - Fish Program Manager
 Kirt Hughes Region 6 - Fish Program Manager Habitat Hatcheries Harvest Clean Water Act Shorelines Harvest Hydro Habitat Forest Practices Non-regulatory Programs Water Supply & Conservation Growth Management
Press Release New Bilateral Agreement May 22, 2008
 Informational Report 3 June 2008 Press Release New Bilateral Agreement May 22, 2008 The Pacific Salmon Commission is pleased to announce that it has recommended a new bilateral agreement for the conservation
We recommend that whenever possible you use the following guidelines for choosing the most sustainable options in 2010.
 Ocean Wise Seasonal salmon report 2010 NOTE: THE FOLLOWING RECOMMENDATIONS ARE BASED ON EARLY TEST FISHERY RESULTS. ACTUAL IN-SEASON RUN STRENGTH CAN CHANGE AND WILL BE UPDATED AS NECESSARY. Returns of
2016 Fraser River Stock Assessment and Fishery Summary Chinook, Coho and Chum
 2016 Fraser River Stock Assessment and Fishery Summary Chinook, Coho and Chum 1 Background and Stock Assessment 2 Fraser River Chinook - Background Diverse group of populations exhibit a wide range of
NICOMEN SLOUGH/NORRISH CREEK RECREATIONAL FISHERY ASSESSMENT October 13 th to November 30 th, 2008
 POST SEASON SUMMARY - DRAFT Date: November 30 th, 2008 NICOMEN SLOUGH/NORRISH CREEK RECREATIONAL FISHERY ASSESSMENT October 13 th to November 30 th, 2008 Table 1 Nicomen Slough salmon retention limits
2016 Fraser River Chinook Key Information for Management. FN Forum March 8-10 Nanaimo, BC
 2016 Fraser River Chinook Key Information for Management FN Forum March 8-10 Nanaimo, BC 1 Outline Provide background information, management objectives and fisheries management approach for: Fraser Spring
Risk Assessments in the Pacific Fisheries for BC & Yukon
 Risk Assessments in the Pacific Fisheries for BC & Yukon MARCH, 2017 CONTENTS Introduction to Risk Assessments... 2 Q&As on the Risk Assessment Process... 3 Overview of the Risk Assessment Tool... 4 Example
Steelhead Bycatch and Mortalities in the Commercial Skeena Net Fisheries of British Columbia from Observer Data: 1989 to 2009
 Steelhead Bycatch and Mortalities in the Commercial Skeena Net Fisheries of British Columbia from Observer Data: 1989 to 2009 Prepared for: The Pacific Salmon Foundation (Living Rivers Trust Fund) and
ESTIMATED RETURNS AND HARVEST OF COLUMBIA RIVER FALL CHINOOK 2000 TO BY JOHN McKERN FISH PASSAGE SOLUTIONS
 ESTIMATED RETURNS AND HARVEST OF COLUMBIA RIVER FALL CHINOOK 2000 TO 2007 BY JOHN McKERN FISH PASSAGE SOLUTIONS ESTIMATED RETURNS AND HARVEST OF COLUMBIA RIVER FALL CHINOOK 2000 TO 2007 This analysis of
June 3, 2014 MEMORANDUM. Council Members. Stacy Horton, Policy Analyst, Washington. SUBJECT: Final 2012 Hatchery Fin Clip Report
 Bill Bradbury Chair Oregon Henry Lorenzen Oregon W. Bill Booth Idaho James A. Yost Idaho Jennifer Anders Vice Chair Montana Pat Smith Montana Tom Karier Washington Phil Rockefeller Washington June 3, 2014
Maintaining biodiversity in mixed-stock salmon fisheries in the Skeena watershed
 Maintaining biodiversity in mixed-stock salmon fisheries in the Skeena watershed A 130-year history Chris C. Wood Principle: Mixed-stock transboundary fisheries impose special requirements on management
Distribution List. Date: December 1, Chilliwack River Recreational Fishery Assessment. September 15 - November 15, 2006.
 To: Prepared by: Distribution List Jason Mahoney Assessment Biologist Stock Assessment Lower Fraser Area Date: December 1, 2006 Chilliwack River Recreational Fishery Assessment September 15 - November
2006 Nicomen Slough/Norrish Creek Recreational Fishery Assessment October 9 to November 30, 2006
 2006 Nicomen Slough/Norrish Creek Recreational Fishery Assessment October 9 to November 30, 2006 Prepared By: Jason Mahoney Assessment Biologist Stock Assessment Lower Fraser Area Regulations Regulations
PACIFIC REGION 1998 SALMON NET MANAGEMENT PLAN AREAS B, D & E SOUTH COAST & FRASER RIVER
 PACIFIC REGION 1998 SALMON NET MANAGEMENT PLAN AREAS B, D & E SOUTH COAST & FRASER RIVER This Area B, D and E Salmon Management Plan is intended for general purposes only. Where there is a discrepancy
"Recommended Improvements for the Next Pacific Salmon Treaty"
 "Recommended Improvements for the Next Pacific Salmon Treaty" Randall M. Peterman School of Resource and Environmental Management Simon Fraser University Burnaby, British Columbia, Canada Web site: http://www.rem.sfu.ca/fishgrp/
Interior Fraser River Coho Management Post-season update and 2016 Fisheries Planning FN FORUM Meeting March 9, 2016 Draft 5
 Interior Fraser Coho Management 2015 Post-season update and 2016 Fisheries Planning FN FORUM Meeting March 9, 2016 Draft 5 1 Interior Fraser Coho Background In response to significant stock declines through
2018 NASS RIVER SALMON STOCK ASSESSMENT UPDATE MONDAY, 9 JULY
 218 NASS RIVER SALMON STOCK ASSESSMENT UPDATE MONDAY, 9 JULY The following is the fourth general public update for 218 of Nass River salmon and summer run steelhead stock assessments from the Nisga a Lisims
Review of North and Central Coast Salmon Indicator Streams and Estimating Escapement, Catch and Run Size for each Salmon Conservation Unit
 EA3357 Review of North and Central Coast Salmon Indicator Streams and Estimating Escapement, Catch and Run Size for each Salmon Conservation Unit Prepared by: Karl K. English, Tony Mochizuki, and Dave
OPTIMUM ESCAPEMENT GOALS FOR CHINOOK SALMON IN THE TRANSBOUNDARY ALSEK RIVER
 Canadian Science Advisory Secretariat Science Advisory Report 2011/019 OPTIMUM ESCAPEMENT GOALS FOR CHINOOK SALMON IN THE TRANSBOUNDARY ALSEK RIVER Chinook salmon adult spawning phase. DFO website. Figure
Stock Assessment of Anadromous Salmonids, 2003 Report Number: OPSW-ODFW
 THE OREGON PLAN for Salmon and Watersheds Stock Assessment of Anadromous Salmonids, 3 Report Number: OPSW-ODFW-- The Oregon Department of Fish and Wildlife prohibits discrimination in all of its programs
California Department of Fish and Wildlife Report to the International Pacific Halibut Commission on 2017 California Fisheries
 IPHC-2018-AM094-AR08 Received: 22 December 2017 California Department of Fish and Wildlife Report to the International Pacific Halibut Commission on 2017 California Fisheries California Department of Fish
Juan de Fuca Recreational Chinook Fishery Proposal. Forum on Conservation & Harvest Planning for Fraser Salmon April 13, 2015
 Juan de Fuca Recreational Chinook Fishery Proposal Forum on Conservation & Harvest Planning for Fraser Salmon April 13, 2015 1 Outline Origin of proposal What is the rationale for the proposal? What is
Tuesday, April 10, 2018, 5:08 PM
 TABLE 2. 2018 Recreational management measures for non-indian ocean salmon fisheries - Council adopted. (Page 1 of 5) North of Cape Falcon Supplemental Management Information 1. Overall non-indian TAC:
THE OREGON. PLAN for Salmon and Watersheds. Stock Assessment of Anadromous Salmonids, Report Number: OPSW-ODFW
 THE OREGON PLAN for Salmon and Watersheds Stock Assessment of Anadromous Salmonids, Report Number: OPSW-ODFW-1- The Oregon Department of Fish and Wildlife prohibits discrimination in all of it s programs
for Salmon and Watersheds
 for Salmon and Watersheds Stock Assessment of Anadromous Salmonids, Report Number: OPSW-ODFW-3- The Oregon Department of Fish and Wildlife prohibits discrimination in all of its programs and services on
Dauphin Lake Fishery. Status of Walleye Stocks and Conservation Measures
 Dauphin Lake Fishery Status of Walleye Stocks and Conservation Measures Date: December, 21 Dauphin Lake Fishery Status of Walleye Stocks and Conservation Measures Background: Walleye stocks in Dauphin
OREGON AND WASHINGTON DEPARTMENTS OF FISH AND WILDLIFE JOINT STAFF REPORT - FALL FACT SHEET NO.
 OREGON AND WASHINGTON DEPARTMENTS OF FISH AND WILDLIFE JOINT STAFF REPORT - FALL FACT SHEET NO. 3 Columbia River Compact/Joint State Hearing August 28, 2018 Fisheries under consideration: Non-treaty mainstem
Meeting in Support of Species at Risk Act Listing Process for Lower Fraser River and Upper Fraser River White Sturgeon
 Meeting in Support of Species at Risk Act Listing Process for Lower Fraser River and Upper Fraser River White Sturgeon 1 Chilliwack, Kamloops and Prince George May and June, 2018 Meeting Objectives Outline
Exhibit 3. Fishery Clients: Vityaz-Avto and Delta Budget: $735,000
 Exhibit 3. Fishery Improvement Project (FIP) Work Plan for Western Kamchatka Fisheries harvesting the following salmon stocks: Ozernaya coho, Koshegochek coho and sockeye, Golygina coho and sockeye, Opala
 Informational Report 1 USFWS Mass Marking Update April 2005 Update on USFWS 2005 Mass Marking Initiative Background Under Section 138 of FY 2003 Omnibus Appropriations Act (PL 108-7), Congress directed
Columbia River Fisheries Management. Estimating Effort, Catch, and ESA Impacts in Recreational Fisheries
 Columbia River Fisheries Management Estimating Effort, Catch, and ESA Impacts in Recreational Fisheries Columbia River Fisheries Management Recreational Fisheries Responsibilities: Estimate angler effort
PREPARED FOR Pacific Fisheries Resource Conservation Council Suite 290, 858 Beatty Street, Vancouver, BC V6B 1C1
 Responsible Fishing in Canada s Pacific Region Salmon Fisheries: Synopsis FebruARY 2009 PREPARED FOR Pacific Fisheries Resource Conservation Council Suite 290, 858 Beatty Street, Vancouver, BC V6B 1C1
For-hire Data Collection. Gulf of Mexico Fishery Management Council Red Snapper For-hire Advisory Panel December 2-3, 2014 Tampa, FL
 For-hire Data Collection Gulf of Mexico Fishery Management Council Red Snapper For-hire Advisory Panel December 2-3, 2014 Tampa, FL Southeast Region Recreational Surveys MRIP For-hire Survey APAIS/CHTS
CALIFORNIA DEPARTMENT OF FISH AND WILDLIFE UPDATE ON LANDINGS OF TUNA, SWORDFISH AND OTHER PELAGICS
 Agenda Item H.2.c Supplemental CDFW Report 1 November 217 CALIFORNIA DEPARTMENT OF FISH AND WILDLIFE UPDATE ON LANDINGS OF TUNA, SWORDFISH AND OTHER PELAGICS CDFW Summary of HMS Landings Data Improvement
2018 NASS RIVER SALMON STOCK ASSESSMENT UPDATE MONDAY, 20 AUGUST
 218 NASS RIVER SALMON STOCK ASSESSMENT UPDATE MONDAY, 2 AUGUST The following is the tenth general public update for 218 of Nass River salmon and summer run steelhead stock assessments from the Nisga a
Dungeness Crab Integrated Fisheries Management Plan
 Dungeness Crab Integrated Fisheries Management Plan Island Marine Aquatic Working Group Fisheries & Oceans Canada September 19, 2017 Crab IFMP Summary Overview management measures Post-season review (commercial)
Management Strategies for Columbia River Recreational and Commercial Fisheries: 2013 and Beyond
 Management Strategies for Columbia River Recreational and Commercial Fisheries: 2013 and Beyond Recommendation of the Columbia River Fishery Management Workgroup to the Fish and Wildlife Commissions of
ALASKA DEPARTMENT OF FISH AND GAME DIVISION OF COMMERCIAL FISHERIES NEWS RELEASE
 ALASKA DEPARTMENT OF FISH AND GAME DIVISION OF COMMERCIAL FISHERIES NEWS RELEASE Sam Cotten, Commissioner Scott Kelley, Director Contact: Pat Shields, Area Management Biologist or Phone: (907) 262-9368
Recent updates to Marine Impact Model for IFR Coho. Prepared by: Pieter Van Will, DFO Port Hardy
 Recent updates to Marine Impact Model for IFR Coho Prepared by: Pieter Van Will, DFO Port Hardy Recent model updates Base period (BP) review Incorporation of uncertainty in Average BP exploitation rate
The Role of the NPAFC in Conservation and Protection of Pacific Salmon
 The Role of the NPAFC in Conservation and Protection of Pacific Salmon Vladimir Fedorenko Executive Director and Shigehiko Urawa Deputy Director North Pacific Anadromous Fish Commission Vancouver, Canada
Status Determination Criteria for Willapa Bay Natural Coho. Salmon Technical Team and Washington Department of Fish and Wildlife
 Agenda Item C.2.a Attachment 6 November 2013 Status Determination Criteria for Willapa Bay Natural Coho Salmon Technical Team and Washington Department of Fish and Wildlife Prepared by: Robert Kope Northwest
2017 PRE-SEASON EXPECTATIONS: 2017 OBSERVATIONS TO DATE:
 South Coast Salmon Bulletin #4 22 September, 2017 Escapement Update All salmon species - Strait of Georgia Stock Assessment SUMMARY: This bulletin details the current in-season escapement information for
Pacific Salmon Commission Technical Report No. 25
 An Action Plan in Response to Coded Wire Tag (CWT) Expert Panel Recommendations A Report of the Pacific Salmon Commission CWT Workgroup March 2008 Pacific Salmon Commission Technical Report No. 25 The
PACIFIC REGION INTEGRATED FISHERIES MANAGEMENT PLAN SALMON NORTHERN B.C. JUNE 1, MAY 31, 2008
 PACIFIC REGION INTEGRATED FISHERIES MANAGEMENT PLAN SALMON NORTHERN B.C. JUNE 1, 2007 - MAY 31, 2008 Oncorhynchus sp This Integrated Fisheries Management Plan is intended for general purposes only. Where
Impacts of Mark-Selective Ocean Recreational Fisheries on Washington Coast Coho Stocks. Robert Kope. National Marine Fisheries Service
 Agenda Item C.3.a Attachment 2 November 2012 Impacts of Mark-Selective Ocean Recreational Fisheries on Washington Coast Coho Stocks. Robert Kope National Marine Fisheries Service Northwest Fishery Science
Salmon bycatch patterns in the Bering Sea pollock fishery
 Salmon bycatch patterns in the Bering Sea pollock fishery James Ianelli Seattle, WA Data from the North Pacific Observer Program (Fisheries Monitoring and Assessment) were analyzed for seasonal, temporal,
Stock Assessment of Elk River Fall Chinook Salmon for Exploitation Rate Analysis
 Stock Assessment of Elk River Fall Chinook Salmon for Exploitation Rate Analysis Prepared by: Ron Williams Oregon Department of Fish and Wildlife 3406 Cherry Avenue Salem, Oregon 97302 March 2004 This
18 March 2016 Oregon Department of Fish and Wildlife
 18 March 2016 Oregon Department of Fish and Wildlife Background Joint OR/WA policy adoption 2012 OR re-adoption of rules 6/13 Transition period (2013-2016) Phased allocation shift Mainstem gillnets allowed
Attachment 1. Agenda Item Summary BACKGROUND
 Attachment 1 Agenda Item Summary BACKGROUND Spring Chinook Salmon: Prior to the late 1970s, non-treaty spring Chinook fisheries in the mainstem Columbia River occurred from February through May and harvested
ATLANTIC SALMON NEWFOUNDLAND AND LABRADOR, SALMON FISHING AREAS 1-14B. The Fisheries. Newfoundland Region Stock Status Report D2-01
 Fisheries Pêches and Oceans et Océans DFO Science Newfoundland Region Stock Status Report D2-01 ATLANTIC SALMON NEWFOUNDLAND AND LABRADOR, SALMON FISHING AREAS 1-14B Background There are 15 Atlantic salmon
Pacific Salmon Treaty (PST)- Fraser River Sockeye & Pink Salmon Chapter Renewal. February 26, 2013 First Nations Consultations Saanichton, BC
- Fraser River Sockeye & Pink Salmon Chapter Renewal. February 26, 2013 First Nations Consultations Saanichton, BC") Pacific Salmon Treaty (PST)- Fraser River Sockeye & Pink Salmon Chapter Renewal February 26, 2013 First Nations Consultations Saanichton, BC 1 Renewal Context Annex IV, Chapter 4 (Fraser River Sockeye
Pacific Salmon Treaty (PST)- Fraser River Sockeye & Pink Salmon Chapter Renewal February 26, 2013 First Nations Consultations Saanichton, BC 1 Renewal Context Annex IV, Chapter 4 (Fraser River Sockeye
2017 CONSERVATION HARVESTING PLAN Atlantic Halibut (4RST) Prince Edward Island fixed gear fleet Less than meters
 Prince Edward Island fixed gear fleet Less than meters") Approved on July 13, 2017 APPLICATION This Conservation Harvesting Plan (CHP) applies to all Prince Edward Island (PEI) fixed gear licence holders fishing Atlantic halibut in NAFO Divisions 4RST with vessels
Approved on July 13, 2017 APPLICATION This Conservation Harvesting Plan (CHP) applies to all Prince Edward Island (PEI) fixed gear licence holders fishing Atlantic halibut in NAFO Divisions 4RST with vessels
Perspectives of a State Director Selective fisheries as a tool in fisheries management and salmon recovery
 Perspectives of a State Director Selective fisheries as a tool in fisheries management and salmon recovery Jeffrey P. Koenings, PhD. Washington Department of Fish and Wildlife American Fisheries Society
2017 Fall Zone 4-5 Gillnet Fishery WDFW and ODFW Observation Study Sampling Plan
 2017 Fall Zone 4-5 Gillnet Fishery WDFW and ODFW Observation Study Sampling Plan Introduction Columbia River fisheries generate millions of dollars in economic value annually, and are an integral part
There are two types of selective commercial fisheries conducted by Talok Fisheries:
 Lake Babine Nation Inland Fishery The inland commercial fishery on Lake Babine is operated by a private fishing company named Talok that is owned by the Lake Babine Nation (LBN). This company is governed
2016 PACIFIC HALIBUT CATCH SHARING PLAN FOR AREA 2A
 (a) FRAMEWORK 2016 PACIFIC HALIBUT CATCH SHARING PLAN FOR AREA 2A This Plan constitutes a framework that shall be applied to the annual Area 2A total allowable catch (TAC) approved by the International
TESTIMONY OF THE COLUMBIA RIVER TREATY TRIBES BEFORE PACIFIC FISHERIES MANAGEMENT COUNCIL April 12, 2010 Portland, OR
 Agenda Item H.1.f Supplemental Tribal Report 2 April 2010 TESTIMONY OF THE COLUMBIA RIVER TREATY TRIBES BEFORE PACIFIC FISHERIES MANAGEMENT COUNCIL April 12, 2010 Portland, OR Good day Mr. Chairman and
OREGON AND WASHINGTON DEPARTMENTS OF FISH AND WILDLIFE JOINT STAFF REPORT: SUMMER FACT SHEET NO. 1 Columbia River Compact June 13, 2012
 OREGON AND WASHINGTON DEPARTMENTS OF FISH AND WILDLIFE JOINT STAFF REPORT: SUMMER FACT SHEET NO. 1 Columbia River Compact June 13, 2012 Fisheries under consideration: Non-Indian commercial salmon Treaty
Steelhead Stock Status Review British Columbia
 Steelhead Stock Status Review British Columbia Mark Beere - Senior Fisheries Biologist Skeena Region BC Ministry of Forests, Lands and Natural Resource Operations Overview 1. Stocks and Ecotypes in BC
SCIENTIFIC COMMITTEE FIFTH REGULAR SESSION August 2009 Port Vila, Vanuatu
 SCIENTIFIC COMMITTEE FIFTH REGULAR SESSION 10-21 August 2009 Port Vila, Vanuatu ANNUAL REPORT TO THE COMMISSION PART 1: INFORMATION ON FISHERIES, RESEARCH, AND STATISTICS WCPFC-SC5-AR/CCM-02 CANADA 2 SC4-AR-WP-3
Eastern New Brunswick Coastal and Inland Recreational Fisheries Advisory Committee
 Eastern New Brunswick Coastal and Inland Recreational Fisheries Advisory Committee Submitted By: Atlantic Salmon Federation Submitted To: Fisheries and Oceans Canada (Gulf Region) Date: 14 December 2017
PROPOSAL IATTC-92 B-4 REVISED SUBMITTED BY BELIZE, GUATEMALA, NICARAGUA, COSTA RICA AND PANAMA
 INTER-AMERICAN TROPICAL TUNA COMMISSION 92 ND MEETING Mexico City, Mexico 24-28 July 2017 PROPOSAL IATTC-92 B-4 REVISED SUBMITTED BY BELIZE, GUATEMALA, NICARAGUA, COSTA RICA AND PANAMA COMPENDIUM OF CONSERVATION
Socioeconomic Profile and Spatial Analysis of Fisheries in the three central California National Marine Sanctuaries
 Socioeconomic Profile and Spatial Analysis of Fisheries in the three central California National Marine Sanctuaries Overview and Assessment of CDFG Fisheries Data for use in the Joint Management Plan Review
OREGON AND WASHINGTON DEPARTMENTS OF FISH AND WILDLIFE JOINT STAFF REPORT SUMMER FACT SHEET NO.
 OREGON AND WASHINGTON DEPARTMENTS OF FISH AND WILDLIFE JOINT STAFF REPORT SUMMER FACT SHEET NO. 1 Columbia River Compact/Joint State Hearing June 28, 2018 Fisheries under consideration: Treaty commercial
Final Draft Integrated Fishery Management Plan. Summary
 Final Draft Integrated Fishery Management Plan Summary Cambridge Bay Arctic Char Commercial Fishery Effective 2014 Arctic Char (Salvelinus alpinus) The purpose of this Integrated Fisheries Management Plan
2017 PACIFIC HALIBUT CATCH SHARING PLAN FOR AREA 2A
 (a) FRAMEWORK 2017 PACIFIC HALIBUT CATCH SHARING PLAN FOR AREA 2A This Plan constitutes a framework that shall be applied to the annual Area 2A total allowable catch (TAC) approved by the International
Tuesday, April 10, 2018, 5:04 PM
 TABLE 1. 2018 Commercial troll management measures for non-indian ocean salmon fisheries - Council adopted. (Page 1 of 6) A. SEASON DESCRIPTIONS North of Cape Falcon Supplemental Management Information
NATIONAL MARINE FISHERIES SERVICE REPORT
 Agenda Item J.1 Situation Summary April 2007 NATIONAL MARINE FISHERIES SERVICE REPORT National Marine Fisheries Service (NMFS) Southwest Region and Science Center will briefly report on recent developments
1998 Thompson River Steelhead Angler Survey
 Prepared for: The Ministry of Environment, Lands and Parks Fisheries Branch, Southern Interior Region 1259 Dalhousie Dr. Kamloops, BC V2C 5Z5 Prepared by: Stacy L. Webb (B.NRSc.) and Sean Bennett (R.P.Bio)
2016 Conservation Stamp, Esther Semple. Dr. Brian Riddell, Pacific Salmon Foundation, Vancouver, B.C. Contacts:
 2016 Conservation Stamp, Esther Semple Dr. Brian Riddell, Pacific Salmon Foundation, Vancouver, B.C. Contacts: briddell@psf.ca 604-664-7664 www.marinesurvivalproject.com 2 Our Work www.psf.ca Grant Making:
17-06 BFT RECOMMENDATION BY ICCAT FOR AN INTERIM CONSERVATION AND MANAGEMENT PLAN FOR WESTERN ATLANTIC BLUEFIN TUNA
 17-06 BFT RECOMMENDATION BY ICCAT FOR AN INTERIM CONSERVATION AND MANAGEMENT PLAN FOR WESTERN ATLANTIC BLUEFIN TUNA RECALLING the Recommendation by ICCAT to Establish a Rebuilding Program for Western Atlantic
Staff, Organizations Directly Affected (including but not limited to):
:") 3-2-02.01 Steelhead Stream Classification Effective Date: December 13, 2005 This Policy Replaces: None. Staff, Organizations Directly Affected (including but not limited to): Ministry of Water, Land and
3-2-02.01 Steelhead Stream Classification Effective Date: December 13, 2005 This Policy Replaces: None. Staff, Organizations Directly Affected (including but not limited to): Ministry of Water, Land and
Bering Sea Salmon Bycatch Update North Pacific Fishery Management Council, July 2017
 Bering Sea Salmon Bycatch Update North Pacific Fishery Management Council, July 2017 Salmon are caught incidentally in the Bering Sea and Aleutian Islands (BSAI) offshore trawl fisheries, especially in
CALIFORNIA DEPARTMENT OF FISH AND WILDLIFE UPDATE ON LANDINGS OF TUNA, SWORDFISH AND OTHER PELAGICS
 Agenda Item I.2.a Supplemental CDFW Report November 216 CALIFORNIA DEPARTMENT OF FISH AND WILDLIFE UPDATE ON LANDINGS OF TUNA, SWORDFISH AND OTHER PELAGICS Update on Pacific Bluefin Tuna Commercial Landings
Recreational Sturgeon Commercial Shad MANAGEMENT GUIDELINES
 OREGON AND WASHINGTON DEPARTMENTS OF FISH AND WILDLIFE JOINT STAFF REPORT - SUMMER FACT SHEET NO. 2 Columbia River Compact/Joint State Hearing June 28, 2005 Fisheries under consideration: Recreational
FALL FACT SHEET NO. 2 Columbia River Compact August 13, 2004 MANAGEMENT GUIDELINES
 FALL FACT SHEET NO. 2 Columbia River Compact August 13, 2004 Fisheries Under Consideration: Non-Indian commercial mainstem MANAGEMENT GUIDELINES Salmon A Management Agreement for upper Columbia River fall
THE FISHERY REGIME FOR SOUTHEAST ALASKA CHINOOK SALMON FISHERIES
 THE 1995-1 998 FISHERY REGIME FOR SOUTHEAST ALASKA CHINOOK SALMON FISHERIES By Jeffery P. Koenings, David Gaudet, Scott Marshall, and John E. Clark Regional Information Report No. 5J95-14 Alaska Department
Angling in Manitoba (2000)
") Angling in Manitoba (2000) TABLE OF CONTENTS Page Introduction 1 Angler Profile 2 Angling Effort 7 Catch and Harvest 10 Angling Expenditures 13 Bait Use 16 Nonresident Trip Characteristics 18 Angling in
Angling in Manitoba (2000) TABLE OF CONTENTS Page Introduction 1 Angler Profile 2 Angling Effort 7 Catch and Harvest 10 Angling Expenditures 13 Bait Use 16 Nonresident Trip Characteristics 18 Angling in
2017 Non-Treaty Columbia River Summer/Fall Fishery Allocation Agreement June 15, 2017
 2017 Non-Treaty Columbia River Summer/Fall Fishery Allocation Agreement June 15, 2017 Management Intent and Expectations for Summer Chinook and Sockeye Fisheries The preseason forecast for upper Columbia
A Review of Five Demonstration Projects from the 2008 Salmon Season REPORT. Fisheries and Oceans Canada. Gardner Pinfold. Prepared for: Prepared by:
 A Review of Five Demonstration Projects from the 2008 Salmon Season REPORT Prepared for: Fisheries and Oceans Canada Prepared by: October, 2009 TABLE OF CONTENTS Page I. Project Scope and objectives...1
Agenda Item G.1.a Supplemental CDFW Report 2 September 2015
 Agenda Item G.1.a Supplemental CDFW Report 2 September 2015 CALIFORNIA DEPARTMENT OF FISH AND WILDLIFE REPORT ON PACIFIC BLUEFIN MONITORING AND MANAGEMENT ACTIVITIES FOR RECREATIONAL AND COMMERCIAL FISHERIES
Gulf of Maine Research Institute Responsibly Harvested Seafood from the Gulf of Maine Region Report on Atlantic Sea Scallops (Inshore Canada)
") Gulf of Maine Research Institute Responsibly Harvested Seafood from the Gulf of Maine Region Report on Atlantic Sea Scallops (Inshore Canada) The fishery is managed by a competent authority and has a management
Gulf of Maine Research Institute Responsibly Harvested Seafood from the Gulf of Maine Region Report on Atlantic Sea Scallops (Inshore Canada) The fishery is managed by a competent authority and has a management
Salmon and Migratol~Y Trout of the N,anaimo 'River lind Adjacent Streams (Revised 1,973)
") .. '.' ~! ~j-:-t. ~" I. This s~rie~ includes " unpublished preliminary' reports. ana Glatd rec
.. '.' ~! ~j-:-t. ~" I. This s~rie~ includes " unpublished preliminary' reports. ana Glatd rec
Fisheries Closures. Too many vacancies at the salmon hotels. Deborah Lyons Chinook Futures Coalition
 Fisheries Closures Too many vacancies at the salmon hotels Deborah Lyons Chinook Futures Coalition Chilkat Salmon Hotel 47% Occupancy June 12 Aug 9th 2017 Taku Salmon Hotel 28% Occupancy April August 9th
OREGON AND WASHINGTON DEPARTMENTS OF FISH AND WILDLIFE JOINT STAFF REPORT SUMMER FACT SHEET NO. 1 June 10, 2010
 OREGON AND WASHINGTON DEPARTMENTS OF FISH AND WILDLIFE JOINT STAFF REPORT SUMMER FACT SHEET NO. 1 June 10, 2010 Fisheries under consideration: Non-Indian commercial salmon STOCK STATUS Upper Columbia Summer
Department of Fish and Game
 Department of Fish and Game DIVISION OF SPORT FISH 3298 Douglas Place Homer, AK 99603 Main: 907-235-8191 Fax: 907-235-2448 P.O. Box 110024 Juneau, AK 99811-0024 Main: 907-465-4270 Fax: 907-465-2034 October
Columbia River Fishery Notice
 Columbia River Fishery Notice Oregon Department of Fish and Wildlife January 29, 2014 Compact Action The Columbia River Compact agencies of Oregon and Washington met today and took the following actions:
TABLE 1. Commercial troll management measures adopted by the Council for non-indian ocean salmon fisheries, 2016.
 (Page 1 of 5) North of Cape Falcon Supplemental Management Information 1. Overall non-indian TAC: 70,000 Chinook and 18,900 coho marked with a healed adipose fin clip (marked). 2. Non-Indian commercial
IOTC Agreement Article X. Report of Implementation for the year 2016
 IOTC Agreement Article X Report of Implementation for the year 2016 DEADLINE FOR SUBMISSION OF THE REPORT 17 MARCH 2017 Reporting CPC: MALAYSIA Date of submission: 28/02/2017 Please NOTE: this document
ADDENDUM I TO AMENDMENT 3 OF THE INTERSTATE FISHERY MANAGEMENT PLAN FOR WEAKFISH
 ATLANTIC STATES MARINE FISHERIES COMMISSION ADDENDUM I TO AMENDMENT 3 OF THE INTERSTATE FISHERY MANAGEMENT PLAN FOR WEAKFISH Prepared by the Weakfish Plan Review Team Approved October 18, 2000 TABLE OF
The Role of the Recreational Angler in Fisheries Monitoring, Research and Management
 The Role of the Recreational Angler in Fisheries Monitoring, Research and Management Dr. Steven J. Cooke Canada Research Chair in Fish Ecology and Conservation Physiology Carleton University, Ottawa, Canada
In the area between the U.S./Canada border and the Queets River, the landing and possession limit is 50
 TABLE 1. 2019 Commercial troll management Alternatives for non-indian ocean salmon fisheries - Council Adopted. (Page 1 of 11) North of Cape Falcon North of Cape Falcon North of Cape Falcon Supplemental
Implementing the New Fisheries Protection Provisions under the Fisheries Act
 Implementing the New Fisheries Protection Provisions under the Fisheries Act Part 1 Legislation and Policy * The information in this presentation represents concepts as they have been developed to this
ANALYSIS OF PRELIMINARY SALMON MANAGEMENT ALTERNATIVES FOR 2016 OCEAN FISHERIES
 Agenda Item E.7.a Supplemental STT Report March 2016 SALMON TECHNICAL TEAM ANALYSIS OF PRELIMINARY SALMON MANAGEMENT ALTERNATIVES FOR 2016 OCEAN FISHERIES March 13, 2016 Page Intentionally Blank Preseason