Impacts of Mark-Selective Ocean Recreational Fisheries on Washington Coast Coho Stocks. Robert Kope. National Marine Fisheries Service
|
|
|
- Charla Warren
- 5 years ago
- Views:
Transcription
1 Agenda Item C.3.a Attachment 2 November 2012 Impacts of Mark-Selective Ocean Recreational Fisheries on Washington Coast Coho Stocks. Robert Kope National Marine Fisheries Service Northwest Fishery Science Center 2725 Montlake Blvd E Seattle, WA
2 Introduction In a letter dated March 23, 2012, Craig Bowhay requested an analysis of impacts occurring to Washington coast natural coho stocks from ocean recreational mark-selective fisheries for coho salmon in management areas 1-4. Specifically, that the number of Grays Harbor, Queets, Hoh and Quillayute natural coho salmon killed by this fishery each year for the past 5 years be calculated, broken down by management area and recreational component (charter boat and private boat), and be based on sampling data rather than FRAM. Within the four watersheds above, there are coded-wire tag (CWT) programs in 3 of the basins. In Grays Harbor, the southernmost basin, there is a program at Bingham Creek Hatchery; in the Queets Basin, there is a program at the Salmon River Hatchery, and in the Quillayute basin there is a program at the Sol Duc Hatchery. All three of these CWT programs include both marked CWT releases and paired unmarked CWT, or double-index tagged (DIT), releases. Both marked and unmarked fish are sampled in ocean fisheries for all three hatchery programs, but because the bulk of the fish encountered in ocean fisheries are encountered in mark-selective fisheries, and the bulk of mortalities on the unmarked fish are in the form of release mortality and dropoff mortality, which do not provide tag recoveries, the unmarked releases are of very limited utility in terms of estimating the impacts of specific fisheries on specific stocks. Additionally, the reporting of freshwater recoveries of all CWTs differs markedly between the three hatchery programs and presents its own challenges. Geographically, Bingham Creek is the most southerly of the three CWT stocks. The Salmon River is in the middle, and the Sol Duc is the most northerly. The Hoh River is located between the Quillayute and Queets Rivers. Calculation of Impact Rates The approach taken was to calculate exploitation rates on marked fish from each of the four stocks using CWT data, and then use the exploitation rates on marked fish to calculate the impact rates on unmarked fish. In order to calculate marine exploitation rates from CWTs, it is necessary to have estimates of the total number of CWTs captured in ocean fisheries, and estimates of the ocean escapement, or terminal run, of CWTed fish. Ocean catches are routinely sampled coastwide at consistently high rates, and the estimates of the numbers of CWTed fish caught in ocean fisheries reported to the Pacific States Marine Fisheries Commission (PSMFC) where they can be accessed through the Regional Mark Information System (RMIS). Recoveries from freshwater, necessary to calculate ocean escapement, are less consistently sampled and reported, and are more problematic. Marked Fish 2
3 Terminal Run Size In the context of this analysis, terminal run size is the number of fish returning to the river mouth, or caught in terminal area net fisheries inside Willapa Bay and Grays Harbor. It includes all freshwater catch and spawning escapement, as well as incidental mortality resulting from freshwater fisheries and pre-spawning mortality. Freshwater recoveries of CWTs include recoveries in recreational and net fisheries, as well as hatchery returns and spawning escapement to natural areas. The freshwater fisheries in Grays Harbor are well sampled, and CWT recoveries are reported to the RPMC. Coverage of CWTs from spawning escapement, both to hatcheries and to natural areas are also well reported. Within the Queets system, the freshwater net and recreational fisheries appear to be adequately reported, but CWTs reported for spawning escapement appear to be incomplete. Inriver harvest rates calculated from the reported CWT data are substantially higher than the rates reported by the Quinault Indian Nation (STT 2012, Table B-31). In the Quillayute system reporting of freshwater recoveries from both spawning escapement and from inriver fisheries appears to be far from complete. However, missing from all freshwater data are estimates of incidental fishing mortality, as well as prespawing mortality, predation, and poaching. Table 1. Definitions of terms used in equations. Symbol Definition C Catch = landed fish ER Nominal exploitation rate = landed catch/(all landed catch + escapement) T Terminal run = freshwater catches + escapement + catches in terminal area net fisheries (Grays Harbor and Willapa Bay) o, r Superscripts denoting ocean and river respectively m, u Subscripts denoting marked and unmarked fish respectively I Index denoting fishery h Harvest rate = catch/(catch + escapement) c, p Subscripts denoting charter and private sectors of the recreational fleet N Initial abundance assuming no natural mortality = sum of all fishing related mortality and spawning escapement CR Contact rate = (catch + released fish)/initial abundance f Effort in angler days γ Recognition error = rate at which marked fish are released or unmarked fish retained. δ Success rate of anglers in the charter fleet relative to those in the private fleet φ Mortality rate of released fish as a result of being caught and released 3
4 For the sake of calculating impact rates in recreational ocean salmon fisheries, it is not necessary to separate different components of the freshwater recoveries, merely to produce an estimate of the number of the terminal run size of the tagged groups of fish. For the Bingham Creek fish, this was calculated by simply summing the freshwater CWT recoveries from fisheries, hatchery returns and natural spawning escapement, expanded for sampling rates by RMIS. Given a terminal run size, we can calculate the ocean exploitation rate on landed fish (nominal rate) as ER o m = C m 0 (1) C o m +T m where C 0 0 m = i C m,i is the sum of ocean catches of CWTed fish over all ocean fisheries For each individual fishery we can similarly calculate a nominal exploitation rate o ER m,i = C 0 m,i (2) C o m +T m Where m denotes marked fish, and i denotes fishery (i Areas 1-4 sport). For the Queets basin, the reporting of CWTs from freshwater fisheries was assumed to be complete and the reported freshwater exploitation harvest rates were used to expand freshwater catch recoveries to terminal run (terminal run = freshwater catch/freshwater harvest rate). T m = C m r hr (3) For the Quillayute system, the entire terminal run was estimated from ocean catch using the average of ocean exploitation rates from the Queets and Grays Harbor (Figure 1). T m = C m o o ERo C m (4) m For purposes of calculating exploitation rates, catches of coho salmon in other terminal net fisheries were included with terminal run rather than with ocean catches. Grays Harbor coho experience a relatively high catch rate in Willapa Bay net fisheries, while Queets and Quillayute coho do not. Because these fisheries occur after most ocean fishing, CWT recoveries in these fisheries were considered to be more appropriately included with freshwater catches and spawning escapement for the calculation of ocean impact rates. Throughout the rest of this report, terminal area net catches in marine waters outside of stock s natal basin are excluded from calculations of ocean impacts, but are included as pre-terminal in discussion of distribution of harvest impacts. Note that the nominal ocean exploitation rates for marked fish do not include incidental mortality from dropoff or from release of legal sized marked fish that could have been retained. However, at this point it is not necessary to do so. These can be accounted for in application of rates estimated from CWTs to the unmarked natural production. 4
5 Unmarked Fish Ocean Encounters The encounter rate of unmarked fish in the fishery corresponds to the exploitation rate of marked fish, plus the rate at which marked fish are released. We can calculate nominal exploitation rates for Grays Harbor, Queets, and Quillayute coho, but still require rates for the Hoh stock. Examination of the distribution of ocean fishery recoveries for marked CWT releases from the three basins reveals a great deal of similarity (Figure 2). All are caught primarily in the Westport (Area 2) and Ilwaco (Area 1) sport fisheries, the Neah Bay troll fishery (Area 4), Oregon sport fisheries, and west coast Vancouver Island fisheries. Consistent with the geographic distribution of the stocks, the Quillayute stock appears to be impacted most heavily in the WCVI sport fishery which impacts the Queets stock to a lesser extent, and the Grays Harbor stock lesser still. Similarly, recreational fisheries in Westport (Area 2) appear to have the highest proportion of impacts rate on Grays Harbor coho and their proportion of impacts on Quillayute coho are the lowest. The impacts on all three stocks in Washington coast sport fisheries (Areas 1-4) appear to show similar patterns and it seems reasonable to use the marine exploitation rates for more data-rich systems to fill in the holes in the more data-poor ones. Because the Hoh River is located between the Queets and the Quillayute, ocean sport exploitation rates in Washington coastal recreational fisheries for the Queets and Quillayute rivers were averaged for each port in each year to represent ocean sport exploitation rates on the Hoh stock. Incidental Mortality Incidental mortality in ocean fisheries includes dropoff mortality and release mortality. Dropoff mortality is fish that die as a result of encountering fishing gear, but are not brought to the boat. This may include fish that are mortally wounded by contact with terminal tackle and escape to die, or fish removed from gear by predators. Management agencies have adopted a default rate of 5% of fish contacted (brought to the boat) to account for dropoff mortality in marine area hookand-line fisheries. This rate is used for modeling Council area fisheries. Release mortality has been studied exntensively and is also quite variable. The Council has adopted a rate of 14% to account for the mortality of fish brought to the boat and released in recreational fisheries (STT 2000), and a rate of 26% for commercial troll fisheries. In mark-selective recreational fisheries, all unmarked fish are required to be released, and legalsize marked fish are expected to be retained. However, a small fraction of unmarked fish is illegally retained, and some marked fish are released. Legal-size marked fish may be released for a number of reasons: fishermen may mistakenly identify the marked fish as unmarked, they 5
6 may mistakenly believe them to be sublegal when they are actually legal. However, fishermen may also intentionally release marked fish that could be legally retained simply because they want to catch and release fish for sport, or if they intend to retain fish, they may release smaller fish in the hope of catching a larger one, or release coho in the hope of catching a Chinook when regulations permit retention both species. Whether the release of fish that could be legally retained is intentional or unintentional, the release of legal marked fish has been termed mark recognition error, and the illegal retention of unmarked fish has been termed unmark recognition error (Lawson and Sampson, 1996). For modeling purposes, the STT models releases of legal marked fish at a uniform rate of 6% of the landed catch in mark-selective ocean recreational fisheries. However, the recreational fishery includes fishermen who fish from both private boats, and from charter boats. These two fleets behave differently. On a charter boat, the operator has an economic incentive to retain every legal fish. This serves to reduce the duration (and thus the cost) of trips when limits are being caught, and it improves the catch statistics for the fishery when limits are not being caught, which may stimulate more business. Fishermen on private boats are more likely to release legal fish, either to sort fish or simply for sport. However, they are probably less likely to release legal fish when catch rates are low and more likely to do so when catch rates are high. Washington Department of Fish and Wildlife has been monitoring mark-selective fisheries since they were initiated in In recent years, the monitoring program has included at-sea observers on the charter boat fleet, voluntary trip reports (VTR) from the private fleet, and dockside interviews by port samplers from both sectors. The dockside sampling did not discriminate released fish by size, but the onboard observers and the VTR data did. Because the focus of this analysis is on legal-sized fish, the observer and VTR data were used. Because sampling has been more complete in the past few years, data from 2009 through 2011 were used (Appendix A). For purposes of estimating the numbers of marked fish released by each sector, the aggregate rates over all months, ports, and years were used (0.02 for the charter sector, and 0.07 for the private sector). For each port, in each year, the contact rate of unmarked fish can be calculated from the fishery specific nominal exploitation rate for marked fish by partitioning the exploitation rate between the charter and private sectors proportional to the effort in that sector, scaled by its relative success rate. For the charter fleet, the contact rate is given by: o CR u,i,c o = (1 + γ m,c )ER m,i f i,c δ c f i,c δ c +f i,p (5) Where f is fishing effort in angler trips (Table 2), c denotes the charter fleet, p denotes private boat fleet, γ m denotes the rate at which legal marked fish are released (mark recognition error), and δ c, is the success rate of fishermen on charter boats relative to those on private boats (Table 3). For the private boat fleet, the contact rate is given by: 6
7 o CR u,i,p o = (1 + γ m,p )ER m,i Then the total mortality of unmarked fish in the fishery by port and sector is f i,p f i,c δ c +f i,p (6) o C u,i,j o = N u γ u + ( φ i ) CR u,i,j (7) Where j denotes sector, and γ u denotes the rate at which unmarked fish are illegally retained (unmarked recognition error), φ i denotes the release mortality rate for fishery i (0.14 for recreational fisheries and 0.26 for commercial troll fisheries), and N u is the initial abundance of unmarked fish, given by: N u = T u (1 i CR o m,i φ i ) (8) where i pre-terminal ocean fisheries. This method of apportioning mortalities of unmarked fish between the charter and private boat sectors on the basis of the relative success rates of anglers in terms of marked fish, assumes that both fleets are contacting marked and unmarked fish at the same rated. This requires either that both fleets have the same distribution, or that marked and unmarked fish from the same stock have the same distribution. Sample data in the form of observer data from the charter fleet and VTRs from the private fleet collected within the same month and port area indicate that the charter fleet encounters a higher proportion of marked fish than the private boat fleet (R. Conrad, personal communication). This implies that on average the fleets are fishing in different areas, AND that marked and unmarked fish have different distributions. However, the sample data are for total coho encounters and cannot be decomposed into encounters by stock. While these data do not directly inform the question of whether or not marked and unmarked fish from the same stock share the same ocean distribution, at a minimum they highlight how tenuous this assumption is. Results and Discussion Exploitation rates calculated here depend on the assumptions that went into estimation of the terminal run sizes of the CWT groups used in the analysis. While the analysis would have been more straightforward had there been more complete reporting of freshwater recoveries of CWTs from the Queets and Quillayute basins, the approach used here deals with the shortcomings in the CWT data and seems to be reasonably supported by inriver harvest and ocean CWT distribution data. Because of the proximity of these stocks, we would expect them to have similar ocean distributions and consequently similar ocean exploitation rates. The methods used to estimate terminal run size for the Queets stock produced ocean exploitation rates very similar to those of 7
8 Grays Harbor for all broods except the 2004 brood (Figure 1). For some reason CWTs from the Queets stock were recovered in ocean fisheries at more than 3 times the rate of CWTs from the Grays Harbor stock. Yet, there was nothing abnormal about the distributions of the ocean recoveries of either stock in that year. While the ocean exploitation rates calculated for the Quillayute are also quite similar to those of the Queets and Grays Harbor, the method used to generate terminal runs of CWTs guaranteed that the calculated ocean exploitation rate for the Quillayute would be intermediate between those of the other two stocks in each year. However, the similarities in CWT ocean recovery patterns for all three stocks (Figure 2) support the use of surrogate data for these stocks. The calculated mortalities for each port area, by private and charter boat sectors, are reported in Tables 4-7, and the distribution of all mortalities for both marked and unmarked coho among pre-terminal fisheries, inriver fisheries, and spawning escapement is presented in Table 8. Note that mortalities attributed to the Washington coast recreational mark-selective fishery are also included in the pre-terminal category, so the columns of pre-terminal ER, inriver ER, and escapement should sum to 100% except for rounding error. It should be noted that the hatchery and natural stocks are subject to selective harvest in freshwater, and that there is no hatchery program in the Hoho River. Marked fish in the Hoh River are dip-ins, primarily from other coastal stocks. Within the CWT broods used in this analysis, the only net fisheries that recovered any tags in marine waters were in Grays Harbor and Willapa Bay. There were no tags from the Queets or Quillayute stocks recovered in Grays Harbor net fisheries, and no tags from the Queets recovered in Willapa Bay. There were a handful of Quillayute tags and a substantial number of Grays Harbor tags recovered in Willapa Bay net fisheries. These are included in the pre-terminal ER for both stocks, while the Grays Harbor net recoveries of Grays Harbor tags were included with the inriver ER. Calculated impact rates in the years 2006 through 2010 in mark-selective Washington recreational ocean fisheries have ranged from 0.4% to 3.7% over all years and stocks with average rates ranging from 0.8% for the Quillayute to 1.7% for the Queets. During the same time period, the impact rates in these fisheries on marked coho from the same stocks have ranged from 1.8% to 17.6%, and averaged from 4.1% to 14.5% The average distribution of impacts for each unmarked stock is presented in Figure 3, while the distribution of impacts on marked hatchery fish is presented in Figure 4. The other preterminal impacts on Grays Harbor unmarked fish are noticeably larger than they are for the other three stocks. This is due to the inclusion of Willapa Bay net fishery, which is not markselective, impacts in the pre-terminal category. Nearly all other pre-terminal fisheries in which Washington coastal CWTs are recovered are mark-selective. As a result of this, pre-terminal fisheries make up a larger share of the impacts on marked fish on the same stocks. Because the terminal run is a larger fraction of the total abundance, both the terminal fishery impacts and 8
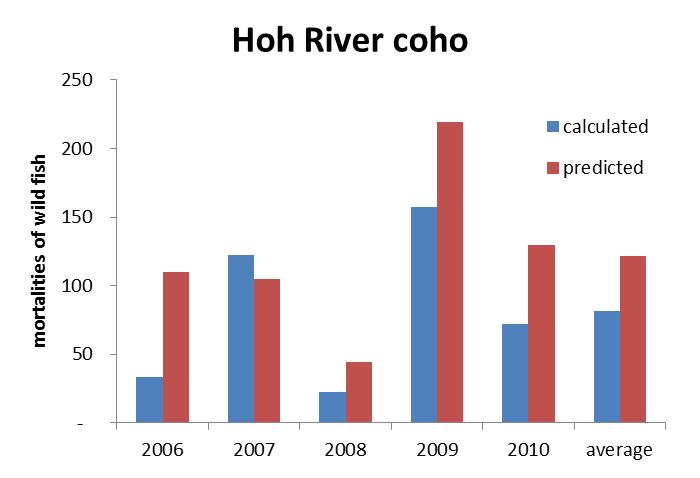
9 spawning escapement comprise larger proportions of the unmarked stocks than the corresponding marked stocks. Figure 5 compares the impacts in mark-selective Washington ocean recreational fisheries for coho relative to the pre-season prediction of impacts in these fisheries based on the final run of FRAM used each year for projecting impacts reported in Preseason Report III. Predictions have been remarkably close to post season estimates based on CWTs for Grays Harbor and Quillayute coho stocks on average. It appears that impacts to Queets coho have been consistently overpredicted, and impacts to Hoh coho have been overpredicted on average. 9
10 Literature Cited Lawson, P.W., and D.B. Sampson Gear-related mortality in selective fisheries for ocean salmon. North American Journal of Fisheries Management. 16: STT STT recommendations for hooking mortality rates in 2000 recreational ocean Chinook and coho fisheries. Pacific Fishery Management Council, Salmon Technical Team, Portland, OR. March, p. STT Review of 2011 Ocean Salmon Fisheries. Pacific Fishery Management Council, Salmon Technical Team, Portland, OR. Feb, p. 10
11 Table 2. Recreational effort (angler trips) by charter and private boat sectors in the Washington coast recreational ocean salmon fishery. Data from the Table IV-13 of the Review of 2011 Ocean Salmon Fisheries (STT 2012). area 1 area 2 area 3 area 4 year charter private charter private charter private charter private ,048 13,472 15,421 9, , , ,087 20,045 15,667 10, , , ,747 6,272 9,942 8, , , ,740 29,806 18,520 19, , , ,961 20,052 18,425 20, , , ,857 15,680 14,136 19, , ,569 Table 3. Success rates of charter and private boat sectors of the Washington coast recreational ocean salmon fishery. Data from the Tables IV-10 and IV-13 of the Review of 2011 Ocean Salmon Fisheries (STT 2012). coastwide angler trips catch catch/trip year charter private total charter private charter private ratio ,518 39,096 63,614 16,186 19, ,747 45,936 72,683 33,736 50, ,209 22,199 36,408 8,265 10, ,446 69,480 98,926 47,855 89, ,450 54,377 80,827 14,119 22, ,160 49,229 71,389 15,075 24,
12 Table 4. Impacts on Grays Harbor unmarked natural coho in Washington coast mark-selective recreational fisheries. Numbers are mortalities by port area and recreational fleet sector. Dashes reflect no CWT recoveries of marked fish. Area 4 Area 3 Area 2 Area 1 total Charter boats Private boats WA ocean recreational total , ,
13 Table 5. Impacts on Queets River unmarked natural coho in Washington coast mark-selective recreational fisheries. Numbers are mortalities by port area and recreational fleet sector. Dashes reflect no CWT recoveries of marked fish. Area 4 Area 3 Area 2 Area 1 total Charter boats Private boats WA ocean recreational total
14 Table 6. Impacts on Hoh River unmarked natural coho in Washington coast mark-selective recreational fisheries. Numbers are mortalities by port area and recreational fleet sector. Area 4 Area 3 Area 2 Area 1 total Charter boats Private boats WA ocean recreational total
15 Table 7. Impacts on Quillayute River unmarked natural coho in Washington coast markselective recreational fisheries. Numbers are mortalities by port area and recreational fleet sector. Dashes reflect no CWT recoveries of marked fish. Area 4 Area 3 Area 2 Area 1 total Charter boats Private boats WA ocean recreational total
16 Table 8. Distribution of impacts among different fisheries for marked and unmarked coho from Washington coastal stocks. The category of WA rec ER is included in the pre-terminal ER as well. Catches in terminal area net fisheries outside the basin of origin are included in the preterminal ER category, but net catches from marine waters inside Grays Harbor are included in the inriver ER for Grays Harbor. Marked Fish inriver ER Unmarked fish inriver ER Pre-term ER WA rec ER escapement Pre-term ER WA rec ER escapement Grays Harbor % 7.0% 26.5% 54.1% 11.7% 1.4% 11.6% 76.8% % 6.0% 33.1% 53.0% 7.0% 1.2% 21.1% 72.0% % 2.3% 34.0% 60.2% 3.0% 0.5% 26.8% 70.2% % 7.7% 17.5% 68.2% 4.4% 1.6% 20.7% 74.8% % 3.7% 28.1% 65.6% 2.9% 0.8% 3.1% 94.0% average 11.9% 5.3% 27.8% 60.2% 5.8% 1.1% 16.6% 77.6% Queets River % 7.8% 51.7% 36.3% 2.9% 1.6% 11.7% 85.4% % 17.6% 21.1% 43.7% 11.2% 3.7% 20.3% 68.5% % 3.2% 36.4% 57.1% 1.8% 0.7% 25.1% 73.1% % 7.4% 45.7% 40.4% 3.5% 1.5% 42.8% 53.7% % 3.6% 48.3% 46.9% 1.1% 0.7% 40.0% 58.9% average 14.5% 7.9% 40.6% 44.9% 4.1% 1.7% 28.0% 67.9% Hoh River % 7.0% 87.9% 0.0% 3.1% 1.4% 42.1% 54.8% % 10.4% 71.1% 0.0% 8.8% 2.2% 36.5% 54.7% % 2.5% 65.2% 28.5% 1.6% 0.5% 42.2% 56.2% % 6.8% 86.4% 0.0% 3.5% 1.4% 37.1% 59.4% % 3.3% 95.2% 0.0% 1.1% 0.7% 25.2% 73.8% average 13.1% 6.0% 81.2% 5.7% 3.6% 1.2% 36.6% 59.8% Quillayute River % 6.2% 26.5% 61.2% 3.4% 1.3% 55.6% 41.0% % 3.1% 36.1% 41.3% 6.4% 0.7% 40.1% 53.5% % 1.8% 64.7% 29.3% 1.3% 0.4% 45.9% 52.8% % 6.0% 72.5% 14.1% 3.5% 1.3% 65.7% 30.8% % 3.0% 70.5% 24.7% 1.0% 0.6% 55.5% 43.5% average 11.8% 4.1% 54.1% 34.1% 3.1% 0.8% 52.6% 44.3% 16

17 Figure 1. Ocean exploitation rates on Washington coastal coho. The upper panel is raw exploitation rates calculated from CWTs as reported to the Pacific States Marine Fisheries Commission. In the lower panel, the terminal run was calculated from reported inriver CWT recoveries and reported inriver harvest rate on hatchery fish for the Queets, and ocean exploitation rate for Quillayute was obtained by averaging those of the Queets and Grays Harbor. For the Quillayute River these ocean exploitation rates were used to calculate terminal run of tagged fish from the total ocean catch. 17
18 Figure 2. Distribution of ocean recoveries of CWTs from Washington coastal coho across ocean fisheries. The upper panel is the sum of all expanded CWT recoveries from the 2003 through 2008 brood year releases of marked tagged fish. The lower panel is average of the distributions from each of the six brood years. 18

19 Figure 3. Average distribution of impacts on unmarked Washington coast coho stocks ( ). 19
20 Figure 4. Average distribution of impacts on marked Washington coast coho stocks ( ). 20

21 . 21
22 Figure 5. Comparison of pre-season prediction of impacts in Washington coastal mark-selective recreational fisheries with impacts calculated from coded-wire tag data. 22
23 Appendix A. Evaluation of differences in release rates of legal-size marked coho salmon in recreational fisheries. Because of suspected differences in the release rates of marked fish between the charter boat and private boat recreational fleets, relationships with a number of potential factors were examined. In the charter boat fleet, the operators have an economic incentive to retain all legal fish brought to the boat. In the private fleet, fishermen may release fish that could be legally retained for a variety of reasons. Whatever the reasons, it seems likely that fishermen would be less likely to release fish that could be legally retained when catch rates are low and they are catching fewer fish, and more likely to release fish when catch rates are high. To evaluate this, marked-fish release rate were compared with CPUE in the recreational fleet. Comparisons were also made between years, months, and port areas where possible. Data used were for legal-sized fish in mark-selective recreational fisheries (Wendy Beeghley, WDFW, personal communication). For the charter boat fleet, there data are based on at-sea observations by WDFW observers (Table A.1). For the private boat fleet, they are compiled from voluntary trip reports submitted by private recreational anglers (Table A.2). In both cases, data are recorded while fishing is taking place and do not rely on recollection by the anglers. Data are shown categorized by the different factors for the charter fleet (Figure A.1) and the private fleet (Figure A.2). The most significant difference, by far, is the difference between the charter and private fleets. As expected, the charter fleet releases a significantly lower proportion of legal-sized marked coho during mark-selective fisheries (Table A.3). All other comparisons were made within fleets. The relationship with CPUE is something of a surprise. There is no apparent relationship for the charter boat fleet (Figure A.1). This is not really surprising since the boats and the passengers have incentives to retain all legal fish. In the private boat fleet, the relationship is weak, but in the opposite direction one would expect. Release rate of legal fish appear to be higher when CPUE is lower. Other relationships were not consistent or compelling. In both the charter and private fleets, there is a significant difference between the ports of Ilwaco and Westport. However, they are in opposite directions. In the charter fleet, the release rate is lower in Westport, while in the private fleet the release rate is lower in Ilwaco. The only other statistically significant difference was in the private fleet, between release rates in July and September. However, in the month of July, there were only 5 observations, and 3 of these were zeros. All three of these zeros were from samples that had fewer than 20 observations. Consequently, all potential differences, other than the difference between charter boats and private boats, were ignored in the calculations of impacts on unmarked fish. 23
24 Table A.1. Observer data for legal-sized, adipose-clipped coho salmon in the charter boat fleet during mark selective recreational fisheries. CPUE is in terms of catch per angler trip in the combined fleet. Release rates are only reported for sample sizes of at least 10. year month port CPUE kept released sample size release rate
25 Tabel A.2. Voluntary trip report (VTR) data for legal-size, adipose-clipped coho salmon in the private boat fleet during mark-selective recreational fisheries. CPUE is in terms of catch per angler trip in the combined fleet. Release rates are only reported for sample sizes of at least 10. year month port CPUE kept released sample size release rate
26 Table A.3. Tests of significance for differences in release rates for marked coho salmon. The test for difference between the charter and private boat fleets was a one-tailed test assuming different variances. All others were 2-tailed tests assuming the same variance. Differences significant at the 0.05 probability level are bold. mean 1 var1 n1 mean2 var2 n2 df t-stat p() Charter vs Private Charter -yr Charter -mo Jul-Aug Jul-Sep Aug-Sep Charter -port Ilwaco-Westport Private -yr Private -mo Jun-Jul Jun-Aug Jun-Sep Jul-Aug Jul-Sep Aug-Sep Private -port Ilwaco-Westport Ilwaco-LaPush Ilwaco-Neah Bay Westport-LaPush Westport-Neah Bay LaPush-Neah Bay
27 Figure A.1. Monthly release rate of legal size marked coho salmon in the charter boat fleet based on observer data, categorized by CPUE in the combined sport fleet, month, port area, and year. Only values based on sample sizes of at least 10 are shown. 27
28 Figure A.2. Monthly release rate of legal size marked coho salmon in the private boat fleet based on voluntary trip report data, categorized by CPUE in the combined sport fleet, month, port area, and year. Only values based on sample sizes of at least 10 are shown. 28
Status Determination Criteria for Willapa Bay Natural Coho. Salmon Technical Team and Washington Department of Fish and Wildlife
 Agenda Item C.2.a Attachment 6 November 2013 Status Determination Criteria for Willapa Bay Natural Coho Salmon Technical Team and Washington Department of Fish and Wildlife Prepared by: Robert Kope Northwest
A Method for Utilizing Recent Coded Wire Tag Recovery Data to Adjust FRAM Base Period Exploitation Rates
 Agenda Item F.2.a Attachment 4 November 2014 2014 Salmon Methodology Review A Method for Utilizing Recent Coded Wire Tag Recovery Data to Adjust FRAM Base Period Exploitation Rates Galen A. Johnson, Northwest
CALIFORNIA DEPARTMENT OF FISH AND WILDLIFE RECOMMENDATIONS ON ADDITIONAL WINTER-RUN PROTECTIONS IN 2016 OCEAN FISHERIES
 Agenda Item E.1 CDFW Supplemental Report April 216 CALIFORNIA DEPARTMENT OF FISH AND WILDLIFE RECOMMENDATIONS ON ADDITIONAL WINTER-RUN PROTECTIONS IN 216 OCEAN FISHERIES In April 215, CDFW recommended
ESTIMATED RETURNS AND HARVEST OF COLUMBIA RIVER FALL CHINOOK 2000 TO BY JOHN McKERN FISH PASSAGE SOLUTIONS
 ESTIMATED RETURNS AND HARVEST OF COLUMBIA RIVER FALL CHINOOK 2000 TO 2007 BY JOHN McKERN FISH PASSAGE SOLUTIONS ESTIMATED RETURNS AND HARVEST OF COLUMBIA RIVER FALL CHINOOK 2000 TO 2007 This analysis of
Tuesday, April 10, 2018, 5:08 PM
 TABLE 2. 2018 Recreational management measures for non-indian ocean salmon fisheries - Council adopted. (Page 1 of 5) North of Cape Falcon Supplemental Management Information 1. Overall non-indian TAC:
PRE-SEASON PLANNING FOR FRASER SALMON and STOCKS OF CONCERN. Forum on Conservation and Harvest Planning for Fraser Salmon January 22, 2010
 PRE-SEASON PLANNING FOR FRASER SALMON and STOCKS OF CONCERN Forum on Conservation and Harvest Planning for Fraser Salmon January 22, 2010 2 Outline South Coast Chinook Status Management Actions Recovery
2017 Fall Zone 4-5 Gillnet Fishery WDFW and ODFW Observation Study Sampling Plan
 2017 Fall Zone 4-5 Gillnet Fishery WDFW and ODFW Observation Study Sampling Plan Introduction Columbia River fisheries generate millions of dollars in economic value annually, and are an integral part
for Salmon and Watersheds
 for Salmon and Watersheds Stock Assessment of Anadromous Salmonids, Report Number: OPSW-ODFW-3- The Oregon Department of Fish and Wildlife prohibits discrimination in all of its programs and services on
ANALYSIS OF PRELIMINARY SALMON MANAGEMENT ALTERNATIVES FOR 2016 OCEAN FISHERIES
 Agenda Item E.7.a Supplemental STT Report March 2016 SALMON TECHNICAL TEAM ANALYSIS OF PRELIMINARY SALMON MANAGEMENT ALTERNATIVES FOR 2016 OCEAN FISHERIES March 13, 2016 Page Intentionally Blank Preseason
THE OREGON. PLAN for Salmon and Watersheds. Stock Assessment of Anadromous Salmonids, Report Number: OPSW-ODFW
 THE OREGON PLAN for Salmon and Watersheds Stock Assessment of Anadromous Salmonids, Report Number: OPSW-ODFW-1- The Oregon Department of Fish and Wildlife prohibits discrimination in all of it s programs
WEST COAST FISHERIES AND MANAGEMENT
 WEST COAST FISHERIES AND MANAGEMENT Olympic Coast National Marine Sanctuary Advisory Council May 20, 2016 Heather Reed - WDFW Jessi Doerpinghaus - WDFW FISHING IS KEY TO WASHINGTON S ECONOMY Washington
Stock Assessment of Anadromous Salmonids, 2003 Report Number: OPSW-ODFW
 THE OREGON PLAN for Salmon and Watersheds Stock Assessment of Anadromous Salmonids, 3 Report Number: OPSW-ODFW-- The Oregon Department of Fish and Wildlife prohibits discrimination in all of its programs
SALMON MANAGEMENT ALTERNATIVES HEARING SUMMARY
 Agenda Item E.1.b Supplemental Public Hearing Report 1 April 2016 SALMON MANAGEMENT ALTERNATIVES HEARING SUMMARY Date: March 28, 2016 Hearing Officer: Mr. Kyle Adicks Location: Chateau Westport Other Council
2017 Adult Returns and 2018 Expectations Columbia River Updated Draft January 11, 2018
 Willamette Spring 2017 Adult Returns and 2018 Expectations Columbia River Updated Draft January 11, 2018 2017 Results 2018 Expectations 38,100 predicted adult return to CR (19% wild) 50,774 actual adult
Stock Assessment of Elk River Fall Chinook Salmon for Exploitation Rate Analysis
 Stock Assessment of Elk River Fall Chinook Salmon for Exploitation Rate Analysis Prepared by: Ron Williams Oregon Department of Fish and Wildlife 3406 Cherry Avenue Salem, Oregon 97302 March 2004 This
 Informational Report 1 USFWS Mass Marking Update April 2005 Update on USFWS 2005 Mass Marking Initiative Background Under Section 138 of FY 2003 Omnibus Appropriations Act (PL 108-7), Congress directed
2017 Non-Treaty Columbia River Summer/Fall Fishery Allocation Agreement June 15, 2017
 2017 Non-Treaty Columbia River Summer/Fall Fishery Allocation Agreement June 15, 2017 Management Intent and Expectations for Summer Chinook and Sockeye Fisheries The preseason forecast for upper Columbia
TESTIMONY OF THE COLUMBIA RIVER TREATY TRIBES BEFORE PACIFIC FISHERIES MANAGEMENT COUNCIL April 12, 2010 Portland, OR
 Agenda Item H.1.f Supplemental Tribal Report 2 April 2010 TESTIMONY OF THE COLUMBIA RIVER TREATY TRIBES BEFORE PACIFIC FISHERIES MANAGEMENT COUNCIL April 12, 2010 Portland, OR Good day Mr. Chairman and
Salmon Technical Team Preseason Report III Tables
 Attachment 4 Oregon Fish and Wildlife Commission Date: April 20, 2012 EXHIBIT C Salmon Technical Team Preseason Report III Tables Salmon Management Measures Adopted by the Council for 2012-April 2013 Ocean
NATIONAL MARINE FISHERIES SERVICE REPORT ON PACIFIC HALIBUT CATCH SHARING PLAN CHANGES FOR 2015
 Agenda Item G.1.b Supplemental NMFS Report 1 November 2014 NATIONAL MARINE FISHERIES SERVICE REPORT ON PACIFIC HALIBUT CATCH SHARING PLAN CHANGES FOR 2015 Table of Contents Purpose of the document... 2
FISHERY REGULATION ASSESSMENT MODEL (FRAM)
") FISHERY REGULATION ASSESSMENT MODEL (FRAM) - An Overview for Coho and Chinook - v 3.0 MODEL EVALUATION WORKGROUP Pacific Fishery Management Council 7700 NE Ambassador Place, Suite 101 Portland, OR 97220-1384
FISHERY REGULATION ASSESSMENT MODEL (FRAM) - An Overview for Coho and Chinook - v 3.0 MODEL EVALUATION WORKGROUP Pacific Fishery Management Council 7700 NE Ambassador Place, Suite 101 Portland, OR 97220-1384
COLLATION OF PRELIMINARY SALMON MANAGEMENT ALTERNATIVES FOR 2018 OCEAN FISHERIES
 Agenda Item E.4.a Supplemental STT Report 1 March 2018 SALMON TECHNICAL TEAM COLLATION OF PRELIMINARY SALMON MANAGEMENT ALTERNATIVES FOR 2018 OCEAN FISHERIES March 11, 2018 TABLE 1. 2018 Commercial troll
18 March 2016 Oregon Department of Fish and Wildlife
 18 March 2016 Oregon Department of Fish and Wildlife Background Joint OR/WA policy adoption 2012 OR re-adoption of rules 6/13 Transition period (2013-2016) Phased allocation shift Mainstem gillnets allowed
June 3, 2014 MEMORANDUM. Council Members. Stacy Horton, Policy Analyst, Washington. SUBJECT: Final 2012 Hatchery Fin Clip Report
 Bill Bradbury Chair Oregon Henry Lorenzen Oregon W. Bill Booth Idaho James A. Yost Idaho Jennifer Anders Vice Chair Montana Pat Smith Montana Tom Karier Washington Phil Rockefeller Washington June 3, 2014
CHAPTER II CHINOOK SALMON MANAGEMENT CENTRAL VALLEY CHINOOK STOCKS. Management Objectives. Regulations to Achieve Objectives.
 CHAPTER II CHINOOK SALMON MANAGEMENT CENTRAL VALLEY CHINOOK STOCKS Central Valley Chinook stocks include fall, late-fall, winter, and spring stocks of the Sacramento and San Joaquin rivers and their tributaries.
Report on Science Center Activities
 Agenda Item E.1.b Supp NMFS PowerPoint March 2016 Report on Science Center Activities Columbia River Estuary Habitat Puget Sound Harbor Seal Predation West Coast Salmon GSI Climate Update Evaluating the
Columbia River Fisheries Management. Estimating Effort, Catch, and ESA Impacts in Recreational Fisheries
 Columbia River Fisheries Management Estimating Effort, Catch, and ESA Impacts in Recreational Fisheries Columbia River Fisheries Management Recreational Fisheries Responsibilities: Estimate angler effort
2007 Adult Returns and 2008 Expectations Columbia River
 2007 Adult Returns and 2008 Expectations Columbia River Preliminary Draft December 11, 2007 (updated ) Adult Returns Willamette Spring Upriver Spring Upriver Summer Sockeye Upriver Summer Steelhead Bright
Recent updates to Marine Impact Model for IFR Coho. Prepared by: Pieter Van Will, DFO Port Hardy
 Recent updates to Marine Impact Model for IFR Coho Prepared by: Pieter Van Will, DFO Port Hardy Recent model updates Base period (BP) review Incorporation of uncertainty in Average BP exploitation rate
Oregon Department of Fish and Wildlife Ocean Salmon and Columbia River Program Columbia River Management Program
 IMPROVING MONITORING METHODS FOR ESTIMATION OF NON-RETAINED SALMONIDS ENCOUNTERED IN SUMMER AND FALL COLUMBIA RIVER COMMERCIAL FISHERIES FINAL REPORT Oregon Department of Fish and Wildlife Ocean Salmon
IPHC Regulatory Area 2A Directed Commercial Pacific Halibut Fishery Sample Vessel Fishing Period Limit Options for Longer Fishing Periods
 Agenda Item G.1.a IPHC Report 1 September 2017 IPHC Report September 2017 IPHC Regulatory Area 2A Directed Commercial Pacific Halibut Fishery Sample Vessel Fishing Period Limit Options for Longer Fishing
Harvest Mgmt. & Fishery Regulations 2017 KATHRYN KONOSKI, FISHERIES BIOLOGIST STILLAGUAMISH TRIBE OF INDIANS
 Harvest Mgmt. & Fishery Regulations 2017 KATHRYN KONOSKI, FISHERIES BIOLOGIST STILLAGUAMISH TRIBE OF INDIANS Harvest Management Annual Cycle Egg Alevin Post Season Pre-Season Spawn Adult In-Season Fishery
Attachment 1. Agenda Item Summary BACKGROUND
 Attachment 1 Agenda Item Summary BACKGROUND Spring Chinook Salmon: Prior to the late 1970s, non-treaty spring Chinook fisheries in the mainstem Columbia River occurred from February through May and harvested
In the area between the U.S./Canada border and the Queets River, the landing and possession limit is 50
 TABLE 1. 2019 Commercial troll management Alternatives for non-indian ocean salmon fisheries - Council Adopted. (Page 1 of 11) North of Cape Falcon North of Cape Falcon North of Cape Falcon Supplemental
Tuesday, April 10, 2018, 5:04 PM
 TABLE 1. 2018 Commercial troll management measures for non-indian ocean salmon fisheries - Council adopted. (Page 1 of 6) A. SEASON DESCRIPTIONS North of Cape Falcon Supplemental Management Information
FISHERY REGULATION ASSESSMENT MODEL (FRAM)
") FISHERY REGULATION ASSESSMENT MODEL (FRAM) Technical Documentation for Coho and Chinook v. 3.0 MODEL EVALUATION WORKGROUP Pacific Fishery Management Council 7700 NE Ambassador Place, Suite 101 Portland,
FISHERY REGULATION ASSESSMENT MODEL (FRAM) Technical Documentation for Coho and Chinook v. 3.0 MODEL EVALUATION WORKGROUP Pacific Fishery Management Council 7700 NE Ambassador Place, Suite 101 Portland,
TABLE 1. Commercial troll management measures adopted by the Council for non-indian ocean salmon fisheries, 2016.
 (Page 1 of 5) North of Cape Falcon Supplemental Management Information 1. Overall non-indian TAC: 70,000 Chinook and 18,900 coho marked with a healed adipose fin clip (marked). 2. Non-Indian commercial
Kirt Hughes Washington Department of Fish and Wildlife Region 6 - Fish Program Manager
 Kirt Hughes Region 6 - Fish Program Manager Habitat Hatcheries Harvest Clean Water Act Shorelines Harvest Hydro Habitat Forest Practices Non-regulatory Programs Water Supply & Conservation Growth Management
2015 Adult Returns and 2016 Expectations Columbia River Preliminary Draft December 14, 2015
 2015 Adult Returns and 2016 Expectations Columbia River Preliminary Draft December 14, 2015 Adult Returns 2015 Results 2016 Expectations Willamette Spring (includes jacks) 55,400 predicted return to CR
Department of Fish and Game
 Department of Fish and Game DIVISION OF SPORT FISH 3298 Douglas Place Homer, AK 99603 Main: 907-235-8191 Fax: 907-235-2448 P.O. Box 110024 Juneau, AK 99811-0024 Main: 907-465-4270 Fax: 907-465-2034 October
Agenda Item G.1.b Supplemental WDFW Report June 2017
 1 Agenda Item G.1.b Supplemental WDFW Report June 2017 WASHINGTON DEPARTMENT OF FISH AND WILDLIFE REPORT ON SCOPING OF CATCH SHARING PLAN CHANGES AND INTERNATIONAL PACIFIC HALIBUT COMMISSION DATA REQUEST
Agenda Item G.1.a Supplemental CDFW Report 2 September 2015
 Agenda Item G.1.a Supplemental CDFW Report 2 September 2015 CALIFORNIA DEPARTMENT OF FISH AND WILDLIFE REPORT ON PACIFIC BLUEFIN MONITORING AND MANAGEMENT ACTIVITIES FOR RECREATIONAL AND COMMERCIAL FISHERIES
Puyallup Tribe of Indians Shellfish Department
 Puyallup Tribe of Indians Shellfish Department Dungeness crab trap catch efficiency related to escape ring location and size George Stearns* 1, Robert Conrad 2, David Winfrey 1, Nancy Shippentower-Games
Salmon Technical Team Report on Western Strait Juan de Fuca Coho Overfishing Assessment
 Agenda Item G.3.b STT Report 2 March 2010 Salmon Technical Team Report on Western Strait Juan de Fuca Coho Overfishing Assessment Executive Summary In 2005, 2006, 2007, and 2008 the Western Strait of Juan
Pacific Fishery Management Council NEWS RELEASE WEST COAST SALMON SEASON DATES SET
 Pacific Fishery Management Council NEWS RELEASE FOR IMMEDIATE RELEASE: Tuesday, April 11, 2017 Contact: Ms. Jennifer Gilden, Communications Officer, Jennifer.gilden@noaa.gov Mr. Mike Burner, Deputy Director,
DEPARTMENT OF FISH AND GAME
 Sean Parnell, GOVERNOR DEPARTMENT OF FISH AND GAME November 4, 2011 DIVISION OF SPORT FISH 3298 Douglas Place Homer, AA 99603-8027 PHONE: (907) 235-8191 FAX: (907) 235-2448 and Douglas Island Center Bldg
INCIDENTAL FISHING MORTALITY OF CHINOOK SALMON: MORTALITY RATES APPLICABLE TO PACIFIC SALMON COMMISSION FISHERIES
 INCIDENTAL FISHING MORTALITY OF CHINOOK SALMON: MORTALITY RATES APPLICABLE TO PACIFIC SALMON COMMISSION FISHERIES PACIFIC SALMON COMMISSION JOINT CHINOOK TECHNICAL COMMITTEE TCCHINOOK (97)-1 i Membership
INFORMATION REPORTS. Number FISH DIVISION. Oregon Department of Fish and Wildlife
 INFORMATION REPORTS Number 2001-07 FISH DIVISION Oregon Department of Fish and Wildlife Estimating Run Size and Spawner Escapement of Chinook Salmon in Elk River, CurryCounty, for use as an Exploitation
Depletion-Based Stock Reduction Analysis (DB-SRA) for Starry Flounder (Platichthys stellatus) in U.S. Waters off California, Oregon and Washington
 for Starry Flounder (Platichthys stellatus) in U.S. Waters off California, Oregon and Washington") Agenda Item F.6 Attachment 3 November 2017 Depletion-Based Stock Reduction Analysis (DB-SRA) for Starry Flounder (Platichthys stellatus) in U.S. Waters off California, Oregon and Washington E.J. Dick 1,
Agenda Item F.6 Attachment 3 November 2017 Depletion-Based Stock Reduction Analysis (DB-SRA) for Starry Flounder (Platichthys stellatus) in U.S. Waters off California, Oregon and Washington E.J. Dick 1,
California Department of Fish and Wildlife Report to the International Pacific Halibut Commission on 2017 California Fisheries
 IPHC-2018-AM094-AR08 Received: 22 December 2017 California Department of Fish and Wildlife Report to the International Pacific Halibut Commission on 2017 California Fisheries California Department of Fish
Pacific Fishery Management Council NEWS RELEASE
 Pacific Fishery Management Council NEWS RELEASE FOR IMMEDIATE RELEASE: Monday, March 13, 2017 Contact: Ms. Jennifer Gilden, Communications Officer, 503 820 2418 or jennifer.gilden@noaa.gov Mr. Mike Burner,
2017 PACIFIC HALIBUT CATCH SHARING PLAN FOR AREA 2A
 (a) FRAMEWORK 2017 PACIFIC HALIBUT CATCH SHARING PLAN FOR AREA 2A This Plan constitutes a framework that shall be applied to the annual Area 2A total allowable catch (TAC) approved by the International
JOINT STAFF REPORT WINTER FACT SHEET NO. 9 Columbia River Compact March 18, 2004
 JOINT STAFF REPORT WINTER FACT SHEET NO. 9 Columbia River Compact March 18, 2004 Purpose: To review ongoing commercial fisheries and consider non-indian commercial fishing seasons for salmon, smelt and
OREGON AND WASHINGTON DEPARTMENTS OF FISH AND WILDLIFE JOINT STAFF REPORT: SUMMER FACT SHEET NO. 1 Columbia River Compact June 13, 2012
 OREGON AND WASHINGTON DEPARTMENTS OF FISH AND WILDLIFE JOINT STAFF REPORT: SUMMER FACT SHEET NO. 1 Columbia River Compact June 13, 2012 Fisheries under consideration: Non-Indian commercial salmon Treaty
Hook Selectivity in Gulf of Mexico Gray Triggerfish when using circle or J Hooks
 Hook Selectivity in Gulf of Mexico Gray Triggerfish when using circle or J Hooks Alisha M. Gray and Beverly Sauls SEDAR43- WP- 09 25 March 2015 This information is distributed solely for the purpose of
Agenda Item E.5.a Supplemental STT Report 1 April 2018 PRELIMINARY ANALYSIS OF TENTATIVE 2018 OCEAN SALMON FISHERY MANAGEMENT MEASURES
 Agenda Item E.5.a Supplemental STT Report 1 April 2018 PRELIMINARY ANALYSIS OF TENTATIVE 2018 OCEAN SALMON FISHERY MANAGEMENT MEASURES April 10, 2018 1 TABLE 1. 2018 Commercial troll management measures
Columbia River Salmon Harvest Sport and Commercial Sharing Facts and Relationships
 Columbia River Salmon Harvest Sport and Commercial Sharing Facts and Relationships Prepared by Robert Sudar Commercial Advisor Columbia River Fisheries Management Work Group Economic Value of Fish & Wildlife
Backgrounder and Frequently Asked Questions
 Backgrounder and Frequently Asked Questions Who Sent the Letter? The 60-day Notice of Intent to File Suit was sent by Conservation Angler, Wild Fish Conservancy, Snake River Waterkeeper, Friends of the
***Please Note*** April 3, Dear advisory committee members:
 April 3, 29 Dear advisory committee members: The fifth meeting of the CHF advisory committee will be held April 13 in Grants Pass from 6:-8:3 PM, and the purpose of this document is to help committee members
Salmonid Community of Lake Michigan: 2017 Fall Harbor Assessment
 Illinois Department of Natural Resources Division of Fisheries Salmonid Community of Lake Michigan: 2017 Fall Harbor Assessment Steven R. Robillard Illinois Department of Natural Resources - Lake Michigan
2016 Fraser River Stock Assessment and Fishery Summary Chinook, Coho and Chum
 2016 Fraser River Stock Assessment and Fishery Summary Chinook, Coho and Chum 1 Background and Stock Assessment 2 Fraser River Chinook - Background Diverse group of populations exhibit a wide range of
2016 Ocean Salmon and Terminal Area Fishery Regulations
 2016 Ocean Salmon and Terminal Area Fishery Regulations 2016 Ocean Salmon Regulations On May 1 ocean salmon regulations for federal waters (3-200 miles) began based on the seasons adopted by PFMC on April
Perspectives of a State Director Selective fisheries as a tool in fisheries management and salmon recovery
 Perspectives of a State Director Selective fisheries as a tool in fisheries management and salmon recovery Jeffrey P. Koenings, PhD. Washington Department of Fish and Wildlife American Fisheries Society
Correction to FRAM Algorithms for Modeling Size Limit Changes
 Agenda Item C.2.a Attachment 4 November 2013 Correction to FRAM Algorithms for Modeling Size Limit Changes Angelika Hagen-Breaux, Pete McHugh, James Packer Washington Department of Fish and Wildlife 600
SCDNR Charterboat Logbook Program Data,
 SCDNR Charterboat Logbook Program Data, 1993 2010 Mike Errigo, South Atlantic Fishery Management Council Eric Hiltz and Julia Byrd, South Carolina Department of Natural Resources SEDAR25-DW23 (replaces
Pacific Salmon Commission Technical Report No. 12
 A Comparison of Estimates of First Nations Catches of Fraser River Sockeye Salmon from 1996 to 1999 by Scale-based Discriminant Function Models and Run Reconstruction Models Jim Gable December, 2002 Pacific
Pacific Salmon Commission Technical Report No. 25
 An Action Plan in Response to Coded Wire Tag (CWT) Expert Panel Recommendations A Report of the Pacific Salmon Commission CWT Workgroup March 2008 Pacific Salmon Commission Technical Report No. 25 The
Overview of the Great Lakes Mass Marking Program
 Overview of the Great Lakes Mass Marking Program Charles R. Bronte U.S. Fish and Wildlife Service Great Lakes Fish Tag and Recovery Lab New Franken, Wisconsin, USA Lake Michigan Monitoring Coordination
THE FISHERY REGIME FOR SOUTHEAST ALASKA CHINOOK SALMON FISHERIES
 THE 1995-1 998 FISHERY REGIME FOR SOUTHEAST ALASKA CHINOOK SALMON FISHERIES By Jeffery P. Koenings, David Gaudet, Scott Marshall, and John E. Clark Regional Information Report No. 5J95-14 Alaska Department
Regional Information Report 5J
 Regional Information Report 5J.2016-06 Does the Queets Exploitation Rate Indicator Stock Represent the Distribution of Fishery Impacts of Washington Coastal Chinook Salmon Stocks in Pacific Salmon Treaty
South Coast Salmon Bulletin August 30, 2018 Assessment Update Barkley/Alberni (Area 23) Terminal Chinook
 Terminal Chinook") 1 South Coast Salmon Bulletin August 30, 2018 Assessment Update Barkley/Alberni (Area 23) Terminal Chinook Pre-season Expectations Somass/Robertson Creek Hatchery chinook: The forecast terminal return
1 South Coast Salmon Bulletin August 30, 2018 Assessment Update Barkley/Alberni (Area 23) Terminal Chinook Pre-season Expectations Somass/Robertson Creek Hatchery chinook: The forecast terminal return
GROUNDFISH MANAGEMENT TEAM REPORT ON CONSIDERATION OF INSEASON ADJUSTMENTS, INCLUDING CARRYOVER. Annual Vessel Limit (15.4%)
") Agenda Item I.3.a Supplemental GMT Report 2 March 2017 GROUNDFISH MANAGEMENT TEAM REPORT ON CONSIDERATION OF INSEASON ADJUSTMENTS, INCLUDING CARRYOVER The Groundfish Management Team (GMT) reviewed the
Agenda Item I.3.a Supplemental GMT Report 2 March 2017 GROUNDFISH MANAGEMENT TEAM REPORT ON CONSIDERATION OF INSEASON ADJUSTMENTS, INCLUDING CARRYOVER The Groundfish Management Team (GMT) reviewed the
Attachment 2 PETITIONERS
 Attachment 2 PETITION TO TEMPORARILY MODIFY FRESHWATER FISHERY REGULATIONS ADOPTED UNDER THE CONSERVATION PLAN FOR NATURALLY PRODUCED SPRING CHINOOK SALMON IN THE ROGUE RIVER (submitted September 26, 2017)
Groundfish Harvest Specifications and Management Measures. Tillamook August 6 Newport August 7 Brookings August 12 North Bend August 13
 2015-16 Groundfish Harvest Specifications and Management Measures Tillamook August 6 Newport August 7 Brookings August 12 North Bend August 13 1 (SSC) Scientific and Statistical Committee Groundfish Management
OREGON AND WASHINGTON DEPARTMENTS OF FISH AND WILDLIFE JOINT STAFF REPORT SUMMER FACT SHEET NO. 1 June 10, 2010
 OREGON AND WASHINGTON DEPARTMENTS OF FISH AND WILDLIFE JOINT STAFF REPORT SUMMER FACT SHEET NO. 1 June 10, 2010 Fisheries under consideration: Non-Indian commercial salmon STOCK STATUS Upper Columbia Summer
COLUMBIA RIVER SALMON AND STEELHEAD HARVEST 1980 TO by John McKern for The Columbia-Snake River Irrigators Association
 COLUMBIA RIVER SALMON AND STEELHEAD HARVEST 198 TO 26 by John McKern for The Columbia-Snake River Irrigators Association COLUMBIA RIVER SALMON AND STEELHEAD HARVEST 198 THROUGH 26 By John McKern FISH PASSAGE
Agenda Item Summary BACKGROUND. Public Involvement ISSUE ANALYSIS. Attachment 1
 Agenda Item Summary Attachment BACKGROUND Between 996 and 03 white sturgeon fisheries in the Columbia River downstream from Bonneville Dam were managed under a series of management accords between the
OREGON AND WASHINGTON DEPARTMENTS OF FISH AND WILDLIFE JOINT STAFF REPORT - WINTER FACT SHEET NO.
 OREGON AND WASHINGTON DEPARTMENTS OF FISH AND WILDLIFE JOINT STAFF REPORT - WINTER FACT SHEET NO. 3a Columbia River Compact/Joint State Hearing February 21, 2018 Fisheries under consideration: Mainstem
REVIEW OF 2017 OCEAN SALMON FISHERIES Stock Assessment and Fishery Evaluation Document for the Pacific Coast Salmon Fishery Management Plan
 REVIEW OF 2017 OCEAN SALMON FISHERIES Stock Assessment and Fishery Evaluation Document for the Pacific Coast Salmon Fishery Management Plan Pacific Fishery Management Council 7700 NE Ambassador Place,
Fisheries Off West Coast States; West Coast Salmon Fisheries; 2015 Management
 This document is scheduled to be published in the Federal Register on 05/05/2015 and available online at http://federalregister.gov/a/2015-10421, and on FDsys.gov BILLING CODE 3510-22-P DEPARTMENT OF COMMERCE
Press Release New Bilateral Agreement May 22, 2008
 Informational Report 3 June 2008 Press Release New Bilateral Agreement May 22, 2008 The Pacific Salmon Commission is pleased to announce that it has recommended a new bilateral agreement for the conservation
2018 Adult Returns and 2019 Expectations Columbia River Revised Draft December 12, 2018
 Willamette Spring 2018 Adult Returns and 2019 Expectations Columbia River Revised Draft December 12, 2018 2018 Results 2019 Expectations 53,820 predicted adult return to CR (20% wild) 37,441 actual adult
Life history characteristics of Snake River Fall Chinook salmon collected off the Oregon/Washington Coast
 Life history characteristics of Snake River Fall Chinook salmon collected off the Oregon/Washington Coast Brian Beckman, David Teel, Joe Fisher, Cheryl Morgan, Edmundo Casillas NOAA Fisheries, NWFSC Seattle,
ATLANTIC SALMON NEWFOUNDLAND AND LABRADOR, SALMON FISHING AREAS 1-14B. The Fisheries. Newfoundland Region Stock Status Report D2-01
 Fisheries Pêches and Oceans et Océans DFO Science Newfoundland Region Stock Status Report D2-01 ATLANTIC SALMON NEWFOUNDLAND AND LABRADOR, SALMON FISHING AREAS 1-14B Background There are 15 Atlantic salmon
Commercial Anchovy Fishery Public Meeting
 Commercial Anchovy Fishery Public Meeting February 15, 2017 Astoria, Oregon Cyreis Schmitt Troy Buell Maggie Sommer 1 Northern Anchovy Anchovy Ecology and Life History Federal and State Anchovy Management
Annual Pink Shrimp Review
 Annual Pink Shrimp Review Oregon Department of Fish and Wildlife ODFW Marine Region, Marine Science Dr., Bldg. #3, Newport, OR 97365 (53) 867-4741 TO: FROM: OREGON SHRIMP INDUSTRY BOB HANNAH, PINK SHRIMP
Agenda. Opening Comments and Review Agenda
 Agenda CALIFORNIA DEPARTMENT OF FISH AND GAME 2010 SALMON INFORMATION MEETING Sonoma County Water Agency 404 Aviation Boulevard Santa Rosa, California 95403 ~ Thursday, February 25, 2010 12:00 p.m. 3:00
PRESEASON REPORT II ANALYSIS OF PROPOSED REGULATORY OPTIONS FOR 2009 OCEAN SALMON FISHERIES
 PRESEASON REPORT II ANALYSIS OF PROPOSED REGULATORY OPTIONS FOR 2009 OCEAN SALMON FISHERIES Pacific Fishery Management Council 7700 NE Ambassador Place, Suite 101 Portland, OR 97220-1384 (503) 820-2280
Recreational Sturgeon Commercial Shad MANAGEMENT GUIDELINES
 OREGON AND WASHINGTON DEPARTMENTS OF FISH AND WILDLIFE JOINT STAFF REPORT - SUMMER FACT SHEET NO. 2 Columbia River Compact/Joint State Hearing June 28, 2005 Fisheries under consideration: Recreational
Michael Tehan, Assistant Regional Administrator, Interior Columbia Basin Office
 UNITED STATES DEPARTMENT OF COMMERCE National Oceanic and Atmospheric Administration NATIONAL MARINE FISHERIES SERVICE Northwest Fisheries Science Center Fish Ecology Division 2725 Montlake Boulevard East
NICOMEN SLOUGH/NORRISH CREEK RECREATIONAL FISHERY ASSESSMENT October 13 th to November 30 th, 2008
 POST SEASON SUMMARY - DRAFT Date: November 30 th, 2008 NICOMEN SLOUGH/NORRISH CREEK RECREATIONAL FISHERY ASSESSMENT October 13 th to November 30 th, 2008 Table 1 Nicomen Slough salmon retention limits
Juvenile Steelhead Distribution, Migration, Growth and Feeding in the Columbia River Estuary, Plume and Ocean Waters
 Juvenile Steelhead Distribution, Migration, Growth and Feeding in the Columbia River Estuary, Plume and Ocean Waters Elizabeth Daly (OSU) Richard Brodeur (NWFSC) Julie Scheurer (ARO) Laurie Weitkamp (NWFSC)
ALASKA DEPARTMENT OF FISH AND GAME DIVISION OF COMMERCIAL FISHERIES NEWS RELEASE
 ALASKA DEPARTMENT OF FISH AND GAME DIVISION OF COMMERCIAL FISHERIES NEWS RELEASE Sam Cotten, Commissioner Scott Kelley, Director Contact: Pat Shields, Area Management Biologist or Phone: (907) 262-9368
Modify Federal Regulations for Swordfish Trip Limits the Deep-set Tuna Longline Fishery. Decision Support Document November 2010
 Agenda Item J.2.a Attachment 2 November 2010 Modify Federal Regulations for Trip Limits the Deep-set Tuna Longline Fishery (Action Pursuant to Modification of Routine Management Measures under the Framework
Olympic National Park Fishing and Shellfish Regulations
 Olympic National Park Fishing and Shellfish Regulations Effective May 1, 2008 through April 30, 2009 Olympic National Park is managed as a natural area. The primary objectives of the fisheries management
PROPOSED INITIAL SALMON MANAGEMENT ALTERNATIVES FOR 2017 NON-INDIAN OCEAN FISHERIES
 Agenda Item E.3.b Supplemental SAS Report March 2017 SALMON ADVISORY SUBPANEL PROPOSED INITIAL SALMON MANAGEMENT ALTERNATIVES FOR 2017 NON-INDIAN OCEAN FISHERIES March 9, 2017 Page Intentionally Blank
Charter Boat Fishing in Lake Michigan: 2017 Illinois Reported Harvest
 Illinois Department of Natural Resources Division of Fisheries Charter Boat Fishing in Lake Michigan: 2017 Illinois Reported Harvest Steven R. Robillard Illinois Department of Natural Resources Lake Michigan
BOGUS CREEK SALMON STUDIES 2002
 BOGUS CREEK SALMON STUDIES 2002 BY: JEANNINE RICHEY California Department of Fish and Game KLAMATH RIVER PROJECT 303 SOUTH STREET YREKA, CALIFORNIA 96097 (530) 842-3109 California Department of Fish and
Susquehanna River Walleye Fishery
 Susquehanna River Walleye Fishery 2008 The Susquehanna River is the largest tributary to the Atlantic Ocean lying completely within the United States. It originates from the outlet of Otsego Lake in Cooperstown,
PRESEASON REPORT III COUNCIL ADOPTED MANAGEMENT MEASURES
 PRESEASON REPORT III COUNCIL ADOPTED MANAGEMENT MEASURES AND ENVIRONMENTAL ASSESSMENT PART 3 FOR 2018 OCEAN SALMON FISHERY REGULATIONS REGULATION IDENTIFIER NUMBER 0648-BH22 Pacific Fishery Management