Lower Sabine River Fishery Study
|
|
|
- Brittany Polly Garrison
- 5 years ago
- Views:
Transcription

1 Lower Sabine River Fishery Study Downstream Fisheries Resources Report BIO-WEST, Inc Central Commerce Court Round Rock, Texas April 11, 211
2 Contents CONTENTS... II LIST OF FIGURES... IV LIST OF TABLES... VI EXECUTIVE SUMMARY INTRODUCTION BACKGROUND AND PROJECT/STUDY AREA DESCRIPTION EXISTING FISHERIES INFORMATION AND HISTORICAL DATA GOALS AND OBJECTIVES METHODOLOGY SAMPLING SITES LARGE RIVER MONITORING AND ASSESSMENT (CRITICAL PERIOD SAMPLING) SEASONAL HABITAT UTILIZATION SAMPLING AMERICAN EEL SPECIES-SPECIFIC SAMPLING BLUE SUCKER SPECIES-SPECIFIC SAMPLING DATA MANAGEMENT AND ANALYSIS RESULTS LARGE RIVER MONITORING AND ASSESSMENT (CRITICAL PERIOD) RESULTS September July Critical Period Combined SEASONAL HABITAT UTILIZATION RESULTS Fall Spring Fall and Spring Combined AMERICAN EEL RESULTS Fish Community Sampling Species-Specific American Eel Sampling BLUE SUCKER RESULTS Fish Community Sampling Species-Specific sampling STUDY TOTALS DISCUSSION DIVERSITY AND SIMILARITY LONGITUDINAL TRENDS SEASONAL TRENDS COMPARISONS WITH HISTORIC DATA II
3 5.5 COMPARISONS WITH OTHER RIVERS SUMMARY LITERATURE CITED APPENDIX A. STUDY SITE MAPS... 5 APPENDIX B. LENGTH FREQUENCY ANALYSIS III
4 List of Figures Figure Map of study area showing upper five sites (RM RM 146SW) Figure Map of study area showing lower five sites (RM 64 - RM 12) Figure Eel ramp traps in tailrace (left) and spillway (right) Figure Continuous (15-minute interval) discharge data from the USGS gage (#826) on the Sabine River near Burkeville, Texas during September Figure Continuous (15-minute interval) discharge data from the USGS gage (#826) on the Sabine River near Burkeville, Texas during July 11-31, Figure Mean daily discharge at the Sabine River near Burkeville (USGS gage #826) during October 29 through January Figure Mean daily discharge at the Sabine River near Burkeville (USGS gage #826) during April Figure Length frequency histogram of American eels captured by electrofishing from the lower Sabine River Figure Total length (mm) of American eels captured from six sites on the lower Sabine River with electrofishing Figure Length frequency distribution of 84 blue suckers captured from the lower Sabine River during fish community sampling and Species-Specific sampling Figure Proportional representation of the ten most abundant species at ten sites on the lower Sabine River based on the combined Critical Period dataset Figure Percent relative composition of blacktail shiner, all cyprinids, and inland silverside versus river mile Figure Percent relative composition of bullhead minnow, weed shiner, Sabine shiner, and Mississippi silvery minnow versus river mile Figure Percent relative composition of fish families collected from the lower Sabine River using all sampling techniques Figure Percent relative composition of fish families collected from the lower Sabine River using seines Figure Percent relative composition of fish families collected from the lower five sites (RM 64 - RM 12) using seines IV
5 Figure Percent relative composition of cyprinid species and other fish captured from the lower five sites (RM 64 - RM 12) using seines V
6 List of Tables Table Details of each blue sucker sampling event from February - July Table Sampling effort at 1 sites on the lower Sabine River in September Table Number (#) and percent relative composition (%) of fishes captured from 1 sites on the lower Sabine River in September Table Sampling effort at 1 sites on the lower Sabine River in July Table Number (#) and percent relative composition (%) of fishes captured from 1 sites on the lower Sabine River in July Table Sampling effort at 1 sites on the lower Sabine River during Critical Period Sampling in September 29 and July Table Number (#) and percent relative composition (%) of fishes captured from 1 sites on the lower Sabine River during Critical Period Sampling in September 29 and July Table Fish sampling effort at five sites on the lower Sabine River in December Table Number (#) and percent relative composition (%) of fishes captured from five sites on the lower Sabine River during December Table Sampling effort at five sites on the lower Sabine River in April Table Number (#) and percent relative composition (%) of fishes captured from five sites on the lower Sabine River during April Table Sampling effort at five sites on the lower Sabine River during December 29 and April Table Number (#) and percent relative composition (%) of fishes captured from five sites on the lower Sabine River during December 29 and April Table Number of American eels captured with electrofishing during each of four fish community sampling events on the lower Sabine River Table Daytime boat electrofishing CPUE (eels/hr) of American eels captured at 1 sites on the lower Sabine River during each fish community sampling event Table Details of American eel captures from four ramp traps at Toledo Bend Dam in Table Number of blue suckers captured at ten sites on the lower Sabine River during each of four fish community sampling events VI
7 Table Daytime boat electrofishing CPUE (fish/hr) for blue suckers at 1 sites on the lower Sabine River during each fish community sampling event Table Number (#) and percent relative composition (%) of fishes captured from ten sites on the lower Sabine River during fish community sampling in 29 and 21. Sites SW (in gray) were sampled four times, whereas sites were sampled twice Table Fish species richness and Simpson's diversity index for ten sites on the lower Sabine River based on the combined Critical Period dataset Table Percent similarity of each site pair based on fish community data Table Fishes identified as increasing or decreasing in relative composition based on two studies of historical fish community data from the lower Sabine River VII
8 Executive Summary During 21 and 211, BIO-WEST, Inc. conducted fishery resource sampling on the lower Sabine River in support of the Toledo Bend Project (Project) Federal Energy Regulatory Commission (FERC) relicensing process. The goal of this report is to provide fisheries resource data to support further analysis of Project effects and Aquatic Life Use (ALU) attainment by the Aquatic Resource Working Group (ARWG). The three major components of this study, as outlined in the study plan, are Large River Monitoring and Assessment (Critical Period Sampling), Seasonal Habitat Utilization Sampling, and Species-Specific Sampling for two species of interest, American eel Anguilla rostrata and blue sucker Cycleptus elongatus. Detailed methods for each component are provided and results are summarized by event, by event type (Critical Period, Seasonal, or Species-Specific), as well as overall. Results are examined both longitudinally and seasonally, and compared to recent studies examining historical data collected from the lower Sabine River, as well as data collected from other systems. When comparing between sampling periods, it is important to note that sampling conditions were quite variable over the study. In fact, differences in results between sampling periods are likely influenced more by hydrologic conditions than by seasonal changes in the fish community. For example, the December 29 sample was conducted during a brief period of reduced flows following intense flooding in the lower basin. Several unique species and a high abundance of reservoir inhabitants (silversides, shad) were noted in this sample when compared to other samples. In this case, changes are more likely linked to the recent flooding than to seasonal changes in the fish community. No regional CPUE data was available, but based on recent experience from other Texas rivers, a relatively substantial population of blue suckers occurs in the lower Sabine River. Blue suckers were distributed throughout the river wherever suitable habitat (swift water over bedrock or large woody debris) exists. However, they were most abundant in the reach from River Mile (RM) 141 at the Tailrace (TR) downstream to RM 132, where this habitat type was most common. Although no young-of-the-year were collected, the size distribution observed suggests multiple year classes are present. Using various age and growth relationships provided in the literature, the smallest blue sucker observed (31 millimeters [mm] Total Length [TL]) was approximately age-ii through age-iv and was most likely not sexually mature. In 21, blue suckers in the lower Sabine River probably spawned in early April. Although spawning was not witnessed, it most likely occurred at the bedrock riffle at RM 139, the sharp bend immediately above the bridge at RM 132, and several other potential locations with suitable habitat in the reach between these two sites. Although extensive use of ramp traps and eel pots were employed, electrofishing was the most successful method of sampling American eels. American eels were documented downstream to RM 15, but were most common immediately below Toledo Bend Dam at the spillway (RM 146SW) and tailrace (RM 141TR). A wide variety of sizes were collected suggesting multiple year classes are present in the lower Sabine River. American eels are habitat generalists and were captured from a variety of habitat types. Ten eels were captured in the custom-designed ramp traps. Four were captured from the tailrace (RM 141TR) during June 21, and six were captured from the spillway (RM 146SW) during September 21. American eels captured in ramp traps were in general smaller than those captured via electrofishing. It 1
9 should be noted that the highest abundance of American eels captured in ramp traps (albeit only 6 individuals) occurred in September 21, and the highest abundance of eels captured via electrofishing occurred in September 29. Longitudinal trends in presence and abundance of other taxa are evident. Based on apparent longitudinal trends in the fisheries data, the study area was grouped into four segments to assess factors that might explain changes in community composition. Due to unique flow conditions which separate it from the main river, the spillway channel (RM 146SW and RM 143) functions similar to a large tributary, and has a rather distinct assemblage. From the man-made tailrace channel (RM 141TR) downstream to RM 132, inland silversides Menidia beryllina are a major component of the assemblage and relative composition of cyprinids was relatively low. Although a gradient of decreasing abundance of inland silversides and increasing abundance of blacktail shiners Cyprinella venusta does exist in the above reach, a sharp change was noted between RM 132 and RM 12. From RM 12 downstream to RM 9, relative composition of cyprinids (mainly blacktail shiner) was much higher, and abundance of inland silverside was low. Moving further downstream within this reach, other cyprinids such as Sabine shiner, bullhead minnow, and weed shiner become more abundant. An increase in overall contribution of other cyprinids, and a decrease in dominance of blacktail shiner are noted between RM 9 and RM 72. At the lower two sites (RM 72 and RM 64), relative composition of blacktail shiner continues to decrease as other cyprinids become more abundant, resulting in an increase in diversity. Longitudinal trends in community composition are likely attributable to several factors. Clearly, the influence of the reservoir fishery was evident within the man-made tailrace channel (RM 141TR). At the tailrace site along with other locations, habitat conditions likely play a role in observed longitudinal trends. RM 146SW and RM 143 maintain unique tributary-like habitat conditions. RM 139 to RM 132 maintains a steeper gradient and accompanying constricted channel and coarser substrate conditions relative to RM 146SW or RM 143 or downstream sites. RM 132 to RM 12 and downstream to RM 9 support a somewhat wider channel dominated by shifting sand bars and intermittent large woody debris. The downstream most sites (RM 72 and RM 64) exhibit similar channel size and sand bar habitats as experienced in the immediate upstream stretch but with more frequent and deeper pool habitats. Tributaries within the study area (although not sampled in this study) also likely influence the longitudinal community composition trends observed. Conclusions based on historical data comparisons need to be carefully interpreted as different collection techniques and different sampling locations can greatly bias such an assessment. Upon careful evaluation and interpretation, comparison of data collected in this study with historical datasets show an overall decline in the relative composition of Cyprinidae (minnows), and an increase in relative composition of Atherinopsidae (silversides). Similar trends have been witnessed by other researchers in the region (Anderson et al. 1995). Although changes to the community composition have occurred over time, the study area currently supports a diverse fish assemblage, with 23 families and 75 species documented during this study. 2
10 1 Introduction 1.1 Background and Project/Study Area Description The Toledo Bend Project (Project) is currently seeking relicensing through FERC s Integrated Licensing Process (ILP). As part of the ILP (FERC Project No. 235), the Lower Sabine River Water Quality and Aquatic Resources Study Plan was developed to provide data and analysis necessary to support the relicensing process. This report summarizes Downstream Fishery Resource Sampling as outlined in Attachment B of the above study plan. The lower Sabine River aquatic resources study area includes the immediate tailrace, spillway channel (RM ), and lower Sabine River downstream to Shoats Creek (RM 54). Shoats Creek at RM 54 was selected as the downstream limit to the study area based on the following information: 1. Phillips (28) documents a major geomorphological and hydrologic/hydraulic transition in this vicinity of Shoats Creek (Reach 4 to Reach 5) including the following characteristics: a. Channel and valley geomorphology change dramatically as the floodplain widens and the dominant convergent tributary pattern begins to shift to a divergent network of distributary channels at moderate to high flows that connect to flood plain sloughs, yazoos, or oxbows. b. Geomorphic control shifts from neotectonic activity to coastal plain paleogeography. Point bars become fewer in number and finer grained with a notable increase in channel sinuosity. c. Hydraulic attenuation of daily peaking flows is nearly complete with only minor influence from Project operation, even in low flow periods. d. Coastal marine effects and landforms begin to appear at this location. 2. Biologically, aquatic communities begin to shift from inland to estuarine. 3. The Shoats Creek area is the approximate upstream limit of severe damage from Hurricane Rita. 1.2 Existing Fisheries Information and Historical Data Historical fish collections from the lower Sabine River have been conducted by a variety of collectors (e.g., university researchers, state agencies) with differing goals and methodologies. These data have been summarized and analyzed in two recent studies (Bart 28, Bonner 27). Additionally, the Pre- Application Document (PAD) submitted as part of the Toledo Bend Relicensing Process summarized data from both of the above studies, as well as more recent baseline fish collections from the ongoing Texas Instream Flow Program (TIFP) instream flow study and other minor sources. Besides the TIFP study, recent fish community data on the lower Sabine River is sparse. Therefore, this study was developed to provide a current snapshot of the fish community composition in the lower Sabine 3
11 River study area, as well as to provide current data on the upper portion of the study area where few recent collections have been made. 2 Goals and Objectives Fish community data collected as part of the Lower Sabine River Water Quality and Aquatic Resources Study Plan are designed to accomplish two primary goals. First, the study will provide data with which to evaluate the Project s compliance with the current Texas Commission on Environmental Quality (TCEQ) Aquatic Life Use Subcategory classification of High for the study area (Toledo Bend Dam to Shoats Creek RM 147 to 54) and Louisiana Department of Environmental Quality (LDEQ) state wide aquatic life narrative criteria. Second, this study will provide data suitable for identifying potential aquatic life enhancement opportunities in the study area. The purpose of this report is not to assess Aquatic Life Use, nor to identify enhancement opportunities. Rather, this report will provide the data necessary to accomplish these ultimate goals. The objective of this report is to present trends in fish community data that can then be analyzed further along with other data collected during the relicensing process (e.g., level-logger data, water quality sonde deployment data, Project operational data) to further assess potential Project effects. If Project operational effects are identified, the assessment of causes and enhancement potential will be performed under subsequent studies. The Aquatic Resource Working Group will review data collected and analyzed in year one studies to evaluate potential Project effects on aquatic communities and make recommendations for additional field study modifications to investigate specific Project effects and identify potential enhancement measures. 3 Methodology 3.1 Sampling Sites As outlined in the study plan, Downstream Fishery Resource Sampling consisted of three major components: Large River Monitoring and Assessment (see section 3.2), Seasonal Habitat Utilization Sampling (3.3), and Species-Specific Monitoring for American eel (3.4) and blue sucker (3.5). Large River Monitoring and Assessment was to be conducted at 1 sites on the lower river which were predetermined based on consultation with state resource agencies (RM 64, 72, 9, 15, 12, 132, 139, 141TR, 143, 146SW). Seasonal Habitat Utilization sampling was to be conducted at the upper five sites (RM 132, 139, 141TR, 143, 146SW). Species-Specific sampling for American eels was focused immediately below the dam at RM 141TR (Tailrace) and RM 146SW (Spillway), whereas Species- Specific sampling for blue sucker occurred throughout the river. Maps of the study area are provided in Figure and Figure Prior to initiation of fish sampling, a reconnaissance trip was conducted on September 14-15, 29. The purpose of this trip was to familiarize BIO-WEST fisheries biologists with the system so that an efficient sampling strategy could be developed, and also to delineate boundaries of sampling sites. On September 14, Sabine River Authority (SRA) personnel gave a tour of access points near the dam and led a boat reconnaissance of the area immediately below the dam in the tailrace and spillway channels (RM 141TR- RM 146SW). The following day, a boat reconnaissance was conducted from RM 139 downstream to the 4
12 lowermost sampling location at RM 64. During this reconnaissance trip, general boundaries of each sampling site were established and biologists were familiarized with the nearest access points and general habitat conditions at each sampling site. 5

13 Figure Map of study area showing upper five sites (RM RM 146SW). 6

14 Figure Map of study area showing lower five sites (RM 64 - RM 12). 7
15 3.2 Large River Monitoring and Assessment (Critical Period Sampling) As outlined in the study plan, Large River Monitoring and Assessment (Critical Period Sampling) was conducted at ten sites (RM 64, 72, 9, 15, 12, 132, 139, 141TR, 143, and 146SW) during the summer critical period (July 1-September 3) of 29 and 21. In 29, sampling was conducted during September In 21, sampling was conducted from July 9-13 and July Maps of each study site with exact fish collection locations are presented in the Appendix. Data collected during these two sampling events were used to calculate a Project Specific Index of Biotic Integrity (IBI). Therefore, sampling was conducted according to established Texas Parks and Wildlife Department (TPWD)/TCEQ fish sampling protocols designed for calculation of IBIs in wadeable streams, yet modified for sampling large rivers. This protocol required at least ten seine hauls and at least 9 seconds of electrofishing at each site. If the tenth seine haul contained a new species for that site and date, then seining continued until no new species were captured. As stated in the protocol, results of each seine haul or electrofishing event were recorded separately, and water depth, velocity, and dominant substrate were measured at each location. Additionally, a digital photograph, GPS waypoint, and standard water quality parameters (temperature, ph, dissolved oxygen, and conductivity) were recorded at each sample location. Electrofishing was conducted at each site with a Smith-Root 5. Generator Powered Pulsator (GPP) electrofisher mounted on a 15-foot aluminum jon boat with retractable boom. Standard boat electrofishing was conducted at 6 pulses-per-second (pps). In shallow riffle areas (RM 146SW, 141TR, and 139), barge-style electrofishing into a block seine was conducted. To sample areas too deep for seining or electrofishing, two variable-mesh gill nets (1, 1.5, 2, 2.5, and 3 mesh panels) and one hoop net were set overnight at sites where deep pool habitat was present. Based on comments from Louisiana Department of Wildlife and Fisheries (LDWF) personnel in April 21, a large mesh (4-6 mesh) gill net was used in place of one variable-mesh net during July 21 to target paddlefish and other large species. Several predetermined sites (RM 146SW, 143, 141TR, 132, 15, and 9) were sampled with night electrofishing to assess diurnal shifts in species composition and catch rates. At least 6 seconds of night electrofishing were conducted at each site, except at RM 15 during September 29 where only 42 seconds of electrofishing were conducted due to thunderstorms in the area. Only one modification was made to the FERC-approved study plan. In an attempt to catch catfish, which seemed to be underrepresented in standard electrofishing, low-frequency electrofishing (15 pps) was also conducted at some locations. Low-frequency electrofishing was used to specifically target catfish in deep pool areas. Data from gill nets, hoop nets, night electrofishing, and low-frequency electrofishing were used only to assess overall community composition, and were not included in IBI calculations. 3.3 Seasonal Habitat Utilization Sampling Seasonal Habitat Utilization Sampling was conducted at the upper five sites (RM 132, 139, 141TR, 143, and 146SW) during Fall 29 (Dec ) and Spring 21 (April 12-16) using a similar methodology as that described for Critical Period Sampling in section 3.1. Maps of each study site along with exact fish collection locations are presented in the Appendix. However, several minor modifications were made to the sampling strategy. Hoop nets were excluded from both fall and spring sampling due to limited success with this gear type in Critical Period Sampling during September 29. During December 29, 8


16 barge electrofishing was only conducted at RM 146SW due to higher flow conditions which inundated riffle areas at RM 141TR and RM 139. However, barge electrofishing was conducted at all three of the above sites in April 21. Due to time limitations, low-frequency electrofishing was not conducted in December 29, but was conducted in April 21 at all five sites. As in Critical Period Sampling, detailed habitat measurements were taken at each collection location. Results of each seine haul or electrofishing event were recorded separately, and water depth, velocity, and dominant substrate were measured at each location. Additionally, a digital photograph, GPS waypoint, and standard water quality parameters were recorded at each sample location. These data were collected to investigate seasonal patterns in habitat use. 3.4 American Eel Species-Specific Sampling In addition to the fish community sampling described in the previous sections (3.2 and 3.3), monthly Species-Specific sampling targeting American eel in the spillway (RM 146SW) and tailrace (RM 141TR) was initiated in February 21. The goal of this sampling was to determine if concentrations of American eel occur below Toledo Bend Dam, and to elucidate any seasonal migration patterns. Each of these trips involved monitoring of custom-designed eel ramp traps and deployment of baited eel pots for three consecutive nights per month, as agreed upon during the FERC ILP study scoping process with participating stakeholders. Prior to the first monthly trip, four eel ramp traps were installed immediately below Toledo Bend Dam (2 in the tailrace channel, and 2 in the spillway channel). Figure shows a picture of one ramp in each channel. Based on the initial study plan, eel ramps were turned on and monitored for three consecutive nights per month. In addition, three gee-style eel pots were baited and deployed for three nights in each channel. Monthly American eel sampling was conducted for one full year. Figure Eel ramp traps in tailrace (left) and spillway (right). Monthly American eel sampling was conducted according to the above protocol from February through July 21. In early August 21, an interim data update report was submitted summarizing the first six months of monthly eel sampling. During an ARWG conference call following the interim report, resource agency personnel expressed concern that the low catch rate observed during the first six months may be a result of insufficient effort. Therefore, the decision was made to change from the previous protocol of operating ramp traps for three consecutive nights per month to a more intensive effort of 9
17 continuous ramp trap operation. Ramp traps were to be left on continuously for the remainder of the study, and checked by SRA personnel every 3-4 days. To be consistent, the previously conducted monthly monitoring for three consecutive nights, as well as monthly deployment of baited eel pots for three consecutive nights continued through January 211. American eel sampling results are summarized in section Blue Sucker Species-Specific Sampling Although blue suckers were captured during both Critical Period and Seasonal Habitat Utilization Sampling, additional Species-Specific sampling for blue suckers was conducted to identify location and timing of spawning for adult blue suckers and to assess habitat utilization by juvenile blue suckers. A variety of methods were used throughout early-spring to early-summer 21 to gather data on spawning and juvenile blue suckers. These included: visual searches for spawning blue suckers at potential spawning riffles (flow dependent), boat and barge electrofishing to search for congregations of adult blue suckers, and seining targeted at larval and juvenile blue suckers. Details of each sampling event are provided in Table Table Details of each blue sucker sampling event from February - July 21. Date Methods Approximate Discharge Areas Sampled Water Temperature February 25-27, 21 Visual search 8, cfs Spillway (RM 146SW) C March 22-25, 21 Boat electrofishing 15,8 cfs Spillway (RM 146SW), Tailrace (RM 141TR), RM 139 riffle, Toro Bayou, Sixmile loop (RM ) C April 12-16, 21 Boat electrofishing, barge electrofishing, seining, and gill netting during spring sampling 65 cfs RM 132, RM 139, Tailrace (RM 141TR), RM 143, Spillway (RM 146SW) C May 1-13, 21 Boat electrofishing, barge electrofishing, and seining 449-6,76 cfs RM 12-15, RM C June 9-1, 21 Boat electrofishing and seining 1,21-7,96 cfs RM , RM N/A July 9-13 and 18-21, 21 Boat electrofishing, barge electrofishing, seining, gill netting, and hoop netting during Critical Period sampling 47-9,14 cfs RM 64, RM 72, RM 9, RM 15, RM 12, RM 132, RM139, Tailrace (RM 141TR), RM 143, Spillway (RM 146SW) C In addition to Critical Period and Seasonal Habitat Utilization Sampling, over 7, seconds of additional electrofishing effort and dozens of seine hauls were conducted during Species-Specific blue sucker sampling. The majority of this effort was focused on potential spawning locations (deep riffle habitat or fast runs over woody debris at RM 141TR, RM 146SW, RM 139, and RM 132) in the upper portion of the study area during the early spring months (February April). However, sampling for juvenile blue suckers occurred throughout the study area in the late-spring and early-summer months (May July). Blue sucker sampling results are summarized in section
18 3.6 Data Management and Analysis Data were transferred from waterproof field data sheets into a Microsoft Excel database, and were checked for accuracy (QA/QC) by a second biologist. Once QA/QC procedures were complete, pivot tables were used to generate tables of abundance and relative composition per site per sampling event. Results are presented below in several different formats to allow easy manipulation of data for further analyses of Project effects. First, data from each Critical Period Sampling event are presented separately (4.1.1 and 4.1.2), and are then combined (4.1.3). Second, data from each Seasonal Habitat Utilization Sampling event are presented separately (4.2.1 and 4.2.2), and are then presented combined (4.2.3). Next, American eel (4.3) and blue sucker (4.4) data are summarized. Finally, study totals are presented in section 4.5. Datasets used in each analysis were carefully selected based on the goals of the analysis. For example, when analyzing longitudinal trends in distribution and abundance of species the combined Critical Period dataset was used. When analyzing seasonal trends, data from Seasonal Habitat Utilization Sampling in December 29 and April 21 were combined with data from the same five sites collected during Critical Period Sampling in September 29 and July 21. When comparing data from the current study to previously collected data, the entire (study totals) dataset was used. 4 Results 4.1 Large River Monitoring and Assessment (Critical Period) Results September 29 The first Critical Period Sampling event was conducted from September 21-3, 29. Hydropeaking from both units had ceased approximately two weeks prior to this sampling event due to low water levels in the reservoir. However, occasional generation from one unit continued throughout the sampling period. Mean daily discharge conditions for the Sabine River near Burkeville (United States Geological Survey [USGS] gage #826) during September 29 are presented in Figure
19 Instantaneous Discharge (cfs) Downstream Fisheries Resources Report Date Figure Continuous (15-minute interval) discharge data from the USGS gage (#826) on the Sabine River near Burkeville, Texas during September 29. In September 29, 17 seine hauls, over 5.5 hours of electrofishing, and 21 net nights were conducted. Site-specific effort is detailed in Table Table Sampling effort at 1 sites on the lower Sabine River in September 29. Event Site Seining Electrofishing (minutes) Gill Nets Hoop Net Month River Mile # Hauls Boat Barge Low Freq Night # Net Nights # Net Nights September SW September September TR September September September September September September September TOTAL Overall, sampling during September 29 resulted in capture of 11,923 fishes representing 19 families and 61 species (Table 4.1-2). Per site catch varied from 526 individuals at RM 72 to over 2, individuals at RM 143. Abundant species included blacktail shiner (43% of all fishes captured), inland silverside (12%), longear sunfish Lepomis megalotis (8%), weed shiner Notropis texanus (7%), and threadfin shad Dorosoma petenense (6%). Although effort varied among sites, species richness ranged from 22 species at RM 12 to 43 species at RM
20 Several species exhibited strong site affiliations. For example, golden topminnow Fundulus chrysotus, yellow bullhead Ameiurus natalis, and dollar sunfish Lepomis marginatus were only captured at RM 146SW. These species are commonly associated with still, swampy backwaters containing abundant aquatic vegetation. The area immediately below the spillway at RM 146SW was rather unique due to the abundance of aquatic macrophytes. Other species typically associated with such habitat were found in their highest abundance here, including: banded pygmy sunfish Elassoma zonatum, redspotted sunfish Lepomis miniatus, and cypress darter Etheostoma proeliare. The fish assemblage at RM 141TR was dominated by threadfin shad (56% relative composition). This species was uncommon at other sites, and their abundance at this site may be a result of passage through the dam. Several other reservoir inhabitants were common here, including: white bass Morone chrysops, striped bass Morone saxatilis, yellow bass Morone mississippiensis, and inland silverside. This site also exhibited the highest number of the state-threatened blue sucker Cycleptus elongatus collected during September 29. Additionally, RM 141TR was the only site in which no cyprinid species were captured during September 29. A large number of harlequin darters Etheostoma histrio and dusky darters Percina sciera were captured at RM 139, due to the presence of a shallow bedrock riffle at this location. The deeper portions of this riffle also provide habitat for the state-threatened blue sucker, and 7 blue suckers were collected here. Mississippi silvery minnows Hybognathus nuchalis, Sabine shiners Notropis sabinae, and ribbon shiners Lythrurus fumeus were most abundant in the downstream portions of the study area (RM 64-12) where sand bar habitats are more common. Twenty-three American eels Anguilla rostrata were captured ranging in size from 165 to 64 mm total length in September 29. American eels were most abundant in the upstream portions of the study area, with the highest abundance occurring at RM 146SW (11 eels) and RM 141TR (7 eels). Three eels were also captured at RM 143, and two eels were captured at RM
21 Table Number (#) and percent relative composition (%) of fishes captured from 1 sites on the lower Sabine River in September 29. Family Scientific name Common name TR SW Total # % # % # % # % # % # % # % # % # % # % # % Lepisosteidae Lepisosteus oculatus Spotted gar Lepisosteus osseus Longnose gar Amiidae Amia calva Bowfin Anguillidae Anguilla rostrata American eel Clupeidae Alosa chrysochloris Skipjack herring Dorosoma cepedianum Gizzard shad Dorosoma petenense Threadfin shad Cyprinidae Cyprinella venusta Blacktail shiner Cyprinus carpio Common carp Hybognathus nuchalis Mississippi silvery minnow Lythrurus fumeus Ribbon shiner Lythrurus umbratilis Redfin shiner Notemigonus crysoleucas Golden shiner Notropis sabinae Sabine shiner Notropis texanus Weed shiner Notropis volucellus Mimic shiner Opsopoeodus emiliae Pugnose minnow Pimephales vigilax Bullhead minnow Catostomidae Carpiodes carpio River carpsucker Cycleptus elongatus Blue sucker Ictiobus bubalus Smallmouth buffalo Minytrema melanops Spotted sucker Moxostoma poecilurum Blacktail redhorse Ictaluridae Ameiurus natalis Yellow bullhead Ictalurus furcatus Blue catfish Ictalurus punctatus Channel catfish Noturus gyrinus Tadpole madtom Noturus nocturnus Freckled madtom Pylodictis olivaris Flathead catfish Aphredoderidae Aphredoderus sayanus Pirate perch Mugilidae Mugil cephalus Striped mullet Atherinopsidae Labidesthes sicculus Brook silverside Menidia beryllina Inland silverside Belonidae Strongylura marina Atlantic needlefish Fundulidae Fundulus chrysotus Golden topminnow Fundulus notatus Blackstripe topminnow Fundulus olivaceus Blackspotted topminnow Poeciliidae Gambusia affinis Western mosquitofish Moronidae Morone chrysops White bass Morone mississippiensis Yellow bass Morone saxatilis Striped bass Centrarchidae Lepomis auritus Redbreast sunfish Lepomis gulosus Warmouth Lepomis macrochirus Bluegill Lepomis marginatus Dollar sunfish Lepomis megalotis Longear sunfish Lepomis microlophus Redear sunfish Lepomis miniatus Redspotted sunfish Micropterus punctulatus Spotted bass Micropterus salmoides Largemouth bass Pomoxis annularis White crappie Pomoxis nigromaculatus Black crappie Percidae Ammocrypta vivax Scaly sand darter Etheostoma chlorosoma Bluntnose darter Etheostoma histrio Harlequin darter Etheostoma proeliare Cypress darter Percina macrolepida Bigscale logperch Percina sciera Dusky darter Sciaenidae Aplodinotus grunniens Freshwater drum Elassomatidae Elassoma zonatum Banded pygmy sunfish Achiridae Trinectes maculatus fasciatus Hogchoker Total Individuals Number of Species
22 Instantaneous Discharge (cfs) Downstream Fisheries Resources Report July 21 The goal of the second Critical Period Sampling event was to sample under low-flow conditions in between normal hydropeaking operations. Therefore, sampling was scheduled to coincide with lowflows resulting from cessation of hydropeaking on the weekends. As a result, sampling was split into two trips (July 9-13 and July 18-21, 21) with five to six days of hydropeaking occurring immediately prior to both sampling events. This resulted in slightly higher flows at some sites when compared to the first Critical Period Sampling event in September 29. Mean daily discharge conditions for the Sabine River near Burkeville (USGS gage #826) during July 21 are presented in Figure Date/Time Figure Continuous (15-minute interval) discharge data from the USGS gage (#826) on the Sabine River near Burkeville, Texas during July 11-31, 21. During July 21, 14 seine hauls, over 4.4 hours of electrofishing, and 24 net nights were conducted. Site-specific effort is detailed in Table
23 Table Sampling effort at 1 sites on the lower Sabine River in July 21. Event Site Seining Electrofishing (minutes) Gill Nets Hoop Net Month River Mile # Hauls Boat Barge Low Freq Night # Net Nights # Net Nights July SW July July TR July July July July July July July TOTAL Critical Period Sampling in July 21 resulted in capture of 8,982 fishes representing 22 families and 61 species (Table 4.1-4). Per site catch varied from 32 individuals at RM 72 to 1,493 individuals at RM 141TR. Although effort varied slightly among sites, per site species richness ranged from 22 species at RM 72 to 37 species at RM 146SW. The most abundant species included blacktail shiner (29% of all fish collected), inland silverside (21%), weed shiner (1%), bluegill Lepomis macrochirus (7%), and longear sunfish (5%). Other notable captures included 18 blue suckers and 1 American eels. Blue suckers were captured at five different sites stretching from RM 9 to RM 146SW in July. American eels were captured at RM 12 (1 eel), RM 139 (1 eel), and RM 146SW (8 eels). Five species captured in July 21 were not captured during Critical Period Sampling in September 29. One adult paddlefish Polyodon spathula was collected in a gill net at RM 141TR. Four orangespotted sunfish Lepomis humilis were captured using seines and boat electrofishing (3 at RM 15 and 1 at RM 12). Seven shoal chubs Macrhybopsis hyostoma were captured at RM 15. Three redfin pickerel Esox americanus were also captured (one each at RM 15, RM 12, and RM 141TR). Lastly, one ladyfish Elops saurus was collected while boat electrofishing at RM 143. The first four species (paddlefish, orangespotted sunfish, shoal chub, and redfin pickerel) most likely represent rare species in the system which were simply absent in September collections, while the ladyfish is an estuarine species which occasionally migrates upstream into freshwater rivers. 16
24 Table Number (#) and percent relative composition (%) of fishes captured from 1 sites on the lower Sabine River in July 21. Family Scientific Name Common Name TR SW Total # % # % # % # % # % # % # % # % # % # % # % Polyodontidae Polyodon spathula Paddlefish Lepisosteidae Lepisosteus oculatus Spotted gar Lepisosteus osseus Longnose gar Amiidae Amia calva Bowfin Elopidae Elops saurus Ladyfish Anguillidae Anguilla rostrata American eel Clupeidae Alosa chrysochloris Skipjack herring Dorosoma cepedianum Gizzard shad Dorosoma petenense Threadfin shad Cyprinidae Cyprinella venusta Blacktail shiner Cyprinus carpio Common carp Hybognathus nuchalis Mississippi silvery minnow Lythrurus fumeus Ribbon shiner Macrhybopsis hyostoma Shoal chub Notemigonus crysoleucas Golden shiner Notropis sabinae Sabine shiner Notropis texanus Weed shiner Notropis volucellus Mimic shiner Opsopoeodus emiliae Pugnose minnow Pimephales vigilax Bullhead minnow Catostomidae Carpiodes carpio River carpsucker Cycleptus elongatus Blue sucker Ictiobus bubalus Smallmouth buffalo Minytrema melanops Spotted sucker Moxostoma poecilurum Blacktail redhorse Ictaluridae Ameiurus natalis Yellow bullhead Ictalurus furcatus Blue catfish Ictalurus punctatus Channel catfish Pylodictis olivaris Flathead catfish Esocidae Esox americanus Redfin pickerel Aphredoderidae Aphredoderus sayanus Pirate perch Mugilidae Mugil cephalus Striped mullet Atherinopsidae Labidesthes sicculus Brook silverside Menidia beryllina Inland silverside Belonidae Strongylura marina Atlantic needlefish Fundulidae Fundulus chrysotus Golden topminnow Fundulus notatus Blackstripe topminnow Fundulus olivaceus Blackspotted topminnow Poeciliidae Gambusia affinis Western mosquitofish Moronidae Morone chrysops White bass Morone mississippiensis Yellow bass Morone saxatilis Striped bass Centrarchidae Lepomis auritus Redbreast sunfish Lepomis gulosus Warmouth Lepomis humilis Orangespotted sunfish Lepomis macrochirus Bluegill Lepomis marginatus Dollar sunfish Lepomis megalotis Longear sunfish Lepomis microlophus Redear sunfish Lepomis miniatus Redspotted sunfish Micropterus punctulatus Spotted bass Micropterus salmoides Largemouth bass Pomoxis nigromaculatus Black crappie Percidae Ammocrypta vivax Scaly sand darter Etheostoma chlorosoma Bluntnose darter Etheostoma histrio Harlequin darter Etheostoma proeliare Cypress darter Percina sciera Dusky darter Sciaenidae Aplodinotus grunniens Freshwater drum Elassomatidae Elassoma zonatum Banded pygmy sunfish Achiridae Trinectes maculatus fasciatus Hogchoker Total Individuals Number of Species
25 4.1.3 Critical Period Combined In order to provide a more robust dataset for further analysis, data from Critical Period Sampling in September 29 and July 21 were combined. This combined dataset is comprised of 211 seine hauls, approximately 1 hours of electrofishing, and 45 net nights (Table 4.1-5). Table Sampling effort at 1 sites on the lower Sabine River during Critical Period Sampling in September 29 and July 21. Event Site Seining Electrofishing (minutes) Gill Nets Hoop Net Month River Mile # Hauls Boat Barge Low Freq Night # Net Nights # Net Nights September SW September September TR September September September September September September September July SW July July TR July July July July July July July TOTAL Overall, Critical Period Sampling resulted in capture of 2,95 fishes representing 22 families and 66 species (Table 4.1-6). Per site catch varied from 846 individuals at RM 72 to 3,29 individuals at RM 139. Although effort varied among sites, per site species richness ranged from 29 at RM 72 to 47 at RM 143. The most abundant species included blacktail shiner (36.9% of all fish captured), inland silverside (15.9%), weed shiner (8.%), longear sunfish (6.8%), and bluegill (5.3%). 18
26 Table Number (#) and percent relative composition (%) of fishes captured from 1 sites on the lower Sabine River during Critical Period Sampling in September 29 and July 21. Family Scientific name Common name TR SW Total # % # % # % # % # % # % # % # % # % # % # % Polyodontidae Polyodon spathula Paddlefish Lepisosteidae Lepisosteus oculatus Spotted gar Lepisosteus osseus Longnose gar Amiidae Amia calva Bowfin Elopidae Elops saurus Ladyfish Anguillidae Anguilla rostrata American eel Clupeidae Alosa chrysochloris Skipjack herring Dorosoma cepedianum Gizzard shad Dorosoma petenense Threadfin shad Cyprinidae Cyprinella venusta Blacktail shiner Cyprinus carpio Common carp Hybognathus nuchalis Mississippi silvery minnow Lythrurus fumeus Ribbon shiner Lythrurus umbratilis Redfin shiner Macrhybopsis hyostoma Shoal chub Notemigonus crysoleucas Golden shiner Notropis sabinae Sabine shiner Notropis texanus Weed shiner Notropis volucellus Mimic shiner Opsopoeodus emiliae Pugnose minnow Pimephales vigilax Bullhead minnow Catostomidae Carpiodes carpio River carpsucker Cycleptus elongatus Blue sucker Ictiobus bubalus Smallmouth buffalo Minytrema melanops Spotted sucker Moxostoma poecilurum Blacktail redhorse Ictaluridae Ameiurus natalis Yellow bullhead Ictalurus furcatus Blue catfish Ictalurus punctatus Channel catfish Noturus gyrinus Tadpole madtom Noturus nocturnus Freckled madtom Pylodictis olivaris Flathead catfish Esocidae Esox americanus Redfin pickerel Aphredoderidae Aphredoderus sayanus Pirate perch Mugilidae Mugil cephalus Striped mullet Atherinopsidae Labidesthes sicculus Brook silverside Menidia beryllina Inland silverside Belonidae Strongylura marina Atlantic needlefish Fundulidae Fundulus chrysotus Golden topminnow Fundulus notatus Blackstripe topminnow Fundulus olivaceus Blackspotted topminnow Poeciliidae Gambusia affinis Western mosquitofish Moronidae Morone chrysops White bass Morone mississippiensis Yellow bass Morone saxatilis Striped bass Centrarchidae Lepomis auritus Redbreast sunfish Lepomis gulosus Warmouth Lepomis humilis Orangespotted sunfish Lepomis macrochirus Bluegill Lepomis marginatus Dollar sunfish Lepomis megalotis Longear sunfish Lepomis microlophus Redear sunfish Lepomis miniatus Redspotted sunfish Micropterus punctulatus Spotted bass Micropterus salmoides Largemouth bass Pomoxis annularis White crappie Pomoxis nigromaculatus Black crappie Percidae Ammocrypta vivax Scaly sand darter Etheostoma chlorosoma Bluntnose darter Etheostoma histrio Harlequin darter Etheostoma proeliare Cypress darter Percina macrolepida Bigscale logperch Percina sciera Dusky darter Sciaenidae Aplodinotus grunniens Freshwater drum Elassomatidae Elassoma zonatum Banded pygmy sunfish Achiridae Trinectes maculatus fasciatus Hogchoker Total Individuals Number of Species
27 4.2 Seasonal Habitat Utilization Results Fall 29 Seasonal Habitat Utilization sampling for fall 29 was conducted from December 15-17, 29 at five sites (RM 132, 139, 141TR, 143, and 146SW). Flow conditions during this sampling period were higher than in other samples collected as part of this study. Heavy rainfall in the Sabine River Basin during October 29 resulted in flooding in the area in late October and early November 29. Due to flood flow pass-through from Toledo Bend reservoir, daily mean flows at the USGS gage near Burkeville peaked at over 7, cfs during early November (Figure 4.2-1). Spillway releases were curtailed by mid-november, but the maximum tailrace generation flow of 14, cfs was maintained until December 14, when generation was halted temporarily to allow for sampling. Mean daily discharge at the USGS gage on the Sabine River near Burkeville (# 826) during the three-day sampling period ranged from 3,4 cfs to 6,77 cfs. Figure Mean daily discharge at the Sabine River near Burkeville (USGS gage #826) during October 29 through January 21. Higher flows observed during December 29 influenced sampling effort by inundating several of the riffle areas that were barge-shocked during other sampling events. Riffle areas at RM 141TR and RM 139 were inundated due to higher flows, therefore, barge shocking was only conducted at RM 146SW. In total, over 3 hours of electrofishing, 5 seine hauls, and 8 gill net nights were conducted during December 29. Site-specific effort is detailed in Table
28 Table Fish sampling effort at five sites on the lower Sabine River in December 29. Event Site Seining Electrofishing (minutes) Gill Nets Hoop Net Month River Mile # Hauls Boat Barge Low Freq Night # Net Nights # Net Nights December SW December December TR December December TOTAL Fish sampling during the December trip resulted in capture of 1,35 fishes representing 19 families and 56 species (Table 4.2-2). Per site catch varied from 1,179 individuals at RM 139 to 3,916 individuals at RM 132. Abundant species included inland silverside (36% of all fish captured), blacktail shiner (23%), and threadfin shad (23%). Although effort varied among sites, species richness ranged from 25 species at RM 139 to 37 species at RM 141TR. There were five species caught during the December 29 trip that were not caught during any other sampling event - southern brook lamprey Ichthyomyzon gagei, lake chubsucker Erimyzon sucetta, bantam sunfish Lepomis symmetricus, slough darter Etheostoma gracile, and swamp darter Etheostoma fusiforme. These are common inhabitants of smaller tributaries and/or off-channel oxbows and swamps, and could have been displaced by high flows in these areas. Alternatively, high flow pulses which temporarily connect off-channel habitats such as oxbows and swamps to the main river allow species which inhabit these areas a brief chance for dispersal. The swamp darter captured at RM 146SW during December may represent the first collection of this species in the Sabine River drainage. They are known from the nearby Calcasieu drainage of Louisiana, and Moriarty and Winemiller (1997) reported them from Village Creek in the Neches River drainage, but to our knowledge they have not been reported from the Sabine River. The five species listed above were all represented by only one individual. However, 3 western starhead topminnows Fundulus blairae were captured, and they were documented at every site sampled in December. Besides December collections, only 3 individuals were captured in April 21. Again, the sharp increase in abundance of this species may be a result of flooding in the area which occurred before the December trip. High streamflow during this period may have forced this species out of smaller tributaries or off-channel habitats and into the main river. This species may have also been washed in from Toledo Bend Reservoir as water poured through the spillway gates. However, the abundance of this particular species in Toledo Bend Reservoir is unknown. Two other species which are commonly abundant in reservoirs (threadfin shad and inland silverside) showed a large increase in abundance during the December 29 sampling. Four American eels and two blue suckers were captured during the December sampling event. Cooler water temperatures experienced during December may have influenced these species to shift to deeper habitats which are inaccessible to electrofishing. This is supported by the fact that the blue suckers captured during December were caught in a deep pool using a gill net at RM 141TR. Alternatively, this may have been a function of decreased sampling efficiency due to higher flows. More information on American eel and blue sucker can be found in sections 4.3 and 4.4, respectively. 21
29 Table Number (#) and percent relative composition (%) of fishes captured from five sites on the lower Sabine River during December 29. Family Scientific name Common name TR SW Total # % # % # % # % # % # % Petromyzontidae Ichthyomyzon gagei Southern brook lamprey Lepisosteidae Lepisosteus oculatus Spotted gar Lepisosteus osseus Longnose gar Amiidae Amia calva Bowfin Anguillidae Anguilla rostrata American eel Clupeidae Dorosoma cepedianum Gizzard shad Dorosoma petenense Threadfin shad Cyprinidae Cyprinella venusta Blacktail shiner Cyprinus carpio Common carp Hybognathus nuchalis Mississippi silvery minnow Lythrurus fumeus Ribbon shiner Notemigonus crysoleucas Golden shiner Notropis texanus Weed shiner Notropis volucellus Mimic shiner Opsopoeodus emiliae Pugnose minnow Pimephales vigilax Bullhead minnow Catostomidae Carpiodes carpio River carpsucker Cycleptus elongatus Blue sucker Erimyzon sucetta Lake chubsucker Ictiobus bubalus Smallmouth buffalo Minytrema melanops Spotted sucker Moxostoma poecilurum Blacktail redhorse Ictaluridae Ictalurus furcatus Blue catfish Ictalurus punctatus Channel catfish Pylodictis olivaris Flathead catfish Esocidae Esox americanus Redfin pickerel Mugilidae Mugil cephalus Striped mullet Atherinopsidae Labidesthes sicculus Brook silverside Menidia beryllina Inland silverside Fundulidae Fundulus blairae Western starhead topminnow Fundulus chrysotus Golden topminnow Fundulus notatus Blackstripe topminnow Fundulus olivaceus Blackspotted topminnow Poeciliidae Gambusia affinis Western mosquitofish Moronidae Morone chrysops White bass Morone mississippiensis Yellow bass Centrarchidae Lepomis auritus Redbreast sunfish Lepomis gulosus Warmouth Lepomis macrochirus Bluegill Lepomis marginatus Dollar sunfish Lepomis megalotis Longear sunfish Lepomis microlophus Redear sunfish Lepomis miniatus Redspotted sunfish Lepomis symmetricus Bantam sunfish Micropterus punctulatus Spotted bass Micropterus salmoides Largemouth bass Pomoxis annularis White crappie Pomoxis nigromaculatus Black crappie Percidae Etheostoma chlorosoma Bluntnose darter Etheostoma fusiforme Swamp darter Etheostoma gracile Slough darter Percina macrolepida Bigscale logperch Percina sciera Dusky darter Sciaenidae Aplodinotus grunniens Freshwater drum Elassomatidae Elassoma zonatum Banded pygmy sunfish Achiridae Trinectes maculatus fasciatus Hogchoker Total Individuals Number of Species
30 4.2.2 Spring 21 Flows in the lower Sabine River remained high from December 29 through early April 21. In early April, flows began to decline (Figure 4.2-2). Spring sampling occurred from April 12-16, 21. Figure Mean daily discharge at the Sabine River near Burkeville (USGS gage #826) during April 21. During April 21 sampling, over 3.5 hours of electrofishing, 5 seine hauls, and 8 gill net nights were conducted. Site-specific effort is provided in Table Table Sampling effort at five sites on the lower Sabine River in April 21. Event Site Seining Electrofishing (minutes) Gill Nets Hoop Net Month River Mile # Hauls Boat Barge Low Freq Night # Net Nights # Net Nights April SW April April TR April April TOTAL April 21 sampling resulted in capture of 6,223 fishes representing 2 families and 57 species (Table 4.2-4). Per site catch varied from 75 individuals at RM 146SW to over 1,8 individuals at RM
31 Although effort varied among sites, per site species richness ranged from 32 species at RM 146SW to 4 species at RM 143. The most abundant species included inland silverside (25% of all fish captured), blacktail shiner (19%), bluegill (19%), and threadfin shad (9%). Twenty-one adult blue suckers and 6 American eels were captured during April. Two species captured during the April trip were not documented during any other sampling event - chestnut lamprey Ichthyomyzon castaneus and red shiner Cyprinella lutrensis. Chestnut lampreys were relatively widespread during April, with one individual captured at four of the five sites. Chestnut lampreys are parasitic carnivores which feed by attaching to larger fish with a sucking disc. These lampreys were observed detaching from other fish during electrofishing. Adults of this species typically inhabit large lakes and rivers, but migrate to smaller streams to spawn and die. In Tennessee, spawning takes place in early May (Etnier and Starnes 1993), therefore, their presence only during the spring sampling period may be a result of a migration pattern. Two red shiners were also captured during April, one at RM 139 and one at RM 143. This species, which was once abundant in the lower Sabine River, was thought to have been extirpated (Bonner and Runyan 27). 24
32 Table Number (#) and percent relative composition (%) of fishes captured from five sites on the lower Sabine River during April 21. Family Scientific name Common name TR SW Total # % # % # % # % # % # % Petromyzontidae Ichthyomyzon castaneus Chestnut lamprey Lepisosteidae Lepisosteus oculatus Spotted gar Lepisosteus osseus Longnose gar Amiidae Amia calva Bowfin Anguillidae Anguilla rostrata American eel Clupeidae Dorosoma cepedianum Gizzard shad Dorosoma petenense Threadfin shad Cyprinidae Cyprinella lutrensis Red shiner Cyprinella venusta Blacktail shiner Cyprinus carpio Common carp Lythrurus fumeus Ribbon shiner Macrhybopsis hyostoma Shoal chub Notropis sabinae Sabine shiner Notropis texanus Weed shiner Notropis volucellus Mimic shiner Opsopoeodus emiliae Pugnose minnow Pimephales vigilax Bullhead minnow Catostomidae Carpiodes carpio River carpsucker Cycleptus elongatus Blue sucker Ictiobus bubalus Smallmouth buffalo Minytrema melanops Spotted sucker Moxostoma poecilurum Blacktail redhorse Ictaluridae Ameiurus natalis Yellow bullhead Ictalurus furcatus Blue catfish Ictalurus punctatus Channel catfish Noturus nocturnus Freckled madtom Pylodictis olivaris Flathead catfish Esocidae Esox americanus Redfin pickerel Aphredoderidae Aphredoderus sayanus Pirate perch Mugilidae Mugil cephalus Striped mullet Atherinopsidae Labidesthes sicculus Brook silverside Menidia beryllina Inland silverside Belonidae Strongylura marina Atlantic needlefish Fundulidae Fundulus blairae Western starhead topminnow Fundulus chrysotus Golden topminnow Fundulus notatus Blackstripe topminnow Fundulus olivaceus Blackspotted topminnow Poeciliidae Gambusia affinis Western mosquitofish Moronidae Morone chrysops White bass Morone mississippiensis Yellow bass Morone saxatilis Striped bass Centrarchidae Lepomis auritus Redbreast sunfish Lepomis gulosus Warmouth Lepomis macrochirus Bluegill Lepomis megalotis Longear sunfish Lepomis microlophus Redear sunfish Lepomis miniatus Redspotted sunfish Micropterus punctulatus Spotted bass Micropterus salmoides Largemouth bass Pomoxis annularis White crappie Pomoxis nigromaculatus Black crappie Percidae Ammocrypta vivax Scaly sand darter Etheostoma chlorosoma Bluntnose darter Etheostoma histrio Harlequin darter Percina sciera Dusky darter Sciaenidae Aplodinotus grunniens Freshwater drum Elassomatidae Elassoma zonatum Banded pygmy sunfish Total Individuals Number of Species
33 4.2.3 Fall and Spring Combined When combined, a total of 1 seine hauls, over 6.6 hours of electrofishing, and 16 gill net nights were conducted during seasonal habitat utilization sampling trips (Table 4.2-5). Table Sampling effort at five sites on the lower Sabine River during December 29 and April 21. Event Site Seining Electrofishing (minutes) Gill Nets Hoop Net Month River Mile # Hauls Boat Barge Low Freq Night # Net Nights # Net Nights December SW December December TR December December April SW April April TR April April TOTAL This resulted in the capture of 16,573 fish representing 21 families and 67 species (Table 4.2-6). The most abundant species during these trips included inland silverside (32%), blacktail shiner (22%), threadfin shad (17.5%), bluegill (9.4 %), and longear sunfish (3.2%). 26
34 Table Number (#) and percent relative composition (%) of fishes captured from five sites on the lower Sabine River during December 29 and April 21. Family Scientific name Common name TR SW Total # % # % # % # % # % # % Petromyzontidae Ichthyomyzon castaneus Chestnut lamprey Ichthyomyzon gagei Southern brook lamprey Lepisosteidae Lepisosteus oculatus Spotted gar Lepisosteus osseus Longnose gar Amiidae Amia calva Bowfin Anguillidae Anguilla rostrata American eel Clupeidae Dorosoma cepedianum Gizzard shad Dorosoma petenense Threadfin shad Cyprinidae Cyprinella lutrensis Red shiner Cyprinella venusta Blacktail shiner Cyprinus carpio Common carp Hybognathus nuchalis Mississippi silvery minnow Lythrurus fumeus Ribbon shiner Macrhybopsis hyostoma Shoal chub Notemigonus crysoleucas Golden shiner Notropis sabinae Sabine shiner Notropis texanus Weed shiner Notropis volucellus Mimic shiner Opsopoeodus emiliae Pugnose minnow Pimephales vigilax Bullhead minnow Catostomidae Carpiodes carpio River carpsucker Cycleptus elongatus Blue sucker Erimyzon sucetta Lake chubsucker Ictiobus bubalus Smallmouth buffalo Minytrema melanops Spotted sucker Moxostoma poecilurum Blacktail redhorse Ictaluridae Ameiurus natalis Yellow bullhead Ictalurus furcatus Blue catfish Ictalurus punctatus Channel catfish Noturus nocturnus Freckled madtom Pylodictis olivaris Flathead catfish Esocidae Esox americanus Redfin pickerel Aphredoderidae Aphredoderus sayanus Pirate perch Mugilidae Mugil cephalus Striped mullet Atherinopsidae Labidesthes sicculus Brook silverside Menidia beryllina Inland silverside Belonidae Strongylura marina Atlantic needlefish Fundulidae Fundulus blairae Western starhead topminnow Fundulus chrysotus Golden topminnow Fundulus notatus Blackstripe topminnow Fundulus olivaceus Blackspotted topminnow Poeciliidae Gambusia affinis Western mosquitofish Moronidae Morone chrysops White bass Morone mississippiensis Yellow bass Morone saxatilis Striped bass Centrarchidae Lepomis auritus Redbreast sunfish Lepomis gulosus Warmouth Lepomis macrochirus Bluegill Lepomis marginatus Dollar sunfish Lepomis megalotis Longear sunfish Lepomis microlophus Redear sunfish Lepomis miniatus Redspotted sunfish Lepomis symmetricus Bantam sunfish Micropterus punctulatus Spotted bass Micropterus salmoides Largemouth bass Pomoxis annularis White crappie Pomoxis nigromaculatus Black crappie Percidae Ammocrypta vivax Scaly sand darter Etheostoma chlorosoma Bluntnose darter Etheostoma fusiforme Swamp darter Etheostoma gracile Slough darter Etheostoma histrio Harlequin darter Percina macrolepida Bigscale logperch Percina sciera Dusky darter Sciaenidae Aplodinotus grunniens Freshwater drum Elassomatidae Elassoma zonatum Banded pygmy sunfish Achiridae Trinectes maculatus fasciatus Hogchoker Total Individuals Number of Species
35 4.3 American Eel Results Fish Community Sampling During the four fish community sampling events detailed above, electrofishing was the most effective means of capturing American eels. No eels were captured using seines, hoop nets, or gill nets. A total of 43 American eels have been captured at six different sites during day and night electrofishing (Table 4.3-1). No eels were captured from the lower four sampling sites (RM 15, 9, 72, 64). Table Number of American eels captured with electrofishing during each of four fish community sampling events on the lower Sabine River. Date River Mile TR SW Total Sep Dec Apr Jul Total Since effort varied considerably across sites, it was more appropriate to examine catch-per-unit-effort rather than raw abundance when making comparisons between sites. Electrofishing CPUE calculated over the entire study with day, night, and barge sampling combined was 2.7 eels per hour. However, overall daytime electrofishing CPUE was considerably higher (3.3 eels/hr) than night electrofishing CPUE (.9 eels/hr). This was rather surprising considering that American eels are thought to be primarily nocturnal. However, this may represent increased sampling efficiency during daylight hours. Since night electrofishing and barge electrofishing were not conducted at every site, comparisons between sites were limited to daytime boat electrofishing data (Table 4.3-2). Table Daytime boat electrofishing CPUE (eels/hr) of American eels captured at 1 sites on the lower Sabine River during each fish community sampling event. River Mile TR SW Event Overall Sep Dec Apr Jul Average Average American eel CPUE observed in this study was similar to that observed via boat electrofishing in the Shenandoah River drainage of Virginia (range:. 9. eels/hr, mean = 1.5 eels/hr), but much lower than that observed via backpack electrofishing in tributaries of the Potomac River, Virginia (range: eels/hr, mean = 28.4 eels/hr) (Goodwin and Angermeier 23). Cairns et al. (28) reported American eel CPUE ranging from eels/hr in the Eastern Lake Ontario basin of Canada, although electrofishing method (boat, barge, or backpack) was not specified. 28
36 Total Length (mm) Frequency Downstream Fisheries Resources Report American eels collected during fish community sampling ranged from 165 to 67 mm TL. Length frequency data shows that the majority of individuals were between 25 and 55 mm TL (Figure 4.3-1). Figure shows the variation in total length observed at each site where eels were captured Total Length (mm) Figure Length frequency histogram of American eels captured by electrofishing from the lower Sabine River TR SW River Mile Figure Total length (mm) of American eels captured from six sites on the lower Sabine River with electrofishing Species-Specific American Eel Sampling To date, ten American eels have been captured from the custom-built eel ramp traps since sampling began in February 21 (Table 4.3-3). Four of these were captured during the first six months of the study when monthly operation of the ramp traps was being conducted for three consecutive nights per month. These four eels were captured during June at RM 141TR. Two eels (16 mm and 247 mm TL) were captured in 29
37 the Texas-side (southwest corner) eel ramp on the morning of June 9, 21, and two eels (182 mm and 185 mm TL) were captured on the Louisiana-side (northeast corner) ramp on June 1, 21. Once eels were captured, they were anesthetized with clove oil, measured, marked by clipping the caudal fin with a pair of scissors, allowed to recover in fresh water, and released. Due to a miscommunication, eel ramps on the tailrace channel were never turned off after the May sampling event. Therefore, the two eels noted after the first night of sampling on June 9 could have been captured at any point during the previous month and this should be taken into account when reviewing the data. Since continuous operation of ramp traps began in mid-august 21, six American eels have been captured. All six were captured from RM 146SW at the Texas side trap (south bank) during September 21 (Table 4.3-3). Four of those eels were measured, marked, and released. The remaining two American eels escaped before being processed. Therefore, fin clips were not taken, and the length was estimated by SRA employees. Table Details of American eel captures from four ramp traps at Toledo Bend Dam in 21. Sampling Protocol Date Total Length (mm) Fin Clipped Recapture Trap Location Three consecutive nights per month Continuous * Estimated length 6/9/21 16 Yes No Southwest bank of tailrace (Texas side) 6/9/ Yes No Southwest bank of tailrace (Texas side) 6/1/ Yes No Northeast bank of tailrace (Louisiana side) 6/1/ Yes No Northeast bank of tailrace (Louisiana side) 9/7/21 26* No? South bank of spillway (Texas side) 9/9/ Yes No South bank of spillway (Texas side) 9/9/21 15* No? South bank of spillway (Texas side) 9/13/ Yes No South bank of spillway (Texas side) 9/13/ Yes No South bank of spillway (Texas side) 9/13/ Yes No South bank of spillway (Texas side) Despite trying a variety of baits (chicken livers, turkey necks, fresh cut shad, fresh cut sucker, crushed blue crab, crushed crawfish, crushed shrimp, dog food, etc.), no eels were caught using the baited eel pots during the monthly American eel sampling. Eel ramp traps were operated for one full year as specified in the study plan with sampling completed in January 211. However, Sabine River Authority (SRA) is voluntarily extending sampling through March to allow continued sampling until the ARWG meets to review study status in March Blue Sucker Results Fish Community Sampling Fish community sampling (both Critical Period and Seasonal Habitat Utilization) conducted as part of this study resulted in capture of 68 blue suckers. Blue suckers were documented at six of the ten sites, including the upstream-most (RM 146SW) and downstream-most (RM 64) sites (Table 4.4-1). They exhibited the highest abundance at RM 132 and RM 139 (21 blue suckers at each location) where their preferred habitat (swift water over hard substrate such as bedrock or large woody debris) was most common. Although the majority of these fish were captured while boat electrofishing (57), some were captured in gill nets (11), demonstrating that this species also uses deep pool habitats. 3
38 Table Number of blue suckers captured at ten sites on the lower Sabine River during each of four fish community sampling events. River Mile TR SW Total Sep Dec Apr Jul Total Since effort varied considerably across sites, it was more appropriate to examine CPUE rather than raw abundance when making comparisons between sites. For the entire study, overall blue sucker electrofishing CPUE was 3.6 fish/hr, and gill net CPUE was.23 fish/net night. Overall night electrofishing CPUE (4. fish/hr) was slightly higher than overall day electrofishing CPUE (3.5 fish/hr). Since barge electrofishing and night electrofishing were not conducted at every site, comparisons between sites were limited to daytime boat electrofishing data (Table 4.4-2). Table Daytime boat electrofishing CPUE (fish/hr) for blue suckers at 1 sites on the lower Sabine River during each fish community sampling event. River Mile TR SW Event Overall Sep Dec Apr Jul Average Blue sucker CPUE reported herein are similar to those reported from other locations in the country. Average blue sucker CPUE in this study ranged from fish/hr. Morey and Berry (23) reported an average CPUE of 3.1 fish/hr in the James River and 9.1 fish/hr in the Big Sioux River, South Dakota. Length data from blue suckers captured during fish community sampling (68) were combined with length data from 16 blue suckers captured during Species-specific blue sucker sampling (see section 4.4.2). Total length of these 84 fish ranged from mm (Figure 4.4-1). Fish ranging from 55 6 mm TL were the most common, however, a variety of sizes were observed suggesting the presence of multiple age classes. Although only one fish less than 4 mm TL was captured, length frequency distributions of other blue sucker studies show similar results (Morey and Berry 23, BIO-WEST 28). Juvenile blue suckers are rarely collected, even in areas where adults seem relatively abundant. Age and growth relationships for Cycleptus species in the literature are highly variable and dependent upon the aging method used (i.e., scales, pectoral fin rays, opercular bones) (Peterson et al. 1999, Rupprecht and Jahn 198, Moss et al. 1983). Based on the above literature, the 31 mm fish collected at RM 139 in September 29 was age-ii through age-iv, and was most likely not sexually mature. Although Peterson et al. (1999) reported visibly developed gonads in male Cycleptus as small as 327 mm 31
39 TL and females as small as 444 mm TL, other studies list the smallest sexually mature individuals at close to 5 mm TL (Moss et al. 1983, Rupprecht and Jahn 198). Figure Length frequency distribution of 84 blue suckers captured from the lower Sabine River during fish community sampling and Species-Specific sampling Species-Specific sampling In addition to fish community sampling described above, considerable effort was focused on identifying location and timing of blue sucker spawning in the lower Sabine River, as well as documenting habitat utilization by all life stages of blue sucker. The methods used and conditions observed during this sampling are summarized in Table Additional details are provided below. February Based on previous documentation of blue suckers spawning in the lower Colorado River, Texas in February, the first blue sucker sampling trip was conducted on February 25, 21. Mean daily discharge at the USGS gauge on the Sabine River near Burkeville (USGS 826) ranged from 8,19 cfs to 8,22 cfs on these dates. An intensive search for blue sucker spawning was conducted. Kayaks were used to conduct visual searches for blue suckers throughout the entire length of the spillway site (spillway to boat ramp). Although the entire area was searched, effort was focused on shallow swift riffle areas which provide good spawning habitat for blue suckers. No large fish were observed. Larger fish were likely inhabiting deeper pools due to low water temperatures. Water temperatures at the time ranged from C. At both potential spawning riffles, rocks were examined for blue sucker eggs, but none were observed. March The next round of sampling was conducted on March 22-25, 21. Mean daily discharge at the USGS gauge on the Sabine River near Burkeville (USGS 826) was approximately 15,8 cfs on these 32
40 dates. Extensive sampling aimed at documenting spawning aggregations of blue suckers was conducted on this trip. Over one hour of electrofishing (3,64 seconds) was conducted. This effort was spread over multiple locations including the spillway channel, tailrace channel, RM 139 riffle area, Six-Mile Loop, Old River Channel, and Toro Bayou upstream of its confluence with the spillway channel. Two gill nets were set in deep pools of the spillway channel. Hundreds of fish representing 25 different species were captured. However, despite the considerable effort, no blue suckers were observed. Water temperature was recorded at several locations and ranged from C. April As documented in section 4.2.2, fish community sampling as part of the spring Seasonal Habitat Utilization sampling trip was conducted from April 12-16, 21. During this time, 21 adult blue suckers were captured ranging in size from mm TL. Blue suckers were captured at RM 141TR (2), RM 139 (1), and RM 132 (9). The majority of these fish were captured in two large aggregations at RM 139 and RM 132. Although two large male blue suckers expressed milt, no females expressed eggs. Most of the large females captured exhibited flaccid bellies indicating that spawning was complete. May The May sampling trip was conducted on May 1-13, 21. Instantaneous flows at the USGS gauge on the Sabine River near Burkeville (USGS 826) ranged from 449 cfs to 6,76 cfs on these dates. On May 11, extensive seining was conducted in the area near the mouth of Anacoco Bayou and downstream a few miles (RM 12-15). Several small suckers were collected using larval seines in backwater habitats near the mouth of Anacoco Bayou. A sample of these fishes was preserved for later identification in the laboratory. On May 12, extensive sampling was conducted in the area from the bedrock outcrop at RM 139 downstream to the Burr Ferry Bridge at RM 132. Sampling on May 12 consisted of pulling larval seines in backwater areas, barge shocking in shallow riffle areas, and boat shocking in other areas of potential blue sucker habitat. Fourteen adult blue suckers ranging in size from mm TL were collected from several locations within this reach in swift water over large woody debris. Again, several small suckers were collected from backwater habitats and preserved for identification in the laboratory. With the aid of a dissecting microscope in the BIO-WEST laboratory, all of the small suckers collected were determined to be larval and juvenile blacktail redhorse Moxostoma poecilurum or spotted suckers Minytrema melanops. No juvenile blue suckers were captured. June The June sampling trip occurred on June 9-1, 21. Instantaneous flows at the USGS gauge on the Sabine River near Burkeville (USGS 826) ranged from 1,21 cfs to 7,96 cfs on these dates. On June 9, sampling was focused near the Burr Ferry Bridge at RM 132 and for several miles downstream. Over 2,6 seconds of boat electrofishing was conducted along with extensive seining in backwaters and along sandbars and shallow runs. Two adult blue suckers (56 and 49 mm TL) were captured a few miles below the Burr Ferry Bridge. Juvenile blacktail redhorse (35-4 mm TL) were common in flooded vegetation along shoreline edges, but no juvenile blue suckers were captured. On June 1, extensive seining and boat electrofishing was conducted from the Palmer Lake boat ramp (RM 12) downstream to Clines Ferry ( RM 95). Again, juvenile blacktail redhorse were common in flooded vegetation along the stream edges. 33
41 Although spawning was not actually witnessed, based on observations of fish condition as well as monitoring of water temperature, blue suckers likely spawned in the lower Sabine River in late March or early April. Two potential spawning aggregations were noted in April one at RM 139 and one at RM 132. Several additional aggregations were noted in May in the reach between these two sample sites. A considerable amount of blue sucker habitat (swift water over large woody debris) exists in this reach, and blue suckers were documented at every location where this habitat was obvious during May. Despite considerable effort in May, June, and July no larval or small juvenile blue suckers were collected. In contrast, larval and juvenile specimens of other catostomids (i.e., blacktail redhorse and spotted sucker) were common to abundant in backwaters and along shorelines containing flooded vegetation during this time period. Other studies have had similar results, with juvenile blue suckers being rare even in systems with large adult populations. The few larvae that have been collected have come from slackwater habitats in close proximity to the main channel of large rivers (Adams et al. 26, Fisher and Willis 2), whereas juveniles have been captured from swifter habitats (Moss et al. 1983, McInerny and Held 1988). 4.5 Study Totals In total, over 37, fishes representing 23 families and 75 species were documented as part of this study. Most of these fishes were captured during fish community sampling (both Critical Period and Seasonal Habitat Utilization) and are presented in Table It should be noted when viewing this table that effort varied across sites, and the upper five sites (RM RM 146SW) were sampled four times (2 Critical Period events and 2 Seasonal Habitat Utilization events) whereas the lower sites (RM 64 - RM 12) were only sampled twice (2 Critical Period events). In addition to fishes captured during the four fish community sampling events, considerable sampling effort was targeted at Species-specific sampling of American eels and blue suckers. In order to be as efficient as possible, only the target species were typically noted during this sampling. However, one additional species which was not encountered during fish community sampling was collected while sampling for blue suckers. One suckermouth minnow Phenacobius mirabilis was collected while electrofishing downstream of the Palmer Lake boat ramp ( RM 1) on June 1, 21. This specimen represented the 75 th species captured during the study, and was not included in Table
42 Table Number (#) and percent relative composition (%) of fishes captured from ten sites on the lower Sabine River during fish community sampling in 29 and 21. Sites SW (in gray) were sampled four times, whereas sites were sampled twice. Family Scientific name Common name TR SW Total # % # % # % # % # % # % # % # % # % # % # % Petromyzontidae Ichthyomyzon castaneus Chestnut lamprey Ichthyomyzon gagei Southern brook lamprey Polyodontidae Polyodon spathula Paddlefish Lepisosteidae Lepisosteus oculatus Spotted gar Lepisosteus osseus Longnose gar Amiidae Amia calva Bowfin Elopidae Elops saurus Ladyfish Anguillidae Anguilla rostrata American eel Clupeidae Alosa chrysochloris Skipjack herring Dorosoma cepedianum Gizzard shad Dorosoma petenense Threadfin shad Cyprinidae Cyprinella lutrensis Red shiner Cyprinella venusta Blacktail shiner Cyprinus carpio Common carp Hybognathus nuchalis Mississippi silvery minnow Lythrurus fumeus Ribbon shiner Lythrurus umbratilis Redfin shiner Macrhybopsis hyostoma Shoal chub Notemigonus crysoleucas Golden shiner Notropis sabinae Sabine shiner Notropis texanus Weed shiner Notropis volucellus Mimic shiner Opsopoeodus emiliae Pugnose minnow Pimephales vigilax Bullhead minnow Catostomidae Carpiodes carpio River carpsucker Cycleptus elongatus Blue sucker Erimyzon sucetta Lake chubsucker Ictiobus bubalus Smallmouth buffalo Minytrema melanops Spotted sucker Moxostoma poecilurum Blacktail redhorse Ictaluridae Ameiurus natalis Yellow bullhead Ictalurus furcatus Blue catfish Ictalurus punctatus Channel catfish Noturus gyrinus Tadpole madtom Noturus nocturnus Freckled madtom Pylodictis olivaris Flathead catfish Esocidae Esox americanus Redfin pickerel Aphredoderidae Aphredoderus sayanus Pirate perch Mugilidae Mugil cephalus Striped mullet Atherinopsidae Labidesthes sicculus Brook silverside Menidia beryllina Inland silverside Belonidae Strongylura marina Atlantic needlefish Fundulidae Fundulus blairae Western starhead topminnow Fundulus chrysotus Golden topminnow Fundulus notatus Blackstripe topminnow Fundulus olivaceus Blackspotted topminnow Poeciliidae Gambusia affinis Western mosquitofish Moronidae Morone chrysops White bass Morone mississippiensis Yellow bass Morone saxatilis Striped bass Centrarchidae Lepomis auritus Redbreast sunfish Lepomis gulosus Warmouth Lepomis humilis Orangespotted sunfish Lepomis macrochirus Bluegill Lepomis marginatus Dollar sunfish Lepomis megalotis Longear sunfish Lepomis microlophus Redear sunfish Lepomis miniatus Redspotted sunfish Lepomis symmetricus Bantam sunfish Micropterus punctulatus Spotted bass Micropterus salmoides Largemouth bass Pomoxis annularis White crappie Pomoxis nigromaculatus Black crappie Percidae Ammocrypta vivax Scaly sand darter Etheostoma chlorosoma Bluntnose darter Etheostoma fusiforme Swamp darter Etheostoma gracile Slough darter Etheostoma histrio Harlequin darter Etheostoma proeliare Cypress darter Percina macrolepida Bigscale logperch Percina sciera Dusky darter Sciaenidae Aplodinotus grunniens Freshwater drum Elassomatidae Elassoma zonatum Banded pygmy sunfish Achiridae Trinectes maculatus fasciatus Hogchoker Total Individuals Number of Species
43 5 Discussion 5.1 Diversity and Similarity In order to assess diversity among sites, Simpson s Diversity Index was calculated based on the combined Critical Period dataset presented in section The formula for Simpson s Index is: where S = the number of species, N = the total number of individuals, and n = the number of individuals of a given species (i). Values for this index range from (no diversity) to 1 (infinite diversity). Table presents species richness and Simpson s Index values for each site. Table Fish species richness and Simpson's diversity index for ten sites on the lower Sabine River based on the combined Critical Period dataset. River Mile Species Richness Simpson's Index Species richness was highest at the upper five sites (RM 132 RM 146SW). As a result of the unique habitat conditions that occur at RM 146SW, RM 143, RM 141TR, and RM 139, a number of rare species (yellow bullhead, tadpole madtom, dollar sunfish) captured in this upper section were not found in the lower river (RM 64 RM 12). Also, common reservoir species such as yellow bass and striped bass were not collected from the lower river. Simpson s diversity index showed the highest species diversity (>.8) at the extreme upstream (RM 143 and RM 146SW) and downstream (RM 64) ends of the study area. The middle portion of the study area (RM 9 12) showed the lowest diversity, as a result of the dominance of blacktail shiner in this reach (see Figure 5.2-1). To further assess differences between sites, the Renkonen percent similarity index was calculated for each site pair (Table 5.1-2). The Renkonen percent similarity index is not influenced by the number of individuals in a sample, and is therefore considered one of the more robust similarity measures (Kwak and Peterson 27). This index has a possible range of 1%, with % indicating no similarity (i.e., no species in common) and 1% indicating complete similarity (i.e., identical communities). It is calculated by summing the minimum percent relative abundance of each species between the two assemblages, as follows: P jk = min ( p ki, p ji ), where P jk is percent similarity between assemblages j and k, and p ki and p ji represent the percent relative abundance of species i in assemblage j and k, respectively (Kwak and Peterson 27). 36
44 River Mile Downstream Fisheries Resources Report Percent similarity values indicate that RM 141TR was rather unique, exhibiting low similarity to all sites except nearby RM 139 to which it was moderately similar (56%). RM 64 exhibited the highest similarity to RM 72 (7%). RM 9 was most similar to RM 15 (8%) and RM 12 (79%). RM 143 and RM 146SW did not show a strong similarity to any other site, but were most similar to RM 64. These three sites also exhibited the highest diversity. Table Percent similarity of each site pair based on fish community data. River Mile TR SW 64 7% 5% 6% 4% 52% 41% 17% 57% 49% 72 7% 77% 62% 68% 44% 14% 41% 41% 9 8% 79% 71% 46% 14% 42% 28% 15 75% 66% 44% 14% 44% 3% 12 61% 42% 14% 36% 17% % 28% 54% 35% % 46% 18% % 25% % Longitudinal Trends Based on the above percent similarity analysis and an analysis of the ten most abundant species at each site (Figure 5.2-1), longitudinal trends in community composition within the study area are evident. While some changes are gradual and occur over a large expanse of river, community composition changes rather abruptly between some sites allowing for division of the study area into four differing segments, with subtle changes occurring within segments, and more notable changes occurring between segments. First, assemblages documented at RM 146SW and RM 143 do not align well with longitudinal trends observed from RM 141TR downstream. These sites are not directly influenced by generation flows released from the tailrace, although they are influenced by changes in stage resulting from the backwater effects of releases. These sites receive a constant flow from the spillway sluiceway of approximately 144 cfs (except during flooding when water is released from spillway gates) and are also influenced by flows from Toro Bayou which enters the channel immediately downstream of RM 146SW. As a result, this channel essentially acts as a large tributary to the main river, and therefore, maintains a rather distinct assemblage. Three species captured here were not captured elsewhere (dollar sunfish, yellow bullhead, and golden shiner Notemigonus crysoleucas) and a fourth (cypress darter) was only represented by one additional specimen collected at RM 64. The golden shiner is a common bait minnow and was likely released at RM 146SW by fishermen who frequent this area. The other three species listed above are common inhabitants of low-gradient swampy tributaries and may have migrated from nearby Toro Bayou. It should also be noted that two rare habitat types exist at RM 146SW which influence the species found there. Immediately downstream of the spillway, a large shallow backwater was present on river right. This area contained considerable amounts of submerged aquatic vegetation such as hydrilla, pondweed, and coontail during September 29. Submerged aquatic vegetation was extremely rare throughout the remainder of the study area. This vegetation was not present during July 21, and was likely displaced by high flows from the spillway gates during flooding the previous winter/spring. Also, steep bedrock 37
45 riffles located immediately downstream of this backwater provide quality habitat for blue sucker and darter species such as dusky darter, and are relatively rare throughout the remainder of the river. The second river segment identified based on fish community composition extends from RM 141TR downstream to RM 132. Not surprisingly, the fish community at the tailrace channel (RM 141TR) was dominated by common reservoir inhabitants such as inland silverside, threadfin shad, bluegill, spotted bass Micropterus punctulatus, largemouth bass Micropterus salmoides, and spotted gar Lepisosteus oculatus. Many of these fishes likely move downstream through the dam during generation. Few cyprinids were captured at RM 141TR (.7% relative composition), demonstrating that the fish assemblage here was more similar to the reservoir upstream than it was to the river downstream. Gradual changes occur from RM 141TR downstream to RM 132 as inland silversides become less abundant and cyprinids (mainly blacktail shiner) increase in abundance. However, a notable shift in community composition occurs between RM 132 and RM 12. Relative composition of inland silversides decreases sharply in this reach (Figure 5.2-2). Average relative composition of inland silverside in the RM 141TR RM 132 segment was 33.9% (range: %), whereas at the lower five sites (RM 64 RM 12) it was.5% (range:.1 1.3%). In addition, relative composition of cyprinids increases sharply in this reach from 51% at RM 132 to 84% at RM 12. Again, there seems to be a shift occurring in this area, as average cyprinid relative composition in the RM 132 RM 141TR segment was 28.1% (range:.7 5.5%), whereas in the lower five sites it was 76.2% (range: %). Habitat structure and gradient from RM 139 to RM 132 likely plays a role in this apparent shift in community composition. This stretch of river was unique with areas of constricted bedrock outcrop riffle habitat and swifter flows compared to wider, shifting sand bar dominated habitat near RM 12 and downstream. For example, it was not surprising that relative composition of blue sucker was highest within this segment (RM 139 to RM 132) due to the abundance of shallow swift habitat over riffle complexes and large woody debris within this reach. It will be important to analyze the water quality and stage data collected through the level-logger and datasonde efforts to examine if noted shifts in community composition might also be affected by frequent changes in river stage or shifts in water quality parameters throughout this steeper gradient portion of the river. 38
46 River Mile 146 Weed shiner River Mile 12 Blacktail shiner Western mosquitofish Threadfin shad Bluegill Longear sunfish Brook silverside Sabine shiner Longear sunfish Bluegill Spotted bass Spotted bass Striped mullet Striped mullet Blacktail shiner Spotted gar Redbreast sunfish Weed shiner Inland silverside Largemouth bass River Mile 143 Longear sunfish River Mile 15 Blacktail shiner Blacktail shiner Weed shiner Bullhead minnow Bullhead minnow Inland silverside Longear sunfish Western mosquitofish Threadfin shad Threadfin shad Bluegill Striped mullet Weed shiner Spotted bass Bluegill Spotted sucker Sabine shiner Spotted bass Striped mullet River Mile 141 Inland silverside River Mile 9 Blacktail shiner Threadfin shad Longear sunfish Bluegill Spotted bass Spotted bass Bluegill Largemouth bass Striped mullet Spotted gar Weed shiner Longear sunfish Blacktail redhorse Yellow bass Sabine shiner Striped mullet Brook silverside White crappie Blue catfish River Mile 139 Inland silverside River Mile 72 Blacktail shiner Blacktail shiner Weed shiner Longear sunfish Longear sunfish Bluegill Bluegill Spotted bass Mississippi silvery minnow Harlequin darter Sabine shiner Striped mullet Bullhead minnow Weed shiner Spotted bass Dusky darter Spotted gar Threadfin shad Gizzard shad River Mile 132 Blacktail shiner River Mile 64 Blacktail shiner Longear sunfish Weed shiner Bluegill Bullhead minnow Inland silverside Longear sunfish Spotted bass Spotted sucker Western mosquitofish Bluegill Blacktail redhorse Spotted bass Blackstripe topminnow Mississippi silvery minnow Gizzard shad Mimic shiner Spotted sucker Blue catfish Figure Proportional representation of the ten most abundant species at ten sites on the lower Sabine River based on the combined Critical Period dataset. 39
47 % Relative Abundance Downstream Fisheries Resources Report blacktail shiner Cyprinidae inland silverside River Mile Figure Percent relative composition of blacktail shiner, all cyprinids, and inland silverside versus river mile. The third river segment identified from fish community analysis extends from RM 12 downstream to RM 9. Relative composition of cyprinids was higher here compared to areas further upstream. Although this increase was initially due to a large increase in abundance of blacktail shiner (97% of cyprinids collected at RM 12), as distance downstream increases, other cyprinids such as Sabine shiner, Mississippi silvery minnow, weed shiner, and bullhead minnow become more common. However, throughout this reach blacktail shiner relative composition remains extremely high and ranges from %. As previously discussed, this shift may be a result of a wider channel with shifting sand bar dominated habitat conditions compared to the steeper, often constricted and coarser substrate conditions from RM 139 to RM 132, the man-made channel habitat and reservoir influences at RM 141TR, and the unique tributary-like habitat conditions documented at RM 146SW and RM 143. Additionally, examination of the stage and water quality data will need to be conducted to examine potential influences of either or both of these parameters relative to the community composition changes observed. The last segment includes RM 72 and RM 64. Between RM 9 and RM 72, relative composition of blacktail shiner decreases (Figure 5.2-2) and relative composition of other cyprinids such as weed shiner, Mississippi silvery minnow, and bullhead minnow increase (Figure 5.2-3). Pugnose minnow Opsopoeodus emiliae also becomes more common in this lower reach. From a habitat perspective, this was an interesting shift as there are subtle differences in habitat conditions with more frequent and deeper pools being evident at these most downstream sites, but overall habitat conditions are quite similar to the above stretch. Additional tributary contributions in downstream reaches might also play a role in this shift in cyprinid composition. At this location in the river, changes in river stage resulting from the Project are minor in comparison to sites near the dam (RM 141TR, 139, and 132) and water quality parameters are also likely to be influenced more by ambient conditions and tributary influence than sites closer to the dam. 4
48 % Relative Abundance Downstream Fisheries Resources Report bullhead minnow weed shiner Sabine shiner Mississippi silvery minnow River Mile Figure Percent relative composition of bullhead minnow, weed shiner, Sabine shiner, and Mississippi silvery minnow versus river mile. 5.3 Seasonal Trends To examine seasonal trends in the fish community, data from the spring and fall habitat utilization trips were combined with data collected from the upper five sites (RM 132 RM 146SW) during Critical Period Sampling in September 29 and July 21. The resulting dataset contains data from four sampling events (September 29, December 29, April 21, July 21) at five sites (RM 132, 139, 141TR, 143, and 146SW). Comparisons were made across sites to examine seasonal trends in species presence/abundance. Although differences are apparent between sampling periods, these differences are more likely a result of hydrological conditions than seasonal movement of fishes. For example, during December 29, five species were captured which were never captured again during the course of the study (see section 4.2.1). These species are common inhabitants of tributary or off-channel habitats, and were likely in the main river due to flooding and high flows that occurred immediately prior to this sampling event. Abundance of several reservoir inhabitants such as inland silverside and threadfin shad also spiked during December, as they were presumably washed in from the reservoir upstream. Blue suckers and American eels were rare in December collections. This was likely a result of these species shifting to deeper pool habitats as a result of cooler water temperatures. However, this may also be influenced by reduced sampling efficiency under higher flow conditions experienced in December. 41
49 5.4 Comparisons with Historic Data Two recent efforts have analyzed historical fish community data from the lower Sabine River. Bonner and Runyan (27) gathered fish collection data from a variety of sources and used a regression analysis (among other techniques) to examine relative composition of species through time. Based on regression results, each species was labeled as increasing, decreasing, stable, or indeterminable. Bart (28) examined records from the Tulane University Museum of Natural History (TUMNH) (which also comprised a large portion of the Bonner and Runyan dataset). To account for variation in sampling effort through time, he compared proportional fish community data calculated from equal numbers of randomly selected samples within various time periods. The species identified as either increasing or decreasing in relative composition from each study are designated in Table Table Fishes identified as increasing or decreasing in relative composition based on two studies of historical fish community data from the lower Sabine River. Decreasers Common Name Scientific Name Bart 28 Bonner and Runyan 27 Tolerance Classification from Linam and Kleinsasser 1998 red shiner Cyprinella lutrensis X X Tolerant bullhead minnow Pimephales vigilax X X ghost shiner Notropis buchanani X X shoal chub Macrhybopsis hyostoma X X Mississippi silvery minnow Hybognathus nuchalis X Tolerant emerald shiner Notropis atherinoides X pirate perch Aphredoderus sayanus X western mosquitofish Gambusia affinis X Tolerant warmouth Lepomis gulosus X Tolerant Increasers blacktail shiner Cyprinella venusta X X Sabine shiner Notropis sabinae X weed shiner Notropis texanus X mimic shiner Notropis volucellus X Intolerant inland silverside Menidia beryllina X blackspotted topminnow Fundulus olivaceous X Intolerant bluegill Lepomis macrochirus X Tolerant longear sunfish Lepomis megalotis X spotted bass Micropterus punctulatus X scaly sand darter Ammocrypta vivax X dusky darter Percina sciera X Intolerant Although several species were only identified as decreasing in abundance by one study, there was some overlap. Both studies identified red shiner, ghost shiner Notropis buchanani, shoal chub, and bullhead minnow as decreasing in relative composition. Both studies also noted the apparent extirpation of the red shiner. Study totals (section 4.5) from the current study suggest that although red shiners are not completely extirpated from the system, they are extremely rare (2 individuals collected). No ghost shiners were collected during this study; however, they may be present in lower portions of the basin not sampled in this study. Shoal chubs were rare in the study area, with only eight individuals captured. Bullhead minnows were captured at every site and represented 2.8% of all fish collected. Per site relative composition ranged from. 12.1% and they were most abundant at RM 143 and RM 64. Bullhead minnows were the dominant species in the Taylor Bend oxbow at RM 64. Although widespread, bullhead minnow relative composition was lower in this study when compared to historical data presented in Bart (28). 42
50 Only one species, the blacktail shiner, was identified by both studies as increasing. Current study totals confirm blacktail shiner as the numerically dominant species in the assemblage (3.1% of all fish collected). They were captured at every site, and exhibited the highest relative composition at RM 12 (81.5%). Although blacktail shiner has apparently increased in abundance through time, relative composition of minnows (family Cyprinidae) in general was considerably lower in this study when compared to datasets presented in the studies above. Bonner and Runyan (27) reported that 93% of the fishes in their lower Sabine River dataset (183 collections taken from ) were in the family Cyprinidae. Similarly, Bart (28) stated that cyprinids comprised 8 95% of the overall catch, depending on river segment. Based on the study totals from this study, cyprinids comprised 39.1% of all fish collected. Declines in Cyprinidae were accompanied by increases in relative composition of Centrarchidae (sunfish and bass), Atherinopsidae (silversides), and Clupeidae (shads) (Figure 5.4-1). Other, 1.9 Mugilidae, 1.4 Clupeidae, 11.1 Cyprinidae, 39.1 Atherinopsidae, 24.4 Percidae,.6 Centrarchidae, 16.3 Poeciliidae, 1.6 Ictaluridae, 1. Fundulidae,.7 Catostomidae, 1.8 Figure Percent relative composition of fish families collected from the lower Sabine River using all sampling techniques. Sampling technique can have a large influence on species captured. For example, cover-oriented fishes such as sunfish and black bass (Centrarchidae) are most effectively sampled with electrofishing. In contrast, smaller-bodied fishes such as minnows (Cyprinidae) and topminnows (Fundulidae) are often more easily captured with seines. The current study relied on a variety of techniques (boat and barge electrofishing, seining, gill netting, hoop netting) in order to most efficiently sample the resident fish community. However, earlier historical collections were conducted primarily with seines (Bart 28). Therefore, a similar analysis was done which only included fishes captured while seining (Figure 5.4-2). 43
51 Clupeidae, 4.5 Other,.5 Atherinopsidae, 3.2 Cyprinidae, 52. Percidae,.3 Centrarchidae, 8.1 Poeciliidae, 2.5 Fundulidae, 1.1 Catostomidae,.8 Figure Percent relative composition of fish families collected from the lower Sabine River using seines. Based on analysis of seine data only, contributions from Centrarchidae and Clupeidae are minimized, whereas, contributions from Cyprinidae and Atherinopsidae increased. Relative composition of Cyprinidae increased from 39.1% to 52.%. Relative composition of Atherinopsidae increased from 24.4% to 3.2%. Inland silversides are commonly collected within or in close proximity to large reservoirs in the region and represented 23.1% of all fish captured in this study. They were most abundant in the upper five sites closest to Toledo Bend Dam. This study focused on the lower Sabine River immediately below Toledo Bend Dam down to RM 64, and showed that abundance of inland silverside declines in the lower portion of the study area (see section 4.6.1). The datasets used in the previous studies were taken from a much broader area of the lower Sabine River which likely focused less on the area immediately below the dam where abundance of inland silversides was highest. Such spatial differences in collection locations might explain some of the differences observed between this study and others. Therefore, a third analysis was conducted which compared the proportional representation of the dominant families based on seine data from the lower five sites (RM 64 RM 12) (Figure 5.4-3). 44
52 Poeciliidae,.2 Percidae,.7 Centrarchidae, 4. Atherinopsidae, 1.2 Clupeidae,.8 Other,.4 Fundulidae,.4 Catostomidae, 2.7 Cyprinidae, 89.7 Figure Percent relative composition of fish families collected from the lower five sites (RM 64 - RM 12) using seines. When only seine data from the lower five sites are analyzed, the relative composition of Cyprinidae (89.7%) was similar to that reported by Bonner and Runyan (27) (93%) and Bart (28) (8 95%). The second most abundant family was Centrarchidae (4.%), followed by Catostomidae (2.7%). Due to the much lower abundance of inland silversides in this downstream reach, relative composition of Atherinopsidae was only 1.2%. Given that the above dataset (seine data from lower five sites) was similar in family composition to the dataset presented by Bart (28), it was broken down further to assess changes in cyprinid species composition (Figure 5.4-4). Based on comparison to similar charts for previous time periods presented by Bart (28), abundance of blacktail shiner has increased and abundance of red shiner, ghost shiner, and shoal chub have all apparently declined. 45
53 pugnose minnow,.1 mimic shiner,.7 bullhead minnow, 4.7 Other, 1.3 weed shiner, 12. Sabine shiner, 2.5 Mississippi silvery minnow, 1.1 blacktail shiner, 68.6 Figure Percent relative composition of cyprinid species and other fish captured from the lower five sites (RM 64 - RM 12) using seines. In summary, comparisons of the current dataset with historical data confirm trends in species abundance documented in previous studies. However, sampling technique can greatly influence species collected. Similarly, given longitudinal trends in community composition common in large river systems, exact sampling location can also have a large influence on fish community data. These factors should be taken into account when making comparisons between datasets. 5.5 Comparisons with Other Rivers The trends observed above are similar to those observed by other researchers on a regional or statewide scale. Anderson et al. (1995) compared Texas fish collections from the same localities in 1953 and 1986 and noted a decrease over time in relative proportion of Cyprinidae and an increase over time in the relative proportion of Atherinidae, Clupeidae, and Poeciliidae when examined on a statewide and regional (east and west) scale. However, it was also noted that relative abundance/composition of cyprinids in their dataset actually increased slightly in the Sabine drainage, whereas it decreased in all other east Texas drainages. This may have been a function of sampling locations, as local changes to habitat conditions impact assemblage structure more than basin-wide conditions (Hubbs et al. 1997). 6 Summary In summary, Downstream Fishery Resource Sampling was conducted as specified in the Lower Sabine River Water Quality and Aquatic Resources Study Plan. Sampling began in September 29 with the 46
54 first Critical Period fish community sampling event, and was concluded in January 211 with the last monthly American eel monitoring trip. Four intensive fish community sampling events (September 29, December 29, April 21, and July 21) were completed, along with Species-specific sampling of blue suckers and American eels. This effort documented a diverse assemblage of fishes in the study area comprised of 23 families and 75 species. As expected in a large river system, longitudinal trends in community composition were evident. These trends were most notable in minnows (Cyprinidae) and silversides (Atherinopsidae), which is similar to what has been noted throughout Texas by other researchers. Seasonal patterns in the fish community were difficult to discern based on one year of sampling under variable hydrological conditions. This study documented blacktail shiners as abundant in the system and other cyprinid species such as red shiner, ghost shiner, and shoal chub to be rare, and thus, generally supports conclusions drawn from other recent studies which examined historical changes in fish community of the lower Sabine River. However, given longitudinal trends in species composition and the influence of varying gear types on species collected, such comparisons should be considered with caution. 47
55 7 Literature Cited Adams, S. R., M. B. Flinn, B. M. Burr, M. R. Whiles, and J. E. Garvey. 26. Ecology of larval blue sucker (Cycleptus elongatus) in the Mississippi River. Ecology of Freshwater Fish 15: Anderson, A. A., C. Hubbs, K. O. Winemiller, and R. J. Edwards Texas freshwater fish assemblages following three decades of environmental change. The Southwestern Naturalist 4(3): Anderson, R. O., and R. M. Neumann Length, weight, and associated structural indices. Pages in B. R. Murphy and D. W. Willis, editors. Fisheries Techniques, 2 nd edition. American Fisheries Society, Bethesda, Maryland. Bart, H. L. 28. Extraction, analysis, and summary of fish community data from the Sabine River System (Louisiana, Texas). Final Report to Sabine River Authority of Texas. July 8, 28. BIO-WEST. 28. Lower Colorado River, Texas Instream Flow Guidelines. Colorado River Flow Relationships to Aquatic Habitat and State Threatened Species: Blue Sucker. Technical report prepared for the Lower Colorado River Authority and San Antonio Water System. March 28. Bonner, T., and D. T. Runyan. 27. Fish assemblage changes in three Western Gulf Slope drainages. Final Report to the Texas Water Development Board ( ). Submitted July 31, 27. Cairns, D. K., V. Tremblay, F. Caron, J. M. Casselman, G. Verreault, B. M. Jessop, Y. de Lafontaine, R. G. Bradford, R. Verdon, P. Dumont, Y. Mailhot, J. Zhu, A. Mathers, K. Oliveira, K. Benhalima, J. P. Dietrich, J. A. Hallett, and M. Lagace. 28. American eel abundance indicators in Canada. Canadian Data Report of Fisheries and Aquatic Sciences 127. Etnier, D., and W. Starnes The Fishes of Tennessee. University of Tennessee Press, Knoxville, TN. Fisher, S. J., and D. W. Willis. 2. Observations of age- blue sucker, Cycleptus elongatus utilizing an Upper Missouri River backwater. Journal of Freshwater Ecology 15(3): Goodwin, K. R., and P. L. Angermeier. 23. Demographic characteristics of American eel in the Potomac River drainage, Virginia. Transactions of the American Fisheries Society 132: Hubbs, C., E. Marsh-Matthews, W.J. Matthews, and A. A. Anderson Changes in fish assemblages in east Texas streams from 1953 to Texas Journal of Science 49(3) Supplement: Kwak, T. J., and J. T. Peterson. 27. Community indices, parameters, and comparisons. Pages in C. S. Guy and M. L. Brown, editors. Analysis and interpretation of freshwater fisheries data. American Fisheries Society, Bethesda, Maryland. Linam, G. W., and L. J. Kleinsasser Classification of Texas freshwater fishes into trophic and tolerance groups. River Studies Report No. 14, Resource Protection Division, Texas Parks and Wildlife Department, Austin, Texas. 48
56 McInerny, M. C., and J. W. Held Collections of young-of-the-year blue suckers (Cycleptus elongatus) in Navigation Pool 9 of the Upper Mississippi River. Transactions of the Wisconsin Academy of Sciences, Arts and Letters 76: Morey, N. M., and C. R. Berry, Jr. 23. Biological characteristics of the blue sucker in the James River and the Big Sioux River, South Dakota. Journal of Freshwater Ecology 18(1): Moriarty, L. J., and K. O. Winemiller Spatial and temporal variation in fish assemblage structure in Village Creek, Hardin County, Texas. Texas Journal of Science 49: Moss, R. E., J. W. Scanlan, and C. S. Anderson Observations on the natural history of the blue sucker (Cycleptus elongatus Le Sueur) in the Neosho River. The American Midland Naturalist 19(1): Peterson, M. S., L. C. Nicholson, D. J. Snyder, and G. L. Fulling Growth, spawning preparedness, and diet of Cycleptus meridionalis (Catostomidae). Transactions of the American Fisheries Society 128:9-98. Phillips, J. D. 27. Geomorphic controls and transition zones in the lower Sabine River. Hydrological Processes. Published online in Wiley InterScience. Rupprecht, R. J., and L. A. Jahn Biological notes on blue suckers in the Mississippi River. Transactions of the American Fisheries Society 19: Savoie, L. B., and K. L. Casanova A study of areal and seasonal abundance of the American eel (Anguilla rostrata) at selected sites in southeastern coastal Louisiana. Technical Bulletin No. 34, Louisiana Department of Wildlife and Fisheries, New Orleans, Louisiana. Thomas, C., T. H. Bonner, and B. G. Whiteside. 27. Freshwater Fishes of Texas. Texas A&M University Press, College Station, Texas. 22 pp. 49
57 Appendix A. Study Site Maps Maps of each study site with GPS sampling locations are presented below. Sampling locations (location of seine haul, electrofishing start/stop point, location of gill net, etc.) are color coded per sampling event. It is important to note that flow conditions on background imagery are different than those observed while sampling, and therefore, some sampling points may appear slightly above the water line. 5
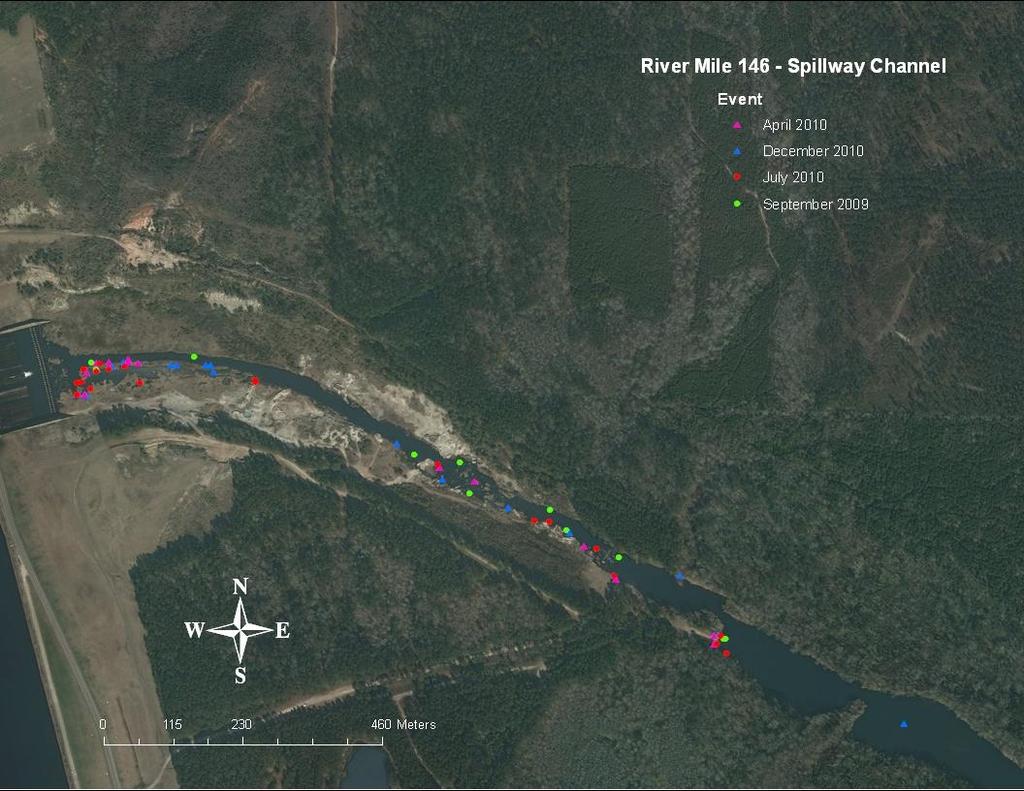
58 51

59 52

60 53

61 54

62 55

63 56

64 57

65 58

66 59

67 6
MISSISSIPPI LEGISLATURE REGULAR SESSION 2007
 MISSISSIPPI LEGISLATURE REGULAR SESSION 2007 By: Representative Robinson (84th) To: Wildlife, Fisheries and Parks HOUSE BILL NO. 911 (As Sent to Governor) 1 2 3 4 5 6 7 8 9 10 11 12 13 14 15 16 17 18 19
Select Stream Fishes of North Texas
 Select Stream Fishes of North Texas Greg Conley, Pollution Biologist Adam Whisenant, Regional Biologist Texas Parks and Wildlife Department Kills and Spills Team 11810 FM 848 Tyler, Texas 75707 Fish ID
MESOHABITAT USE AND COMMUNITY STRUCTURE
 MESOHABITAT USE AND COMMUNITY STRUCTURE OF BRAZOS RIVER FISHES IN THE VICINITY OF THE PROPOSED ALLENS CREEK RESERVOIR Submitted to: Texas Water Development Board P.O. Box, Capitol Station 7 N. Congress
CLASSIFICATION OF OKLAHOMA RIVERS AND PRELIMINARY DEVELOPMENT OF AN INDEX OF BIOTIC INTEGRITY
 CLASSIFICATION OF OKLAHOMA RIVERS AND PRELIMINARY DEVELOPMENT OF AN INDEX OF BIOTIC INTEGRITY Jeroen Gerritsen, T Michael T. Barbour, T Charles A. Potts, OKWR Oklahoma Streams (RF) Oklahoma Watersheds
Fish community assessment in the Harpeth River prior to the removal of the dam at Franklin, TN
 Fish community assessment in the Harpeth River prior to the removal of the dam at Franklin, TN Submitted to Dorie Bolze, Harpeth River Watershed Association By Frank Fiss and Nathan Singer, Tennessee Wildlife
Survey for Fishes in Freeman Creek System and North River, Fayette and Tuscaloosa Counties, Alabama, on 26 May Submitted to:
 Survey for Fishes in Freeman Creek System and North River, Fayette and Tuscaloosa Counties, Alabama, on 26 May 2012 Submitted to: Mike Watts 15439 Byler Trace Northport, AL By: Bernard R. Kuhajda, Ph.D.
BASELINE FISH COMMUNITY STUDY REPORT
 BASELINE FISH COMMUNITY STUDY REPORT BLALOCK HYDROELECTRIC PROJECT FERC NO. 14338 Prepared for: Spartanburg Water System Spartanburg, South Carolina Prepared by: Lexington, South Carolina www.kleinschmidtgroup.com
Lower San Antonio River Watershed Instream Flows Study Biological Collection Summary Report Prepared by
 Lower San Antonio River Watershed Instream Flows Study Biological Collection Summary Report Prepared by San Antonio River Authority Environmental Services Department 100 E Guenther P.O. Box 839980 San
Tips for Identifying Common Fish Species in the Bush River
 Tips for Identifying Common Fish Species in the Bush River The Herrings (Family Clupeidae) Alewife (Alosa psuedoharengus) American shad (Alosa sapidissima) Blueback herring (Alosa aestivalis) Atlantic
Arizona Game and Fish Department Region VI Fisheries Program
 Arizona Game and Fish Department Region VI Fisheries Program Saguaro Lake Fish Survey Report April 18 th 21 st, 2016 Author: Bryant Dickens Report Date: July 7, 2016 The Arizona Game and Fish Department
John K. Tucker Illinois Natural History Survey 1005 Edwardsville Road Wood River, Illinois USA
 Transactions of the Illinois State Academy of Science (1994), Volume 87, 1 and 2, pp. 99-109 Checklist of the Freshwater Fishes of the Little Wabash River Drainage in Effingham County, Illinois with Comments
Thunder Bay River Assessment Appendix. Appendix 2
 Appendix 2 Known past and present fish distributions in the River system. Distribution of fishes were compiled from Bailey et al. (2003) and from records located at the Michigan Department of Natural Resources
Andreas Moshogianis, Theryn Henkel*, John Lopez, and Andrew Baker LAKE PONTCHARTRAIN BASIN FOUNDATION
 Understanding the composition, utilization and coexistence of fresh and saltwater species in Mardi Gras Pass: A new and evolving distributary of the Mississippi River in SE Louisiana Andreas Moshogianis,
THE LONG-TERM ILLINOIS RIVER FISH POPULATION MONITORING PROGRAM
 T E C H N I C A L R E P O R T THE LONG-TERM ILLINOIS RIVER FISH POPULATION MONITORING PROGRAM Project F-101-R-20 Annual Report to the Illinois Department of Natural Resources Michael A. McClelland and
Annotated Checklist of the Fishes of the Rio Grande Drainage, Dona Ana, El Paso, and Hudspeth Counties
 Annotated Checklist of the Fishes of the Rio Grande Drainage, Dona Ana, El Paso, and Hudspeth Counties Laboratory for Environmental Biology, Centennial Museum, University of Texas at El Paso An Informal,
Fish community assessment of the Harpeth River before and after a habitat restoration project in Franklin, Tennessee
 Fish community assessment of the Harpeth River before and after a habitat restoration project in Franklin, Tennessee Submitted to the Southeast Aquatic Resources Partnership and Harpeth River Watershed
Investigating reproduction and abundance of bighead carp (Hypophthalmichthys nobilis) and silver carp (H. molitrix) in the Greenup pool, Ohio River
 and silver carp (H. molitrix) in the Greenup pool, Ohio River") Investigating reproduction and abundance of bighead carp (Hypophthalmichthys nobilis) and silver carp (H. molitrix) in the Greenup pool, Ohio River Nathan Fleshman Dr. Thomas Jones Photo: USGS Photo: USGS
Investigating reproduction and abundance of bighead carp (Hypophthalmichthys nobilis) and silver carp (H. molitrix) in the Greenup pool, Ohio River Nathan Fleshman Dr. Thomas Jones Photo: USGS Photo: USGS
GEOLOGICAL SURVEY OF ALABAMA
 GEOLOGICAL SURVEY OF ALABAMA Berry H. (Nick) Tew, Jr. State Geologist A SURVEY OF ALABAMA S COASTAL RIVERS AND STREAMS FOR FISHES OF CONSERVATION CONCERN OPEN-FILE REPORT 0502 by Patrick E. O'Neil, Thomas
MINNESOTA DEPARTMENT OF NATURAL RESOURCES DIVISION OF FISH AND WILDLIFE SECTION OF FISHERIES. Completion Report
 This document is made available electronically by the Minnesota Legislative Reference Library as part of an ongoing digital archiving project. http://www.leg.state.mn.us/lrl/lrl.asp Minnesota F-29-R(P)-26
I L L I N 0 PRODUCTION NOTE. University of Illinois at Urbana-Champaign Library Large-scale Digitization Project, 2007.
 I L L I N S UNIVERSITY OF ILLINOIS AT URBA-CHAMPAIGN PRODUCTION NOTE University of Illinois at Urbana-Champaign Library Large-scale Digitization Project, 7. Uf'HS cft, Natural History Survey Library Illinois
Delaware River Seine Survey: 2012 Sampling Summary
 Delaware River Seine Survey: 2012 Sampling Summary Fish and Wildlife employees pull in the seine net From June 18 to November 21, 2012, biologists conducted the Delaware River Seine Survey. Over the course
MINNESOTA DEPARTMENT OF NATURAL RESOURCES DIVISION OF FISHERIES AND WILDLIFE. Gamefish Assessment Report
 Minnesota DNR F-29-R(P) Area F312 February 1, 2013 MINNESOTA DEPARTMENT OF NATURAL RESOURCES DIVISION OF FISHERIES AND WILDLIFE Gamefish Assessment Report Spring Gamefish Assessment on the Mississippi
Rouge Fish Surveys
 Rouge Fish Surveys 2011-16 Friends of the Rouge January 2017 Partially funded by the Areas of Concern Program Office of the Great Lakes (OGL), DEQ Additional data provided by MDNR and MDEQ Fall 2016 Sampling
Fish Communities in Five West Coast Spring-fed Rivers. Brandon Simcox, Eric Johnson, Amanda Schworm, Bill Pouder
 Fish Communities in Five West Coast Spring-fed Rivers Brandon Simcox, Eric Johnson, Amanda Schworm, Bill Pouder Project Overview FWC/SWFWMD partnership 3-yr funded project (thru June 2017) 5 spring-fed
Conewago Creek Initiative. Fish Survey Report for the Conewago Creek
 Conewago Creek Initiative Fish Survey Report for the Conewago Creek A compilation of historic fish survey data from 97, 973, 7, for three locations along the Conewago Creek Prepared by Kristen Kyler for
An Assessment of the Fish Community in Lake Acworth
 An Assessment of the Fish Community in Lake Acworth By John Damer Fisheries Biologist Georgia Department of Natural Resources Wildlife Resources Division Fisheries Section Calhoun, GA 30701 July 2008 Introduction
LOUISIANA DEPARTMENT OF WILDLIFE & FISHERIES
 LOUISIANA DEPARTMENT OF WILDLIFE & FISHERIES OFFICE OF FISHERIES INLAND FISHERIES SECTION PART VI B WATERBODY MANAGEMENT PLAN SERIES LAKE FIELDS-LAKE LONG COMPLEX WATERBODY EVALUATION & RECOMMENDATIONS
FISHES AND STREAMS RECLAIMED AFTER PHOSPHATE MINING THOMAS H. FRASER
 FISHES AND STREAMS RECLAIMED AFTER PHOSPHATE MINING BY THOMAS H. FRASER 2052 VIRGINIA AVENUE W. DEXTER BENDER AND ASSOCIATES, INC. FORT MYERS, FLORIDA 33901 DECEMBER, 2003 INTRODUCTION Phosphate mining
Conewago Creek Initiative
 Conewago Creek Initiative The Conewago Creek Revisited Fish Survey Report A compilation of historic fish survey data from 197, 1973, 7, 1, and 15 for three locations along the Conewago Creek Prepared by
Survival of razorback sucker stocked into the lower Colorado River
 Survival of razorback sucker stocked into the lower Colorado River Trip Report 2-6: Palo Verde and Cibola Divisions 9-13 and 23-27 October 2006 Prepared by Brian R. Kesner and Joshua R. Campbell Submitted
DISTRIBUTION AND HABITAT USE OF THE ARKANSAS RIVER SHINER IN THE NORTH CANADIAN RIVER, OKLAHOMA
 DISTRIBUTION AND HABITAT USE OF THE ARKANSAS RIVER SHINER IN THE NORTH CANADIAN RIVER, OKLAHOMA Gene R. Wilde Department of Range, Wildlife, and Fisheries Management Texas Tech University Lubbock, TX 79409
2014 Threatened and Endangered Fish Survey of. East Loon Lake and West Loon Lake. Lake County, Illinois
 2014 Threatened and Endangered Fish Survey of East Loon Lake and West Loon Lake Lake County, Illinois Prepared by Integrated Lakes Management 120 LeBaron St. Waukegan, IL 60085. Chris Ryan Chris Rysso
Columbia Lake Dam Removal Project
 Columbia Lake Dam Removal Project The Columbia Lake dam located 1/4 mile upstream of the Paulins Kill River's confluence with the Delaware River in Knowlton Township, Warren County has been proposed for
FISHES OF THE KNIFE LAKE WATERSHED IN KANABEC AND MILLE LACS COUNTIES OF MINNESOTA. Konrad Schmidt, Vice-President
 Conservation Biology Research Grants Program Division of Ecological Services Minnesota Department of Natural Resources FISHES OF THE KNIFE LAKE WATERSHED IN KANABEC AND MILLE LACS COUNTIES OF MINNESOTA
TOLEDO BEND PROJECT FERC NO DRAFT LICENSE APPLICATION EXHIBIT E - ENVIRONMENTAL EXHIBIT 3.5 FISH AND AQUATIC RESOURCES.
 TOLEDO BEND PROJECT FERC NO. 0 DRAFT LICENSE APPLICATION EHIBIT E - ENVIRONMENTAL EHIBIT. FISH AND AQUATIC RESOURCES May 0 Copyright 0. Sabine River Authority of Texas and Sabine River Authority, State
Tittabawassee River Assessment. Miles. Gladwin Smallwood Impoundment. Harrison. Clare. Midland. Mt. Pleasant. St. Louis. Saginaw.
 Warmouth Lepomis gulosus feeding - clear lakes and impoundments and very low-gradient streams - abundant aquatic vegetation - silt-free water - mucky substrate often covered with organic debris spawning
Caro Impoundment, Tuscola County
 Caro Impoundment is a 200 acre impoundment of the Cass River located one mile south of the Village of Caro in Tuscola County. Caro Dam, originally constructed in 1906 for water supply to Michigan Sugar
Flint River Assessment Appendix
 14 Appendix 3 Distribution Maps of Fish Species This appendix contains maps of past and known present fish distributions within the River watershed. The distributions of fish species were compiled from
MISSISSIPPI MAKEOVER A Plan for Restoration, Just Around the Bend
 MISSISSIPPI MAKEOVER A Plan for Restoration, Just Around the Bend Interim Report Card 2013 Project coordinated by the Dakota County Soil and Water Conservation District and sponsored by the Minnesota Pollution
Tips for Identifying Common Fish Species in the Bush River
 Tips for Identifying Common Fish Species in the Bush River Juvenile Largemouth bass Spot Threadfin shad Juvenile White perch The Herrings (Family Clupeidae) Alewife American shad Blueback herring Atlantic
Pearl River 2018 Middle Reach REEL FACTS Dustin Rodgers Fisheries Biologist
 Pearl River 1 Middle Reach REEL FACTS Dustin Rodgers Fisheries Biologist dustinr@mdwfp.state.ms.us General Information: The Pearl River contains the third largest drainage basin in Mississippi. A variety
GEOLOGICAL SURVEY OF ALABAMA
 GEOLOGICAL SURVEY OF ALABAMA Berry H. (Nick) Tew, Jr. State Geologist WATER INVESTIGATIONS PROGRAM A SURVEY OF ALABAMA S COASTAL RIVERS AND STREAMS FOR FISHES OF CONSERVATION CONCERN, 2004-05 OPEN-FILE
HURON RIVER WATERSHED
 Brown bullhead (Ameiurus nebulosus) feeding - larger streams and rivers, lakes and impoundments - clear cool water with little clayey silt - moderate amounts of aquatic vegetation - sand, gravel, or muck
Fish Survey of Arctic Lake (ID # ), Scott County, Minnesota in 2012
, Scott County, Minnesota in 2012") Snapping Turtle from Arctic Lake, September 2012 Fish Survey of Arctic Lake (ID #70-0085), Scott County, Minnesota in 2012 Survey Dates: September 18-20, 2012 MnDNR Permit Number: 18362 Prepared for: Shakopee
Snapping Turtle from Arctic Lake, September 2012 Fish Survey of Arctic Lake (ID #70-0085), Scott County, Minnesota in 2012 Survey Dates: September 18-20, 2012 MnDNR Permit Number: 18362 Prepared for: Shakopee
Little Calumet River Rapid Response Fish Identification and Enumeration Branch Summary Report
 Little Calumet River Rapid Response Fish Identification and Enumeration Branch Summary Report Introduction A rotenone rapid response was completed on a 2.6-mile section of the Little Calumet River immediately
Quillback (Carpoides cyprinus)
") t. Joseph Assessment Appendix Quillback (Carpoides cyprinus) feeding - clear to turbid water - Michigan - sand, sandy gravel, sandy silt, or clay-silt substrate - medium- to low-gradient rivers and streams;
t. Joseph Assessment Appendix Quillback (Carpoides cyprinus) feeding - clear to turbid water - Michigan - sand, sandy gravel, sandy silt, or clay-silt substrate - medium- to low-gradient rivers and streams;
Lake St. Clair Fish Community and Fishery
 Lake St. Clair Fish Community and Fishery Megan Belore Ontario Ministry of Natural Resources and Forestry Mike Thomas Michigan Department of Natural Resources Fish Community Fish Community Mixture of warm
EVALUATION OF THE FISH COMMUNITY AND GAME FISH POPULATIONS IN SUGAR CREEK (MONTGOMERY AND PARKE COUNTIES)
") EVALUATION OF THE FISH COMMUNITY AND GAME FISH POPULATIONS IN SUGAR CREEK (MONTGOMERY AND PARKE COUNTIES) 2000 Fish Management Report Douglas C. Keller Fisheries Biologist FISHERIES SECTION INDIANA DEPARTMENT
EVALUATION OF THE FISH COMMUNITY AND GAME FISH POPULATIONS IN SUGAR CREEK (MONTGOMERY AND PARKE COUNTIES) 2000 Fish Management Report Douglas C. Keller Fisheries Biologist FISHERIES SECTION INDIANA DEPARTMENT
MIDDLE FORK RESERVOIR Wayne County 2004 Fish Management Report. Christopher C. Long Assistant Fisheries Biologist
 MIDDLE FORK RESERVOIR Wayne County 2004 Fish Management Report Christopher C. Long Assistant Fisheries Biologist FISHERIES SECTION INDIANA DEPARTMENT OF NATURAL RESOURCES DIVISION OF FISH AND WILDLIFE
LAKE DIANE Hillsdale County (T8-9S, R3W, Sections 34, 3, 4) Surveyed May Jeffrey J. Braunscheidel
 Surveyed May Jeffrey J. Braunscheidel") Michigan Department of Natural Resources Status of the Fishery Resource Report No. 2003-4, 2003 LAKE DIANE Hillsdale County (T8-9S, R3W, Sections 34, 3, 4) Surveyed May 2001 Jeffrey J. Braunscheidel Environment
Michigan Department of Natural Resources Status of the Fishery Resource Report No. 2003-4, 2003 LAKE DIANE Hillsdale County (T8-9S, R3W, Sections 34, 3, 4) Surveyed May 2001 Jeffrey J. Braunscheidel Environment
Quemahoning Reservoir
 Pennsylvania Fish & Boat Commission Biologist Report Quemahoning Reservoir Somerset County May 2011 Trap Net, Gill Net and Electrofishing Survey Quemahoning Reservoir is an 899 acre impoundment located
APPENDIX A bay pipefish Sygnathus leptorhynchus California halibut Paralichthys californicus Chinook salmon Oncorhynchus tshawytscha
 APPENDIX A Total number of fishes caught in Marsh by otter trawl, beach seine, midwater trawl, and all methods from 1979 to 2013 (native species in bold). Common Name Scientific Name Otter Trawl Beach
UPDATED SURVEY OF THE FISHES OF THE POTEAU RIVER, OKLAHOMA AND ARKANSAS
 42 UPDATED SURVEY OF THE FISHES OF THE POTEAU RIVER, OKLAHOMA AND ARKANSAS Hague L. Lindsey*, James C. Randolph and John Carroll Faculty of Natural Sciences, University of Tulsa*, Tulsa, OK, and Corps
Evaluation of Newbury Weirs (Rock Riffles) for Improving Habitat Quality and Biotic Diversity in Illinois Streams.
 for Improving Habitat Quality and Biotic Diversity in Illinois Streams.") Evaluation of Newbury Weirs (Rock Riffles) for Improving Habitat Quality and Biotic Diversity in Illinois Streams. Report submitted to The Wildlife Preservation Fund Illinois Department of Natural Resources
Evaluation of Newbury Weirs (Rock Riffles) for Improving Habitat Quality and Biotic Diversity in Illinois Streams. Report submitted to The Wildlife Preservation Fund Illinois Department of Natural Resources
Fish Survey of Nathan s Lake, Boyer Chute National Wildlife Refuge. Corey Lee, Fisheries Technician William Davison, Fisheries Technician
 Fish Survey of Nathan s Lake, Boyer Chute National Wildlife Refuge Corey Lee, Fisheries Technician William Davison, Fisheries Technician U.S. Fish and Wildlife Service Columbia Fishery Resources Office
Crooked Lake Oakland County (T4N, R9E, Sections 3, 4, 9) Surveyed May James T. Francis
 Surveyed May James T. Francis") Michigan Department of Natural Resources Status of the Fishery Resource Report No. 2004-1, 2004 Crooked Lake Oakland County (T4N, R9E, Sections 3, 4, 9) Surveyed May 2002 James T. Francis Environment Crooked
Michigan Department of Natural Resources Status of the Fishery Resource Report No. 2004-1, 2004 Crooked Lake Oakland County (T4N, R9E, Sections 3, 4, 9) Surveyed May 2002 James T. Francis Environment Crooked
Rat Cove and Brookwood Point littoral fish survey, 2002
 Rat Cove and Brookwood Point littoral fish survey, 2 Katie Wayman 1 INTRODUCTION During the summer of 2, efforts to monitor the Otsego Lake littoral fish community continued with trap netting at both Rat
The Keep. Eastern Illinois University
 Eastern Illinois University The Keep Masters Theses Student Theses & Publications 1-1-1989 Growth Increments and Condition Factors of Pomoxis annularis (White Crappie) in the Years Following Completion
1165 S Hwy 191, Suite S 2350 W Moab, UT Vernal, UT
 COLORADO RIVER RECOVERY PROGRAM FY 2018 ANNUAL PROJECT REPORT RECOVERY PROGRAM PROJECT NUMBER: C29a/138 I. Project Title: Green River Canal Company (GRCC) Canal Salvage II. Bureau of Reclamation Agreement
JadEco, LLC PO BOX 445 Shannon, IL 61078
 Introduction: With the assistance of Lake Holiday staff and volunteers, we were able to conduct an AC electrofishing survey on May 8, 27. Water temperatures were 2.3 C (8.5 F) and water clarity was decent
Fishes of Vermont Vermont Natural Heritage Inventory Vermont Fish & Wildlife Department 22 March 2017
 Fishes of Vermont Vermont Natural Heritage Inventory Vermont Fish & Wildlife Department 22 March 2017 The following is a list of fish species known to regularly occur in Vermont. Historic species (not
Full Project Proposal
 PROJECT NAME: FIELD OFFICE: Full Project Proposal NFPP Phase I - Ferson-Otter Creek Dam Removal/Modification Project, Fox River Watershed, Illinois Carterville NFWCO PROJECT COORDINATOR: Nate Caswell FONS
LOUISIANA DEPARTMENT OF WILDLIFE & FISHERIES
 LOUISIANA DEPARTMENT OF WILDLIFE & FISHERIES OFFICE OF FISHERIES INLAND FISHERIES SECTION PART VI -A WATERBODY MANAGEMENT PLAN SERIES LAKE FIELDS, LAKE LONG COMPLEX HISTORY & MANAGEMENT ISSUES November
The relationship between the spatial distribution of common carp and their environmental DNA in a small lake
 The relationship between the spatial distribution of common carp and their environmental DNA in a small lake Jessica Eichmiller*, Przemyslaw Bajer, and Peter Sorensen Department of Fisheries, Wildlife,
feeding - downstream sections of large rivers, lakes, and impoundments
 River Assessment Appendix Shorthead redhorse (Moxostoma macrolepidotum) feeding - downstream sections of large rivers, lakes, and impoundments - rocky substrates - swift water near riffles - clear to slightly
feeding - clear moderate-sized shallow streams with moderate vegetation spawning - nests in gravel, sand, or hard rock substrate
 orthern longear sunfish (Lepomis peltastes) feeding - clear moderate-sized shallow streams with moderate vegetation - rocky substrates - little to no current spawning - nests in gravel, sand, or hard rock
COLORADO RIVER RECOVERY PROGRAM RECOVERY PROGRAM FY 2015 ANNUAL PROJECT REPORT PROJECT NUMBER: 160
 COLORADO RIVER RECOVERY PROGRAM RECOVERY PROGRAM FY 215 ANNUAL PROJECT REPORT PROJECT NUMBER: 16 I. Project Title: Assessment of Stocked Razorback Sucker Reproduction in the Lower Green and Lower Colorado
Moon Lake 2018 REEL FACTS Nathan Aycock - Fisheries Biologist (601)
") Moon Lake 18 REEL FACTS Nathan Aycock - Fisheries Biologist NathanA@mdwfp.state.ms.us (61) 43- General Information: Moon Lake is a,3 acre oxbow lake of the Mississippi River. The primary inflow to the
Moon Lake 18 REEL FACTS Nathan Aycock - Fisheries Biologist NathanA@mdwfp.state.ms.us (61) 43- General Information: Moon Lake is a,3 acre oxbow lake of the Mississippi River. The primary inflow to the
Proposed Reclassification of Cherry Creek, North Platte River Basin, Wyoming. October 25, 2010
 Proposed Reclassification of Cherry Creek, North Platte River Basin, Wyoming October 25, 2010 Waterbody: Location: Tributary to: Cherry Creek - Mainstem from headwaters downstream to the confluence with
INVASIVE CARP SAMPLING REPORT JANUARY DECEMBER 2016 MINNESOTA DEPARTMENT OF NATURAL RESOURCES DIVISION OF FISH AND WILDLIFE SECTION OF FISHERIES
 INVASIVE CARP SAMPLING REPORT JANUARY DECEMBER 2016 MINNESOTA DEPARTMENT OF NATURAL RESOURCES DIVISION OF FISH AND WILDLIFE SECTION OF FISHERIES UPPER MISSISSIPPI RIVER, POOLS 1-5 LOWER ST. CROIX RIVER,
ROANOKE RAPIDS LAKE CREEL SURVEY,
 ROANOKE RAPIDS LAKE CREEL SURVEY, 2013 2014 Federal Aid in Sport Fish Restoration Project F-108 Summary Report P-2009 Article 422 Kirk R. Rundle William J. Collart N. Corey Oakley Brian J. McRae North
Fisheries Survey of Saratoga Lake
 Fisheries Survey of Saratoga Lake 7- Mark D. Cornwell Kevin Poole State University of New York College of Agriculture & Technology Department of Fisheries & Wildlife Cobleskill, NY ABSTRACT: This survey
SUMMARY OF CONOWINGO DAM WEST FISH LIFT OPERATIONS 2012
 SUMMARY OF CONOWINGO DAM WEST FISH LIFT OPERATIONS 2012 Michael L. Hendricks Pennsylvania Fish and Boat Commission 1735 Shiloh Rd. State College, Pa 16801 INTRODUCTION The shore-based trapping device at
MARTINDALE POND Wayne County 2004 Fish Management Report. Christopher C. Long Assistant Fisheries Biologist
 MARTINDALE POND Wayne County 2004 Fish Management Report Christopher C. Long Assistant Fisheries Biologist Fisheries Section Indiana Department of Natural Resources Division of Fish and Wildlife I.G.C.
SUMMARY REPORT FOR LAKE ST. MALO FISHERIES ASSESSMENT. Prepared for the St. Malo and District Wildlife Association
 SUMMARY REPORT FOR LAKE ST. MALO FISHERIES ASSESSMENT Prepared for the St. Malo and District Wildlife Association Presented by August 25, 2014 Study dates thus far: Date Tasks February 16 Fishing derby;
Job 1 Part JOB 1, PART 2: SUMMARY OF CONOWINGO DAM WEST FISH LIFT OPERATIONS, 2009
 2.0 JOB 1, PART 2: SUMMARY OF CONOWINGO DAM WEST FISH LIFT OPERATIONS, 2009 Lawrence M. Miller Normandeau Associates U. S. Fish and Wildlife Service 1921 River Road Harrisburg, Pennsylvania Drumore, Pennsylvania
Lake LeAnn 2018 Fish Survey
 Lake LeAnn 2018 Fish Survey June 21, 2018 Prepared for: Lake LeAnn Property Owners Association Prepared by: ADVANCED ECOLOGICAL MANAGEMENT 22071 7 Mile Road Reed City, MI 49677 Table of Contents 1.0 INTRODUCTION...
Trip Report: Eagle Creek, Arizona
 Trip Report: Eagle Creek, Arizona 15-17 June 2009 Participants: Abraham Karam, Brian Kesner, and Mike Childs Native Fish Lab Marsh & Associates, LLC 5016 South Ash Avenue Suite 108 Tempe, Arizona 85282
American Currents Spring 1993 Vol 19 No 1
 -22- PUTTING BACK THE PIECES by Konrad Schmidt, St. Paul, Minnesota The Knife River meanders some 25 miles through small farms and woodlands in east central Minnesota before joining the Snake River near
Cedar Lake Comprehensive Survey Report Steve Hogler and Steve Surendonk WDNR-Mishicot
 Cedar Lake- 2006 Comprehensive Survey Report Steve Hogler and Steve Surendonk WDNR-Mishicot ABSTRACT Cedar Lake is a 142 acre lake located in the southwest corner of Manitowoc County. It is a seepage lake
Survey of the Fish Populations of the Lower Cosumnes River. Amy Harris
 Survey of the Fish Populations of the Lower Cosumnes River Amy Harris Spring, 1996 1 I. Introduction The information that is available on the fish communities of the Cosumnes river consists primarily of
Appendix C Bill Cross Rapids Freshwater Mussel and Fishery Study Plan
 Appendix C Bill Cross Rapids Freshwater Mussel and Fishery Study Plan Study Plan Freshwater Mussel and Fishery Study Bill Cross Rapids Grandfather Falls Hydroelectric Project FERC Project No. 1966 March
Pascagoula River Marsh 2018 REEL FACTS Stephen Brown Fisheries Biologist
 Pascagoula River Marsh 218 REEL FACTS Stephen Brown Fisheries Biologist stephenb@mdwfp.state.ms.us General Information: The Pascagoula River marsh is 25 acres of tidal creeks, canals, bays, and streams
State of California Department of Fish and Wildlife Clear Lake Fishery and Habitat Evaluation
 State of California Department of Fish and Wildlife 2014-2015 Clear Lake Fishery and Habitat Evaluation Ben Ewing, Kassie Hickey, and Jay Rowan North Central Region High Elevation Fisheries February 17,
Nuclear Regulatory Commission Exhibit # - JTI BD01 Docket # Identified: 03/16/2009 JTI000006
 Nuclear Regulatory Commission Exhibit # JTI00000600BD0 Docket # 052000 Identified: 03/6/2009 Admitted: 03/6/2009 Rejected: Withdrawn: Stricken: JTI000006 VOGTLE ELECTRIC GENERATING PLANT SAVANNAH RIVER
I. Project Title: Upper Yampa River northern pike management and monitoring
 COLORADO RIVER RECOVERY PROGRAM FY 217 ANNUAL PROJECT REPORT RECOVERY PROGRAM PROJECT NUMBER: 98b I. Project Title: Upper Yampa River northern pike management and monitoring II. Bureau of Reclamation Agreement
NEVADA DEPARTMENT OF WILDLIFE STATEWIDE SPORT FISHERIES MANAGEMENT
 NEVADA DEPARTMENT OF WILDLIFE STATEWIDE SPORT FISHERIES MANAGEMENT FEDERAL AID JOB PROGRESS REPORT F-20-50 2014 Urban Sport Fisheries SOUTHERN REGION NEVADA DEPARTMENT OF WILDLIFE, FISHERIES DIVISION ANNUAL
Anadromous Fish Survey Cameron Run 2015
 109 Anadromous Fish Survey Cameron Run 2015 FINAL REPORT December 4, 2016 By Kim de Mutsert Assistant Professor, Department of Environmental Science and Policy George Mason University Co-Principal Investigator
WHITE RIVER BASIN SURVEY: EAST FORK WHITE RIVER, Kevin Hoffman Assistant Research Biologist
 WHITE RIVER BASIN SURVEY: EAST FORK WHITE RIVER, 2003 Kevin Hoffman Assistant Research Biologist Fisheries Section Indiana Department of Natural Resources Division of Fish and Wildlife I.G.C.-South, Room
DRIPPING SPRINGS LAKE 5 YEAR LAKE MANAGEMENT PLAN
 DRIPPING SPRINGS LAKE 5 YEAR LAKE MANAGEMENT PLAN FISHERIES DIVISION CENTRAL REGION OKLAHOMA DEPTMENT OF WILDLIFE CONSERVATION PREPARED BY: DANNY BOWEN OCTOBER 2013 1 Background Dripping Springs Lake impounds
Great Lakes Coastal Wetland Communities: Vulnerabilities to Climate Change and Response to Adaptation Strategies
 Great Lakes Coastal Wetland Communities: Vulnerabilities to Climate Change and Response to Adaptation Strategies CCAF Wetlands Study Investigators: Susan Doka Fisheries & Oceans, Great Lakes Lab for Fisheries
Herring Highway A Study of a New Fish Passage for River Herring at Rock Creek National Park
 Bridging the Watershed An Outreach Program of the Alice Ferguson Foundation in Partnership with the National Park Service and Area Schools Herring Highway A Study of a New Fish Passage for River Herring
Bonita Creek Fish Monitoring November 4 6, 2015
 Bonita Creek Fish Monitoring November 4 6, 2015 Brittany M. Woodward, Kristen G. Humphrey, and Brian R. Kesner Marsh & Associates, LLC 5016 S. Ash Avenue, Suite 108 Tempe, Arizona 85282 Submitted to Bureau
Canadian Manuscript Report of Fisheries and Aquatic Sciences 2777 SURVEY OF THE FISH ASSEMBLAGES OF ST. LAWRENCE ISLANDS NATIONAL PARK IN 2005
 Canadian Manuscript Report of Fisheries and Aquatic Sciences 2777 2006 SURVEY OF THE FISH ASSEMBLAGES OF ST. LAWRENCE ISLANDS NATIONAL PARK IN 2005 by N.E. Mandrak, J. Barnucz and D. Marson Great Lakes
Ichthyology. Texas Master Naturalist Program El Camino Real Chapter
 Ichthyology Texas Master Naturalist Program El Camino Real Chapter Ecology of Aquatic Systems (Review?) Lentic Systems Standing/non-flowing Water is retained Ponds, Lakes, Reservoirs Littoral = edge, emergent
Pennsylvania Fish & Boat Commission Biologist Report. Wilmore Dam. Cambria County. May 2011 Trap Net, Electrofishing and Hoop Net Survey
 Pennsylvania Fish & Boat Commission Biologist Report Wilmore Dam Cambria County May 2011 Trap Net, Electrofishing and Hoop Net Survey Wilmore Dam is a 195 acre impoundment located in central Cambria County
Michigan Dept. of Natural Resources Status of the Fishery Resource Report Page 1. Weber Lake Cheboygan County, T34N, R3W, Sec.
 Michigan Dept. of Natural Resources 2012-143 Status of the Fishery Resource Report Page 1 Weber Lake Cheboygan County, T34N, R3W, Sec. 31 Neal Godby, Fisheries Biologist Environment Weber Lake is a 28.5-acre
Fisheries Survey of White Rapids Flowage, Marinette County Wisconsin during Waterbody Identification Code
 Fisheries Survey of White Rapids Flowage, Marinette County Wisconsin during 25 Waterbody Identification Code 6343 Michael Donofrio Fisheries Supervisor Wisconsin Department of Natural Resources Peshtigo,
Big Bend Lake Population Survey
 Big Bend Lake Survey Located in Des Plaines on East River Rd. just south of Golf Rd. This 27 acre body of water has a depth of 27.8 feet; however because it is connected to the Des Plaines River by a spillway,
Fisheries Sampling Technical Memorandum
 Appendix C Fisheries Sampling Technical Memorandum 2016 Google MEMORANDUM TO: FROM: Tom Mahood, P.Eng., CH2M Arnie Fausto, M.Sc., and Erica Wilkinson, B.A., ERPG, Matrix Solutions Inc. SUBJECT: Fisheries