--Manuscript Draft-- bifurcations and hydraulic jumps. University of Utah Salt Lake City, UT UNITED STATES. Manuela Lehner, Ph.D.
|
|
|
- Edward Martin
- 6 years ago
- Views:
Transcription
1 Journal of Applied Meteorology and Climatology Interactions of a mesoscale katabatic flow with a small crater: Air intrusions, flow bifurcations and hydraulic jumps --Manuscript Draft-- Manuscript Number: Full Title: Article Type: Corresponding Author: Corresponding Author's Institution: First Author: Order of Authors: Interactions of a mesoscale katabatic flow with a small crater: Air intrusions, flow bifurcations and hydraulic jumps Article Charles David Whiteman, Ph.D. University of Utah Salt Lake City, UT UNITED STATES University of Utah Charles David Whiteman, Ph.D. Charles David Whiteman, Ph.D. Manuela Lehner, Ph.D. Sebastian W. Hoch, Ph.D. Bianca Adler, Ph.D. Norbert Kalthoff, Ph.D. Roland Vogt, Ph.D. Iris Feigenwinter, M.S. Matthew O. G. Hills, Ph.D. Manuscript Classifications: Abstract: 1.040: Complex terrain; 4.152: Cold pools; 4.352: Mesoscale processes; 4.444: Small scale processes; 4.488: Temperature; 5.088: Lidars/Lidar observations Observations from the Second Meteor Crater Experiment (METCRAX II) on the night of October 2013 are used to investigate the interactions between a regional scale katabatic flow and Arizona's Meteor Crater. The crater is a 1.2 km wide, 170-m-deep, near-circular basin with a rim that extends m above the surrounding plain, which is tilted upward to the southwest at a 1 angle. On clear, quiescent nights a southwesterly katabatic flow lifts cold air from the stable boundary layer (SBL) on the plain over the crater rim to produce a continuous inflow of negatively buoyant air that runs down the crater's inner sidewall. As the SBL deepens and the katabatic flow strengthens, a flow bifurcation forms above the rim with the negatively buoyant lower portion running down the inner sidewall to produce a hydraulic jump and the neutrally buoyant upper portion carried quasi-horizontally over the basin. A mesoscale flow with a downslope wind component develops in the residual layer above the SBL, increasing the speeds in the underlying katabatic flow and the vertical shear across the upper branch of the bifurcation. A shear instability leads to the development of a lee wave that brings warm air from the elevated residual layer downward into the basin. The rising air in the hydraulic jump merges with the rising air in the ascending portion of the lee wave. The strong winds penetrate to the basin floor, displacing and stirring the preexisting, intensely stable, cold pool. Suggested Reviewers: Powered by Editorial Manager and ProduXion Manager from Aries Systems Corporation
2 Copyright Form Click here to access/download Copyright Form CTF-Whiteman.pdf
3 Cost Estimation and Agreement Worksheet Click here to access/download Cost Estimation and Agreement Worksheet Cost Estimation and Agreement Worksheet.pdf
4 Manuscript (non-latex) Click here to download Manuscript (non-latex) WAI_IOP4_submitted.docx Interactions of a mesoscale katabatic flow with a small crater: Air intrusions, flow bifurcations and hydraulic jumps C. David Whiteman a, Manuela Lehner a, d, Sebastian W. Hoch a, Bianca Adler b, Norbert Kalthoff b, Roland Vogt c, Iris Feigenwinter c, Matthew O. G. Hills a, e a University of Utah, Salt Lake City, UT b Karlsruhe Institute of Technology, Karlsruhe, Germany c University of Basel, Basel, Switzerland d Present affiliation: University of Innsbruck, Innsbruck, Austria e Present affiliation: Weathernews, Soest, The Netherlands Prepared for JAMC June 2, 2017 Corresponding Author: C. David Whiteman, University of Utah, Department of Atmospheric Sciences, 135 S 1460 E Rm 819, Salt Lake City, UT USA. dave.whiteman@utah.edu Telephone: Fax:
5 2 47 Abstract Observations from the Second Meteor Crater Experiment (METCRAX II) on the night of October 2013 are used to investigate the interactions between a regional scale katabatic flow and Arizona's Meteor Crater. The crater is a 1.2 km wide, 170-m-deep, near-circular basin with a rim that extends m above the surrounding plain, which is tilted upward to the southwest at a 1 angle. On clear, quiescent nights a southwesterly katabatic flow lifts cold air from the stable boundary layer (SBL) on the plain over the crater rim to produce a continuous inflow of negatively buoyant air that runs down the crater's inner sidewall. As the SBL deepens and the katabatic flow strengthens, a flow bifurcation forms above the rim with the negatively buoyant lower portion running down the inner sidewall to produce a hydraulic jump and the neutrally buoyant upper portion carried quasi-horizontally over the basin. A mesoscale flow with a downslope wind component develops in the residual layer above the SBL, increasing the speeds in the underlying katabatic flow and the vertical shear across the upper branch of the bifurcation. A shear instability leads to the development of a lee wave that brings warm air from the elevated residual layer downward into the basin. The rising air in the hydraulic jump merges with the rising air in the ascending portion of the lee wave. The strong winds penetrate to the basin floor, displacing and stirring the pre-existing, intensely stable, cold pool Key words: Meteor Crater, Arizona, basin, katabatic flow, hydraulic flow, hydraulic jump, cold air intrusion, bifurcation, warm air intrusion, lee wave 69
6 Introduction The first Meteor Crater Experiment (METCRAX I, Whiteman et al. 2008) was conducted in Arizona's Barringer Meteorite Crater (AKA Meteor Crater) in October 2006 to investigate the nocturnal buildup of stable boundary layers in the crater basin. This experiment resulted in the serendipitous discovery of an unexpected phenomenon - the occasional occurrence of strong turbulent nocturnal flows near the base of the upwind inner sidewall. While the observational network was not ideally placed to investigate these flows, initial analyses identified the phenomenon as a downslope windstorm-type flow (Adler et al. 2012) in which warm air from aloft descended into the lee of the upwind crater rim. A Second Meteor Crater Experiment (METCRAX II, Lehner et al. 2016a) was then designed to investigate this phenomenon and the related cold-air intrusions (Whiteman et al. 2010; Haiden et al. 2011; Kiefer and Zhong 2011) that come continuously over the crater rim from the southwest at night as a katabatic flow develops on the adjacent plain. METCRAX II was conducted in October 2013 and the strongest, best-observed downslope windstorm-type flow, which occurred during the 4th Intensive Observing Period (IOP4) on the night of October 2013, is the topic of this paper. Dual- Doppler wind data and frequent tethersonde soundings allow, for the first time, an investigation of the spatio-temporal development and relationships between the evolving wind and temperature structure inside and outside the crater basin The paper is structured as follows: Section 2 surveys literature on the current understanding of similar phenomena observed in other locations and in the Meteor Crater. The topography, ground cover, synoptic situation and experimental setup are described in Section 3.
7 Section 4 presents analyses, Section 5 discusses the most interesting features of the phenomenon and Section 6 provides a summary Background As air flows past three-dimensional, isolated topography, the resulting interactions with the terrain can produce multiple flow responses, including a splitting of the flow around the obstacle; flow over the obstacle; the formation of wakes; and the formation of mountain waves, wave breaking, and downslope windstorms over and in the lee of the obstacle (e.g., Smith 1989). Downslope windstorms have been well studied and have been observed in complex terrain regions throughout the world (reviewed, e.g., by Jackson et al. 2013). In contrast, there have been few studies of flows into basins. A similarity of the flows might be expected as, in both cases, flows come over a relatively high terrain (mountain or plain) to descend lee slopes. Our observations of strong gusty nighttime downslope winds on the lower inner sidewall of the Meteor Crater basin during the METCRAX I and II field experiments were the motivation for two sets of idealized numerical simulations designed to investigate the similarities between these katabatically driven flows and downslope windstorms. Using two-dimensional simulations, Lehner et al. (2016b) simulated the effects of basin size, upstream flow, atmospheric stability and uniform background winds on flow regimes in a basin embedded on a 1 tilted plain on which a katabatic flow developed naturally. Flow responses were of four types similar to those seen in the lee of mountains: wakes over the upstream basin sidewall, sweeping of the basin atmosphere, waves over the basin, and stagnation over the upstream basin sidewall accompanied by a hydraulic jump. Rotunno and Lehner (2016) determined the two-dimensional flow regimes
8 that might occur within a depression embedded in a smooth horizontal plain when a heightindependent ambient flow was imposed on a two-layer atmosphere with a statically stable lower layer and a neutral layer aloft. Steady state flow solutions were presented in a regime diagram using three non-dimensional numbers that characterize the basin and the upstream flow parameters. The various flow regimes included sweeping and stagnating flow, lee waves, hydraulic jumps, internal wave breaking and upstream propagating waves. While there are similarities between flows in the lee of mountains and flows descending into basins (e.g., strong, gusty and sometimes intermittent winds on the lee slope when relatively strong winds cross the barrier at a perpendicular angle and a temperature inversion is present in the incoming flow over the obstacle), there are also differences. The gusty downslope winds are much weaker at Meteor Crater, in keeping with the reduced topographic relief. The downslopewindstorm type flows observed at Meteor Crater occur at nighttime when katabatic flows are present on the surrounding plain, while synoptically driven downslope windstorms over mountain barriers can occur at any time of day Meteor Crater topography, observations, data conventions, definitions and synoptic weather a. The Meteor Crater topography and ground cover The crater has been fully described in previous publications (e.g., Kring 2007; Whiteman et al. 2008, Lehner et al. 2016a), so that a succinct summary here will suffice. The near-circular crater with a diameter of 1200 m is 170 m deep and has a rim projecting m above the extensive
9 surrounding mesoscale plain. The plain descends from the Mogollon Rim, a line of high plateaus southwest of the crater, with a mean slope angle of 1 in the vicinity of the crater. The plain is on the western sidewall of the Little Colorado River valley, which drains to the northwest. The Meteor Crater and its surroundings are in a semiarid region with a sparse ground cover of shrubs and grasses. The main topographic features surrounding the crater are shown in Fig. 1 where the crater is seen as a small pockmark on an extensive sloping plain b. Measurement sites The meteorological measurements used in this paper and their locations are indicated in Fig. 2. Lehner et al. (2016a) provided a full listing of equipment, locations and observation frequencies, so we present a summary here. A 40-m tower at RIM had temperature, humidity and 3D sonic wind measurements at 5-m height intervals. A 50-m tower at NEAR was equipped similarly, but with a 3-m height substituted for the 5-m height. Additional sonic anemometer wind data came from the SSW4 and SSW2 masts on the upper and lower south-southwest sidewall. The planar fit method (Wilczak et al., 2001) was used to correct for sonic tilt, rotating the data into a slope coordinate system with zero vertical velocity averaged over the entire field deployment period. The planar fit at RIM, however, was applied using data only from wind directions between and Scanning Doppler lidars were located on the crater's north rim and floor. They were programmed to execute multiple scanning strategies. Co-planar RHI scans along the azimuth indicated in Fig. 2 are featured in this paper and an entire set of dual-doppler wind retrieval figures is available in the Supplemental Information as SI-1. The dual-doppler retrievals were calculated from continuous co-planar RHI scans from the NRIM (elevation
10 angles -10 to 20, 15-m range gate length, scan resolution 0.75 ) and FLR (elevation angles 10 to 150, 24-m range gate length, scan resolution 1.4 ) lidars over 2.5- and 5-min intervals on a 25 x 25 m grid. Full surface energy balance measurements, including four-component radiation measurements and ground, sensible and latent heat fluxes were made at FLR, NEAR and FAR. Tethered balloon soundings were made at ~20-min intervals from TS-B, TS-SW and TS-C to heights well above the crater rim, measuring temperature, humidity, and wind speed and direction. Battery changes sometimes resulted in larger time gaps between soundings. TS-C and TS-SW soundings were conducted synchronously. Lines of automatic HOBO temperature data loggers (Onset Computer, Bourne MA) exposed at 1.2 m AGL ran from the basin center up the sidewalls and out onto the adjacent plain. Data from the northeast and south-southwest HOBO lines (designated NE and SSW) are featured in this paper. The two rim HOBOs on these lines are designated NE' and SSW', respectively. Automatic weather stations were located at various sites on the rim and the surrounding plain c. Data conventions Several conventions will be employed in this paper. Times are Mountain Standard Time (MST) at the ends of any averaging intervals, unless otherwise stated. Astronomical sunset was at 1742 and sunrise was at 0635 MST. Elevations are in meters MSL and heights are in meters AGL. Potential temperature (θ, C) was calculated using θ = T + γd (z - z0), where T is temperature ( C), γd = C m -1 is the dry adiabatic lapse rate, z is elevation, and z0 = 1564 m is the crater floor elevation. Potential temperature is used instead of virtual potential temperature because of humidity measurement uncertainties in the variety of instruments used in the low humidity
11 environment. In the remainder of this paper, without exception, the word temperature will be used for potential temperature d. Definitions During IOP4 the atmosphere inside the crater evolved through a series of phases. Before discussing these phases we refer to sample temperature soundings in Fig. 3 to introduce terminology and define phase characteristics. The dividing streamline (Fig. 3a) is the central streamline upwind of the crater and outside of its influence that, when rising up the outer sidewall of the crater, just touches the rim (Leo et al. 2015). Flow approaching the crater below the dividing streamline will split horizontally around the crater, while flow above the dividing streamline will be lifted over the rim. The dividing streamline elevation is estimated as the elevation on the NEAR tower where the temperature matches that observed at the base of the RIM tower. A continuous cold-air intrusion (CAI, Fig. 3b) occurs on the SSW inner sidewall when negatively buoyant air lifted over the SSW rim flows down the sidewall (Whiteman et al. 2010; Haiden et al. 2011). A diagnostic indicator of the CAI is a super-adiabatic temperature profile on the SSW HOBO line (Whiteman et al. 2017; hereafter W17)). A bifurcation (Bi, Fig. 3c) occurs when a stable layer coming over the rim splits into a lower negatively buoyant current that runs down the inner sidewall and an upper non-negatively buoyant current that flows quasi-horizontally over the crater (W17). A layer of warm, turbulent, neutrally stratified air (a "cavity" or wake) forms in the lee of the rim between the two currents. If the cavity extends far enough into the crater the neutral layer will appear in the upper part of
12 the TS-SW sounding with a capping stable layer at its top near rim level. The lower portion of the stable layer, which flows down the sidewall, will be present at the base of the sounding. A warm air intrusion (WAI, Fig. 3d) is produced by a lee wave that brings residual layer (RL) air directly down into the basin above the southwest sidewall (Adler et al. 2012). If the wave extends downwind over the TS-SW site, no capping inversion will be present at or just above the rim at this site e. Weather conditions during IOP IOP4 occurred during a period when a blocking ridge off the Pacific coast brought high pressure and clear, undisturbed weather to the region. The ground was dry, as the last rain (5.7 mm) had fallen on 10 October. The geopotential height gradient was weak above the region, supporting geostrophic winds from the northwest at 700 hpa. Three-hourly rawinsonde soundings in Fig. SI-2 provide additional upper air information Spatio-temporal evolution of temperature and wind A sequence of transitional phases in temperature and wind structure was observed inside the crater basin during IOP4, as driven by interactions between the crater and the approaching flow over the adjacent plain. The analysis begins with an overview of the boundary layer evolution on the plain. This is followed by a chronological description of the structural phases inside the crater and their relationship to the boundary layer structure of the approaching flow. 228
13 a. Wind and temperature structure evolution outside the crater basin The evolution of vertical temperature and wind structure outside the crater was observed at BASE with a sequence of tethered balloon ascents supplemented by Halo Photonics lidar VAD scans above 1950 m MSL (Fig. 4), and with the NEAR and RIM towers (Fig. 5). A stable boundary layer (SBL) begins to form on the plain in the late afternoon (Fig. 4a), growing upward into a quiescent afternoon RL. The elevation of the SBL top, as defined by a sharp temperature gradient decrease at the base of the RL, grows continuously upward overnight to reach 1780 m MSL by about 0312 MST. The SBL then becomes unsteady as differential cold air advection begins aloft, and a stable sub-layer develops within the SBL representing the depth of local katabatic cooling on the plain. The RL maintains a weak temperature gradient of θ/ z = 3 C km -1 and cools slowly during the night (Fig. SI-2). Winds within the SBL, while initially upslope in late afternoon, quickly turn downslope and extend to heights above the top of the SBL, reaching 1810 m MSL by 2130 MST. At this time, however, a southwesterly mesoscale flow of undetermined origin in the RL becomes superimposed on the thermally driven katabatic wind, increasing the downslope wind speeds and greatly increasing the downslope flow depth (Fig. 4b). The depth and strength, however, decrease rapidly after about 0300 MST as northwesterly winds develop above the crater rim, confining the thermally driven katabatic flow below 1750 m MSL. During the whole night, wind directions veer with height from SSW at the surface to SW aloft. The dividing streamline height (Fig. 4a) varies between 1710 and 1725 m MSL during most of the night (Fig. 4a), while the height of the wind speed maximum (Fig. 4b) increases steadily through 2230 MST, continues an unsteady increase to 0145 MST and then drops to elevations near the crater rim for the remainder of the night. Downslope wind speeds at
14 the height of the wind speed maximum at BASE and average wind speeds on the RIM and NEAR towers increase steadily to reach about 5 m s -1 by 2300 MST. Winds remain at this speed until about 0245 MST and then decrease during the remainder of the night (Fig. 4c). Weaker wind speeds at m AGL exhibit a similar sinusoidal evolution. Time series of temperature and wind at the various heights on the NEAR and RIM towers upwind of the crater basin are shown in Figs. 5a-e. The RIM tower data are shown alternatively as hourly vertical profiles in Figs. 5g and h. Wind speeds at locations inside the crater, to be discussed later, are presented in Fig. 5f. Here we summarize the main evolutionary features. Temperatures on both the NEAR (Fig. 5a) and RIM (Fig. 5c) towers decrease rapidly in the evening and then more slowly during the remainder of the night - a feature typical of SBL development in katabatic flow situations (DeWekker and Whiteman 2006). Temperatures are lower on the RIM tower than on the NEAR tower at the same MSL elevation. The 2-m AGL temperature 7.2 km south-southwest of the crater at FAR parallels the temperature at 3-m AGL on the NEAR tower, highlighting the along-slope homogeneity of the temperature structure within the terrain-following SBL. Initial drops in temperature at different sensor heights indicate when the SBL reaches that height. At the NEAR tower, the 3-m AGL level begins cooling by 1800 MST (Fig. 5a) and the SBL deepens to reach the tower top at ~1910 MST. Cold air from the deepening SBL on the upwind plain first reaches the base of the RIM tower at 1930 MST (Fig. 5c). A temperature drop at the tower top is difficult to ascertain from this figure, but Fig. 5g indicates that the stable stratification has already reached the top by 2000 MST. The growing stable layer depth exceeds the RIM tower height by around 2200 MST and the temperature difference between the tower top and the first level reaches 8 C by midnight (Fig. 5g). Temperature oscillations occur on both towers during the rapid cooling period of SBL buildup
15 and continue until 0100 MST on the RIM tower. The strongest temperature drops are often accompanied by wind speed increases, for example at 2100 and 2145 MST (Fig. 5c). Some oscillations (e.g., at 2100 and 2225 MST) can be identified at both NEAR and RIM (Figs. 5a and c), with oscillations at NEAR preceding those at RIM by about 8 min, corresponding roughly to the advection time over the 1500 m distance between the two towers at wind speeds of 2-3 m s -1. Wind speeds evolve sinusoidally over the night at both the NEAR (Fig. 5b) and RIM (Fig. 5d) towers, as seen previously in Fig. 4c. Downslope winds begin at the lowest levels of the NEAR and RIM towers at 1820 and 1920 MST, respectively, but they climb the RIM tower much more quickly than the NEAR tower. The jet-like katabatic wind maximum climbs the RIM tower, exceeding the tower height after midnight (Fig. 5h). The jet-like profile is reestablished within the RIM tower layer, however, around 0300 MST. Vertical shear is much stronger on the NEAR tower than on the RIM tower (Figs. 5b and d). The vertical velocity at RIM, initially positive, becomes negative once the downslope flow reaches the tower top, and the sinusoidal shape of the vertical velocity time series is a mirror image to the RIM wind speed curves (Fig. 5e) b. Wind and temperature structure evolution inside the crater The atmospheric structure inside the crater went through a sequence of phases whose approximate timing is given by the vertical lines superimposed on Figs. 4 and 5, which illustrated temperature and wind structure outside the crater basin. In this section the phases are discussed chronologically using hourly temperature profiles and winds on a cross section through the crater basin (Fig. 6). Data come from the TS-B, TS-SW, and TS-C tethersondes, the BASE
16 and RIM towers, the NE and SSW HOBO lines, the short tower observations at SSW4 and SSW2 and dual-doppler wind retrievals (Cherukuru et al. 2015) within and above the crater. The HOBO temperature sensors experience somewhat lower temperatures than the adjacent free atmosphere as they are exposed near the ground in the terrain-following stable layer ) OVERFLOW INITIATION PHASE, LATE AFTERNOON TO 1930 MST During the overflow initiation (OI) phase the atmosphere inside the crater develops locally without significant influence from outside. Separate stable boundary layers form inside the crater and on the adjacent plain following the reversal of the local radiation and energy budgets (Fig. SI-3). The cold air within the SBLs flows down the topographic gradient as a katabatic flow, replacing the afternoon upslope flows on the plain (Savage et al. 2008) and basin sidewalls (Martinez-Villagrassa et al. 2013). The surface radiation and energy budgets reverse earlier in the crater than on the plain because of the shadow that is cast into the basin from the south and west rims by the setting sun (Hoch and Whiteman 2010; Hoch et al. 2011; Martinez-Villagrassa et al. 2013). Inside the basin, the decrease in the crater radius as the floor is approached will cause locally developed downslope flows on the sidewalls to converge on and over the valley floor, with buoyancy forces tending to level the isentropes (Zardi and Whiteman 2013). During this phase the SBL inside the crater develops a vertical temperature structure in which a shallow, strongly stable, relatively quiescent cold pool forms on the crater floor and the entire basin atmosphere above the cold pool begins to stabilize (Whiteman et al. 2008). The OI phase ends at 1930 MST when the cold air on the plain first reaches the base of the RIM tower (Fig. 5c). This is about a half-hour before the SBL on the plain reaches this elevation (Fig. 3a), illustrating the
17 role of the katabatic flow, whose maximum speed is about 2 m s -1 (Figs. 4c and 5b), in lifting air over the rim. The time of overflow initiation thus depends not only on the rim height and the rate of upward growth of the SBL on the plain, but also on the katabatic flow strength ) COLD AIR INTRUSION PHASE, 1930 TO 2130 MST Cold air intrusions have been previously studied at Meteor Crater (Whiteman et al. 2010, 2017; Haiden et al. 2011; Kiefer and Zhong 2011) but will be summarized here for IOP4. The CAI phase begins at 1930 MST. As the SBL over the plain deepens and the katabatic flow strengthens, the layer of cold air carried over the rim also deepens (Fig. 5c). Sudden decreases in temperature indicate when the SBL engulfs individual tower levels. The vertical temperature structure of the overflow closely resembles that above the dividing streamline on the plain when displaced upwards by the elevation difference between the dividing streamline and the rim (Figs. 3a and 6a), indicating that the lifting is adiabatic (W17). The dividing streamline elevation on the NEAR tower at 1930 MST is 1710 m MSL (15 m AGL) but is typically m MSL (20-25 m AGL) during most of the night (Fig. 4a). For comparison, the elevation difference between NEAR and RIM is 38 m AGL. In accordance with previous studies (e.g., W17), the flow splits to the left and right around the crater below the dividing streamline and a warm wellmixed wake forms in the lee of the crater (Fig. SI-4a). These flow features persist all night (cf., Fig. SI-4b). As CAIs continue to bring cold air over the rim, compensatory outflows occur over the downwind rim. Because the continuous inflow over the upwind rim is colder than air at the undisturbed downwind rim at NE' (Fig. 7) and in the upper part of the basin, as seen from the TS-C, TS-SW
18 and NE temperature profiles in Fig. 6a, its negative buoyancy causes it to descend the inner basin sidewall as a CAI (Whiteman et al. 2010, 2017; Haiden et al. 2011), producing colder temperatures on the upwind inner sidewall than on the downwind inner sidewall. The inflow produces a super-adiabatic surface temperature profile along the upwind inner sidewall (SSW HOBO line in Fig. 6a). W17 hypothesized that this along-slope temperature structure is caused by vertical mixing within the flowing layer that produces progressive warming of surface temperatures with downslope distance. The adiabatic lifting of upstream air over the crater rim, the stably stratified flow and katabatic jet-like wind profiles above the rim, the colder temperatures on the upwind inner sidewall than on the downwind inner sidewall, the superadiabatic along-slope temperature structure on the upwind sidewall continue during the entire night (Fig. 6). During the CAI phase the cold air inflow (Fig. 5f) turns down the sidewall under the influence of gravity and accelerates from RIM to SSW4. The downslope wind during this phase is too close to the underlying sidewall to be seen in the dual-lidar wind retrievals (Fig. 6a) but its upper portion is visible in FLR lidar RHI scans (Fig. 8a). Negative vertical velocities at the RIM tower top begin at 2000 MST, about a half-hour after the CAI phase begins and when the SBL reaches that level (Fig. 5e). These negative velocities continue through most of the night. The depth to which the CAI will penetrate into the basin depends on the ambient vertical temperature structure inside the basin, as the CAI will descend until reaching its level of buoyancy equilibrium (W17). During this phase a 40-m-deep cold air pool is present on the basin floor with a temperature deficit of 9 C surmounted by an isothermal layer extending to the rim (Fig. 6a). The isothermal layer is produced through CAI processes documented by Haiden et al. (2011). The CAI can more easily penetrate the near-isothermal layer than the stronger stability
19 cold pool below. During and following the CAI phase, enhanced cooling within the basin compared to the residual layer aloft produces a temperature jump or capping inversion near rim level that strengthens during the night (compare residual layer minus RL temperature differences in Fig. 6 sub-figures). During the CAI and following phases, the close correspondence between temperature profiles at TS-SW, TS-C and NE indicates that isentropes within the bulk of the basin away from the intrusions on the southwest sidewall remain quasi-horizontal (Fig. 6a). During the CAI phase, SSW2 is often submerged below the top of the cold pool where winds are calm (Fig. 5f). Wind speed spikes at SSW2 at 1945, 2005, 2045 and 2115 MST coincide with temperature minima at the RIM (Figs. 5f and 5c), suggesting that the CAI can reach SSW2 only when it has sufficient negative buoyancy to penetrate into or push away the top of the cold pool. Because increases in downslope speed at SSW2 are associated with temperature decreases we can reject the hypothesis that the wind speed excursions are caused by seiches that submerse and re-immerse SSW2 in a sloshing cold pool, as downslope (upslope) speed increases would then be associated with temperature increases (decreases) ) BIFURCATION PHASE, MST W17 previously documented a long-lived ( MST) bifurcation phase during IOP7 that occurred when a steady-state katabatic flow developed within a quiescent larger scale environment. In contrast, the IOP4 bifurcation phase is a relatively short, temporary phase in the ultimate progression to a WAI phase associated with a southwesterly mesoscale flow. Because the bifurcation phase has been previously described, we briefly summarize this phase, pointing out key structural features. Unfortunately, the RIM tower was not high enough to observe the full
20 depth of the SBL after 0000 MST. Since the lifting of the SBL over the rim was an adiabatic process, however, the structure above the rim can be determined by projecting the portion of the BASE temperature profile in Fig. 6 that is above the dividing streamline upward by the vertical distance between the dividing streamline at BASE and the RIM tower. The bifurcation phase, initiated by the steady growth of the SBL on the plain (Fig. 4a), begins between 2105 and 2130 MST. By 2210 MST (Fig. 6b), the SBL at RIM is 30 m deep with a temperature deficit of 7.5 C. During the bifurcation phase, the overflowing stably stratified cold air from upstream deepens to the point that it is composed of both a negatively buoyant lower current that runs down the inner sidewall and a non-negatively buoyant upper current that is advected quasi-horizontally over the basin and has a tendency to form unsteady waves in the lee of the rim. The negative vertical velocities at RIM suggest that the two currents pull apart just upwind of the rim. A low wind speed cavity or "stagnant isolating layer" (Winters and Armi 2014) develops between the two currents. The cavity, with the same isentrope at its base and top, has neutral stability. Cavity temperatures, as measured at TS-SW, are warmer than on the undisturbed NE sidewall and tethersonde ascents find turbulent air within the cavity. Because the cold current descends into the basin upwind of TS-SW, the capping stable layer above TS-SW and TS-C is missing the cold lower portion that was present at RIM. In contrast to the CAI phase when isentropes were quasi-horizontal and the negative buoyancy could be estimated from the upwind-downwind rim temperature difference (Fig. 7), the negative buoyancy of the CAI in the bifurcation phase is determined from the CAI-cavity temperature difference. Since the air adjacent to the slope is now warmer than in the previous phase, the CAI negative buoyancy and wind speeds increase. The bifurcation point would then be the height
21 above the rim of the temperature measured in the cavity (at 2210 MST this is ~27 m) rather than, as in the previous phase, the height above the rim of the NE' temperature. During the bifurcation phase the elevation of the katabatic speed maximum on the plain rises above the rim elevation at 2150 MST (Fig. 4b) with a resulting increase in wind speed from ~2 m s -1 at all levels on the RIM tower to 3.8 m s -1 at the 3 m level and 5 m s -1 at the tower top by the end of the bifurcation phase. Negative vertical velocities at the top of the tower related to the wave motion in the upper branch of the flow increase from 0.2 to 0.5 m s -1 (Fig. 5e). Winds in the stably stratified atmosphere within the capping stable layer are carried across the crater (Fig. 6b), and RHI scans from the FLR lidar detect the upper part of the shallow CAI (Fig. 8b). The CAI descends the sidewall until reaching and sometimes overshooting its neutral buoyancy elevation where it initially separates from the slope and runs out into the crater atmosphere (W17). Later in the bifurcation phase as the CAI flow strengthens, a hydraulic jump forms on the lower sidewall as visualized by a zone of rising air above the sidewall (Fig. 9a). These rising motions were not present earlier in the bifurcation phase at 2210 MST (Fig. 6b). Weak speed oscillations occur on the upper and, especially, lower sidewall during the bifurcation phase (Fig. 5f), as they did during the CAI phase ) WARM AIR INTRUSION PHASE, MST The warm air intrusion phase begins at around 2245 MST when, in response to increasing downslope winds in the residual layer above the plain SBL (Figs. 4b and c) a lee wave in the upper current of the bifurcation amplifies to bring warm residual layer air directly down into the crater basin (compare Figs. 6b and c). Dual-lidar wind field retrievals (Fig. 9) provide a close
22 look at the abruptly changing wind field during this transition. At 2240 MST (Fig. 9a) the bifurcation is still present, with the cavity separating the upper and lower currents and with a hydraulic jump on the lower slope. An unsteady lee wave, however, is present in the statically stable upper current, where wind speeds over the rim have accelerated to 5 m s -1 (Fig. 4c). The wave amplifies and descends further into the basin (Fig. 9b). By 2252 MST (Fig. 9c) the CAI and WAI currents merge, removing the cavity between the two currents, and bringing warm RL air down into the basin. The merging of the two currents and the stable layers in which they are embedded increase the stable layer depth and strength on the sidewall (compare TS-SW temperature profiles in Figs. 6b and c) and increase the downslope wind speeds as well as the layer depth (Figs. 5f, 8b, 8c and d). The hydraulic jump strengthens (Figs. 6c-d and 9b-c) as the flow becomes more negatively buoyant relative to the adjacent WAI air and as momentum is transported downward into the stable layer from the WAI. In the bigger picture, the warm descending air over the upwind sidewall is the descending branch of the first wave of a two-wave train that extends across the basin with a wavelength approximately equal to the basin radius, and an amplitude approximately twice the basin depth. Following the abrupt transition, the WAI continued until 0255 MST during a period when the maximum downslope winds at BASE and the mean downslope winds on the RIM and NEAR towers remained above 5 m s -1 and the downslope wind component in the m AGL layer at BASE was higher than 3 m s -1 (Fig. 4c) and downward vertical velocity at the top of the RIM tower generally exceeded 0.6 m s -1 (Fig. 5e). During most of the WAI phase the SSW4 wind speeds were generally about 2.5 m s -1 and the winds accelerated down the slope to produce gusty winds of up to 6 m s -1 at SSW2 (Fig. 5f). Interestingly, wind speeds decreased at SSW4 when the flow over the rim exceeded 4.5 m s -1 possibly due to a bluff body flow separation in which the
23 cold overflow is carried some distance over the crater before descending to the underlying sidewall and accelerating to SSW2. The strength and position of the hydraulic jump on the sidewall were variable during the WAI phase, but the rising motions above the jump converge with the rising branch of the lee wave (Figs. 6c-e). Wind speeds on the crater floor (3 m AGL at FLR) were nearly calm before the WAI, but increased intermittently during the WAI, disturbing the cold pool on the basin floor (Fig. 5f). Following an approach developed by Vogt (2008), a time-lapse sequence of georeferenced thermal infrared images was used to visualize changes in the effective surface radiating temperature field inside the crater basin as the atmospheric structure progressed through the different phases (Feigenwinter et al. 2016; Grudzielanek et al. 2016). Two frames from the time-lapse sequence illustrate the differences between the CAI and WAI phases (Fig. 10). Both images include the shallow cold pool on the crater floor, the nearly isothermal temperature structure on the sidewalls above the cold pool and the colder temperatures on the upwind inner sidewall compared to the downwind inner sidewall. The cold pool is roughly circular during the CAI phase (Fig. 10a) but is progressively pushed to the north-northeastern side of the basin as winds strengthen in the WAI phase (Fig. 10b). The unsteady motions in the cold pool during the WAI phase split the cold pool apart and move it around on the crater floor. Turbulent mixing and sinking motions at the top of the cold pool produce warm temperatures at the floor (compare Fig. 6b with Figs. 6c-e), intermittent NNE-SSW-oriented warm streaks on the southwest sidewall and basin floor, and warm and cold patches on the basin floor (Fig. 10b). The flow strength during the WAI phase is, however, insufficient to sweep the cold air from the basin.
24 The warm air intrusion is confined over the upwind inner sidewall, as indicated by the simultaneous presence of a capping inversion at rim level above TS-C and absence above TS- SW (Figs. 6c-e). The depth of penetration of warm RL air into the basin can be estimated from the TS-SW temperature sounding, although TS-SW is often somewhat downwind of the wave trough. Ragged below-rim temperature profiles at TS-SW in Fig. 6e occur when the tethered balloon ascent path is on the turbulent border between the rising warm RL air and the colder air over the crater center. The dual-doppler wind field provides an estimate of the cross-basin spatial variation of the wave boundary between the warm flowing RL air and the colder quiescent air within the basin (Fig. 6). Warm air in the wave trough displaces cold air in the basin. In the following wave crest, cold air is lifted well above the crater rim (Figs. 6c-e) into the warmer environment. Graphics of the wind retrievals at 150-s intervals (Fig. SI-1) show that the lee wave, while continually present during the WAI phase, is unsteady, with short-term changes in amplitude and position and with intermittent flow separations occurring at different elevations in the descending branch of the lee wave. Other animations (not shown) show vorticity maxima that travel up the cold air interface over the valley center in the rising branch of the wave, indicating the presence of rotors or Kelvin-Helmholtz instabilities on the interface ) SECOND BIFURCATION PHASE, MST Downslope wind speeds in the RL upwind of the crater (e.g., m AGL above BASE) and on the NEAR and RIM towers (Fig. 4c) begin a slow decrease midway through the WAI phase. The elevation of the downslope wind speed maximum (Fig. 4b) begins a rapid decrease at 0145
25 MST, falling from 1860 m MSL to the crater rim elevation in one hour. By 0255 MST, when the downslope wind speed component at the 40-m level on the RIM tower (Fig. 5d) drops below 6 m s -1 a second bifurcation phase is initiated exhibiting a neutral cavity, upper and lower currents, a capping stable layer and a hydraulic jump (Figs. 6f and g), similar to the evening bifurcation (e.g., Fig. 6b and Fig. 9a). Cavity temperatures tend to be considerably higher than those on the adjacent slope in the evening bifurcation phase because of the lingering warm air from the preceding WAI phase ) SECOND COLD AIR INTRUSION PHASE, MST During most of the night, mesoscale winds in the RL have a downslope component that is in the same direction as the underlying katabatic flow on the plain below. Around 0410 MST, however, the mesoscale flow above the crater shifts into the northwest (Fig. 4b), counter to the underlying katabatic flow, reducing the depth and strength of the katabatic flow coming over the rim and causing the flow to transition into a second CAI phase. By 0510 MST (Fig. 6h), the wind component in the vertical plane above the crater is upslope at elevations above 1780 m MSL. The upper and lower currents, the cavity and the hydraulic jump disappear and only a weak, shallow CAI comes over the southwest rim. The cold air overflow in this phase has a temperature deficit relative to the downwind rim of about 3 C (Fig. 7), similar to that in the evening CAI phase and throughout the entire night. Wind speeds decrease on the lower sidewall and become calm on the crater floor (Fig. 5f). The cold pool re-strengthens (Fig. 6h) and temperature profiles become similar to those in the first CAI phase eight hours earlier (Fig. 6a). 525
26 Discussion a. Conceptual model The sequential development of phases, including the penultimate WAI phase that produced the strongest turbulent winds on the lower sidewall, are interesting aspects of IOP4 that extend the previous study of a 5-hour-long steady-state bifurcation period during IOP7 (W17). The cyclical development of the phases in IOP4 is produced by temporal changes in the characteristics of the approaching flow. The depth of the stable layer on the plain (Fig. 4a) increases monotonically through the night and the negative buoyancy of the cold air overflow at the rim relative to the downwind rim changes little during the night (Fig. 7). These monotonically increasing and/or steady approach flow characteristics cannot, in themselves, be responsible for the full cycle of phases experienced inside the basin. The growth of the SBL on the plain and the advection of cold air from this SBL over the rim by the locally driven katabatic flow play major roles in the CAI and bifurcation phases, but the cyclical nature of the downslope component of the winds in the RL above the plain SBL plays the major role in bringing the basin atmosphere through the WAI phase. A two-dimensional conceptual model of the mean structure of the overflow initiation, cold air intrusion, bifurcation and warm air intrusion phases on a vertical cross section through the crater basin is presented in Fig. 11 by combining analyses from Section 4. Non-stationary and three-dimensional aspects of the flow are not addressed in this figure although they are clearly present in the observations. 548
27 b. Interesting aspects of the phases The lifting of a cold stably stratified layer over the rim by a katabatic flow that develops in the SBL on the upwind plain initiates the cold air intrusion phase. The continuous negatively buoyant airflow coming over the rim appears to be an atmospheric analog to hydraulic flows occurring in flumes and weirs (e.g., Massey 2006) or over underlying topography in oceans or lakes (Armi and Farmer 2002). They bear similarities to other atmospheric "hydraulic" flows over mountains in which bifurcations, cavities and strong surface winds and hydraulic jumps have been noted (Winters and Armi 2014). The strength of the descending CAI current appears to depend on its along-slope integrated negative buoyancy (i.e., temperature deficit) relative to the immediately adjacent environment (this concept of the local determination of buoyancy is supported by Doswell and Markowski 2004 and Peters 2016) and is thus affected by the warmer air brought down adjacent to the sloping CAI layer by the WAI. The important role of negative buoyancy in the acceleration of descending flows in the lee of topography is supported by the work of Armi and Mayr (2011). The deepening of the overflowing stable layer results in a bifurcation of the flow into a negatively buoyant layer that runs down the inner sidewall while the upper, stably stratified layer is carried over the crater. A hydraulic jump occurs in the cold air stream on the lower sidewall near the end of this phase. The transition into the WAI phase is produced by an enhancement of katabatic flow strength by a mesoscale flow that develops in the RL; this mesoscale flow enhancement was not present in IOP7 when no WAI was produced. Warm RL air is brought down into the basin behind the upwind rim by a lee wave whose wavelength is about half the crater diameter or 600 m. Numerical simulations by Lehner et al. (2016b) and Rotunno and
28 Lehner (2016) found similar two-wave regimes in an idealized Meteor Crater. Descending motions on the RIM tower place the initial wave crest upwind of the rim, suggesting that the approaching flow may be responding to the crater's "effective topography" (Armi and Mayr 2015), in which a cold air "obstacle" builds up on the windward side of the crater. The prominent two-wave pattern inside the crater appears to be a dynamic accommodation of the atmospheric flows to the wavelength of the underlying terrain, a feature of previous numerical modeling studies of flows into basins (Soontiens et al. 2013; Lehner et al. 2016b; Rotunno and Lehner 2016) or across a valley confined between mountain ranges (Lee et al. 1987; Vosper 1996; Grubišić and Stiperski, 2009; Stiperski and Grubišić 2011) c. Instability leading to the WAI phase We hypothesize that the lee wave deepens through a shear instability mechanism as the increasing RL downslope wind component increases the positive vertical wind shear across the capping inversion. This instability brings the capping inversion interface downward into the upper crater atmosphere allowing the RL winds to descend into the crater. A necessary condition for the development of this wave is that the Richardson number (Ri) falls below the critical value of 0.25 (Nappo 2012) in the density interface zone somewhat upwind of the crater rim where the instability forms. Richardson number computations are complicated by the non-continuous nature of the tethersonde soundings, their non-ideal locations (TS-B and TS-SW are upwind and downwind of the wave initiation zone), the turbulent motions that buffet the wind sensors on the tether line below the TS-SW balloon and the fact that some TS-SW soundings ascended through the boundary between the warm air and the colder air in the crater center. Nonetheless,
29 observational evidence during the bifurcation/wai transition provides support for this mechanism (Fig. 12). On the plain at TS-B (Fig. 12a) Ri reaches the critical threshold in the surface layer during the OI phase, continuing all night. A zone of low Ri is also generated just above the top of the growing SBL by the wind shear and low stability there. This low Ri layer reaches the rim level at the beginning of the CAI phase. Ri then drops below 0.25 near the middle of the bifurcation phase. The low Ri zone above the SBL continues its rise above the rim during the rest of the night, but low values return to the rim level at the end of the second bifurcation phase. Within the basin at TS-SW (Fig. 12b) Ri near the surface varies with time as the site is alternately exposed to and protected from the CAI. Ri drops below 0.25 at the rim height at the beginning of the CAI phase and continues through most of the night until the beginning of the second bifurcation phase. The full depth of the basin and the atmosphere above maintains Ri < 0.25 during the WAI phase (except for short-term excursions caused by the factors mentioned above). Higher values of Ri are generally found above TS-SW in the upper elevations of the basin during the CAI phases when weak winds and low stability are present and intermittently in the bifurcation phases when the cavity is near neutral with low wind speeds. Sachsperger et al. (2015) investigates this shear instability mechanism in the lee of a ridge using numerical simulations for a situation similar to that for the bifurcation phase (vertical wind shear across a density interface zone with a neutral layer below and a stable layer above) d. Need for further research Data weaknesses limit confidence in some aspects of the analyses. Field data cannot determine if detrainment is occurring at the top of the cold air intrusion. Numerical and laboratory
30 simulations by Baines (2005) suggest that both entrainment and detrainment are possible depending on slope angle. The turbulent mixing mechanism that we posited as leading to the super-adiabatic, along-slope temperature profile within the flowing CAI also cannot be verified with present observations. The relative roles of the negative buoyancy increase and downward momentum transport from the overlying WAI in accelerating the CAI and strengthening the hydraulic jump cannot be determined from the observations. Additional numerical simulations and field studies may answer some of these questions Summary A case study has focused on the interactions between an approaching southwesterly katabatic flow that formed on a 1 -tilted mesoscale plain and a basin with a surrounding m high rim that was formed on the plain by a meteorite impact. The interaction between the nighttime katabatic flow and the crater basin on the night of October (IOP4) is the atmospheric equivalent of a "hydraulic flow" that evolves through six well-defined phases, four of which are illustrated in the conceptual model of Fig. 11. The overflow initiation phase includes the initiation and growth of separate stable boundary layers and katabatic flows over the plain and inside the basin. Above a dividing streamline height, the katabatic flow lifts the cold air in the plain SBL up the outer sidewall of the crater. In the cold air intrusion phase cold air from the plain SBL overflows the rim and, because it is negatively buoyant relative to air within the crater, descends the upwind inner sidewall and flows down the sidewall until reaching its level of neutral buoyancy and flowing out into the main crater atmosphere. As the plain SBL deepens and the katabatic flow increases in strength, the flow bifurcation phase begins in which the lower
31 negatively buoyant portion of the stable layer continues to flow down the inner sidewall while an upper non-negatively-buoyant portion is carried over the crater in a quasi-horizontal overflow. A cavity forms between the two branches of the bifurcation containing near-neutral stability and low wind speeds. A shallow unsteady wave forms in the lee of the rim in the upper layer, and a hydraulic jump forms above the lower sidewall in the lower descending layer. As the SBL on the plain deepens, a mesoscale downslope flow in the residual layer becomes superimposed on the katabatic flow, initiating a warm air intrusion phase. The unsteady wave in the lee of the rim amplifies and brings the upper non-negatively buoyant stable layer down into the crater above the cold air intrusion, carrying warm air directly into the upper elevations of the basin from the residual layer above the plain. Rising air in the hydraulic jump over the lower sidewall merges with the rising branch of the lee wave. The disturbances produced by these phases are largely confined above the upwind inner sidewall, but the strong and turbulent flow near the base of the southwest sidewall during the flow bifurcation and warm air intrusion phases disturbs the preexisting shallow cold pool on the crater floor. Decreases in wind speeds in the residual layer above the crater later in the night cause the warm air intrusion phase to transition back to the flow bifurcation and then cold air intrusion phases before sunrise. Temperature and wind profile observations inside and outside the crater basin and, especially, dual-doppler wind retrievals inside the basin were critical to the above analyses, adding new information on the katabatic flow that produces a continuous cold air intrusion into the closed basin, the role of SBL growth on the plain in producing a flow bifurcation above the basin, and the effect of pre-existing and evolving basin temperature profiles on the buoyancy of air descending into the basin. The negative buoyancy of the cold air inflow can lead to relatively strong winds and the formation of a hydraulic jump on the lower sidewall of even a small basin.
32 Weak to moderate winds aloft can modulate the katabatic overflow to produce lee waves and warm air intrusions. It is hoped that these analyses will stimulate future numerical modeling of katabatically driven flows into basins Acknowledgments This paper is dedicated to the memory of Dr. Thomas W. Horst, a cherished colleague who led the NCAR Earth Observing Laboratory's field and data processing support for this project, including the construction and instrumentation of the two tall towers. We greatly appreciate the assistance of the many METCRAX II participants, property owners and lenders of field equipment who were acknowledged or served as co-authors in the Lehner et al. (2016b) article. We thank Drs. Rich Rotunno, Georg Mayr, Thomas Haiden and Iva Stiperski for useful discussions. This research was supported by NSF's Physical and Dynamic Meteorology Division (B. Smull and E. Bensman) through grant AGS KIT's contribution was funded by the International Bureau of the German Bundesministerium für Bildung und Forschung under grant 01 DM
33 REFERENCES Adler, B., C. D. Whiteman, S. W. Hoch, M. Lehner, and N. Kalthoff, 2012: Warm-air intrusions in Arizona's Meteor Crater. J. Appl. Meteor. Climatol., 51, Armi, L., and D. Farmer, 2002: Stratified flow over topography: Bifurcation fronts and transition to the uncontrolled state. Proc. Roy. Soc. A: Math. Phys. and Eng. Sci., 458, Armi, L., and G. J. Mayr, 2011: The descending stratified flow and internal hydraulic jump in the lee of the Sierras. J. Appl. Meteor. Climatol., 50, Armi, L., and G. J. Mayr, 2015: Virtual and real topography for flows across mountain ranges. J. Appl. Meteor. Climatol., 54, Baines, P. G., 2005: Mixing regimes for the flow of dense fluid down slopes into stratified environments. J. Fluid Mech., 538, Cherukuru, N., R. Calhoun, M. Lehner, S. W. Hoch, and C. D. Whiteman, 2015: Instrument configuration for dual Doppler lidar co-planar scans: METCRAX II. J. Appl. Remote Sensing, 9, to DOI: /1.JRS De Wekker, S. F. J., and C. D. Whiteman, 2006: On the time scale of nocturnal boundary layer cooling in valleys and basins and over plains. J. Appl. Meteor., 45, Doswell III, C., and P. Markowski, 2004: Is buoyancy a relative quantity? Mon. Wea. Rev., 132, Feigenwinter, I., R. Vogt, M. Müller, E. Parlow, M. Grudzielanek, M. Lehner, S. W. Hoch, and C. D. Whiteman, 2016: Analysis of flow structures in the Barringer Meteor Crater using thermal infrared data collected during the METCRAX II field experiment. 22nd Symp. on Boundary Layers and Turbulence, June 2016, Salt Lake City, UT.
34 Grubišić, V., and I. Stiperski, 2009: Lee-wave resonances over double bell-shaped obstacles. J. Atmos. Sci., 66, Grudzielanek, A. M., M. Maric, R. Vogt, J. Cermak1, I. Feigenwinter, C. D. Whiteman, M. Lehner, and S. W. Hoch, 2016: Cold-air pool analysis using thermal imaging from Arizona's Meteor Crater during METCRAX II. 22nd Symp. on Boundary Layers and Turbulence / 32nd Conference on Agricultural and Forest Meteorology, June 2016, Salt Lake City, UT. Haiden, T., C. D. Whiteman, S. W. Hoch, and M. Lehner, 2011: A mass flux model of nocturnal cold-air intrusions into a closed basin. J. Appl. Meteor. Climatol., 50, Hoch, S. W., C. D. Whiteman, and B. Mayer, 2011: A systematic study of longwave radiative heating and cooling within valleys and basins using a three-dimensional radiative transfer model. J. Appl. Meteor. Climatol., 50, Hoch, S. W., and C. D. Whiteman, 2010: Topographic effects on the surface radiation balance in and around Arizona's Meteor Crater. J. Appl. Meteor. Climatol., 49, Jackson, P. L., G. Mayr, and S. Vosper, 2013: Dynamically-driven winds. Chapter 3 in Mountain Weather Research and Forecasting. Springer, (Chow, F. K., S. F. J. DeWekker, and B. Snyder, Eds.), Kiefer, M. T., and S. Zhong, 2011: An idealized modeling study of nocturnal cooling processes inside a small enclosed basin. J. Geophys. Res. Atmos., 116, D Kring, D. A., 2007: Guidebook to the Geology of Barringer Meteorite Crater, Arizona (aka Meteor Crater). 70th Annual Meeting of the Meteoritical Society. LPI Contribution No. 1355, Lunar and Planetary Institute, Houston, TX. Lee, J. T., R. E. Lawson, and G. L. Marsh, 1987: Flow visualization experiments on stably
35 stratified flow over ridges and valleys. Meteor. Atmos. Phys., 37, Lehner, M., C. D. Whiteman, S. W. Hoch, E. T. Crosman, M. E. Jeglum, N. W. Cherukuru, R. Calhoun, B. Adler, N. Kalthoff, R. Rotunno, T. W. Horst, S. Semmer, W. O. J. Brown, S. P. Oncley, R. Vogt, A. M. Grudzielanek, J. Cermak, N. J. Fonteyn, C. Bernhofer, A. Pitacco, and P. Klein, 2016a: The METCRAX II field experiment A study of downslope windstorm-type flows in Arizona's Meteor Crater. Bull. Amer. Meteor. Soc., 97, Lehner, M., R. Rotunno, and C. D. Whiteman, 2016b: Flow regimes over a basin induced by upstream katabatic flows - An idealized modeling study. J. Atmos. Sci., 73, Leo, L. S., M. Y. Thompson, S. Di Sabatino, and H. J. S. Fernando, 2015: Stratified flow past a hill: Dividing streamline concept revisited. Bound.-Layer Meteor., DOI /s Martinez-Villagrassa, D., M. Lehner, C. D. Whiteman, S. W. Hoch, and J. C. Cuxart- Rodamilans, 2013: The upslope-downslope flow transition on a basin sidewall. J. Appl. Meteor. Climatol., 52, Massey, B., 2006: Mechanics of Fluids, Eighth Edition (Revised by J. Ward-Smith). Taylor and Francis, London, 696pp. Nappo, C. J., 2012: An Introduction to Atmospheric Gravity Waves, 2nd Ed. Elsevier, Inc., 359pp. Peters, J. M., 2016: The impact of effective buoyancy and dynamic pressure forcing on vertical velocities within two-dimensional updrafts. J. Atmos. Sci., 73, Rotunno, R., and M. Lehner, 2016: Two-layer stratified flow past a valley. J. Atmos. Sci., 73,
36 Sachsperger, J., Serafin, S., and V. Grubisic, 2015: Waves on the boundary-layer inversion and their dependence on atmospheric stability. Front. Earth Sci., 3, article 70, 11pp. doi: /feart Savage, L. C., I. Crosby, S. Zhong, W. Yao, W. J. O. Brown, T. W. Horst, and C. D. Whiteman, 2008: An observational and numerical study of a regional-scale downslope flow in northern Arizona. J. Geophys. Res., 113, D Smith, R. B., 1989: Hydrostatic airflow over mountains. Adv. Geophys., 31, Soontiens, N., M. Stastna, and M. L. Waite, 2013: Numerical simulations of waves over large crater topography. J. Atmos. Sci., 70, Stiperski, I., and V. Grubišić, 2011: Trapped lee wave interference in the presence of surface friction. J. Atmos. Sci., 68, Vogt, R., 2008: Visualization of turbulent exchange using a thermal camera. 18th Amer. Meteor. Soc. Symposium on Boundary Layers and Turbulence, 9-13 June 2008, Stockholm. Vosper, S., 1996: Gravity-wave drag on two mountains, Quart. J. Roy. Meteor. Soc., 122, Whiteman, C. D., M. Lehner, S. W. Hoch, B. Adler, N. Kalthoff, and T. Haiden, 2017: Lifting of a katabatic layer over the rim of a basin and its subsequent penetration into the basin. J. Appl. Meteor. Climatol. Submitted. Whiteman, C. D., A. Muschinski, S. Zhong, D. Fritts, S. W. Hoch, M. Hahnenberger, W. Yao, V. Hohreiter, M. Behn, Y. Cheon, C. B. Clements, T. W. Horst, W. O. J. Brown, and S. P. Oncley, 2008: METCRAX 2006 Meteorological experiments in Arizona's Meteor Crater. Bull. Amer. Meteor. Soc., 89,
37 Whiteman, C. D., S. W. Hoch, M. Lehner, and T. Haiden, 2010: Nocturnal cold-air intrusions into a closed basin: Observational evidence and conceptual model. J. Appl. Meteor. Climatol., 49, Wilczak, J. M., S. P. Oncley, and S. A. Stage, 2001: Sonic anemometer tilt correction algorithms. Bound.-Layer Meteor., 99, Winters, K. B., and L. Armi, 2014: Topographic control of stratified fluids: upstream jets, blocking and isolating layers, J. Fluid Mech., 753, Zardi, D., and C. D. Whiteman, 2013: Diurnal mountain wind systems. Chapter 2 in Mountain Weather Research and Forecasting (Chow, F. K., S. F. J. DeWekker, and B. Snyder, Eds.). Springer, Berlin,

38 Figure 1. Topographic map of the Meteor Crater and its surroundings, with elevations (m MSL) 784 indicated in the legend. The crater is on the southwest side of the Little Colorado River drainage, 785 which flows to the northwest. North is at the top of the figure. [Fig01_LargeMap.gif]
39 Figure 2. Map of a) the crater s location in the southwestern United States, b) the topography and measurement sites in the crater s surroundings, and c) the topography and measurement sites in and near the crater, with north at the top of the figures. b) and c) are Universal Transverse Mercator zone 12S projections, with contour intervals at 20 m and 10 m, respectively. The dashed green line shows the location of the vertical dual-lidar cross-section. Dotted black lines in c) are roads. [Fig02_map.jpg]
40 Figure 3. Sample temperature profiles illustrating a) dividing streamline elevation, b) cold air intrusion along the upwind inner sidewall, c) bifurcation, and d) warm air intrusion over the upwind inner sidewall. Data come from 0400, 2120, 0400, and 2300 MST, respectively. The lines of HOBOs extend over the rim and out onto the adjacent plain (see Fig. 2), so temperature profiles include data from both the inner and outer sidewalls. [conceptual_drawing.png] 803

41
42 Figure 4. Time-height cross-sections of tethered balloon a) temperatures and b) horizontal winds (arrows) above the upwind plain at BASE. The south-southwest rim elevation is indicated by horizontal dash-dot lines. In a), the dividing streamline (see Section 4b) at NEAR and the SBL top at NEAR are shown as dashed and solid lines, respectively. The SBL top was determined subjectively from vertical temperature profiles. Color contours in b) are downslope wind components along a 15 azimuth. Winds below (above) 1950 m MSL are from tethered balloon ascents (lidar VAD scans). Tethersonde data are 5-m bin averages every 15 minutes. Lines in b) are downslope speed maximum (solid black) and the 0 and 1 m s -1 downslope (15 azimuth) wind speed isotachs (red solid and red dashed lines, respectively). c) Maximum downslope wind component at BASE; mean downslope wind component in the flowing layer above the dividing streamline at NEAR and for a layer of equal depth at RIM; and mean downslope wind component in the m AGL layer at BASE. Phases are indicated by bold abbreviations (see text) and are bounded by vertical dashed lines. [upstreamwithphases.png]

43
44 Figure 5. Temperature and downslope wind component (along 15 azimuth) time series at NEAR (a and b) and RIM (c and d). Measurement heights (3, 10, 15, m at NEAR and 5, 10, m at RIM) increase from dark blue to orange The 2-m AGL temperature and the 3-m AGL downslope wind speed component at FAR (purple) have been added to a) and b), respectively. e) 40-m AGL vertical velocity at RIM. f) Wind speeds at SSW4, SSW2, FLR and at 5 m AGL at RIM. Hourly g) temperature and h) total (black) and downslope (red) wind speed profiles at RIM (upslope components at 1800 and 1900 MST are not plotted. Named evolutionary phases are bounded by vertical dashed lines. All data are 5-min means. Vertical profiles are a 5-min mean ending at the hour indicated. [urim_t-series&profiles_v4.png]
45 832 42

46
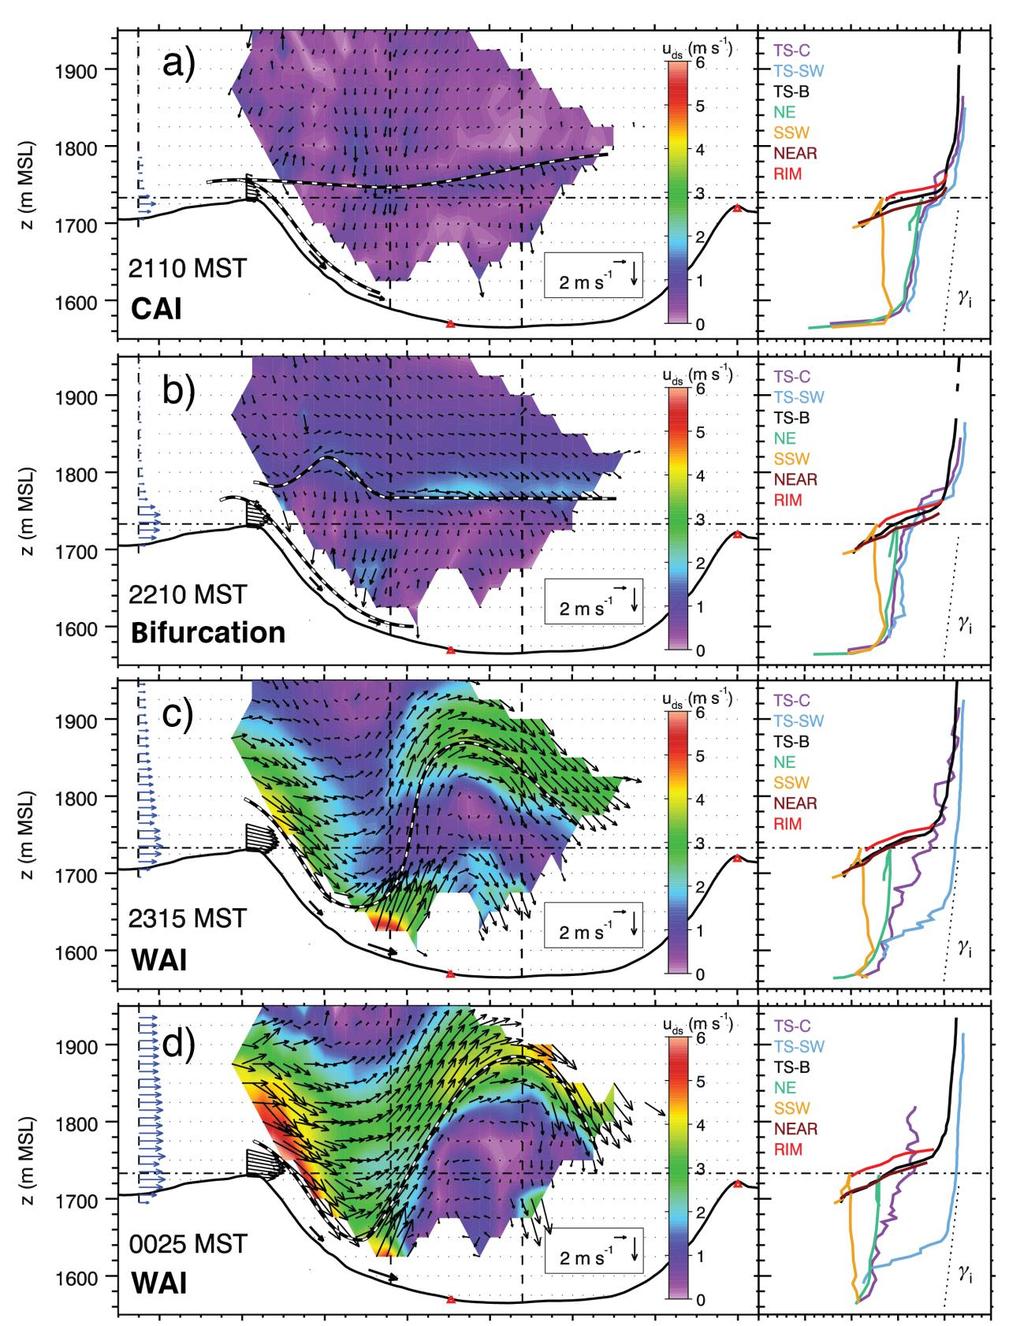
47 Figure 6. Wind and temperature structure during IOP4 within a 15 azimuth vertical plane through the crater (location in Fig. 2). Terrain is indicated by a solid black line and rim elevation by a dot-dash line. Off-plane data are projected perpendicularly onto the plane. 5-min averaging interval. Phases are indicated. Individual tethersonde soundings (not averaged) are the closest in time within ±7.5 minutes of the averaging interval midpoint. Left sub-figures: Black vectors are 2D (u,w) winds. TS-B wind profiles (blue vectors) have no w-component and are offset from its plain location (moved closer to the crater). TS-SW and TS-C sites are at the dashed vertical lines. Winds come from dual-lidar retrievals (red triangles are lidar locations; the north rim lidar is the x-coordinate origin), the RIM tower, the BASE tethersonde, and the SSW4 and SSW2 sites. Color contours (see legend) indicate wind speeds within the plane. The upper and lower black and white dashed lines are the RL base and slope SBL heights, respectively, as determined at from sharp decreases in vertical temperature gradient from measurement sites in the right subfigures. The wind field is used for guidance between sites. RL and SBL heights are identical in the WAI phase. Right sub-figures: Temperature soundings at sites shown in the legend. Sloping dashed lines are isothermal temperature gradients. [Fig06a.jpg and Fig06b.jpg]
48 Figure 7. Temperature difference between the upwind (SSW') and downwind rim (NE'). [Tdiff_NE'-SSW'.eps]

49 Figure 8. Individual FLR lidar RHI radial velocity scans at a) 2006, b) 2210, c) 2315 and d) 0024 MST. Scans are over the upwind inner sidewall in the vertical plane indicated in Fig. 2. The solid black line is the terrain and the dash-dot horizontal line at 1733 m MSL is the RIM tower elevation. Blue and red vertical temperature profiles are from the SSW and NE HOBO lines, respectively. The two colored dots on the terrain cross-section indicate equivalent radial velocities at 2 m AGL at SSW4 and SSW2. Dotted lines highlight the 2 m s -1 radial velocity contour. [Fig09.eps]
 2240, b) 2247 and c) 2252 MST. Temperature profiles are identical in b) and c). Otherwise, same as Fig. 6.")
50 Figure 9. Illustration of the abrupt change in flow structure between the bifurcation and warm air intrusion phases from 2.5-min-mean dual-doppler wind retrievals at a) 2240, b) 2247 and c) 2252 MST. Temperature profiles are identical in b) and c). Otherwise, same as Fig. 6. [Fig09.jpg]

51 Figure 10. Geo-referenced brightness temperature overlay on the Meteor Crater topography at a) 2100 and b) 0000 MST. Adjusted brightness temperature data come from three thermal infrared cameras, two operated side by side on the north rim looking south-southwest and one on the south rim looking north-northeast. Camera locations are shown as white dots in a). Horizontal wind vectors are shown in black at RIM, SSW4 and SSW2 and in white at FLR. [TIR.jpg] 880
52
53 Figure 11. Two-dimensional conceptual diagram (not to scale) of the a) overflow initiation, b) cold air intrusion, c) bifurcation, and d) warm air intrusion phases. Profiling sites are at the labeled red dots in b). Vectors are 2D winds; solid lines above the terrain are selected isentropes. Dashed lines indicate the isentrope at the top of the cold pool. The dot-dash line indicates the dividing streamline. zsbl and zds are the SBL and dividing streamline heights on the plain far upwind of the crater. θne' and θssw' are NE and SSW rim temperatures. b) is modified from a figure in W17. LNB is the level of neutral buoyancy. [concept_4_phases.eps]

54 Figure 12. Time-height cross section of Richardson number at a) TS-B and b) TS-SW. Time boundaries between the different phases are indicated by the vertical dashed lines. The rim elevation is indicated by the horizontal dash-dot line on both a) and b). [Ri_BASE&SW_new.jpg]
METCRAX II An upcoming field investigation of downslopewindstorm-type
 METCRAX II An upcoming field investigation of downslopewindstorm-type flows on the inner sidewall of Arizona's Meteor Crater C. David Whiteman, Sebastian W. Hoch, Rich Rotunno, Ron Calhoun, Manuela Lehner,
10.6 The Dynamics of Drainage Flows Developed on a Low Angle Slope in a Large Valley Sharon Zhong 1 and C. David Whiteman 2
 10.6 The Dynamics of Drainage Flows Developed on a Low Angle Slope in a Large Valley Sharon Zhong 1 and C. David Whiteman 2 1Department of Geosciences, University of Houston, Houston, TX 2Pacific Northwest
Journal of Applied Meteorology and Climatology Lifting of a katabatic flow layer over the rim of a basin and its subsequent penetration into the basin
 Journal of Applied Meteorology and Climatology Lifting of a katabatic flow layer over the rim of a basin and its subsequent penetration into the basin --Manuscript Draft-- Manuscript Number: Full Title:
Chapter 2. Turbulence and the Planetary Boundary Layer
 Chapter 2. Turbulence and the Planetary Boundary Layer In the chapter we will first have a qualitative overview of the PBL then learn the concept of Reynolds averaging and derive the Reynolds averaged
2.4. Applications of Boundary Layer Meteorology
 2.4. Applications of Boundary Layer Meteorology 2.4.1. Temporal Evolution & Prediction of the PBL Earlier, we saw the following figure showing the diurnal evolution of PBL. With a typical diurnal cycle,
LOCAL WINDS. Prof. Stephan De Wekker Department of Env. Sciences Guest lecture EVSC 1300
 LOCAL WINDS Prof. Stephan De Wekker (dewekker@virginia.edu) Department of Env. Sciences Guest lecture EVSC 1300 SEA BREEZE 980 mb 990 mb 1000 mb LAND BREEZE The convergence of two lake breezes and
Mesoscale Meteorology
 Mesoscale Meteorology METR 4433 Spring 2015 3.4 Drylines The dryline is a mesoscale phenomena whose development and evaluation is strongly linked to the PBL. In this section, we will consider its general
The dryline is a mesoscale phenomena whose development and evaluation is strongly linked to the PBL.
 2.2. Development and Evolution of Drylines The dryline is a mesoscale phenomena whose development and evaluation is strongly linked to the PBL. Text books containing sections on dryline: The Dry Line.
Topoclimatic variations in temperature and winds as the basis for mountain refugia. C. David Whiteman University of Utah Salt Lake City
 Topoclimatic variations in temperature and winds as the basis for mountain refugia C. David Whiteman University of Utah Salt Lake City MtnClim 2014, Midway, UT, 15-18 Sept 2014 Definitions temperature
The total precipitation (P) is determined by the average rainfall rate (R) and the duration (D),
 is determined by the average rainfall rate (R) and the duration (D),") Orographic precipitation Common ingredients of heavy orographic precipitation The total precipitation (P) is determined by the average rainfall rate (R) and the duration (D), P = RD. (1) The rainfall rate
Orographic precipitation Common ingredients of heavy orographic precipitation The total precipitation (P) is determined by the average rainfall rate (R) and the duration (D), P = RD. (1) The rainfall rate
Mountain Forced Flows
 Mountain Forced Flows Jeremy A. Gibbs University of Oklahoma gibbz@ou.edu February 3, 2015 1 / 45 Overview Orographic Precipitation Common Ingredients of Heavy Orographic Precipitation Formation and Enhancement
ESCI 343 Atmospheric Dynamics II Lesson 10 - Topographic Waves
 ESCI 343 Atmospheric Dynamics II Lesson 10 - Topographic Waves Reference: An Introduction to Dynamic Meteorology (3 rd edition), J.R. Holton Reading: Holton, Section 7.4. STATIONARY WAVES Waves will appear
Gravity waves and bores. Material kindly provided by Dr. Steven Koch GSD NOAA (Boulder, CO)
") Gravity waves and bores Material kindly provided by Dr. Steven Koch GSD NOAA (Boulder, CO) Presented at Iowa State University 11 April 2005 What is a gravity wave? An oscillation caused by the displacement
Gravity waves and bores Material kindly provided by Dr. Steven Koch GSD NOAA (Boulder, CO) Presented at Iowa State University 11 April 2005 What is a gravity wave? An oscillation caused by the displacement
Over or Around? Kinetic Energy vs. Potential Energy. Critical Factors
 1 Terrain-forced vs. Thermally Driven Flows Thermally Driven Circulations produced by temperature contrasts that form within mountains or between mountains and surrounding plains Terrain-forced flows produced
Analysis of katabatic flow using infrared imaging at micro- and mesoscale
 AMS - Boundary Layers and Turbulence 06/10/2014 Analysis of katabatic flow using infrared imaging at micro- and mesoscale Analysis of katabatic flow using infrared imaging at micro- and mesoscale Martina
Sea and Land Breezes METR 4433, Mesoscale Meteorology Spring 2006 (some of the material in this section came from ZMAG)
") Sea and Land Breezes METR 4433, Mesoscale Meteorology Spring 2006 (some of the material in this section came from ZMAG) 1 Definitions: The sea breeze is a local, thermally direct circulation arising from
Sea and Land Breezes METR 4433, Mesoscale Meteorology Spring 2006 (some of the material in this section came from ZMAG) 1 Definitions: The sea breeze is a local, thermally direct circulation arising from
Local Winds. Please read Ahrens Chapter 10
 Local Winds Please read Ahrens Chapter 10 Scales of Motion Microscale: meters Turbulent eddies Formed by mechanical disturbance or convection Lifetimes of minutes Mesoscale: km s to 100 s of km s Local
Winds and Ocean Circulations
 Winds and Ocean Circulations AT 351 Lab 5 February 20, 2008 Sea Surface Temperatures 1 Temperature Structure of the Ocean Ocean Currents 2 What causes ocean circulation? The direction of most ocean currents
WEATHER SYSTEMS OF MIDDLE LATITUDES
 CHAPTER 10 WEATHER SYSTEMS OF MIDDLE LATITUDES MULTIPLE CHOICE QUESTIONS 1. In equal volumes, which one of the following air masses exerts the highest surface air pressure? a. cp *b. A c. mp d. ct e. mt
Vertical Motion and Atmospheric Stability
 Lesson 4 Vertical Motion and Atmospheric Stability This lesson describes the vertical structure of the atmosphere, atmospheric stability and the corresponding vertical motion. Adiabatic diagrams are introduced
Abrupt marine boundary layer changes revealed by airborne in situ and lidar measurements
 Abrupt marine boundary layer changes revealed by airborne in situ and lidar measurements David A. Rahn 1, Thomas R. Parish 2, and David Leon 2 1 Univeristy of Kansas 2 Univeristy of Wyoming Precision Atmospheric
BUF PIT SLO HTS AHN 10.0 CHS CKL AYS
 Cold-air damming When a cold anticyclone is located to the north of an approximately north-south oriented mountain range in winter, a pool of cold air may become entrenched along the eastern slope and
Atmospheric Waves James Cayer, Wesley Rondinelli, Kayla Schuster. Abstract
 Atmospheric Waves James Cayer, Wesley Rondinelli, Kayla Schuster Abstract It is important for meteorologists to have an understanding of the synoptic scale waves that propagate thorough the atmosphere
MET 200 Lecture 11 Local Winds. Last Lecture: Forces. Review of Forces. Balance of Forces
 MET 200 Lecture 11 Local Winds Last Lecture: Forces Scales of Motion Eddies Sea Breeze Mountain-Valley Circulations Chinook - Snow Eater Drainage Wind - Katabatic Wind 1 2 Review of Forces 1. Pressure
Meteorology. Circle the letter that corresponds to the correct answer
 Chapter 4 Worksheet 3 Meteorology Name: Circle the letter that corresponds to the correct answer 1) Natural convection and turbulence are most likely to occur when: a) temperature decreases rapidly with
DUE TO EXTERNAL FORCES
 17B.6 DNS ON GROWTH OF A VERTICAL VORTEX IN CONVECTION DUE TO EXTERNAL FORCES Ryota Iijima* and Tetsuro Tamura Tokyo Institute of Technology, Yokohama, Japan 1. INTRODUCTION Various types of vertical vortices,
Scales of Atmospheric Motion
 Lecture 12 Local Wind Systems Scales of Atmospheric Motion Small turbulent eddies (swirls) A synoptic eddy 1 Coriolis Effect The larger the scale, the longer the life time. Wind shear and turbulent eddy
18 Flight Hazards over High Ground
 18 Flight Hazards over High Ground meteorology 18.1 Mountain Effect on Fronts When a warm front passes a mountain range, the air, is lifted over the mountain and will strengthen the formation of cloud
Super-parameterization of boundary layer roll vortices in tropical cyclone models
 DISTRIBUTION STATEMENT A. Approved for public release; distribution is unlimited. Super-parameterization of boundary layer roll vortices in tropical cyclone models PI Isaac Ginis Graduate School of Oceanography
August 1990 H. Kondo 435. A Numerical Experiment on the Interaction between Sea Breeze and
 August 1990 H. Kondo 435 A Numerical Experiment on the Interaction between Sea Breeze and Valley Wind to Generate the so-called "Extended Sea Breeze" By Hiroaki Kondo National Research Institute for Pollution
Gravity waves in stable atmospheric boundary layers
 Gravity waves in stable atmospheric boundary layers Carmen J. Nappo CJN Research Meteorology Knoxville, Tennessee 37919, USA Abstract Gravity waves permeate the stable atmospheric planetary boundary layer,
Cold Air Damming. Introduction. Learning Objectives. Cold Air Damming. Cold Air Damming. Cold Air Damming 9/28/17. After this class you should
 Learning Objectives Atmos6250: Mountain Meteorology Jim Steenburgh Department of Atmospheric Sciences University of Utah Jim.Steenburgh@utah.edu After this class you should Recognize areas of North America
Analysis of katabatic flow using infrared imaging at micro and meso scale
 AMS - Boundary Layer and Turbulences 06/10/2014 Analysis of katabatic flow using infrared imaging at micro and meso scale Analysis of katabatic flow using infrared imaging at micro and meso scale Martina
WAVE BREAKING OVER LOCAL TOPOGRAPHY DURING THE MAP IOP 15 MISTRAL EVENT: OBSERVATIONS AND HIGH-RESOLUTION NUMERICAL SIMULATIONS
 WAVE BREAKING OVER LOCAL TOPOGRAPHY DURING THE MAP IOP 15 MISTRAL EVENT: OBSERVATIONS AND HIGH-RESOLUTION NUMERICAL SIMULATIONS Vincent Guénard 1, Gilles Tedeschi 1, Philippe Drobinski 2, Jean Luc Caccia
Exploring wave-turbulence interaction through LES modeling
 Exploring wave-turbulence interaction through LES modeling Mireia Udina 1 Jielun Sun 2 M. Rosa Soler 1 Branko Kosović 2 1. Dept. Astronomia i Meteorologia Universitat de Barcelona, Barcelona, Catalunya
Scott Denning CSU CMMAP 1
 Thermodynamics, Buoyancy, and Vertical Motion Temperature, Pressure, and Density Buoyancy and Static Stability Adiabatic Lapse Rates Dry and Moist Convective Motions Present Atmospheric Composition What
Conditions for Offshore Wind Energy Use
 Carl von Ossietzky Universität Oldenburg Institute of Physics Energy Meteorology Group Detlev Heinemann Conditions for Offshore Wind Energy Use Detlev Heinemann ForWind Carl von Ossietzky Universität Oldenburg
13.6 AIRBORNE RADAR OBSERVATIONS OF BREAKING WAVES/ROTORS IN THE LEE OF THE MEDICINE BOW MOUNTAINS IN SE WYOMING, USA
 13.6 AIRBORNE RADAR OBSERVATIONS OF BREAKING WAVES/ROTORS IN THE LEE OF THE MEDICINE BOW MOUNTAINS IN SE WYOMING, USA Jeffrey R. French 1 *, Samuel Haimov 1, Larry Oolman 1, Vanda Grubišić 2, and Dave
Civil Air Patrol Auxiliary of the United States Air Force
 Mountain Flying Qualification Course Civil Air Patrol Auxiliary of the United States Air Force Mountain Weather Slopes Most U.S. mountain ranges are oriented north-south, while the prevailing winds are
Meteorology Lecture 17
 Meteorology Lecture 17 Robert Fovell rfovell@albany.edu 1 Important notes These slides show some figures and videos prepared by Robert G. Fovell (RGF) for his Meteorology course, published by The Great
6.28 PREDICTION OF FOG EPISODES AT THE AIRPORT OF MADRID- BARAJAS USING DIFFERENT MODELING APPROACHES
 6.28 PREDICTION OF FOG EPISODES AT THE AIRPORT OF MADRID- BARAJAS USING DIFFERENT MODELING APPROACHES Cecilia Soriano 1, Darío Cano 2, Enric Terradellas 3 and Bill Physick 4 1 Universitat Politècnica de
Adiabatic Lapse Rates and Atmospheric Stability
 8 Adiabatic Lapse Rates and Atmospheric Stability Learning Goals After studying this chapter, students should be able to: 1. describe adiabatic processes as they apply to the atmosphere (p. 174); 2. apply
Stormy Weather. tropopause. z i
 Stormy Weather tropopause z i z x High Low Stormy Weather Tropopausez Venting by thunderstorms y Venting by fronts x Stormy Weather Height, z tropopause clouds clouds z i BL n cold air warm air z i BL
ASSESSMENT OF SEA BREEZE CHARACTERISTICS FROM SODAR ECHOGRAMS
 ASSESSMENT OF SEA BREEZE CHARACTERISTICS FROM SODAR ECHOGRAMS SUNEETHA RANI. JUPUDI Prof. M. PURNACHANDRA RAO Department of Physics, Andhra University, Visakhapatnam, India. ABSTRACT The SODAR echograms
Air Pollution Dispersion
 Air Pollution Dispersion Dispersion Processes Convective Dispersion Air Parcel Dynamics Adiabatic Process Lapse Rate Equilibrium and Stability Atmospheric Stability Stability and Dispersion Temperature
Lisa S. Darby and Robert M. Banta NOAA/Earth System Research Laboratory, Boulder, CO 80305
 14.4 THE MODULATION OF CANYON FLOWS BY LARGER-SCALE INFLUENCES Lisa S. Darby and Robert M. Banta NOAA/Earth System Research Laboratory, Boulder, CO 80305 1. INTRODUCTION During October of 2000, the Vertical
What is Air Temperature? Temperature, Buoyancy, and Vertical Motion. How Atmospehric Temperature is Measured. Temperature Scales
 Temperature, Buoyancy, and Vertical Motion Temperature, Pressure, and Density Buoyancy and Static Stability Temperature Lapse Rates Rising & Falling Motions in the Air What is Air Temperature? Temperature
CHAPTER 9. More on meteorology
 CHAPTER 9 More on meteorology 1). Atmospheric Pressure Atmospheric pressure is the pressure with which the atmosphere acts downwards due to its weight. Pressure decreases with altitude because the column
Forest Winds in Complex Terrain
 Forest Winds in Complex Terrain Ilda Albuquerque 1 Contents Project Description Motivation Forest Complex Terrain Forested Complex Terrain 2 Project Description WAUDIT (Wind Resource Assessment Audit and
ATMS 310 Tropical Dynamics
 ATMS 310 Tropical Dynamics Introduction Throughout the semester we have focused on mid-latitude dynamics. This is not to say that the dynamics of other parts of the world, such as the tropics, are any
RECTIFICATION OF THE MADDEN-JULIAN OSCILLATION INTO THE ENSO CYCLE
 RECTIFICATION OF THE MADDEN-JULIAN OSCILLATION INTO THE ENSO CYCLE By William S. Kessler and Richard Kleeman Journal of Climate Vol.13, 1999 SWAP, May 2009, Split, Croatia Maristella Berta What does give
Lecture 7. More on BL wind profiles and turbulent eddy structures. In this lecture
 Lecture 7. More on BL wind profiles and turbulent eddy structures In this lecture Stability and baroclinicity effects on PBL wind and temperature profiles Large-eddy structures and entrainment in shear-driven
A Case Study of Nocturnal Rain Showers over the Windward Coastal Region of the Island of Hawaii
 2674 MONTHLY WEATHER REVIEW A Case Study of Nocturnal Rain Showers over the Windward Coastal Region of the Island of Hawaii JUN LI ANDYI-LENG CHEN Department of Meteorology, School of Ocean and Earth Science
P2.17 OBSERVATIONS OF STRONG MOUNTAIN WAVES IN THE LEE OF THE MEDICINE BOW MOUNTAINS OF SOUTHEAST WYOMING
 P2.17 OBSERVATIONS OF STRONG MOUNTAIN WAVES IN THE LEE OF THE MEDICINE BOW MOUNTAINS OF SOUTHEAST WYOMING Larry D. Oolman 1, Jeffrey R. French 1, Samuel Haimov 1, David Leon 1, and Vanda Grubišić 2 1 University
ABSTRACT INTRODUCTION
 Numerical investigation of the formation of elevated pollution layers over the Los Angeles air basin Rong Lu, R.P. Turco Department of Atmospheric Sciences, University of California, Los Angeles, 405 Hilgard
Goals for today: continuing Ch 8: Atmospheric Circulation and Pressure Distributions. 26 Oct., 2011
 Goals for today: 26 Oct., 2011 continuing Ch 8: Atmospheric Circulation and Pressure Distributions Examples of synoptic scale and mesoscale circulation systems that are driven by geographic diversity in
ESCONDIDO FIRE DEPT TRAINING MANUAL Section Engine Module Page 1 of 15 Wildland Fire Weather Revised
 Engine Module Page 1 of 15 WEATHER Weather is the most critical element of fire behavior. Weather is also the most unpredictable element. Firefighting personnel should be knowledgeable in local weather
PGF. Pressure Gradient. Wind is horizontal movement of the air or other word air in motion. Forces affecting winds 2/14/2017
 Winds Wind is horizontal movement of the air or other word air in motion. Forces affecting winds 1. Pressure gradient force a. High pressure flows to low pressure b. Pressure gradient = difference in pressure
AT350 EXAM #2 November 18, 2003
 AT350 EXAM #2 November 18, 2003 Name and ID: Enter your name and student ID number on the answer sheet and on this exam. Record your answers to the 50 questions by using a No. 2 pencil to completely fill
A Theory for Strong Long-Lived Squall Lines Revisited
 A Theory for Strong Long-Lived Squall Lines Revisited MORRIS L. WEISMAN AND RICHARD ROTUNNO National Center for Atmospheric Research,* Boulder, Colorado (Manuscript received 29 April 2002, in final form
Atmospheric Forces and Force Balances METR Introduction
 Atmospheric Forces and Force Balances METR 2021 Introduction In this lab you will be introduced to the forces governing atmospheric motions as well as some of the common force balances. A common theme
Modelling atmospheric stability with CFD: The importance of tall profiles
 ENERGY Modelling atmospheric stability with CFD: The importance of tall profiles VindKraftNet Seminar on Profiles Jean-François Corbett, Global Head of CFD Service 1 SAFER, SMARTER, GREENER DNV GL CFD
Summary of Lecture 10, 04 March 2008 Introduce the Hadley circulation and examine global weather patterns. Discuss jet stream dynamics jet streams
 Summary of Lecture 10, 04 March 2008 Introduce the Hadley circulation and examine global weather patterns. Discuss jet stream dynamics jet streams arise because the Coriolis force prevents Hadley-type
Influence of rounding corners on unsteady flow and heat transfer around a square cylinder
 Influence of rounding corners on unsteady flow and heat transfer around a square cylinder S. K. Singh Deptt. of Mech. Engg., M. B. M. Engg. College / J. N. V. University, Jodhpur, Rajasthan, India Abstract
OPERATIONAL USE OF A WIND PROFILER FOR AVIATION METEOROLOGY ABSTRACT
 OPERATIONAL USE OF A WIND PROFILER FOR AVIATION METEOROLOGY Miguel Angel Pelacho, Darío Cano, Eugenio Ayensa Spanish Agency of Meteorology (AEMET) Parque del Buen Retiro, Apdo. 285, 28080-MADRID E-mail:
Cloud Development and Forms
 Chapter 6 Lecture Understanding Weather and Climate Seventh Edition Cloud Development and Forms Redina L. Herman Western Illinois University Mechanisms That Lift Air When air lifts, clouds develop and
AIRFLOW GENERATION IN A TUNNEL USING A SACCARDO VENTILATION SYSTEM AGAINST THE BUOYANCY EFFECT PRODUCED BY A FIRE
 - 247 - AIRFLOW GENERATION IN A TUNNEL USING A SACCARDO VENTILATION SYSTEM AGAINST THE BUOYANCY EFFECT PRODUCED BY A FIRE J D Castro a, C W Pope a and R D Matthews b a Mott MacDonald Ltd, St Anne House,
Thorsten Mauritsen *, Gunilla Svensson Stockholm University, Stockholm, Sweden
 J.1 WAVE FLOW SIMULATIONS OVER ARCTIC LEADS Thorsten Mauritsen *, Gunilla Svensson Stockholm University, Stockholm, Sweden Branko Grisogono Department of Geophysics, Faculty of Science, Zagreb, Croatia
Wind: Small-scale and Local Systems
 Wind: Small-scale and Local Systems Scales of Atmospheric Motion Atmospheric motions/phenomena occur on many diverse spatial and temporal scales. Weather forecasters tend to focus on Mesoscale and synoptic
The Coriolis force, geostrophy, Rossby waves and the westward intensification
 Chapter 3 The Coriolis force, geostrophy, Rossby waves and the westward intensification The oceanic circulation is the result of a certain balance of forces. Geophysical Fluid Dynamics shows that a very
Meteorology & Air Pollution. Dr. Wesam Al Madhoun
 Meteorology & Air Pollution Dr. Wesam Al Madhoun Dispersion = Advection (Transport) + Dilution (Diffusion) Source Transport Receptor Re-entrainment Fick s law of diffusion J= - D * D C/Dx Where, J= Mass
Air-Sea Interaction Spar Buoy Systems
 DISTRIBUTION STATEMENT A: Distribution approved for public release; distribution is unlimited Air-Sea Interaction Spar Buoy Systems Hans C. Graber CSTARS - University of Miami 11811 SW 168 th Street, Miami,
DIRECCION DE PERSONAL AERONAUTICO DPTO. DE INSTRUCCION PREGUNTAS Y OPCIONES POR TEMA
 MT DIREION DE PERSONL ERONUTIO DPTO. DE INSTRUION PREGUNTS Y OPIONES POR TEM 1 TEM: 0643 OM-RT - Weather - hap. 6 OD_PREG: PREG20098600 (5301) PREGUNT: Every physical process of weather is accompanied
1 INTRODUCTION. Figure 2: Synoptical situation at the beginning of the simulation: 5th January 1999 at 12UTC.
 2.2 NOCTURNAL CIRCULATIONS UNDER WEAK PRESSURE GRADIENTS IN THE ISLAND OF MALLORCA J. Cuxart and M.A. Jiménez Universitat de les Illes Balears, Spain 1 INTRODUCTION To study the local nocturnal circulations
Meteorology I Pre test for the Second Examination
 Meteorology I Pre test for the Second Examination MULTIPLE CHOICE 1. A primary reason why land areas warm up more rapidly than water areas is that a) on land, all solar energy is absorbed in a shallow
Chapter 3 Atmospheric Thermodynamics
 Chapter 3 Atmospheric Thermodynamics Spring 2017 Partial Pressure and Dalton Dalton's law of partial pressure: total pressure exerted by a mixture of gases which do not interact chemically is equal to
Yelena L. Pichugina 1,2, R. M. Banta 2, N. D. Kelley 3, W. A. Brewer 2, S. P. Sandberg 2, J. L. Machol 1, 2, and B. J. Jonkman 3
 4 th Symposium on Lidar Atmos. Applic, AMS, Phoenix, Arizona, January 2009 5.5 LIDAR MEASUREMENTS OF EXTREME INFLOW EVENTS FOR WIND ENERGY OPERATIONS Yelena L. Pichugina 1,2, R. M. Banta 2, N. D. Kelley
PHSC 3033: Meteorology Stability
 PHSC 3033: Meteorology Stability Equilibrium and Stability Equilibrium s 2 States: Stable Unstable Perturbed from its initial state, an object can either tend to return to equilibrium (A. stable) or deviate
Strengthening of the tropopause inversion layer during the 2009 sudden stratospheric warming in the MERRA-2 analysis
 Strengthening of the tropopause inversion layer during the 009 sudden stratospheric warming in the MERRA- analysis K. Wargan and L. Coy Global Modeling and Assimilation Office Outline We use the MERRA-
Section 1. Global Wind Patterns and Weather. What Do You See? Think About It. Investigate. Learning Outcomes
 Chapter 5 Winds, Oceans, Weather, and Climate Section 1 Global Wind Patterns and Weather What Do You See? Learning Outcomes In this section, you will Determine the effects of Earth s rotation and the uneven
The atmospheric circulation system
 The atmospheric circulation system Key questions Why does the air move? Are the movements of the winds random across the surface of the Earth, or do they follow regular patterns? What implications do these
An experimental study of internal wave generation through evanescent regions
 An experimental study of internal wave generation through evanescent regions Allison Lee, Julie Crockett Department of Mechanical Engineering Brigham Young University Abstract Internal waves are a complex
VI. Static Stability. Consider a parcel of unsaturated air. Assume the actual lapse rate is less than the dry adiabatic lapse rate: Γ < Γ d
 VI. Static Stability Consider a parcel of unsaturated air. Assume the actual lapse rate is less than the dry adiabatic lapse rate: Γ < Γ d VI. Static Stability Consider a parcel of unsaturated air. Assume
It seemed that airplanes arriving and departing AVWEATHER
 BY ED BROTAK It seemed that airplanes arriving and departing from Will Rogers World Airport in Oklahoma City, Oklahoma, United States, on the morning of Aug. 3, 2012, would have few problems with wind
THREE DIMENSIONAL STRUCTURES OF FLOW BEHIND A
 The Seventh Asia-Pacific Conference on Wind Engineering, November 8-12, 29, Taipei, Taiwan THREE DIMENSIONAL STRUCTURES OF FLOW BEHIND A SQUARE PRISM Hiromasa Kawai 1, Yasuo Okuda 2 and Masamiki Ohashi
MET Lecture 8 Atmospheric Stability
 MET 4300 Lecture 8 Atmospheric Stability Stability Concept Stable: Ball returns to original position Neutral: Ball stays wherever it is placed Unstable: Displacement grows with time. Atmospheric Stability
The dynamics of heat lows over flat terrain
 The dynamics of heat lows over flat terrain Roger K. Smith, Thomas Spengler presented by Julia Palamarchuk, Ukraine, Odessa Split Workshop in Atmospheric Physics and Oceanography, May 22-30, Split, Croatia
THE BRIDGE COLLAPSED IN NOVEMBER 1940 AFTER 4 MONTHS OF ITS OPENING TO TRAFFIC!
 OUTLINE TACOMA NARROWS BRIDGE FLOW REGIME PAST A CYLINDER VORTEX SHEDDING MODES OF VORTEX SHEDDING PARALLEL & OBLIQUE FLOW PAST A SPHERE AND A CUBE SUMMARY TACOMA NARROWS BRIDGE, USA THE BRIDGE COLLAPSED
Wind Profiler Observations of Mountain Waves and Rotors during T-REX
 826 J O U R N A L O F A P P L I E D M E T E O R O L O G Y A N D C L I M A T O L O G Y VOLUME 50 Wind Profiler Observations of Mountain Waves and Rotors during T-REX STEPHEN A. COHN National Center for
Characterization of Boundary-Layer Meteorology During DISCOVER-AQ
 Characterization of Boundary-Layer Meteorology During DISCOVER-AQ Daniel M. Alrick and Clinton P. MacDonald Sonoma Technology, Inc. Gary A. Morris St. Edward s University for Texas Air Quality Research
Chapter 4. Convec.on Adiaba.c lapse rate
 Chapter 4 Convec.on Adiaba.c lapse rate 1.Outline: a. air parcel theory, adiabatic processes b. how do we define/determine atmospheric stability? 2.Readings: Chapter 4 VERTICAL STRUCTURE T STRATIFICATION
Small- and large-scale circulation
 The Earth System - Atmosphere II Small- and large-scale circulation Atmospheric Circulation 1. Global atmospheric circulation can be thought of as a series of deep rivers that encircle the planet. 2. Imbedded
Isaac Newton ( )
") Introduction to Climatology GEOGRAPHY 300 Isaac Newton (1642-1727) Tom Giambelluca University of Hawai i at Mānoa Atmospheric Pressure, Wind, and The General Circulation Philosophiæ Naturalis Principia
Introduction to Climatology GEOGRAPHY 300 Isaac Newton (1642-1727) Tom Giambelluca University of Hawai i at Mānoa Atmospheric Pressure, Wind, and The General Circulation Philosophiæ Naturalis Principia
Meteorology. Circle the letter that corresponds to the correct answer
 Chapter 6 Worksheet 2 Meteorology Name: Circle the letter that corresponds to the correct answer 1) A steep pressure gradient: a. produces light winds. b. produces strong winds. c. is only possible in
Currents measurements in the coast of Montevideo, Uruguay
 Currents measurements in the coast of Montevideo, Uruguay M. Fossati, D. Bellón, E. Lorenzo & I. Piedra-Cueva Fluid Mechanics and Environmental Engineering Institute (IMFIA), School of Engineering, Research
INTRODUCTION * Corresponding author address: Michael Tjernström, Stockholm University, Department of Meteorology, SE-
 4.12 NEW ENGLAND COASTAL BOUNDARY LAYER MODELING Mark Žagar and Michael Tjernström * Stockholm University, Stockholm, Sweden Wayne Angevine CIRES, University of Colorado, and NOAA Aeronomy Laboratory,
EVE 402/502 Air Pollution Generation and Control. Introduction. Intro, cont d 9/18/2015. Chapter #3 Meteorology
 EVE 402/502 Air Pollution Generation and Control Chapter #3 Meteorology Introduction Meteorology is the study and forecasting of weather changes resulting from large-scale atmospheric circulation Characteristics
Investigation on Deep-Array Wake Losses Under Stable Atmospheric Conditions
 Investigation on Deep-Array Wake Losses Under Stable Atmospheric Conditions Yavor Hristov, Mark Zagar, Seonghyeon Hahn, Gregory Oxley Plant Siting and Forecasting Vestas Wind Systems A/S Introduction Introduction
Global Flow Solutions Mark Zagar, Cheng Hu-Hu, Yavor Hristov, Søren Holm Mogensen, Line Gulstad Vestas Wind & Site Competence Centre, Technology R&D
 Global Flow Solutions Mark Zagar, Cheng Hu-Hu, Yavor Hristov, Søren Holm Mogensen, Line Gulstad Vestas Wind & Site Competence Centre, Technology R&D vestas.com Outline The atmospheric modeling capabilities
The Influence of Ocean Surface Waves on Offshore Wind Turbine Aerodynamics. Ali Al Sam
 The Influence of Ocean Surface Waves on Offshore Wind Turbine Aerodynamics Ali Al Sam What I m going to wear today? Do I need to leave early to get to work? Taking buss or riding bike? Where will we drink