UPDATING THE AASHTO LRFD WIND LOAD PROVISIONS
|
|
|
- Alyson Scott
- 5 years ago
- Views:
Transcription
1 UPDATING THE AASHTO LRFD WIND LOAD PROVISIONS Prepared for: National Cooperative Highway Research Program Transportation Research Board National Research Council Prepared by: Wagdy Wassef, Ph.D., P.E. Modjeski and Masters, Inc. Mechanicsburg, PA Jon Raggett, Ph.D., S.E., P.E. West Wind Laboratory, Inc. Monterey, CA August, 2014 The information contained in this report was prepared as part of NCHRP Project 20-07, Task 325, National Cooperative Highway Research Program. SPECIAL NOTE: This report IS NOT an official publication of the National Cooperative Highway Research Program, Transportation Research Board, National Research Council, or The National Academies.
2 This page is intentionally left blank
3 Acknowledgements This study was conducted for the American Association of State Highway and Transportation Officals (AASHTO), with funding provided through the National Cooperative Highway Research Program (NCHRP) Project 20-07, Task 325, Updating the AASHTO LRFD Wind Loads Provisions. The NCHRP is supported by annual voluntary contributions from the state Departments of Transportation. Project is intended to fund quick response studies on behalf of the AASHTO Standing Committee on Highways. The report was prepared by Dr. Wagdy Wassef of Modjeski and Masters, and Dr. Jon Raggett of West Wind Laboratories. The work was guided by a technical working group. The project was managed by Dr. Waseem Dekelbab, NCHRP Senior Program Officer. Disclaimer The opinions and conclusions expressed or implied are those of the research agency that performed the research and are not necessarily those of the Transportation Research Board or its sponsoring agencies. This report has not been reviewed or accepted by the Transportation Research Board Executive Committee or the Governing Board of the National Research Council.
4 This page is intentionally left blank ii
5 TABLE OF CONTENTS LIST OF FIGURES... v LIST OF TABLES... ix ACKNOWLEDGMENTS... xi ABSTRACT... xiii EXECUTIVE SUMMARY BACKGROUND AND RESEARCH APPROACH Background Problem Statement and Research Objective Scope of the Study Research Approach LITERATURE SEARCH Review of Existing Literature Review of Wind Loads in Major Specifications Conclusions Regarding the State-of-the-Art of Wind Design WIND TUNNEL TEST PROGRAM Introduction and Objectives Configurations Tested Test Program Wind Tunnel Facility Model Descriptions, Model Properties, Test Procedures Dynamic Test Results and Test Summaries WIDE-FLANGE I-SHAPED BEAM (Shape 1) NARROW-FLANGE I-SHAPED BEAM (Shape 2) DEEP OPEN-TOPPED BOX (Shape 3) SQUARE OPEN-TOPPED BOX (Shape 4) SHALLOW OPEN-TOPPED BOX (Shape 5) SQUARE OPEN-TOPPED BOX WITH SLOPING SIDES (Shape 6) SQUARE BOX WITH NARROW DECK (Shape 7) SHALLOW BOX WITH NARROW DECK (Shape 8) SHALLOW BOX WITH WIDE DECK (Shape 9) Static Test Results Wind Tunnel Testing Summary iii
6 4 Proposed Specifications Major Changes to Current Provisions Modifications to Specifications Article Modifications to Specifications Article Modifications to Specifications Article Modifications to Specifications Article COMPARISON OF WIND LOADS DETERMINED USING THE PROPOSED SPECIFICATIONS PROVISIONS TO EXISTING PROVISIONS EXAMPLE OF THE APPLICATION OF PROPOSED WIND LOAD PROVISIONS REFERENCES APPENDIX A - COMPARISON OF WIND LOADS DETERMINED USING THE PROPOSED SPECIFICATIONS PROVISIONS TO EXISTING PROVISIONS... A-1 APPENDIX B EXPLANATIONS OF VARIABLES AND RELATIONSHIPS USED IN THE PROPOSED REVISED SECTION B-1 iv
7 LIST OF FIGURES Figure 3-1 Cross-Section of Shape 1, I-Beam with Wide Flanges Figure 3-2 Cross-Section of Shape 2, I-Beam with Narrow Flanges Figure 3-3 Cross-Section of Shape 3, Deep Open-Topped Box Figure 3-4 Cross-Section of Shape 4, Square Open-Topped Box Figure 3-5 Cross-Section of Shape 5, Shallow Open-Topped Box Figure 3-6 Cross-Section of Shape 6, Open-Topped Box with Inclined Webs Figure 3-7 Cross-Section of Shape 7, Square Box with Narrow Deck Figure 3-8 Cross-Section of Shape 8, Shallow Box with Narrow Deck Figure 3-9 Cross-Section of Shape 9, Shallow Box with Wide Deck Figure 3-10 End Support of Beams during Wind Tunnel Testing Figure 3-11 Wind Tunnel Schematic and Beams during Testing Figure 3-12 Wide Flange I-Beam (Shape 1) Figure 3-13 Narrow Flange I-Beam (Shape 2) Figure 3-14 Tall Open-Topped Box-Girder (Shape 3) Figure 3-15 Square Open-Topped Box-Girder (Shape 4) Figure 3-16 Shallow Open-Topped Box-Girder (Shape 5) Figure 3-17 Square Open-Topped Box-Girder with Sloping Sides (Shape 6) Figure 3-18 Square Box-Girder with Narrow Deck (Shape 7) Figure 3-19 Shallow Box-Girder with Wide Deck (Shape 9) Figure Steady-State Motions of Wide Flange I-Beam (Shape 1) Wind at 0 Degrees Figure 3-21 Steady-State Motions of Wide Flange I-Beam (Shape 1) - Wind at -5 Degrees.. 41 Figure 3-22 Steady-State Motions of Wide Flange I-Beam (Shape 1) Wind at -10 Degrees 42 Figure 3-23 Steady-State Motions of Wide Flange I-Beam (Shape 1) Wind at 0 Degrees Figure 3-24 Steady-State Motion of Wide Flange I-Beam (Shape 1) Wind at -5 Degrees Figure 3-25 Steady-State Motion of Wide Flange I-Beam (Shape 1) Wind at -10 Degrees.. 45 Figure 3-26 Steady-State Motion of Double Wide Flange I-Beam (Shape 1) Wind at 0 Degrees Figure 3-27 Steady-State Motion of Double Wide Flange I-Beam (Shape 1) Wind at -5 Degrees Figure 3-28 Steady-State Motion of Double Wide Flange I-Beam (Shape 1) Wind at -10 Degrees Figure 3-29 Steady-State Motion of Narrow Flange I-Beam (Shape 2) Wind at 0 Degrees. 49 Figure 3-30 Steady-State Motion of Narrow Flange I-Beam (Shape 2) Wind at -5 Degrees 49 Figure 3-31 Steady-State Motion of Narrow Flange I-Beam (Shape 2) Wind at -10 Degrees50 Figure 3-32 Steady-State Motion of Narrow Flange I-Beam (Shape 2) Wind at 0 Degrees. 51 Figure 3-33 Steady-State Motion of Narrow Flange I-Beam (Shape 2) Wind at -5 Degrees 52 Figure 3-34 Steady-State Motion of Narrow Flange I-Beam (Shape 2) Wind at -10 Degrees53 Figure 3-35 Steady-State Motion of Deep Open-Topped Box-Girder (Shape 3) Wind at 0 Degrees Figure 3-36 Steady-State Motion of Deep Open-Topped Box-Girder (Shape 3) Wind at -5 Degrees Figure 3-37 Steady-State Motion of Deep Open-Topped Box-Girder (Shape 3) Wind at -10 Degrees v
8 Figure 3-38 Steady-State Motion of Deep Open-Topped Box-Girder (Shape 3) Wind at 5 Degrees Figure 3-39 Steady-State Motion of Deep Open-Topped Box-Girder (Shape 3) Wind at 10 Degrees Figure 3-40 Steady-State Motion of Deep Open-Topped Box-Girder (Shape 3) Wind at 0 Degrees Figure 3-41 Steady-State Motion of Deep Open-Topped Box-Girder (Shape 3) Wind at -5 Degrees Figure 3-42 Steady-State Motion of Deep Open-Topped Box-Girder (Shape 3) Wind at -10 Degrees Figure 3-43 Steady-State Motion of Deep Open-Topped Box-Girder (Shape 3) - Wind at 5 Degrees Figure 3-44 Steady-State Motion of Deep Open-Topped Box-Girder (Shape 3) Wind at 10 Degrees Figure 3-45 Steady-State Motion of Square Open-Topped Box-Girder (Shape 4) Wind at 0 Degrees Figure 3-46 Steady-State Motion of Square Open-Topped Box-Girder (Shape 4) Wind at -5 Degrees Figure 3-47 Steady-State Motion of Square Open-Topped Box-Girder (Shape 4) Wind at -10 Degrees Figure 3-48 Steady-State Motion of Square Open-Topped Box-Girder (Shape 4) Wind at 5 Degrees Figure 3-49 Steady-State Motion of Square Open-Topped Box-Girder (Shape 4) Wind at 10 Degrees Figure 3-50 Steady-State Motion of Square Open-Topped Box-Girder (Shape 4) Wind at 0 Degrees Figure 3-51 Steady-State Motion of Square Open-Topped Box-Girder (Shape 4) Wind at -5 Degrees Figure 3-52 Steady-State Motion of Square Open-Topped Box-Girder (Shape 4) Wind at -10 Degrees Figure 3-53 Steady-State Motion of Square Open-Topped Box-Girder (Shape 4) Wind at 5 Degrees Figure 3-54 Steady-State Motion of Square Open-Topped Box-Girder (Shape 4) Wind at 10 Degrees Figure 3-55 Steady-State Motion of Shallow Open-Topped Box-Girder (Shape 5) Wind at 0 Degrees Figure 3-56 Steady-State Motion of Shallow Open-Topped Box-Girder (Shape 5) Wind at -5 Degrees Figure 3-57 Steady-State Motion of Shallow Open-Topped Box-Girder (Shape 5) Wind at - 10 Degrees Figure 3-58 Steady-State Motion of Shallow Open-Topped Box-Girder (Shape 5) Wind at 5 Degrees Figure 3-59 Steady-State Motion of Shallow Open-Topped Box-Girder (Shape 5) Wind at 10 Degrees vi
9 Figure 3-60 Steady-State Motion of Shallow Open-Topped Box-Girder (Shape 5) Wind at 0 Degrees Figure 3-61 Steady-State Motion of Shallow Open-Topped Box-Girder (Shape 5) Wind at -5 Degrees Figure 3-62 Steady-State Motion of Shallow Open-Topped Box-Girder (Shape 5) Wind at - 10 Degrees Figure 3-63 Steady-State Motion of Shallow Open-Topped Box-Girder (Shape 5) Wind at 5 Degrees Figure 3-64 Steady-State Motion of Shallow Open-Topped Box-Girder (Shape 5) Wind at 10 Degrees Figure 3-65 Steady-State Motion of Shallow Open-Topped Box-Girder with Sloping Sides (Shape 6) Wind at 0 Degrees Figure 3-66 Steady-State Motion of Shallow Open-Topped Box-Girder with Sloping Sides (Shape 6) Wind at -5 Degrees Figure 3-67 Steady-State Motion of Shallow Open-Topped Box-Girder with Sloping Sides (Shape 6) Wind at -10 Degrees Figure 3-68 Steady-State Motion of Shallow Open-Topped Box-Girder with Sloping Sides (Shape 6) Wind at 5 Degrees Figure 3-69 Steady-State Motion of Shallow Open-Topped Box-Girder with Sloping Sides (Shape 6) Wind at 10 Degrees Figure 3-70 Steady-State Motion of Shallow Open-Topped Box-Girder with Sloping Sides (Shape 6) Wind at 0 Degrees Figure 3-71 Steady-State Motion of Shallow Open-Topped Box-Girder with Sloping Sides (Shape 6) Wind at -5 Degrees Figure 3-72 Steady-State Motion of Shallow Open-Topped Box-Girder with Sloping Sides (Shape 6) Wind at -10 Degrees Figure 3-73 Steady-State Motion of Shallow Open-Topped Box-Girder with Sloping Sides (Shape 6) Wind at 5 Degrees Figure 3-74 Steady-State Motion of Shallow Open-Topped Box-Girder with Sloping Sides (Shape 6) Wind at 10 Degrees Figure 3-75 Steady-State Motion of Square Box-Girder with Narrow Deck (Shape 7) Wind at 0 Degrees Figure 3-76 Steady-State Motion of Shallow Box-Girder with Narrow Deck (Shape 8) Wind at 0 Degrees Figure 3-77 Steady-State Motion of Shallow Box-Girder with Wide Deck (Shape 9) Wind at 0 Degrees vii
10 This page is intentionally left blank. viii
11 LIST OF TABLES Table 2-1 Gap Ratio vs. Strouhal Number... 7 Table 2-2 Wind Speeds for Central Portion of United States Table 2-3 AASHTO Wind Speeds Table 2-4 AASHTO Wind Speeds based on MRI = 1000 years Table 2-5 Wind Pressures Calculated using Proposed Pressure Equation Table 2-6 Wind Pressures from Existing AASHTO LRFD Table 2-7 Long-Span Bridges Subject to Vortex-Induced Motion Table 3-1 Dynamic Test Program Table 3-2 Static Test Program Table 3-3 Model Dynamic Properties Table 3-4 Drag Coefficients Table 3-5 Drag Coefficients on Downstream Square Boxes Table 3-6 Critical Flutter Wind Speeds Table 3-7 Static Drag Coefficients ix
12 This page is intentionally left blank. x
13 Acknowledgements The research reported herein was performed by Modjeski and Masters, Inc. supported by the West Wind Laboratory, Inc. Dr. Wagdy Wassef of Modjeski and Masters, Inc. was the Principal Investigator. Dr. Jon Raggett of the West Wind Laboratory, Inc. directed the wind tunnel testing and interpreted the results. The research team acknowledges the contributions of Dr. John M. Kulicki of Modjeski and Masters, Inc. in reviewing the proposed design provisions and his guidance throughout the project. The contributions of Ms. Vanessa Storlie, P.E., of Modjeski and Masters, Inc. for performing the wind load comparisons, preparing the wind load calculations example, and editing and assembling the final report are also acknowledged. The contribution of Ms. Ann Keeble of West Wind Laboratory, Inc. to the preparation of the wind tunnel test documentation is also acknowledged. xi
14 This page is intentionally left blank. xii
15 ABSTRACT The AASHTO LRFD Bridge Design Specifications (AASHTO LRFD) was written in the early 1990 s with wind load provisions that were derived from the American Society of Civil Engineering (ASCE) Minimum Design Loads for Buildings and Other Structures/ASCE 7-88 and adapted for bridge design. These provisions were based on the fastest-mile measure of wind speed which was used by the National Weather Service. However, since then, the National Weather Service has changed to the 3-second-gust measure of wind speed and recent editions of ASCE 7 have also been based on the 3-second gust. The revisions were based on years of ongoing research of wind loads on structures and included new wind speed maps based on the 3-second-gust. For most bridges, designers using the current AASHTO LRFD use base wind speed and base wind pressure that are the same for the entire country. The base wind speed is 100 mph and the base wind pressure is 40 or 50 psf depending on the structural element. The specifications require adjusting the wind speed for the design elevation and for the exposure and upstream surface conditions; however, a designer may use the base wind speed with no adjustment to account for the variations based on the geographical location across the country. This is conservative for the majority of the country where the 50 year recurrence wind is mph but this is non-conservative for hurricane-prone regions. Alternatively, the wind speed may be taken from a site-specific wind study or from the ASCE 7-88 wind speed maps. The latter do not properly account for the higher wind speeds associated with hurricanes. The current method in the AASHTO LRFD does not provide consistent reliability for different regions and locations. For example, a bridge designed according to these wind loads will have lower reliability if located in the hurricane-prone regions along the Gulf of Mexico and the Atlantic Ocean where wind speeds higher than those expected inland are possible. In addition, there have been some reports of typical bridges experiencing excessive motions and vibrations due to wind loads during construction. The current wind provisions in the AASHTO LRFD specifications do not include adequate guidelines to identify these bridges. This project was initiated to update the wind load provisions in AASHTO LRFD to provide more uniform reliability and to develop provisions to identify bridges prone to excessive motions and vibrations due to wind loads during construction. xiii
16 This page is intentionally left blank. xiv
17 Executive Summary NCHRP Project 20-07/ Task 325 was performed to update the wind load specifications of the AASHTO LRFD Bridge Design Specifications (AASHTO LRFD) to provide uniform reliability across the United States. Additionally, the susceptibility of I-girder and box-girder bridges to excessive motion during and after construction was evaluated and guidance is provided to identify these bridges. Wind loads during construction were also investigated. The wind load provisions of the AASHTO LRFD Bridge Design Specifications (AASHTO LRFD) were derived from the American Society of Civil Engineering (ASCE) Minimum Design Loads for Buildings and Other Structures/ASCE 7-88 and adapted for bridge design. The existing provisions were based on the fastest-mile wind speed used by the National Weather Service. The fastest mile wind determination is based on measuring the shortest time a mile long column of air takes to pass by a fixed point. The wind speed is assumed to be constant during the measured time, i.e. the wind speed is averaged over the measured time. This means that the averaging time varies depending on the average wind speed. Since the development of the AASHTO LRFD, both the National Weather Service and ASCE 7 have changed to the 3-second-gust wind speed. The change to the 3-second gust wind speed was based on years of ongoing research of wind loads on structures. Most designers using AASHTO LRFD use the base wind speed, 100 mph, and the base wind pressure, 40 or 50 psf depending on the structural element. These base values are the same for the entire country. After adjusting for the design elevation, the exposure, and the upstream surface conditions as required by the specifications, the resulting design loads are conservative for the majority of the country. However, in hurricane-prone regions, the resulting wind loads are non-conservative due to a lack of consideration of the higher maximum wind speeds. An alternative to using the 100 mph base wind speed is to determine the wind speed from a sitespecific wind study or from the ASCE 7-88 wind speed maps which do not properly account for the higher wind speeds associated with hurricanes. To produce a consistent level of reliability, the design wind speed must reflect the actual wind speed at a given location. The current AASHTO LRFD wind provisions do not provide for consistent reliability when the 100 mph base wind speed is used without adjustment for the geographical location. A review of existing wind load-related literature found that most of the existing literature is related to long span, cable-stayed and suspension bridges. As such, most of the literature was not useful in developing wind load provisions for typical structures. Based on the literature review, as well as the review of other design specifications, the use of a constant averaging time was deemed necessary to be consistent with modern design codes and the use of the 3-second gust wind speed was determined to be the most feasible. The 3- second averaging time is consistent with building and meteorological practices in the United States and wind speed maps based on the 3-second gust are readily available and can be easily adopted. Proposed revisions to the AASHTO LRFD wind load provisions utilizing the 3- second wind gust were prepared. The proposed specifications were used to develop wind load comparisons between the existing and proposed specifications. The comparisons indicate that for a majority of the United States, the wind pressures will be similar to or lower than those calculated using the existing specifications. For high wind regions, mainly areas along the 1
18 Atlantic, Gulf and Alaskan coastlines, the proposed specifications result in higher wind pressures and wind loads. In addition to updating the AASHTO LRFD wind load provisions for bridges in service, this project developed new guidance on identifying bridges prone to excessive motions and vibrations during construction and to develop provisions for determining wind loads during construction. This was accomplished through extensive wind tunnel testing of scale models of I- and box-girder bridges during and after construction, i.e. without and with the bridge deck. Guidance on identifying vulnerable bridges and the magnitude of wind loads during construction was developed and incorporated into the proposed design provisions. The limits defining the sensitivity of a structure to wind-induced motions are dependent on the 10-minutes averaged wind speed and the natural frequency and depth of the structure. 2
19 1 BACKGROUND AND RESEARCH APPROACH 1.1 Background The AASHTO LRFD Bridge Design Specifications (AASHTO LRFD) represent a refinement to bridge design practice as compared to past American Association of State Highway and Transportation Officials (AASHTO) specifications. A primary goal of using the Load and Resistance Factor Design (LRFD) philosophy is to achieve uniform reliability through statistical calibration. However, during the development of AASHTO LRFD, the methods used to determine design wind loads did not produce uniform reliability. In addition, there were gaps in the knowledge regarding wind loads and the behavior of typical bridges during construction. This project was initiated to update the wind loads provisions in AASHTO LRFD and to develop guidance on identifying bridges prone to excessive motions and vibrations during construction. 1.2 Problem Statement and Research Objective The objectives of this research, as stated in the project s Request for Proposal (RFP), are to propose revisions to the wind load provisions in Section 3 Loads and Load Factors and other related sections of the AASHTO LRFD. Later, the scope was expanded to include wind tunnel testing of models representing typical I- and box-girder bridges during construction. The additional work was meant to be used in the development of guidelines to identify bridges that may be vulnerable to aeroelastic instability during construction and, where possible, to develop design provisions to determine the design wind loads on typical bridges during construction. 1.3 Scope of the Study The scope of the study was generally determined by the tasks identified in the RFP as the tasks anticipated to be encompassed by the research. The task descriptions, copied from the RFP, are provided below. Task 1. Review relevant literature, specifications and manuals, ongoing research, current practices, and other information canvassing all engineering disciplines to determine the current state-of-knowledge. This information shall be assembled from published and unpublished reports, bridge owners, and others. Task 2. Summarize the various developments since the publication of the original wind load provisions and identify gaps in the current provisions. Task 3. Prepare a detailed outline identifying the proposed areas of the AASHTO LRFD wind load provisions that will require modification or addition. Propose examples to illustrate the proposed revisions. 3
20 Task 4. According to the approved outline, develop (1) specification language, commentary and associated graphics for inclusion within future editions of the AASHTO LRFD Bridge Design Specifications; and (2) examples. Task 5. Make presentations to the AASHTO HSCOBS Technical Committee T-5 Loads and Load Distribution. Revise the proposed specifications and commentary in accordance with project panel and T-5 feedback. Task 6. Submit a final report describing the entire research effort. 1.4 Research Approach To accomplish the stated objectives of the research and to cover the work on the tasks of the project, the following approach was followed: Existing AASHTO LRFD and other major bridge design specifications were reviewed to identify the deficiencies in the AASHTO LRFD and the latest approaches used by other domestic and international wind codes. To determine the current state-of-practice for calculating design wind load, practices of some state Departments of Transportation were reviewed. An extensive literature search was performed to identify and review relevant past research and the background of existing wind load provisions. A wind tunnel test program of models representing typical I- and Box-girders during and after construction was conducted. Proposed design provisions were developed. Examples of the application of the proposed provisions were developed and extensive comparisons between the wind loads determined using the existing and the proposed provisions were made. 4
21 2 LITERATURE SEARCH 2.1 Review of Existing Literature A literature search to locate information on wind loads was conducted. The tables of contents for all issues in the past ten years of The Journal of Bridge Engineering, The IABSE Journal, BRIDGES Magazine, and The Journal of Wind Engineering and Industrial Aerodynamics were reviewed. There were many papers published regarding the performance of flexible, long-span, cable-supported bridges, but relatively few regarding wind loads on ordinary bridges that typically would be designed using the AASHTO LRFD provisions, not a bridge-specific wind study. Wind loading on ordinary bridges primarily involves fundamental bluff body aerodynamics. Of greatest interest are the reports of unexpected, and unacceptable, behavior of ordinary bridges in winds (vortex induced motions and aeroelastic instabilities). These problems must be addressed in any design specification. The directors of the Boundary Layer Wind Tunnel at the University of Western Ontario (UWO) and the Rowan Williams Davies & Irwin Inc. (RWDI) wind tunnel facility were asked if they had performed any new studies that would be of help in the rewriting of the AASHTO LRFD wind provisions. A study was just completed at UWO for University of Florida researchers (Consolazio, Gurley, and Harper) on wind loading of I- and box-girders in construction stages. The final report of this study, which was funded by the Florida Department of Transportation, has been reviewed. Following are comments on the publications that were reviewed as part of the literature search and were deemed to have some relevance to wind loading on ordinary bridges: Journal of Bridge Engineering 1. "Equivalent Modal Damping of Short-Span Bridges Subjected to Strong Motions", Sungchil Lee, PhD; Maria Q. Feng, M. ASCE; Seung-Jan Kwon, PhD; and Seok-Hee Hong, March/April 2011 This paper uses strong-motion data from seismic records of the response of the Painter Street Overpass to estimate real damping values of short-bridges in strong motions. These are seismic motions that are likely to be greater than wind-induced motions but it does give valuable information regarding damping of short-span bridges. The damping is significantly higher than the generally assumed value of 5%. In fact, for some modes of vibration the deduced modal damping was found to be as high as 25%. The structure is assumed to have a damping value of 5%, and the soil abutments are assumed to have at least 25%. This paper presents measured values of damping for a typical highway overpass bridge. This data can be used in the calculation of gust effect factors for typical highway overpass bridges. 2. "Flutter, Galloping, and Vortex-Induced Vibrations of H-Section Hangers" Z. Q. Chen; M. G. Liu; X. G. Hua; and T. M. Mou, May/June 2012 Although the subject matter of this paper is limited to H-section hangers, it does identify a situation where wind-induced instability may occur. H-section hangers are not commonly used in bridges in the United States, but they have been used previously on cantilevered truss bridges. Although the characteristics of most truss hangers will not 5
22 render them susceptible to wind-induced instability, the problems associated with H- section hangers may be noted. 3. "Methods of Calculating Wind Loads on Long-Span Girder Bridges with Tall Piers and Comparisons of Values" Yiqiang Xiang, PhD; and Zhengwei Ye September/October 2012 The authors have computed lateral loads on this class of bridges (long-span girder bridges with tall piers) using the following design specifications: Chinese General Code Chinese Wind-Resistant Specification Japanese Manual British Standard AASHTO LRFD Chinese Load Code For bridges with span-to-depth or span-to-width ratios greater than 30 and height-to-width ratios greater than 10.7, aeroelastic loads must be taken into consideration. It is understood that these "aeroelastic loads" are really aerodynamic buffeting loads computed using a dynamic model of the bridge assembly. It was found that, using the AASHTO LRFD default wind speed of 100 mph produced the largest loads (6.2% to 32.4% higher, depending upon the compared code). However, when the correct V 10 (in SI Units, V 33 in English Units) wind speed was used for a direct comparison to the loads produced by the other codes, the AASHTO LRFD loads were the lowest (by 55.2% to 69.8%). The conclusion was that further study was required if AASHTO LRFD loads are to be applied to such a class of structures. The results of this paper will certainly be considered in the rewriting of the AASHTO LRFD wind provisions, particularly when a detailed buffeting analysis of a long span girder bridge is performed. 4. "Probabilistic Modeling of Bridge Deck Unseating during Hurricane Events" David Ataei; and Jamie E. Padgett, April 2013 This paper is concerned with the probability of bridge decks unseating in hurricane events due to storm surge, not solely due to wind. While the results are of definite interest and of concern, they do not relate to the wind loads on the bridge directly. Reference is made to the AASHTO Guide Specifications for Bridges Vulnerable to Coastal Storms (2008). Journal of Wind Engineering & Industrial Aerodynamics 1. "Effective Static Load Distributions in Wind Engineering" J. D. Holmes, Journal of Wind Engineering and Industrial Aerodynamics, Vol. 90, pp , In this paper, the author describes probabilistic methods to estimate the equivalent static load distribution on a long-span bridge (and other structures) including mean loads, background loads, and resonant loads. While the methods are beyond what would normally be included in a code, the general concepts must be included in the code through the use of an appropriate gust factor considering the loaded length. The results may be more easily obtained in a series of numerical simulations rather than 6
23 obtained from closed-form probabilistic models. The effects should certainly be included in any code. 2. "Wind-induced pressure around a sectional twin-deck bridge model: Effects of gap-width on the aerodynamic forces and vortex shedding mechanisms," K. C. S. Kwok, X. R. Qin, C.H. Fok, Q. A. Hitchcock, Journal of Wind Engineering and Industrial Aerodynamics, Volume 110, 2012, pp This paper contains many detailed pressure distributions measured experimentally on several streamlined twin box-girder deck models with various gap-tooverall-width ratios. Twin box-girder bridges with an open gap are particularly sensitive to vortex induced motions. Vortices shed from the windward box combine with the vortices shed from the leeward box to increase the wind load on the leeward box, making a twin box configuration more sensitive to vortex induced motions than a single box configuration. Of particular interest for the design of twin box-girder bridges is the relationship of Strouhal Number to gap ratio as shown in Table 2-1. The Strouhal Number defines the wind speed when vortex excited motions may occur. St = f H/U Where: St: Strouhal Number f: vertical bending frequency of vibration for the bridge, Hz H: deck thickness, m U: mean wind speed, m/s The gap ratio is defined as the gap width divided by the overall width of the twin boxes. Table 2-1 Gap Ratio vs. Strouhal Number Case Gap Ratio Strouhal Number (no vortex induced motion) "Shaping of bridge girders to avoid vortex shedding response," A. Larsen and A. Wall, Journal of Wind Engineering and Industrial Aerodynamics, Volume , 2012, pp Vortex induced motions were measured on various streamlined box-girder shapes (having a flat bottom and beveled portions on the bottom sloping up in both directions. The original shape was that used in the approach spans to the Storbaelt Bridge. On the Storbaelt Bridge, the bottom sloping portions were at an angle of 26.6 degrees to the horizontal. These approach spans experienced vortex induced motions that were mitigated through the use of tuned mass dampers (TMDs). Those vortex induced motions occurred at Strouhal Numbers of 0.67 to
24 Various streamlined box-girder sections were tested with bottom portions sloping at various angles to the horizontal. A general conclusion was that vortex induced motions could be reduced or eliminated if the bottom sloping portions of the streamlined box-girders were at an angle of no more than 15 degrees. 4. "A numerical study of geometric effects on vortex shedding from elongated bluff bodies," Z. Liu, and G. Kopp, Journal of Wind Engineering and Industrial Aerodynamics, Volume 101, 2012, pp 1-11 Vortex shedding frequencies were measured behind various shaped bluff bodies with a width of C and a thickness of t. Some had pointed ends, some had a pointed end to windward and a square end to leeward, and some had a rounded end to windward and a square end to leeward. The Strouhal Number, St, with respect to the thickness for all cases was approximately 0.2. St = f t /U Where: St: Strouhal Number f: vertical natural frequency, Hz t: thickness of bluff body, m U: mean wind speed, m/s For each case, there was a range of frequencies over which the vortex shedding frequency "locked-in" to the natural frequency of the bluff body. This is a naturally occurring phenomenon that typically happens. Of particular interest was that in general, for all shapes, vortex induced motions were likely to occur at a Strouhal Number, St = "Aerodynamic characteristics of continuous box girder bridges relevant to their vibrations in wind," Journal N. Narita, K, Yokoyama, H. Sato, and Y. Nakagami,of Wind Engineering and Industrial Aerodynamics, Volume 29, 1988, pp This paper presents results of wind tunnel tests to measure the aerodynamic damping with respect to vertical motions of two single box-girder bridges. The first box girder bridge consisted of a single rectangular box 8000 mm wide and 6275 mm high with a deck on top mm wide. The second box girder consisted of a single rectangular box 200 mm wide and 100 mm high. For both sections the slope of the lift coefficient was negative which indicates the potential for galloping motion. Both sections had low ratios of bridge width to bridge depth. St = f B / U Where: f: natural vertical frequency of vibration, Hz B: bridge width, m U: mean wind speed, m/s 8
25 The first section was unstable for values of St greater than 0.2. The second section was unstable for values of St greater than 0.2 as well. Bridges Magazine 1. "What Will the Introduction of Eurocodes Mean for Bridge Engineers?" November 2009 This paper is a general overview of the implementation process of the recently introduced (2008) Eurocodes. At this time, they are guidelines with country annexes but are expected to be required for design, at least for public works, in the near future. Little from this article relates to the specific charge of this task, to update and modify the wind element to the AASHTO code. 2. "Winds of Change: how box girders can be improved" Allan Larsen, August 2009 IABSE Various box-girder bridges have experienced vortex induced motions greater than 1 m. The paper by Larsen and Poulin (2005) discuss these problems and solutions. In this paper, a wind study was summarized that showed that if sloped bevels in the lower corners of the box, at an angle of 15 degrees with the horizontal, are installed, the vortex induced motions are greatly reduced or eliminated. If vortexinduced motions are anticipated, then this modification to the design is a very viable solution. 1. "Wind-induced Damages to a Three-Span, Continuous, Concrete Arch Bridge Under Construction", Ge, Yang, Pang, and Xiang, Vol. 17, #2, May 2007 This paper investigates the causes of the collapse of the twin-arches under construction in Yibin, China. All three spans of the twin arch ribs failed. Each concrete rib section was 1460 mm by 2200 mm. Extensive static wind tunnel tests and tests on a full-aeroelastic model of the arch pair were conducted. The loads on the arch were dead load, the static wind load, aeroelastic wind loads, and P-delta effects; the aeroelastic wind loads and P-delta effects were an order of magnitude greater than the dead load and static wind loads. The aeroelastic wind loads and P-delta effects were not included in the design of the arches. This paper is valuable in that it identifies the extent to which aeroelastic loads and P-delta effects can be significant in arch bridge design, particularly during construction stages. It presents another example where vortex-induced motions of a box-girder bridge during construction stages led to total collapse of the bridge. 2. "Analysis of a Bridge Structure and Its Wind Barrier Under Wind Loads" Vol 15, #4, Nov 2005 This paper discusses wind patterns behind the wind barrier to evaluate traffic safety. While very important, it is not relevant to the re-writing of the AASHTO LRFD wind provisions. 3. "Vortex Shedding Excitation of Box Girders and Mitigation", Larsen and Poulin, Vol 15, #4, Nov
26 This paper summarizes four case studies of observed vortex induced motions in box-girder bridges. One was a single-box suspension bridge, one was a single-box cable-stayed bridge, one was a twin-box cable stayed bridge, and one was a single-box girder bridge. In 3 of the 4 cases, turning vanes were added to direct the flow upward along the downward sloped surface of the box, thus reducing or eliminating the size of the shed vortex. In the fourth case, the motions were damped with the addition of tunedmass dampers. This paper is valuable in identifying when vortex induced motions might be a concern for girder bridges, box-girder bridges, and girders or boxes under construction. Journal of Structural Engineering 1. "Ultimate Wind Load Design Gust Wind Speeds in the United States for Use in ASCE-7", Peter J. Vickery; Dhiraj Wadhera; Jon Galsworthy; Jon A. Peterka; Peter A. Irwin; and Lawrence A. Griffis, ASCE / MAY 2010 / 613 In this paper the authors describe how the wind speed maps were generated for the ASCE/SEI The methods used to generate the wind speed maps are described for hurricane and non-hurricane regions. Three items are of particular interest. First, the new maps are not scaled versions of the ASCE/SEI 7-05 map, but are completely new maps with three for Category I buildings, one for Category II buildings, and one for Category III and IV buildings. Furthermore, the maps are not scaled versions of the same map but are individually generated maps of 3-second wind gust speeds with mean recurrence intervals (MRI) of 300, 700, and 1700 years. Second, it was noted that recent research has shown that the surface friction of wind-swept water surfaces in hurricanes is less than previously thought. Therefore, it is more appropriate to assume that coastal regions in hurricane prone areas are in fact characterized as having an Exposure D; while previously, they had been characterized as having an Exposure C. This change has been incorporated in ASCE/SEI Third, the MRIs of 300, 700, and 1700 years for use in determining wind speeds associated with ultimate loads (to be used with a load factor of 1.00) were determined from the corresponding MRIs of 25, 50, and 100 years for wind speeds associated with service loads (to be used with a load factor of 1.6) from the simple assumption that the ultimate wind-induced load was 1.6 times the corresponding wind-induced service load. This definition of an ultimate load was not debated or refined with the results from additional risk or reliability analyses that would suggest a different load factor should be used. This third item is of particular value in rewriting the AASHTO LRFD wind load provisions. In this paper the basic relationship for wind speeds, in the non-hurricane regions of the US, for wind speeds with various MRIs developed by Peterka and Shahid (1998) was used. Specifically: V T / V 50 = ( ((0.1)(ln(12T))) 10
27 From this relationship, Table 2-2 can be generated for wind speeds throughout the central portion of the United States. Table 2-2 Wind Speeds for Central Portion of United States T (MRI with Load Factor 1.6) (Years) U 3 (mph) T (MRI with Load Factor 1.0) (Years) 1.265*U 3 (mph) The shown in the fourth column is the square root of 1.6. The wind speeds in the fourth column are for use in strength limit states and the wind loads from these wind speeds, when applied with a load factor of 1.0, are equivalent to factoring the wind load from the wind speeds shown in the second column by a load factor of 1.6. The MRI's for the wind speeds in the fourth column are approximately 300, 700, and 1700 years as used in ASCE/SEI Using this same argument for the AASHTO wind speeds, and a load factor of 1.4, yields the corresponding wind speeds shown in Table 2-3. Table 2-3 AASHTO Wind Speeds T (MRI with Load Factor 1.4) U3 T (MRI with Load Factor 1.0) 1.183*U3 (Years) (mph) (Years) (mph) In ASCE/SEI 7-10, for Category I, II, and III and IV buildings, with expected lives of 25, 50, and 100 years, respectively, the ultimate wind speeds are those that have a probability of exceedance of 0.07 over the life of the structure. For a bridge with a design life of 75 years, the ultimate wind speed calculated in this manner would have a probability of exceedance of approximately 0.15 over the 75 year life of the bridge. This may be unacceptably high. In the existing AASHTO LRFD, an ultimate earthquake is one with a probability of exceedance of 0.07 over the expected 75 year life of the bridge. This earthquake has a MRI of approximately 1000 years. It may be appropriate to consider such a MRI for an ultimate wind speed as well. For this wind speed, Table 2-4 would apply: Table 2-4 AASHTO Wind Speeds based on MRI = 1000 years T (MRI with Load Factor 1.4) U3 T (MRI with Load Factor 1.0) 1.249*U3 (Years) (mph) (Years) (mph)
28 The effective load factor associated with this wind speed is not 1.4 but is equal to (1.249) (1.249) = This load factor (with respect to service loads) is much closer to the load factor of 1.6 used in ASCE/SEI With a drag coefficient of 1.3, a gust effect factor of 0.85, and an exposure factor of 1.00, and using the proposed pressure equation: p z = ( U 2 )(1.3)(0.85)(1.00) The wind pressures for the central United States, using MRIs of 75 and 1000 years for the service limit state wind speed and the strength limit state wind speed, respectively, gives the wind pressures shown in : Table 2-5 Wind Pressures Calculated using Proposed Pressure Equation Limit State P (psf) Service Strength Even though the effective load factor is 1.56 (38.67/24.78) using MRIs of 75 and 1000 years, the pressures calculated above are significantly lower than the values suggested in the existing AASHTO LRFD shown in Table 2-6 where 70 = (1.4)(50) with the prescribed load factor of 1.4. Table 2-6 Wind Pressures from Existing AASHTO LRFD Type of Wind Load P (psf) Unfactored 50 Factored "Wind Load Statistics for Probability-Based Structural Design" Bruce R. Ellingwood, and Paulos Beraki Tekie, ASCE, April 1999 In this paper, Ellingwood and Tekie discuss in great depth the reliability of estimates for different wind loads from ASCE They used a Delphi method with approximately 20 experts from all parts of the wind engineering and design community to make estimates of the uncertainties in the inputs to the various wind load calculations. From those estimates, reliabilities were determined for each load considered (for example the positive load on a wall, the suction on the back of the building, uplift on the roof, and for wind loads on components). The results from this paper are very interesting. However, it is not expected that this level of refinement will be included in the proposed revisions to AASHTO LRFD. Other Papers, Reports, Books 1. "Vibration Mechanisms and Controls of Long-Span Bridges: A Review Yozo Fujino and Dionysius Siringoringo," Structural Engineering International, 3/
29 This paper summarizes wind-induced problems that may be experienced by long-span bridges. Of particular interest, is a list of bridges that have all experienced troublesome vortex-induced motion. The bridges in the list are all relatively long-span steel box-girder bridges; motions were mitigated with the use of TMDs. They are larger than typical bridges but were most likely designed according to the governing bridge design specifications, not a bridge specific wind tunnel study. Designers of long-span box-girder bridges should be made aware of these experiences. Table 2-7 Long-Span Bridges Subject to Vortex-Induced Motion L, Maximum BRIDGE Span length (m) N (Hz) Trans Tokyo Bay (Japan) Storbaelt Approach Spans (Denmark) Rio Niteroi Bridge (Brazil) Volgograd Bridge (Russia) "Bridge Girder Drag Coefficients and Wind Related Bracing Recommendations," Consolazio, G. R., Gurley, K. R., and Harper, Z. S., Department of Civil and Coastal Engineering, University of Florida, Gainesville, Florida, June The objectives of this study were to determine static aerodynamic coefficients for individual and groups of girders in the wind during construction (without decks), and to evaluate and design bracing systems for various girder types during construction. The result for the first part of this study (to determine wind loads) is of great interest for use in the updated AASHTO LRFD. Wind tunnel tests (at the University of Western Ontario) were conducted to determine the desired static aerodynamic coefficients. All models were made to the scales of 1:25 or 1:28. Mean values of the static aerodynamic coefficients were obtained in smooth flow. The following girder types were studied: 1) 78" precast concrete girder (78" FIB), 2) 45" precast concrete girder (45" FIB), 3) 8' steel deep plate girder with 2'-8" flanges (WF Plate), 4) 8" steel deep plate girder with 1'-4" flanges (NF Plate), and 5) 6' deep by approximately 9' trapezoidal box girder without a top (Box) Groups of 1, 2, 5, and 10 girders for the precast concrete and steel plate girders and 1- or 2-box systems for the box girders were studied with center-to-center spacings of 10' to 14.' Cross-slopes of 2 to 8 degrees were studied. Natural variation in wind angles of incidence of -5, -2.5, 0, 2.5, and 5 degrees were also studied. Results from this vast number of wind tunnel tests were presented. A simplified series of conclusions were presented that were considered to be appropriate for use by the FloridaDOT. The conclusions were an envelope of extremes; the envelope was not particularly broad or conservative. 13
30 Lateral pressure coefficients that include a weighted effect of the torsional moments on the individual beams are called effective drag coefficients. Lift coefficients were also measured but during construction, they are not as significant as the effective drag coefficients. Specific conclusions, based on a group of identical girders, of this first phase of the study are as follows: The effective drag coefficient on a single plate girder was found to be 2.5. The effective drag coefficient on a single precast concrete girder was found to be 2.0. The effective drag coefficient on a single box girder was found to be For a group of identical plate girders or precast concrete girders, it was recommended that the full wind load be placed on the first girder, nothing applied to the second girder (found to be fully shielded - and in many cases a small wind load in the opposite direction was found), and a load equal to half of the load on the first girder be applied to all subsequent girders. These results were not sensitive to the girder spacing or the cross-slope angle. No generalizations were made regarding wind loads on a group of box girders. While the results of the analyses and resulting designs of girder bracing systems may be of great interest to AASHTO, the experimentally determined wind load conclusions and recommendations are particularly important to the revision of Section 3.8 in AASHTO LRFD. 3. Simiu, Emil, and Scanlan, Robert H., Wind Effects on Structures, Third Edition, John Wiley & Sons, Inc., New York, This is the gold standard reference book on wind engineering and covers just about everything needed in wind engineering. There is minimal text that specifically pertains to small bridges. However, the atmospheric boundary layer theory is developed fully from which mean velocity profiles, longitudinal turbulence profiles, turbulence spectra, and the averaging time variation in wind speeds can be developed. The relationship of wind speeds with mean return period is developed from historical wind speed data. All of this information is required, and has been used, in the proposed version of AASHTO LRFD Section 3.8. There is a chapter on bluff body aerodynamics which contains figures that present drag and lift coefficients for numerous structural shapes commonly used in bridge construction. Furthermore, for those shapes, Strouhal Numbers are also presented. The Strouhal Number defines the relationship between wind speed, member size, and the frequency that von Karman vortices are shed in the wake. All of this data is used in the proposed version of AASHTO LRFD Section 3.8. In addition, there are chapters that discuss the potential for aeroelastic vibrations of long-span bridges. These chapters are not relevant to typical structures which would be designed according to AASHTO LRFD Section 3.8; this chapter is relevant for bridges that are at the boundary between when a bridge should be designed according 14
31 to AASHTO LRFD, and when a bridge should be designed from results obtained from a site specific, project specific wind study. 4. Vincent, G. S., INVESTIGATION OF WIND FORCES ON HIGHWAY BRIDGES, Highway Research Board, Special Report 10, Washington, D. C., 1953 This report is of special interest because the results of this study formed the basis for much of the existing AASHTO LRFD. Included in this study are the results from a series of wind tunnel tests conducted in the David Taylor 8 x 10 ft wind tunnel. Static aerodynamic coefficients were measured in a steady 100 mph wind speed. Additional wind studies were conducted in 25, 65, and 100 mph winds to evaluate the effects of changes in the Reynolds Number. These effects were found to be insignificant. Two through truss models, one pony truss model, and three deck girder bridge configurations were studied. By today's standards, the bridge types are somewhat outdated with the emphasis on truss bridges. No box girder bridge types were studied. Some conclusions of particular interest: The pressure proposed by this study of 50 psf on projected areas of the bridge was thought to be a reasonable, and somewhat conservative, upper-bound result. This pressure is to be used with 1.5 times the projected, exposed area on trusses and reduced by up to 70% for girder bridges. This later became 50 psf to be used on the actual projected, exposed area for girder bridges and on the projected area of windward trusses, and 25 psf on the projected area of leeward trusses. The 50 psf was greater than the highest pressures measured in a mean 100 mph wind. (Notice that in AASHTO LRFD, reference is made to fastest-mile wind speed maps with a mean recurrence period of 50 years. On the fastestmile wind speed map, only the southern portion of Florida, Cape Hatteras, and southern Louisiana are in zones with a design wind speed greater than 100 mph.) It was determined that very small changes in the vertical angles of incidence of the wind can have very large effects on the lift loads applied to the bridge. These loads may be greater than the drag loads. The vertical forces can be up or down. In the girder bridge studies, it was found that minimal changes occurred in the results if the interior girders were removed. In general, the static aerodynamic coefficients were dependent upon the overall bridge geometry and not the specific geometry including all of the interior girders. Static aerodynamic force coefficients were obtained for wind loads on the superstructure for wind not perpendicular to the bridge. There were a set of coefficient that resolved the wind loads into transverse and longitudinal components. These skew coefficients were generalized into one upper-bound set for truss bridges and one upper-bound set for girder bridges. These skew coefficients, in various forms, are used in the AASHTO LRFD and many other 15
32 specifications throughout the world. It is noted that the aerodynamic coefficients obtained in this study are referenced to the mean dynamic pressure and to a single projected area for winds normal to the bridge axis. As the wind direction changes, the projected area normal to the wind direction also changes but the results in this study were all referenced to the single projected area cited, not the actual projected area for that wind direction. 5. Wind Loads on Steel Box Girders during Construction Using Computational Fluid Dynamic Analysis. Myers, G. and Ghalib, A.. Journal 7. Atkins Group. Roads and Bridges Division The authors stated that the critical wind exposure condition in the constructability analysis is on the exposed partially erected girders during the various construction stages and also on the completed skeletal frame prior to the addition of forms and concrete deck. The literature search conducted as part of the work indicated that drag coefficients to be used in the development of wind pressures under these conditions are not readily available. The authors used computational fluid dynamic modeling to develop horizontal drag and vertical lift coefficients for the constructability analysis of curved box girders. The drag coefficients were found to be significantly larger than those stipulated for the completed bridge in the design specifications. 6. AASHTO STANDARD SPECIFICATIONS FOR STRUCTURAL SUPPORTS FOR HIGHWAY SIGNS, LUMINAIRES, AND TRAFFIC SIGNALS. Section 3: LOADS (2013). The reviewed AASHTO Specification for Signs, Luminaires, and Traffic Signals includes an updated section on wind loads. The AASHTO Standard Specifications for Structural Supports for Highway Signs, Luminaires, and Traffic Signal utilizes a 3-second gust wind speed with a MRI of 50 years. The loads generated from these wind speeds are factored for use in a LRFD analysis. The calculated wind loads are used directly in a LRFD analysis with a principle load factor of The bridges that are most often designed with AASHTO LRFD are generally small and rigid. Highway signs, luminaires, and traffic signals, while relatively small, are quite flexible. This flexibility is accounted for in the use of a gust effect factor, G, of Drag coefficients for many member cross-sections are provided for highway signs, luminaires, and traffic signals; these structures can be grouped into similar categories and are typically governed by wind loading. (in contrast, typical structures designed using AASHTO LRFD are rarely governed by wind loads. With large number of possible combinations of bridge decks and girders; the drag coefficients presented in bridge design specifications tend to be generalized as it is impractical to provide drag coefficients for all possible combination.) 7. Wind Tunnel testing for Buildings and Other Structures, ASCE This publication addresses wind tunnel studies and covers the minimum requirements for wind tunnel testing. Even though it is focused on buildings, the provisions do apply to long span bridges. 16
33 2.2 Review of Wind Loads in Major Specifications Many significant bridges are designed according to one of the following five codes. There are numerous codes throughout the world, but most were developed from these codes discussed below and AASHTO LRFD. Only the portions of these codes that relate to wind loads on bridges were reviewed. 1. Eurocode 1-Actions on Structures - Part 1-4: General actions - Wind actions British Standard, BS-EN : A1:2010, Incorporating corrigenda July 2009 and January 2010 The Eurocode applies to bridges having spans less than 200 m provided that they satisfy the criteria for dynamic behavior The Eurocode does not clearly identify the characteristics of bridges that are dynamically sensitive; bridges with spans less than 40 m generally do not need to be considered dynamically sensitive. Motion in the direction associated with the fundamental frequency of the wind should be considered in the design of all bridges.. The reference wind speed is a 10-minute averaged wind speed, in an open terrain, at an elevation of 10 m. Five exposures are considered: sea and coastal, lakes and flat land, open, suburban, and urban. A logarithmic profile law is used with surface roughness coefficients consistent with 10-minute or one-hour averaged wind speeds. The density of air is taken as 1.25 kg/m 3 and peak values are considered to be a mean plus 3.5 times the standard deviation. The reference wind speed and air density apply to wind loads on all structures. Turbulence intensities and spectra are included but are not necessarily used for bridges. There is a separate section (8) specific to bridges. Drag coefficients are presented for several different sections, with a default of C d = 1.3, based upon the bridge depth perpendicular to the wind, though bridge depth is open to interpretation. 2. Australian/New Zealand Standard Structural Designations, Part 2: Wind Actions AS/NZS This code describes wind loading for buildings and structures but does not contain anything specific to bridges. Dynamically sensitive structures are defined as those having a fundamental frequency less than 1 Hz. Three-second gust wind speeds, at an elevation of 10 m, in an open exposure are used as reference wind speeds. The standard develops wind loads for both ultimate and service limit states. The density of air is assumed to be 1.2 kg/m 3. A logarithmic mean velocity profile is assumed with four exposure categories: water or coastal, open, suburban, and urban. An equation is relationship is used to determine the fetch required to develop a specific boundary layer to a certain depth. Drag coefficients are given for several cross-sections (that relate to all structures) but nothing specific to bridges. 17
34 3. Canadian Highway Bridge Design Code, A National Standard of Canada CAN/CSA-S6-06, November 2006 The reference wind speed to be used is a one-hour averaged wind speed with a return period of 100 years for bridges with span lengths greater than 410 ft (125 m), 50 years for shorter bridges and for light supports and signs greater than 52.5 ft (16 m) in height, 25 years for light supports and signs less than 52.5 ft (16 m) in height, and 10 years for temporary signs and bridges during construction. A gust effect factor of 2 is used for bridges less than 410 ft (125 m) long and 2.5 for slender pedestrian bridges and flexible components. The gust effect factor should be determined from wind tunnel tests and rational analysis for very long and flexible bridges. The gust effect factor includes the correlation of gusts with the dynamic characteristics of the bridge. Note that the square of the ratio of peak wind speed to hourly averaged wind speed is approximately 2. Mean velocity profiles and different exposures are not defined; instead, an exposure coefficient as a function of height is provided. For all bridge types, a drag coefficient of 2 is used for horizontal loads, and a value of 1 is used for vertical loads. There are sections to determine the wind load for cases where the wind is not perpendicular to the bridge, bridges that are aerodynamically sensitive, and wind tunnel testing. With the exception of wind not perpendicular to the bridge, the other sections state that other problems should be investigated if they are anticipated. In addition to determining the wind loads, whether by code or experiment, the bias and standard deviation of the wind load must be determined. 4. British Highways Agency, Design Manual for Roads and Bridges, BD 37/01, Loads for Highway Bridges and BD 49/01 Rules for Aerodynamic Effects on Bridges. The British Standards are very detailed and have been used for many years. The British Standards have been superseded by the Eurocodes. 5. "Structures Design Guidelines," Florida Department of Transportation, FDOT, Structures Manual, Volume 1, January 2013 The wind element to this document is based upon ASCE The pressures determined from this document are for use directly in an allowable stress design, or factored in a LRFD design. The basic design wind speed is a 3-second averaged gust wind speed, at an elevation of 33 feet (10 m), in an "open" exposure, with a mean recurrence interval (MRI) of 50 years. The typical load factor is 1.4 which yields pressures that are equivalent to those generated with a wind speed having a MRI of 850 years. Pressures are determined using the equation below: p = (2.56E-06)(K z )(V 2 )(G)(C p ) 18
35 where V: the basic wind speed in mph K z: an exposure and elevation factor G: gust effect factor C p: pressure coefficient The exposure and elevation factor for an open exposure is used for all bridges regardless of the actual exposure. For bridges with span lengths less than 250 feet and a height less than 75 feet, the gust effect factor is assumed to be For bridges that are longer than 250 feet and/or higher than 75 feet, gust effect factors are to be determined as per ASCE Site-specific wind speeds can be used in lieu of those provided on the basic wind speed map. Pressure coefficients are provided for different shapes and parts of the bridge. During construction, the design wind speed can be assumed to be 0.6 times the basic wind speed. During active construction (e.g. during girder erection), the basic wind speed is taken as 20 mph. Pressure coefficients are given for various construction stages. 6. Minimum Design Loads for Buildings and Other Structures, ASCE 7-10 The main features of the ASCE/SEI 7-10 wind load provisions are presented in the summary of the paper by Vickery et.al. 7. Minimum Design Loads for Buildings and Other Structures, ASCE 7-05 Although, the format for 7-10 is radically different from the format for 7-05, the two editions are virtually identical. The primary format difference is the use of a load factor of 1.0 for wind loads in 7-10, and 1.6 for wind loads in The wind speeds in 7-10 have been increased accordingly with the factor of (the square root of 1.6) to give the same design pressures. This is not considered to be a significant engineering change. The only significant change that affects wind loads between the two editions is the stipulation that the exposure over water in hurricane zones is Exposure D in 7-10, while it is Exposure C in This stipulated Exposure D extends only 600 feet in from the water in such hurricane prone areas. 2.3 Conclusions Regarding the State-of-the-Art of Wind Design After reviewing existing design specifications and the available literature on wind loads on typical bridges, the use of a constant averaging time was deemed necessary to be consistent with modern design codes. The use of 3-second wind gust was determined to be reasonable as it is consistent with building and meteorological practices in the US. Wind speed maps based on the 3-second wind gust are readily available and could be easily adopted. It was also concluded that using the basic form of the wind load equation is preferred. This form of the equation is used by other modern codes reviewed in this study. 19
36 This page is intentionally left blank. 20
37 3 WIND TUNNEL TEST PROGRAM 3.1 Introduction and Objectives The objective of this wind tunnel test study was to determine the expected performance of typical bridge components (I-beams and box-girders) in wind during construction prior to placement of the deck. A specific objective of the wind study was to determine the wind speeds at which excessive wind-induced motions might occur. Therefore, the focus of this study was to identify possible wind motion sensitivities of different girder types, in different configurations of multiple beams and girders, and at various wind angles of incidence. Static drag coefficients for different shaped box-girder sections were also determined. The focus of the study indicated above was selected in order to not duplicate recent work by other researchers. In a recent, very extensive study (Consolazio et. al., 2013), wind loads in the direction of the wind on different I-beams, plate girders, and box-girders, in different configurations were measured in wind tunnel tests. The results were presented in terms of dimensionless, static aerodynamic drag coefficients. With such coefficients, the wind loads on various girder configurations, at various wind angles of incidence, can be determined. It was not the intent of this test program to duplicate that study. Long, slender, I-beams, and open-topped box-girders (typical during construction), when aligned perpendicular to the direction of the wind, may be sensitive to vortex-induced motions as well as a single-degree-of-freedom (SDOF) translational aeroelastic instability perpendicular to the direction of the wind. This SDOF translational aeroelastic instability is commonly called "galloping." Wind-induced motion in the direction of the wind (along-wind motion), or buffeting, may also be a concern but is implicitly addressed by the gust effect factor used to calculate the static equivalent wind loads on the member. Galloping is more likely to occur in flexible, cable-supported bridges, such as the original Tacoma Narrows Bridge, but its occurrence is unlikely in typical bridge components. A torsional flutter mode commonly occurs on shapes with large, horizontal lifting surfaces, such as bridge decks. The wind characteristics of a typical bridge and individual bridge components do not allow the torsional flutter mode to develop. Therefore, the focus of this study was to identify typical bridge components such as I-beams, plate-girders, and open-topped box girders that are susceptible to vortex-induced and galloping motions. The wind tunnel models did allow for torsional motion, but the observed torsional motion was small relative to the translational motions. All tests were performed on straight sections of I-beams and box-girders. Vortices shed by curved members will tend to follow the length of the member if they have mild curvature (curvature in a vertical or horizontal plane). If the curvature is too great, uniform vortices behind the members will not be shed. As the curvature increases, the likelihood that uniform vortices will be shed behind the member decreases. Therefore, for curved members, motion predictions from wind tunnel test results using straight members are assumed to be conservative. There were no pre-determined expected aerodynamic behaviors in this study. The girder sections studied were known to be wind sensitive in some, but not all, configurations. An extensive number of girder sections, combinations of multiple girders, and wind angles of incidence were considered. The intent was to identify those configurations that were particularly wind-sensitive. The investigated configurations covered typical types and layouts but did not 21
38 cover all possibilities. The results of this study will help the designer determine whether or not a proposed configuration is likely to be wind-sensitive. Testing was conducted at West Wind Laboratory Inc. in Monterey, California. The international standard for wind engineering and of West Wind Laboratory, Inc. is to use the SI system of units for wind studies. Consequently, all raw data and results presented herein are presented using the SI system of units; with English units provided in most instances. The final results are presented as dimensionless quantities that may be used with any system of units. 3.2 Configurations Tested I-beams are very bluff, shed strong vortices into the wake, and are prone to galloping if the lifting surface is sufficiently large. Vortex-induced and galloping motions generate fluctuating pressures on the top and bottom flanges of the member. The fluctuating pressures produce fluctuating forces and motion of the member. Since the top and bottom flange width of I-beams and plate-girders is usually small with respect to the depth of the girder, strong vortexinduced and galloping motions of I-beams and plate girders are not likely to be problematic. Box-girders, besides being bluff and strong generators of vortices in the wake, are also prone to a galloping instability. Several cases of vortex-induced and/or galloping motions of box-girders during construction have been documented (Larsen and Poulin, 2005, Fujino and Siringoringo, 2013, Yang, Pang, and Xiang, 2007, Corriols and Morgenthal, 2014, Larsen and Wall, 2012). For these reasons, more emphasis is placed on box-girder motions than I-beam motions in this study. While most of the box-girder shapes studied were open-topped, the pressure on the top of the pocket of still air in the open-topped box-girder is likely similar to the pressure that would occur on a closed-topped box-girder. Therefore, the aerodynamic behaviors of closed-topped box-girders are expected to be similar to the observed aerodynamic behaviors of the open-topped box-girders. Nine different member shapes were tested: two plate girder shapes, four open-topped box girder shapes, and three closed-topped box-girders. The close-topped box-girders were added to the original study of aerodynamic behavior of plate girders and open-topped boxgirders during construction because they are similar in shape and there are several cases of completed box-girder bridges that are known to be wind sensitive. The nine member shapes are described below and the model configurations and model dimensions are shown in Figure 3-1 through Figure Wide Flange I- Beam (Shape 1) This is an I-beam with a flange width that is approximately one-half of the girder depth. The flange width is much wider than a typical rolled steel section or plate-girder, but not necessarily wider than a typical precast concrete I-beam. This section was chosen because it is an I-beam with relatively large horizontal surfaces. 2. Narrow Flange I-Shaped Beam (Shape 2) This shape is typical of a rolled steel I-beam but the flange width is generally larger than that used in a typical plate girder. The flange is approximately one-quarter the girder depth. 3. Deep Open-Topped Box-Girder (Shape 3) 22
39 This is a deep open-topped box-girder with vertical sides; the width is equal to one-half of the height. 4. Square Open-Topped Box-Girder (Shape 4) This is an open-topped box-girder with vertical sides; the width is equal to the height. 5. Shallow Open-Topped Box-Girder (Shape 5) This is a shallow open-topped box-girder with vertical sides; the width is equal to two times the height. 6. Square Open-Topped Box-Girder with Sloping Sides (Shape 6) This is a square open-topped box-girder with outward sloping sides (at a slope of 1 in 4); the height is equal to the width of the bottom of the box. 7. Square Box-Girder with Narrow Deck (Shape 7) This is a square box-girder (same box-girder used for Shape 4) with the deck overhanging the box-girder flange by 40% of the box width. 8. Shallow Box-Girder with Narrow Deck (Shape 8) This is a shallow box-girder (same box-girder used for Shape 5) with the deck overhanging the box-girder flange by 20% of the box width. 9. Shallow Box-girder with Wide Deck (Shape 9) This is a shallow box-girder (same box-girder used for Shape 5) with the deck overhanging the box-girder flange by 40% of the box width. 23
40 Figure 3-1 Cross-Section of Shape 1, I-Beam with Wide Flanges Figure 3-2 Cross-Section of Shape 2, I-Beam with Narrow Flanges 24
41 12.7mm. (1/2 in) 152.4mm. (6 in) 76.2mm. (3 in) Figure 3-3 Cross-Section of Shape 3, Deep Open-Topped Box Figure 3-4 Cross-Section of Shape 4, Square Open-Topped Box 25
42 Figure 3-5 Cross-Section of Shape 5, Shallow Open-Topped Box Figure 3-6 Cross-Section of Shape 6, Open-Topped Box with Inclined Webs 26
43 Figure 3-7 Cross-Section of Shape 7, Square Box with Narrow Deck Figure 3-8 Cross-Section of Shape 8, Shallow Box with Narrow Deck 27
44 Figure 3-9 Cross-Section of Shape 9, Shallow Box with Wide Deck 28
45 3.3 Test Program The vertical, non-zero angle of incidence of the wind on the bridge deck can be due to the cross-slope of the bridge deck, natural non-zero angles of incidence due to turbulent fluctuations, and the influence of nearby topographic features. Vortex-induced and galloping motions of I-beams and box-girders are not overly sensitive to the fluctuations in the wind angle of incidence due to turbulence as many cycles of motion are necessary to build up to a steady state response in lightly damped girders. The periods of the turbulent gusts are short when compared to the time required for the motions to build to a significant level. Therefore, the effects that contribute most to non-zero vertical angles of incidence are the cross-slope of the deck and the distortion of the wind angle due to nearby topographic features. Wind-induced motions of very bluff bodies (such as I-beams and box-girders) are insensitive to small changes in angles of incidence but static aerodynamic coefficients are sensitive to small changes in wind angles of incidence. The "bluffness" of the shape and the overall dimensions of the cross-section are of great interest. Typically, I-beam bridges are made with the web vertical and deck cross-slopes that vary from 1% to 8% (1/2 to 4 ). Boxgirders, on the other hand, are typically constructed perpendicular to the deck, with or without cross-slope. The slight variation from perpendicular to the deck for the I-beams was not considered to be a significant contributing factor to the dynamic response of the beams. All configurations were tested for -10, -5, 0, 5, and 10 degree angles of incidence and all members were modeled as being perpendicular to the deck. Of particular interest was the possible interaction of the turbulent wake from one beam or box-girder on an adjacent girder. Configurations of 1, 2, and 4 evenly spaced I-beams and open-topped, one- and two-box systems were tested. Single box-girder bridge sections with decks were also tested. For all configurations, vertical motions were recorded, perpendicular to the axis of the member and perpendicular to the axis of the wind. For horizontal winds, static drag coefficients were measured for the four different open-topped boxes. For the square open-topped boxes in two-box systems, mean drag coefficients were measured on the leeward box for different box spacings and each angle of wind incidence. The entire test program is defined in Table 3-1 and Table
46 Table 3-1 Dynamic Test Program Section Shape Wind Angle (degrees) Number of Beams Beam Spacing in Multiples of Beam Depth, d * 1 - Shape 1 0, -5, d, 2d, 3d, 4d 4 2d 1 - Shape 2 0, -5, d, 2d, 3d, 4d 4 2d 1 - Shape 3-10, -5, 0, 5, 10 2 d, 2d, 3d 1 - Shape 4-10, -5, 0, 5, d, 3d, 4d 1 - Shape 5-10, -5, 0, 5, d 1 - Shape 6-10, -5, 0, 5, d, 4d Shape Shape Shape * In the case of multiple beams in the cross-section, testing was repeated a number of times equal to the number of beams. The active girder (the girder for which the vertical motions are recorded) was moved from one location to another to include testing with the active girders at all possible locations. Table 3-2 Static Test Program Beam Spacing in Wind Angle Number Multiples of Beam MODEL (degrees) of Beams Depth, d Shape Shape 4-10, -5, 0, 5, d, 3d, 4d Shape Shape
. Wind speeds are continuously variable from 0 to 5 m/s.")
47 3.4 Wind Tunnel Facility All tests were performed in the component, section model wind tunnel at West Wind Laboratory, Inc. The wind tunnel has an open jet test section m x m (3.33 ft x 5.42 ft.). Wind speeds are continuously variable from 0 to 5 m/s. All models were rigid models supported by springs at the four corners that allowed the model to translate vertically and to rotate torsionally about the member axis. Torsional motions of the members were not expected to be significant so they were not measured; observed torsional movements were insignificant. The beam support system during wind tunnel testing and the wind tunnel configuration are shown in Figure 3-10 and Figure 3-11, respectively. Figure 3-10 End Support of Beams during Wind Tunnel Testing 31


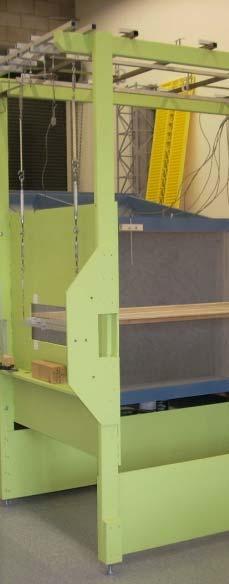


48 Figure 3-11 Wind Tunnel Schematic and Beams during Testing 32
49 3.5 Model Descriptions, Model Properties, Test Procedures The nine shapes described in Section 3.2 were constructed of hardwood. All models were prismatic and had a length of m (64 in). The model cross-sections are shown on Figure 3-1 through Figure 3-9. The models are shown in the wind tunnel in Figure 3-12 through Figure 3-19 (in various configurations). Photographs of the Shape 8 model in the wind tunnel were not taken. The models were supported at the end with frames (see Section 3.4) that were, in turn, supported with four springs. The models were weighted to yield reasonable masses, vertical natural frequencies, and linear viscous damping ratios. Simple I-beams and box-girders have very low damping ratios. A typical steel frame high-rise building may have a linear viscous damping ratio of 0.01, a steel long-span suspension bridge may have a damping ratio of 0.004, and a single beam may have a damping ratio of The models tested typically had damping ratios of this magnitude or less. The amplitude of vortex induced motions (whether from periodic vortices shed into the wake or from a galloping-type instability) are a function of the Scruton Number, Sc. The Scruton Number includes a damping force coefficient (equal to the product of the damping ratio and the mass). where Sc = (ξ)(m) / (ρ)(l) ξ: linear viscous damping ratio m: mass per unit length ρ: density of air L: reference length The units of the above variables should be consistent. Since no specific I-beams or box-girders were modeled, at best, a model Scruton Number will be within the expected range of full-scale Scruton Numbers. Since the modeled masses and damping ratios are reasonable, the range of modeled Scruton Numbers is also reasonable. Predicting full-scale, wind-induced motion magnitudes was not the objective of the wind tunnel study. The objective of the wind tunnel study was to determine the wind speeds at which excessive, wind-induced motions might occur. The critical wind speeds are not directly a function of the Scruton Number but are primarily a function of the member shape (as long as the damping is low). The magnitude of possible motions and the rate at which unstable motions grow are a function of the Scruton Number, but of greater interest is that the motions are prevented in the first place. The dimensionless measure of the wind tunnel speeds at which wind tunnel tests were performed is the Reynolds Number, Re Re = (U)(L) / ν 33
50 where U: mean wind speed L: reference length ν: kinematic viscosity The units of the above variables should be consistent. Tests were conducted at a Reynolds Number of approximately Re = 20,500 based upon the reference length of the model depth. Full-scale values of Reynolds Numbers are expected to be on the order of Re = 1,200,000. Wind-induced pressures on curved and streamlined members are highly dependent upon the Reynolds Number. The Reynolds Number determines whether laminar or turbulent flow occurs along a streamlined or curved member. The type of boundary layer flow, laminar or turbulent, affects the points where the flow separates from the surface of the girder. The points where the flow separates affects the flow pattern and the flow pattern affects the wind-induced pressures and forces on the girder. I-beams and box-girders (particularly those tested in this study) have sharp corners that force flow separation points to occur at these fixed locations. Since the flow patterns do not change as the Reynolds Number changes, the pressures and loads on the sharp-edged sections are not expected to change significantly with changes in the Reynolds Number. This is the assumed justification for all wind tunnel testing on buildings and long-span bridges. The model dynamic properties are shown in Table 3-3. The objectives of all dynamic tests were to determine the sensitivities of the various cross-sections to vortex-induced motions and/or galloping. As a consequence, for each configuration, the peak vertical displacement was recorded. For sections exposed to the mean free stream, the peak motion was typically the steady-state magnitude of a vertical oscillation at the model natural frequency due to its own wake turbulence, vortex-induced motions, and/or galloping. When the active, elastically mounted beam was downstream from other identical beams, the peak motion could be due to its own wake turbulence, vortex-induced motions, galloping, or wake buffeting from the upstream beams. When the motions were vortex-induced or galloping motions, the very low damping caused the time required to develop a steady-state response to be very long. For critical cases, the model was allowed to vibrate for approximately 15 minutes to reach a steady state motion. The test configuration consisted of one active member (supported elastically and allowed to vibrate) and all other members fixed. In reality, all members may vibrate. When only one member is allowed to vibrate, flow patterns over the fixed members may be different from what they would be if the other members were allowed to vibrate. However, since it was the specific objective of the wind tunnel tests to determine the wind speeds at which excessive wind-induced motions might occur, the motions will be small and the modeled configuration will be accurate at those wind speeds. The objective of the static tests was to determine the mean, static, aerodynamic drag coefficient for each girder type. The models were mounted rigidly on a balance. Ten records of 30-seconds each were recorded; the average of the samples was calculated and used as the representative drag coefficient value for that cross-section. 34

 35")
51 Figure 3-12 Wide Flange I-Beam (Shape 1) Figure 3-13 Narrow Flange I-Beam (Shape 2) 35

 36")
52 Figure 3-14 Tall Open-Topped Box-Girder (Shape 3) Figure 3-15 Square Open-Topped Box-Girder (Shape 4) 36
 Figure")

53 Figure 3-16 Shallow Open-Topped Box-Girder (Shape 5) Figure 3-17 Square Open-Topped Box-Girder with Sloping Sides (Shape 6) 37


54 Figure 3-18 Square Box-Girder with Narrow Deck (Shape 7) Figure 3-19 Shallow Box-Girder with Wide Deck (Shape 9) 38
55 Table 3-3 Model Dynamic Properties MODEL NATURAL FREQUENCY (Hz) LINEAR VISCOUS DAMPING RATIO MASS PER UNIT LENGTH (kg/m) --- (Shape 1) Pair--- (Shape 1) (Shape 2) (Shape 3) (Shape 4) (Shape 5) (Shape 6) (Shape 7) (Shape 8) (Shape 9)
56 3.6 Dynamic Test Results and Test Summaries The values for U and D as used in the following sections must be in consistent units; if using the English system of units, U would be in feet per second and D would be in feet. If the SI system of units is used, U would be in meters per second and D would be in meters WIDE-FLANGE I-SHAPED BEAM (Shape 1) The dynamic performance of Shape 1 during construction is not likely to be problematic in winds that are expected to occur. Shown in Figure 3-20 through Figure 3-22 are the expected steady-state vertical responses of a single Shape 1 as a function of reduced wind speed, U/nD, for mean angles of incidence of 0, -5, and -10 degrees where U: mean wind speed (fps), n: frequency of vertical vibration (Hz), and D: beam depth (ft.). For horizontal winds, there is an abrupt jump in response at U/nD = 20; for angles of incidence of -5 and -10 degrees the abrupt jump occurs at U/nD = 15. This is not a peak, but a jump that stays steady or grows. It is most likely initiated as a vortex-induced motion that progresses into a galloping instability. For lower values of U/nD, there are no significant motions other than wake buffeting motions. These instabilities are more of an academic interest than a practical interest. A long beam, L = 200 ft., with a depth of D = 7 ft., might typically have a vertical natural frequency of 2 Hz. At a value of U/nD = 15, this corresponds to a mean wind speed of U = 210 fps = 143 mph. In most of the US, the construction stage wind speed stability criterion is (0.73)(115 mph) = 84 mph, well below the critical flutter wind speed of 143 mph. Even in Florida, with a reference wind speed of 170 mph, the construction stage critical wind speed criterion would be 124 mph which is still well below the 143 mph at which galloping motions might occur. For a steady reduced wind speed at which strong motions occurred for an individual Shape 1, U/nD = 22 for wind angles of 0 and -5 degrees and U/nD = 18 for a wind angle of -10 degrees, other identical Shape 1 beams were placed in the configurations shown in Figure 3-23 through Figure 3-25 to evaluate the effect of nearby beams. For horizontal winds (Figure 3-23) the steady-state vertical displacement of the beam by itself (Case 20) was YP = y/d = 0.136, where y is the peak vertical displacement. The steady-state response of the windward beam, with an identical beam placed a distance 2D downstream, grew to YP = The steadystate response of the windward beam, with a beam placed a distance D downstream, grew to a YP = This was an unexpected occurrence, but again primarily of academic interest, because it occurred at a very high value of U/nD = 22. Similar but less severe behavior occurred for winds from -5 and -10 degrees. Even though this unexpected behavior occurred at very high wind speeds, additional tests were performed on a pair of Shape 1 beams braced together to vibrate as a pair. A single beam is typically not placed during construction without the beam being connected to a second beam. The case tested consisted of two Shape 1 beams, spaced 1.5D apart. This case was tested at mean wind angles of incidence of 0, -5, and -10 degrees. Steady-state motions for these three cases are shown in Figure 3-26 through Figure For horizontal winds and winds with a mean angle of incidence of -5 degrees, the steady-state responses were relatively benign for reduced wind speeds up to U/nD = 40. For a wind with a mean angle of incidence of
57 degrees, a galloping instability was identified at U/nD = 18. For most of the United States, this would correspond to a mean wind speed of 170 mph which is well above the stability criterion during construction which is 84 mph for most of the United States YP U/nD Figure Steady-State Motions of Wide Flange I-Beam (Shape 1) Wind at 0 Degrees YP U/nD Figure 3-21 Steady-State Motions of Wide Flange I-Beam (Shape 1) - Wind at -5 Degrees 41
58 YP U/nD Figure 3-22 Steady-State Motions of Wide Flange I-Beam (Shape 1) Wind at -10 Degrees 42
59 WIND FROM LEFT TO RIGHT SPACING OF BEAMS IN UNITS OF D CASE A YP ACTIVE PASSIVE Figure 3-23 Steady-State Motions of Wide Flange I-Beam (Shape 1) Wind at 0 Degrees 43
60 WIND FROM LEFT TO RIGHT SPACING OF BEAMS IN UNITS OF D CASE A YP 20c ACTIVE PASSIVE Figure 3-24 Steady-State Motion of Wide Flange I-Beam (Shape 1) Wind at -5 Degrees 44
61 WIND FROM LEFT TO RIGHT SPACING OF BEAMS IN UNITS OF D CASE A YP 20d ACTIVE PASSIVE Figure 3-25 Steady-State Motion of Wide Flange I-Beam (Shape 1) Wind at -10 Degrees 45
62 YP U/nD Figure 3-26 Steady-State Motion of Double Wide Flange I-Beam (Shape 1) Wind at 0 Degrees YP U/nD Figure 3-27 Steady-State Motion of Double Wide Flange I-Beam (Shape 1) Wind at -5 Degrees 46
63 YP U/nD Figure 3-28 Steady-State Motion of Double Wide Flange I-Beam (Shape 1) Wind at -10 Degrees 47
64 3.6.2 NARROW-FLANGE I-SHAPED BEAM (Shape 2) Shape 2, the narrow-flange I-shaped beam has a smaller horizontal, lifting surface than Shape 1. Therefore, it was expected that the Shape 2 motions would, in general, be less extreme than the Shape 1 motions; this behavior was observed during testing. The steady-state vertical motions of an individual Shape 2 beam, for winds with mean angles of incidence of 0, -5, and -10 degrees, are shown in Figure 3-29 through Figure For all cases and all values of U/nD covered, the mean steady-state response was relatively small with peak motions equal to approximately 5% of the beam depth. Many of these motions are not necessarily periodic but are random motions due to wake buffeting. Buffeting occurs due to turbulence in the wake that will vibrate the beam upstream of the wake. At reduced wind speeds that would generate vortices with periods that matched the natural period of the beam (U/nD approximately equal to 8.3), for mean wind angles of 0, -5, and -10 degrees, the steady-state motions of the beam were measured with additional beams placed upstream and downstream of the active beam, in the configurations shown in Figure 3-32 through Figure For horizontal winds and winds with a mean angle of incidence of -5 degrees, the steady-state responses were all very small. For winds with a mean angle of incidence of -10 degrees, there are two cases that stand out - Case 936 and Case 939. For Case 936, all beams were added downstream from the active beam. Similar to the results for Shape 1, the steady-state motion with the downstream beams in place was greater than they were with no other adjacent beams. At U/nD = 8.3, the peak value was YP = for the isolated Shape 2 beam. With the adjacent beams, at the same value of U/nD, the steady-state motion increased to YP = In Case 939, the active beam was the most downstream beam of four and the steady-state motion was YP = Both responses were significantly less than YP = recorded for the Shape 1 beam (with downstream interaction), but for Shape 2 beams, this interaction occurred at a relatively low value of U/nD = 8.3. For most of the United States, U/nD = 8.3 corresponds to a mean wind speed of 82 mph which is slightly less than the stability criterion for construction stages of 84 mph. Based upon the results obtained for the pair of Shape 1 beams braced to each other, bracing the Shape 2 beams to each other, would likely prevent these motions from occurring. 48
65 YP U/nD Figure 3-29 Steady-State Motion of Narrow Flange I-Beam (Shape 2) Wind at 0 Degrees YP U/nD Figure 3-30 Steady-State Motion of Narrow Flange I-Beam (Shape 2) Wind at -5 Degrees 49
66 YP U/nD Figure 3-31 Steady-State Motion of Narrow Flange I-Beam (Shape 2) Wind at -10 Degrees 50
67 WIND FROM LEFT TO RIGHT SPACING OF BEAMS IN UNITS OF D CASE A YP ACTIVE PASSIVE Figure 3-32 Steady-State Motion of Narrow Flange I-Beam (Shape 2) Wind at 0 Degrees 51
68 WIND FROM LEFT TO RIGHT SPACING OF BEAMS IN UNITS OF D CASE A YP ACTIVE PASSIVE Figure 3-33 Steady-State Motion of Narrow Flange I-Beam (Shape 2) Wind at -5 Degrees 52
69 WIND FROM LEFT TO RIGHT SPACING OF BEAMS IN UNITS OF D CASE A YP ACTIVE PASSIVE Figure 3-34 Steady-State Motion of Narrow Flange I-Beam (Shape 2) Wind at -10 Degrees 53
70 3.6.3 DEEP OPEN-TOPPED BOX (Shape 3) Steady-state vertical motions of an isolated Shape 3 deep open-topped box-girder were measured for mean wind angles of incidence of 0, -5, -10, 5, and 10 degrees, as a function of reduced wind speed, U/nD, and are shown in Figure 3-35 through Figure The results indicate that for the mean wind angles of incidence considered, the section became unstable in a galloping mode at U/nD approximately equal to five. For U/nD = 5 and all wind angles of incidence, the values of YP were approximately 0.2 or less and grew without bound for increasing wind speeds. The motions did not peak at a specific wind speed which would indicate a vortex induced motion but increased with increasing wind speeds which indicates a galloping instability. Steady-state Shape 3 vertical box-girder motions were measured for various configurations with another box-girder in upwind or downwind positions. The steady state motions, for each mean wind at angles of incidence of 0, -5, -10, 5, and 10 degrees are shown in Figure 3-40 through Figure The reduced wind speed (Un/D) was held constant for each wind angle at the value equal to that which initiated the instability for the isolated box. The values of U/nD were 5.3, 5.8, 5.8, 5.7, and 5.4 for wind angles of incidence of 0, -5, -10, 5, and 10 degrees, respectively. For most cases, the steady-state motions of the box-girder system were essentially the same as for the isolated box-girder (at incipient flutter). For Cases 311, 312, 333, and 334 (wind angles -5 and 10 degrees), the box-girder motions were significantly greater due to wake buffeting from the upwind box-girder compounding the instability. 54
71 YP U/nD Figure 3-35 Steady-State Motion of Deep Open-Topped Box-Girder (Shape 3) Wind at 0 Degrees YP U/nD Figure 3-36 Steady-State Motion of Deep Open-Topped Box-Girder (Shape 3) Wind at -5 Degrees 55
72 YP U/nD Figure 3-37 Steady-State Motion of Deep Open-Topped Box-Girder (Shape 3) Wind at -10 Degrees YP U/nD Figure 3-38 Steady-State Motion of Deep Open-Topped Box-Girder (Shape 3) Wind at 5 Degrees 56
73 YP U/nD Figure 3-39 Steady-State Motion of Deep Open-Topped Box-Girder (Shape 3) Wind at 10 Degrees WIND FROM LEFT TO RIGHT SPACING OF BEAMS IN UNITS OF D CASE A YP ACTIVE PASSIVE Figure 3-40 Steady-State Motion of Deep Open-Topped Box-Girder (Shape 3) Wind at 0 Degrees 57
74 WIND FROM LEFT TO RIGHT SPACING OF BEAMS IN UNITS OF D CASE A YP ACTIVE PASSIVE Figure 3-41 Steady-State Motion of Deep Open-Topped Box-Girder (Shape 3) Wind at -5 Degrees 58
75 WIND FROM LEFT TO RIGHT SPACING OF BEAMS IN UNITS OF D CASE A YP ACTIVE PASSIVE Figure 3-42 Steady-State Motion of Deep Open-Topped Box-Girder (Shape 3) Wind at -10 Degrees 59
76 WIND FROM LEFT TO RIGHT SPACING OF BEAMS IN UNITS OF D CASE A YP ACTIVE PASSIVE Figure 3-43 Steady-State Motion of Deep Open-Topped Box-Girder (Shape 3) - Wind at 5 Degrees 60
77 WIND FROM LEFT TO RIGHT SPACING OF BEAMS IN UNITS OF D CASE A YP ACTIVE PASSIVE Figure 3-44 Steady-State Motion of Deep Open-Topped Box-Girder (Shape 3) Wind at 10 Degrees SQUARE OPEN-TOPPED BOX (Shape 4) The behavior of a single Shape 4 box-girder was similar to, but less severe than, that for Shape 3. The steady-state oscillatory motions as a function of reduced wind speed, U/nD, are shown in Figure 3-45 through Figure There was a clear galloping instability that occurred for wind angles of incidence of 0, -5, -10, 5, and 10 degrees at a reduced wind speed of U/nD = 8. At a reduced wind speed of 8, the steady-state response was approximately YP = y/d = 0.18 or less. For higher wind speeds, the motions grew without bound. At a steady reduced wind speed for which incipient flutter occurs, a second Shape 4 box-girder was placed in various upwind and downwind positions to evaluate the influence of adjacent box-girders on the active box-girder for wind angles of incidence of 0, -5, -10, 5, and 10 degrees. The relative steady-state displacements for these cases are shown in Figure 3-50 through Figure The steady-state motions increase, though not significantly, when identical box-girders are placed at distances of 2D and 4D downwind of the active box-girder. This trend is seen for all shapes considered. The windward box-girder still experiences a galloping instability whether or not the leeward box-girder is present at a reduced wind speed of U/nD = 8. 61
78 YP U/nD Figure 3-45 Steady-State Motion of Square Open-Topped Box-Girder (Shape 4) Wind at 0 Degrees YP U/nD Figure 3-46 Steady-State Motion of Square Open-Topped Box-Girder (Shape 4) Wind at -5 Degrees 62
79 YP U/nD Figure 3-47 Steady-State Motion of Square Open-Topped Box-Girder (Shape 4) Wind at -10 Degrees YP U/nD Figure 3-48 Steady-State Motion of Square Open-Topped Box-Girder (Shape 4) Wind at 5 Degrees 63
80 YP U/nD Figure 3-49 Steady-State Motion of Square Open-Topped Box-Girder (Shape 4) Wind at 10 Degrees WIND FROM LEFT TO RIGHT SPACING OF BEAMS IN UNITS OF D CASE A YP ACTIVE PASSIVE Figure 3-50 Steady-State Motion of Square Open-Topped Box-Girder (Shape 4) Wind at 0 Degrees 64
81 WIND FROM LEFT TO RIGHT SPACING OF BEAMS IN UNITS OF D CASE A YP ACTIVE PASSIVE Figure 3-51 Steady-State Motion of Square Open-Topped Box-Girder (Shape 4) Wind at -5 Degrees WIND FROM LEFT TO RIGHT SPACING OF BEAMS IN UNITS OF D CASE A YP ACTIVE PASSIVE Figure 3-52 Steady-State Motion of Square Open-Topped Box-Girder (Shape 4) Wind at -10 Degrees 65
82 WIND FROM LEFT TO RIGHT SPACING OF BEAMS IN UNITS OF D CASE A YP ACTIVE PASSIVE Figure 3-53 Steady-State Motion of Square Open-Topped Box-Girder (Shape 4) Wind at 5 Degrees WIND FROM LEFT TO RIGHT SPACING OF BEAMS IN UNITS OF D CASE A YP ACTIVE PASSIVE Figure 3-54 Steady-State Motion of Square Open-Topped Box-Girder (Shape 4) Wind at 10 Degrees 66
83 3.6.5 SHALLOW OPEN-TOPPED BOX (Shape 5) Shown in Figure 3-55 through Figure 3-59 are steady-state vertical motions of an isolated Shape 5 box-girder at mean wind angles of incidence of 0, -5, -10, 5, 10 degrees, as a function of the reduced wind speed, U/nD. As can been seen, there is a mild galloping instability for wind angles of incidence of 0 and -5 degrees, at a U/nD = 20. For typical boxgirder depths, D, and vertical frequencies of vibration, n, the mean wind speed at a reduced wind speed of U/nD = 20 will be approximately 190 mph. This is primarily of academic interest and is of little practical concern. Shown in Figure 3-60 through Figure 3-64 are steady-state motions of the active boxgirder in the presence of an identical box-girder, placed upwind or downwind, for mean angles of incidence of 0, -5, -10, 5, and 10 degrees. The steady-state motions were measured at a constant reduced wind speed, at which a galloping instability in the isolated box-girder was identified, of 20.3, 21.3, 19.8, 19.7, and 19.8 for mean wind angles of incidence of 0, -5, -10, 5, 10 degrees, respectively. Again, in most cases, the steady-state motions increased in the presence of a downwind box-girder and decreased in the wake of an upwind box-girder. The large motions occurred at a very high reduced wind speed of approximately U/nD =
84 YP U/nD Figure 3-55 Steady-State Motion of Shallow Open-Topped Box-Girder (Shape 5) Wind at 0 Degrees YP U/nD Figure 3-56 Steady-State Motion of Shallow Open-Topped Box-Girder (Shape 5) Wind at -5 Degrees 68
85 YP U/nD Figure 3-57 Steady-State Motion of Shallow Open-Topped Box-Girder (Shape 5) Wind at -10 Degrees YP U/nD Figure 3-58 Steady-State Motion of Shallow Open-Topped Box-Girder (Shape 5) Wind at 5 Degrees 69
86 YP U/nD Figure 3-59 Steady-State Motion of Shallow Open-Topped Box-Girder (Shape 5) Wind at 10 Degrees WIND FROM LEFT TO RIGHT SPACING OF BEAMS IN UNITS OF D CASE A YP ACTIVE PASSIVE Figure 3-60 Steady-State Motion of Shallow Open-Topped Box-Girder (Shape 5) Wind at 0 Degrees 70
87 WIND FROM LEFT TO RIGHT SPACING OF BEAMS IN UNITS OF D CASE A YP ACTIVE PASSIVE Figure 3-61 Steady-State Motion of Shallow Open-Topped Box-Girder (Shape 5) Wind at -5 Degrees WIND FROM LEFT TO RIGHT SPACING OF BEAMS IN UNITS OF D CASE A YP ACTIVE PASSIVE Figure 3-62 Steady-State Motion of Shallow Open-Topped Box-Girder (Shape 5) Wind at -10 Degrees WIND FROM LEFT TO RIGHT SPACING OF BEAMS IN UNITS OF D CASE A YP ACTIVE PASSIVE Figure 3-63 Steady-State Motion of Shallow Open-Topped Box-Girder (Shape 5) Wind at 5 Degrees 71
88 WIND FROM LEFT TO RIGHT SPACING OF BEAMS IN UNITS OF D CASE A YP ACTIVE PASSIVE Figure 3-64 Steady-State Motion of Shallow Open-Topped Box-Girder (Shape 5) Wind at 10 Degrees 72
89 3.6.6 SQUARE OPEN-TOPPED BOX WITH SLOPING SIDES (Shape 6) Shown in Figure 3-65 through Figure 3-69 are the steady-state oscillatory vertical motions of an isolated Shape 6 box-girder at mean wind angles of incidence of 0, -5, -10, 5, 10 degrees, as a function of reduced wind speed, U/nD. The behavior was similar to the square open-topped box-girder with vertical sides (Shape 4), except that the galloping instability identified occurred at a larger reduced wind speed of U/nD = 10. The galloping instability was observed for mean wind angles of incidence of 0, 5, and 10 degrees only. For mean wind angles of incidence of -5 and -10 degrees, the response was relatively small for all tested values of U/nD. Shown in Figure 3-70 through Figure 3-74 are steady-state responses of the active Shape 6 box-girder with a second Shape 6 box-girder in various upwind or downwind positions, at reduced wind speeds of 10.5, 10.8, 11.5, 11.2, and 10.7, for wind angles of incidence of 0, -5, -10, 5, and 10 degrees, respectively. The values of U/nD are those at which the isolated Shape 6 box-girder developed a galloping instability. For those cases that did experience a galloping instability, the steady-state motions of the active box-girder were slightly higher in the presence of a second downwind box-girder. If the instabilities are avoided in the first place, the slightly higher motions in the presence of a downwind box are of little concern. At mean angles of incidence of 0 and 5 degrees, there were increased steady-state motions compounded by wake buffeting from a second upwind Shape 6 box-girder at a spacing of 3D. These motions were at an incipient flutter value of U/nD and would not occur if the flutter wind speed of U/nD is avoided. 73
90 YP U/nD Figure 3-65 Steady-State Motion of Shallow Open-Topped Box-Girder with Sloping Sides (Shape 6) Wind at 0 Degrees YP U/nD Figure 3-66 Steady-State Motion of Shallow Open-Topped Box-Girder with Sloping Sides (Shape 6) Wind at -5 Degrees 74
91 YP U/nD Figure 3-67 Steady-State Motion of Shallow Open-Topped Box-Girder with Sloping Sides (Shape 6) Wind at -10 Degrees YP U/nD Figure 3-68 Steady-State Motion of Shallow Open-Topped Box-Girder with Sloping Sides (Shape 6) Wind at 5 Degrees 75
92 YP U/nD Figure 3-69 Steady-State Motion of Shallow Open-Topped Box-Girder with Sloping Sides (Shape 6) Wind at 10 Degrees WIND FROM LEFT TO RIGHT SPACING OF BEAMS IN UNITS OF D CASE A YP ACTIVE PASSIVE Figure 3-70 Steady-State Motion of Shallow Open-Topped Box-Girder with Sloping Sides (Shape 6) Wind at 0 Degrees 76
93 WIND FROM LEFT TO RIGHT SPACING OF BEAMS IN UNITS OF D CASE A YP ACTIVE PASSIVE Figure 3-71 Steady-State Motion of Shallow Open-Topped Box-Girder with Sloping Sides (Shape 6) Wind at -5 Degrees WIND FROM LEFT TO RIGHT SPACING OF BEAMS IN UNITS OF D CASE A YP ACTIVE PASSIVE Figure 3-72 Steady-State Motion of Shallow Open-Topped Box-Girder with Sloping Sides (Shape 6) Wind at -10 Degrees 77
94 WIND FROM LEFT TO RIGHT SPACING OF BEAMS IN UNITS OF D CASE A YP ACTIVE PASSIVE Figure 3-73 Steady-State Motion of Shallow Open-Topped Box-Girder with Sloping Sides (Shape 6) Wind at 5 Degrees WIND FROM LEFT TO RIGHT SPACING OF BEAMS IN UNITS OF D CASE A YP ACTIVE PASSIVE Figure 3-74 Steady-State Motion of Shallow Open-Topped Box-Girder with Sloping Sides (Shape 6) Wind at 10 Degrees 78
95 3.6.7 SQUARE BOX WITH NARROW DECK (Shape 7) Shown in Figure 3-75 are the steady-state, oscillatory, vertical motions of a Shape 7 box-girder, for horizontal winds, as a function of the reduced wind speed, U/nB. For completed bridge sections, it is typical to use the deck width, B, as the reference dimension. A slight instability was identified at a high value of the reduced wind speed, U/nB. The instability is of little concern for practical applications due to the high wind speed required. In general, the observed motion was quite small YP U/nB Figure 3-75 Steady-State Motion of Square Box-Girder with Narrow Deck (Shape 7) Wind at 0 Degrees 79
96 3.6.8 SHALLOW BOX WITH NARROW DECK (Shape 8) Shown in Figure 3-76 are the steady-state, oscillatory, vertical motions of a Shape 8 box-girder, for horizontal winds, as a function of the reduced wind speed, U/nB. For completed bridge sections, it is typical to use the deck width, B, as the reference dimension. A slight instability was identified at a high value of the reduced wind speed, U/nB. This instability is of little concern for practical applications due to the high wind speed required. In general, the observed motion was quite small YP U/nB Figure 3-76 Steady-State Motion of Shallow Box-Girder with Narrow Deck (Shape 8) Wind at 0 Degrees 80
97 3.6.9 SHALLOW BOX WITH WIDE DECK (Shape 9) Shown in Figure 3-77 are the steady-state, oscillatory, vertical motions of a Shape 9 box girder, for horizontal winds, as a function of the reduced wind speed, U/nB. For completed bridge sections, it is typical to use the deck width, B, as the reference dimension. A slight instability was identified at a reduced wind speed, U/nB = 10. It is of little concern for practical applications because the value of B is large which corresponds to a relatively high wind speed, U. In general, the observed motion was small YP U/nB Figure 3-77 Steady-State Motion of Shallow Box-Girder with Wide Deck (Shape 9) Wind at 0 Degrees 81
98 3.7 Static Test Results In Consolazio et. al. (2013), drag coefficients were measured for several I-shaped beam types in numerous configurations with multiple beams and various angles of incidence. Only one open-topped box-girder section was tested in that study. To complement the existing information, drag coefficients for the four open-topped boxgirder shapes used in the current study were measured for horizontal winds in a single-box boxgirder configuration. In addition to the single box configuration, drag coefficients for the square open-topped box-girder were also measured in a two-box system, at wind angles of incidence of 0, -5, -10, 5, and 10 degrees. The wind is assumed to be perpendicular to the axis of the member. A dimensionless drag coefficient, C D, for a prismatic member is defined by: C D = DRAG / (q)(d)(l) Where: DRAG: total force on the member in direction parallel to wind, q: dynamic pressure equal to (1/2)(ρ)(U 2 ), ρ: density of air, U: mean wind speed, D: vertical depth perpendicular to the direction of the wind for a prismatic member, and L: member length. The units of the above variables should be consistent. The drag coefficients obtained for the four open-topped box-girder shapes considered in this study are shown in Table 3-4. In all cases, D is the vertical dimension of the section. The drag coefficient on the square, open-topped box-girder in a two-box system was measured for mean angles of incidence of 0, -5, -10, 5, and 10 degrees, in positions 2D, 3D, and 4D downstream of the windward box-girder. The drag coefficients are shown in Table 3-5 for the two-box systems. The drag coefficient on the windward box-girder is When the downstream box-girder is spaced at 2D and wind angles of incidence of -5, 0, and 5 degrees, the drag coefficients are negative which is consistent with the results from Consolazio, et.al. For extreme angles of incidence of -10 and 10 degrees and at a position of 4D downstream, the drag coefficients are and For all angles of incidence considered and a downstream spacing of 3D, the highest drag coefficient measured was 0.832, approximately one-half of the drag coefficient on the upwind box. 82
99 Table 3-4 Drag Coefficients CASE D/W* C D DEEP OPEN-TOPPED BOX (SHAPE 3) SQUARE OPEN-TOPPED BOX (SHAPE 4) SHALLOW OPEN-TOPPED BOX (SHAPE 5) SQUARE OPEN-TOPPED BOX WITH SLOPING SIDES (SHAPE 6) *D/W DEPTH-TO-WIDTH RATIO Table 3-5 Drag Coefficients on Downstream Square Boxes SPACING OF BOX DOWNSTREAM Wind Angle (degrees) OF WINDWARD BOX 2D 3D 4D
100 3.8 Wind Tunnel Testing Summary The significant findings from the wind tunnel tests of various I- beams, open-topped boxgirders, and box-girders with decks are described below. The shapes tested and test program are described in Section 3.2. Dynamic tests were conducted to identify potential wind-induced motion sensitivities. Most tests were conducted for mean angles of incidence of -10, -5, 0, 5, and 10 degrees. The dynamic results are somewhat conservative for the following reasons. First, all tests were performed in smooth flow. Vortex-induced motions and aeroelastic instabilities are less likely to occur in turbulent flow than in smooth flow. Second, all tests were performed with winds that were perpendicular to the longitudinal axis of the I-beams and box-girders; vortex-induced motions and aeroelastic instabilities are more likely to occur in wind perpendicular to the member axis. The third and final reason is that the wind speeds were held constant over a period of time (up to 15 minutes) to let the motions, if any, achieve steady-state amplitudes. In naturally occurring winds, the wind speed is not likely to remain at a constant wind speed and direction for a 15 minute period. While naturally occurring winds are not likely to be smooth, perpendicular to the member axis, and absolutely constant over a 15 minute period, these irregularities should not be relied upon to mask potential vortex-induced motion problems or aeroelastic instabilities. This is a policy common to many testing laboratories and regulating bodies. Vortex-induced motions and galloping instabilities of I-shaped beams and plate girders are not likely to occur in anticipated winds if the beams are braced to each other. Open-topped boxes are susceptible to vortex-induced motions and/or aeroelastic galloping instabilities. The wind speed at which wind-induced motions might occur is dependent upon the depth-to-width ratio, D/W, of the open-topped box. The values of U/nD at which excessive motions might occur for different shaped open-topped boxes are shown in Table 3-6 where: U: mean wind speed, n: vertical natural frequency of vibration, D: depth of open-topped box, and W: horizontal dimension of box in the direction parallel to the wind. The units of the above variables should be consistent. Table 3-6 Critical Flutter Wind Speeds SHAPE DESCRIPTION D/W U/nD AT CRITICAL FLUTTER WIND SPEED Deep Open-Topped Box (Shape 3) Square Open-Topped Box (Shape 4) Shallow Open-Topped Box (Shape 5) Square Open-Topped Box with Sloping Sides (Shape 6)
101 The critical flutter wind speeds shown in Table 3-6 were not particularly sensitive to the mean angle of incidence or the proximity of another box on the leeward side. Aerodynamically, the top surface of the pocket of still air in an open-topped box is not likely to behave significantly different from that of a solid smooth surface at the top of the box. Therefore, the results in Table 3-6 would most likely be similar for closed-topped box-girders of similar dimension. The wind-induced motion of the three box-girder shapes tested with decks was relatively small for all practical wind speeds. Static wind tunnel tests were performed to determine static drag coefficients for open topped box-girders of various shapes. The static drag coefficients, C D, were found to be dependent upon the depth-to-width ratio, D/W, of the box-girder section. The drag coefficients are shown in Table 3-7. See Section 3.7 for a definition of a drag coefficient, C D. Table 3-7 Static Drag Coefficients SHAPE DESCRIPTION D/W C D Deep Open-Topped Box (Shape 3) Square Open-Topped Box (Shape 4) Shallow Open-Topped Box (Shape 5) Square Open-Topped Box with Sloping Sides (Shape 6) Again, because the aerodynamics of flow about an open-topped box is similar to that over a similarly shaped, closed box, it is reasonable to assume that the drag coefficients will be similar for similar shapes that are closed-topped box-girders. For all angles of incidence considered and for clear distance between square boxes no greater than 2D, equal to a two-box system with square box-girders spaced at 3D, it is reasonable to assume that the drag coefficient on the leeward box is one-half of the drag coefficient on the windward box. 85
102 This page is intentionally left blank. 86
103 4 PROPOSED SPECIFICATIONS Based on the findings of the literature search and the wind tunnel testing results, the following revisions to the wind load provisions in the AASHTO LRFD are proposed. The proposed revisions to AASHTO LRFD Article 3.4, Article 5.14, and Article 15.8 are shown below using the same method used in an AASHTO Bridge Subcommittee agenda item, i.e., additions are underlined and deletions are shown with strikethrough. The revisions to Article 3.8 are considered a complete rewrite and, as such, the entire article is shown in normal font. 4.1 Major Changes to Current Provisions The major changes and additions to the current specification provisions are listed below. Basis of wind speed The current specifications are based on the fastest-mile wind speed. The fastestmile wind speed is determined by measuring the time required for a one-mile-long column of air to pass through the wind speed measuring device. The wind speed is assumed to be constant during the measuring period, i.e. the wind speed is the average speed during the measuring period. As such, the averaging time depends on the wind speed. For example, the averaging time is 60 second and 120-second for fastest-mile wind speeds of 60 mph and 30 mph, respectively. Wind load provisions in modern design codes are based on a constant averaging period; the averaging period varies between design codes. The proposed revisions to the AASHTO LRFD wind load provisions are based on the 3-second gust wind speed; i.e. the averaging time is three seconds. The 3-second gust wind speed was selected because wind maps for this averaging time are readily available. In addition, the wind load provisions of ASCE 7-10 are also based on this averaging time. Using the same averaging time will make the design of bridges consistent with the design of other structures. Due to the shorter averaging time, as compared to the fastest-mile wind speed, the 3-second gust wind speed is always numerically higher than the equivalent fastest-mile wind speed. Wind pressure on the structure is calculated using the basic wind pressure equation The proposed provisions do not include a base wind pressure but use the basic wind pressure equation, shown below, to calculate the wind pressure. P Z = 2.56 x 10⁻⁶ V 2 K Z G C D Where: P Z = design wind pressure, ksf V = reference 3-second gust wind speed specified for the load combination under consideration (mph). K Z = pressure exposure and elevation coefficient that accounts for the topography and elevation for the Strength III load combination; taken as 1.0 for 87
104 other load combinations that are based on a constant wind speed regardless of the geographical location, exposure conditions or elevation (DIM). G = gust effect factor determined using a structure-specific study or as specified in the proposed provisions for the Strength III load combination and 1.0 for other load combinations (DIM). C D = drag coefficient determined using a structure-specific study or as specified in the proposed provisions (DIM). The term 2.56 x 10⁻⁶ is equal to the product of 1/2 ρ, where ρ is the density of air, and the conversion factors to convert wind speed from mph to fps. To obtain pressures in psf (or ksf), the density of air should be in slugs/ft 3 and wind speed in fps. A generally accepted air density is slugs/ft 3. For a conversion of wind speed from mph to fps of (5280/3600) = , then (0.5)( )( ) 2 = (for psf). Since it is desirable to have pressures in ksf, this lead coefficient becomes 2.56 x It is noted that the density of air is not a constant. Depending on the temperature and elevation, the air density varies from slugs/ft 3 to slugs/ft 3 (from 62% to 116% of the specification value). No base wind speed is used The current provisions allow the use of a 100 mph base wind speed. This wind speed is used for the Strength III load combination. Strength V, Service I and Service IV load combinations are based on constant wind speeds. Instead of calculating the wind pressure for the specified constant wind speeds, the 100 mph wind speed is used and the Strength V, Service I and Service IV load factors for wind loads on the structure is adjusted to scale the resulting factored wind load to the implied load factor and constant wind speed specified for each load combination. The proposed provisions do not include a base wind speed; rather, the provisions use the 3-second gust wind maps to determine the design wind speed for Strength III. This speed is used in the wind pressure equation to calculate wind pressures for the Strength III load combination. Each of the other load combinations that include wind load (Strength V, Service I and Service IV) is based on a constant wind speed which is discussed further below. Load factor for wind is 1.0 for all load combinations The current provisions for wind on the structure are based on a load factor of 1.4 for strength load combinations and 1.0 for service load combinations. However, instead of using these load factors explicitly with wind pressures corresponding to the constant wind speeds assumed for Strength V and Service I (55 mph fastest-mile wind) and Service IV (84 mph fastest-mile wind), the wind pressure from the 100 mph wind is used with the 1.4 and 1.0 load factors multiplied by the square of the ratio of the wind speed divided by 100. This results in the following load factors: Strength V: 1.4 (55/100) 2 = 0.42 (rounded to 0.4) Service I: (55/100) 2 = 0.3 Service IV: (84/100) 2 =
105 With the proposed provisions not using a base wind speed, such an approach was not possible. Instead, the proposed provisions are based on using the wind speed specified for each load combination with a load factor of 1.0. Similar to the current provisions, the proposed provisions specify constant wind speeds for use for Strength V, Service I and Service IV load combinations. Table 4-1 shows the equivalent wind speeds and the associated load factors. Table 4-1 Equivalent Wind Speeds for Strength V, Service I, and Service IV Load Combinations Load Combination Current Provisions Proposed provisions Strength V Service I Service IV 100 mph fastest-mile wind with 0.4 load factor which is approximately equivalent to 55 mph fastest mile wind with 1.4 load factor 100 mph fastest-mile wind with 0.3 load factor which is equivalent to 55 mph fastest mile wind with 1.0 load factor 100 mph fastest-mile wind with 0.7 load factor which is equivalent to 84 mph fastest mile wind with 1.0 load factor 82 mph 3-second gust wind with 1.0 load factor 69 mph 3-second gust wind with 1.0 load factor 102 mph 3-second gust wind with 1.0 load factor No adjustment for topography and elevation for Strength V, Service I, and Service IV As shown above, the current provisions apply different load factors to the wind pressure calculated for the 100 mph base wind speed to produce the wind pressures associated with the constant wind speeds specified for Strength V, Service I, and Service IV load combinations. As the wind pressure for the 100 mph base wind speed are adjusted for adjusted for topography and elevation, the wind pressures calculated for the constant wind speeds specified for the Strength V, Service I, and Service IV load combinations are also adjusted for topography and elevation. The adjustment for topography and elevation was not the intent of the current specifications as explained below. The 55 mph fastest-mile wind speed used for Strength V and Service I in the current provisions is thought to be the maximum wind speed at which trucks can travel safely. As such, this wind speed is used for load combinations that include live load and wind (Strength V and Service I). Adjusting the wind pressure for topography and elevation is akin to adjusting the wind speed. With the intent of the current provisions to keep the wind speed constant at 55 mph for Strength V and Service I load combinations, no adjustment for the topography and elevation should be made for these two load combinations. The same argument applies to the Service IV load combination with the 84 mph currently specified. The effect of skewed wind is accounted for in essentially the same way as in the current provisions with the simplification for small bridges still permitted. The wind on live load is accounted for in essentially the same way as in the current provisions with the simplification for small bridges still permitted. 89
106 The wind load provisions on sound barriers have been deleted from Section 15 of the specifications and moved to Article 3.8. The general procedure for wind load on structures is proposed for sound barriers. Provisions for wind pressure on the structure during construction have been added. Additional guidance to account for aeroelastic behavior for bridges in service and during construction has been added. 4.2 Modifications to Specifications Article LOAD FACTORS AND COMBINATIONS Load Factors and Load Combinations The total factored force effect shall be taken as: Q Q where: i i i ( ) C3.4.1 The background for the load factors specified herein, and the resistance factors specified in other Sections of these Specifications is developed in Nowak (1992). η i = load modifier specified in Article Q i = force effects from loads specified herein γ i = load factors specified in Tables and Components and connections of a bridge shall satisfy Eq for the applicable combinations of factored extreme force effects as specified at each of the following limit states: Strength I Basic load combination relating to the normal vehicular use of the bridge without wind. Strength II Load combination relating to the use of the bridge by Owner-specified special design vehicles, evaluation permit vehicles, or both without wind. Strength III Load combination relating to the bridge exposed to wind velocity exceeding mph. The permit vehicle should not be assumed to be the only vehicle on the bridge unless so assured by traffic control. See Article regarding other traffic on the bridge simultaneously. Vehicles become unstable at higher wind velocities. Therefore, high winds prevent the presence of significant live load on the bridge. Wind load provisions in earlier editions of the specifications were based on fastest-mile wind speed measurements. The current wind load provisions are based on 3-second wind gust speed. When applied with the load factor specified in Table , the 82 mph 3-second gust wind speed is equivalent to 55 mph fastest-mile wind applied with the 1.4 load factor used in earlier specifications. The 3-second gust wind speed to be used for different limit states is specified in Article
107 Strength IV Load combination relating to very high dead load to live load force effect ratios in bridge superstructures. Strength V Load combination relating to normal vehicular use of the bridge with wind of mph velocity. Extreme Event I Load combination including earthquake. The load factor for live load γ EQ, shall be determined on a project-specific basis. Extreme Event II Load combination relating to ice load, collision by vessels and vehicles, check floods, and certain hydraulic events with a reduced live load other than that which is part of the vehicular collision load, CT. The cases of check floods shall not be combined with BL, CV, CT, or IC. 91 The standard calibration process for the strength limit state consists of trying out various combinations of load and resistance factors on a number of bridges and their components. Combinations that yield a safety index close to the target value of β = 3.5 are retained for potential application. From these are selected constant load factors γ and corresponding resistance factors for each type of structural component reflecting its use. This calibration process had been carried out for a large number of bridges with spans not exceeding 200 ft These calculations were for completed bridges. For the primary components of large bridges, the ratio of dead and live load force effects is rather high, and could result in a set of resistance factors different from those found acceptable for small- and medium-span bridges. It is believed to be more practical to investigate one additional load case than to require the use of two sets of resistance factors with the load factors provided in Strength Load Combination I, depending on other permanent loads present. Spot checks had been made on a few bridges with up to 600-ft spans, and it appears that Strength Load Combination IV will govern where the dead load to live load force effect ratio exceeds about 7.0. This load combination is not applicable to investigation of construction stages, substructures, and bearing design. Other load combinations adequately address substructures and bearings. When applied with the load factor specified in Table , the 82 mph 3-second gust wind speed is equivalent to the 100 mph fastest-mile wind used in earlier specifications applied with a load factor of 0.4. The latter was meant to be equivalent to a 55 mph fastest-mile wind applied with a load factor of 1.4. Past editions of the Standard Specifications used γ EQ = 0.0. This issue is not resolved. The possibility of partial live load, i.e., γ EQ < 1.0, with earthquakes should be considered. Application of Turkstra s rule for combining uncorrelated loads indicates that γ EQ = 0.50 is reasonable for a wide range of values of average daily truck traffic (ADTT). The following applies to both Extreme Event I and II: The recurrence interval of extreme events is thought to exceed the design life. Although these limit states include water loads, WA, the effects due to WA are considerably less significant than the effects on the structure stability due to scour. Therefore, unless specific site conditions dictate otherwise, local pier scour and contraction scour depths should not be combined with BL, EQ, CT, CV, or IC. However, the effects due to degradation of the channel should be considered. Alternatively, one-half of the total scour may be considered in combination with BL, EQ, CT, CV, or IC.
108 Service I Load combination relating to the normal operational use of the bridge with a mph wind and all loads taken at their nominal values. Also related to deflection control in buried metal structures, tunnel liner plate, and thermoplastic pipe, to control crack width in reinforced concrete structures, and for transverse analysis relating to tension in concrete segmental girders. This load combination should also be used for the investigation of slope stability. Service II Load combination intended to control yielding of steel structures and slip of slip-critical connections due to vehicular live load. Service III Load combination for longitudinal analysis relating to tension in prestressed concrete superstructures with the objective of crack control and to principal tension in the webs of segmental concrete girders. Service IV Load combination relating only to tension in prestressed concrete columns with the objective of crack control. 92 The joint probability of these events is extremely low, and, therefore, the events are specified to be applied separately. Under these extreme conditions, the structure may undergo considerable inelastic deformation by which locked-in force effects due to TU, TG, CR, SH, and SE are expected to be relieved. The 0.50 live load factor signifies a low probability of the concurrence of the maximum vehicular live load (other than CT) and the extreme events. Compression in prestressed concrete components and tension in prestressed bent caps are investigated using this load combination. Service III is used to investigate tensile stresses in prestressed concrete components. The wind speeds used in earlier specifications was based on the fastest-mile wind measurements while the current specifications are based on 3- second gust wind speeds. When applied with the load factor specified in Table , the 69 mph 3- second gust wind speed is equivalent to the 100 mph fastest-mile wind shown in earlier specifications applied with a load factor of 0.3. The latter was meant to be equivalent to a 55 mph fastest-mile wind applied with a load factor of 1.0. This load combination corresponds to the overload provision for steel structures in past editions of the AASHTO Specifications, and it is applicable only to steel structures. From the point of view of load level, this combination is approximately halfway between that used for Service I and Strength I Limit States. The live load specified in these specifications reflects, among other things, current exclusion weight limits mandated by various jurisdictions. Vehicles permitted under these limits have been in service for many years prior to For longitudinal loading, there is no nationwide physical evidence that these vehicles have caused cracking in existing prestressed concrete components. The statistical significance of the 0.80 factor on live load is that the event is expected to occur about once a year for bridges with two traffic lanes, less often for bridges with a single traffic lance. Service I should be used for checking tension related to transverse analysis of concrete segmental girders. The principal tensile stress check is introduced in order to verify the adequacy of webs of segmental concrete girder bridges for longitudinal shear and torsion. Wind load for Service IV load combination in earlier specifications was based on fastest-mile wind of 100 mph applied with a load factor of 0.7. This load The 0.70 factor on wind represents an 84 mph fastest-mile wind applied with a load factor of 1.0. This wind load was meant to This should result in zero tension in prestressed concrete columns for ten-year mean reoccurrence winds. The 84 mph fastest-mile wind is equivalent to 102 mph 3-second gust wind speed currently used for the Service IV load
109 Fatigue I Fatigue and fracture load combination related to infinite load-induced fatigue life. Fatigue II Fatigue and fracture load combination related to finite load-induced fatigue life. The load factors for various loads comprising a design load combination shall be taken as specified in Table All relevant subsets of the load combinations shall be investigated. For each load combination, every load that is indicated to be taken into account and that is germane to the component being designed, including all significant effects due to distortion, shall be multiplied by the appropriate load factor and multiple presence factor specified in Article , if applicable. The products shall be summed as specified in Eq and multiplied by the load modifiers specified in Article The factors shall be selected to produce the total extreme factored force effect. For each load combination, both positive and negative extremes shall be investigated. In load combinations where one force effect decreases another effect, the minimum value shall be applied to the load reducing the force effect. For permanent force effects, the load factor that produces the more critical combination shall be selected from Table Where the permanent load increases the stability or load-carrying capacity of a component or bridge, the minimum value of the load factor for that permanent load shall also be investigated. 93 combination. The prestressed concrete columns must still meet strength requirements as set forth in Load Combination Strength III in Article It is not recommended that thermal gradient be combined with high wind forces. Superstructure expansion forces are included. The load factor for the Fatigue I load combination, applied to a single design truck having the axle spacing specified in Article , reflects load levels found to be representative of the maximum stress range of the truck population for infinite fatigue life design. The factor was chosen on the assumption that the maximum stress range in the random variable spectrum is twice the effective stress range caused by Fatigue II load combination. The load factor for the Fatigue II load combination, applied to a single design truck, reflects a load level found to be representative of the effective stress range of the truck population with respect to a small number of stress range cycles and to their cumulative effects in steel elements, components, and connections for finite fatigue life design. This Article reinforces the traditional method of selecting load combinations to obtain realistic extreme effects and is intended to clarify the issue of the variability of permanent loads and their effects. As has always been the case, the Owner or Designer may determine that not all of the loads in a given load combination apply to the situation under investigation. It is recognized herein that the actual magnitude of permanent loads may also be less than the nominal value. This becomes important where the permanent load reduces the effects of transient loads. It has been observed that permanent loads are more likely to be greater than the nominal value than to be less than this value. The earth load factor for thermoplastic culverts is set to 1.3; however, to preserve the overall safety at the same levels as historical specifications, an earth-loadinstallation factor is introduced later in these Specifications as part of the implementation of NCHRP Report 631. This factor may be adjusted based on field control of construction practices. In the application of permanent loads, force effects for each of the specified six load types should be computed separately. It is unnecessary to assume that one type of load varies by span, length, or component within a bridge. For example, when investigating uplift at a bearing in a continuous beam, it would not be appropriate to use the maximum load factor for permanent loads in spans that produce a negative reaction and the minimum load factor in spans that produce a positive reaction. Consider the investigation of uplift. Uplift, which was treated as a separate load case in past editions of the AASHTO Standard Specifications, now becomes a strength load
110 The larger of the two values provided for load factor of TU shall be used for deformations and the smaller values for all other effects. For simplified analysis of concrete substructures in the strength limit state, a value of 0.50 for γ TU may be used when calculating force effects, but shall be taken in conjunction with the gross moment of inertia in the columns or piers. When a refined analysis is completed for concrete substructures in the strength limit state, a value of 1.0 for γ TU shall be used in conjunction with a partially cracked moment of inertia determined by analysis. For concrete substructures in the strength limit state, the value of 0.50 for γ PS, γ CR, and γ SH may similarly be used when calculating force effects in non-segmental structures, but shall be taken in conjunction with the gross moment of inertia in the columns or piers. For steel substructures, a value of 1.0 for γ TU, γ PS, γ CR, and γ SH shall be used. The evaluation of overall stability of retained fills, as well as earth slopes with or without a shallow or deep foundation unit should be investigated at the service limit state based on the Service I Load Combination and an appropriate resistance factor as specified in Article and Article For structural plate box structures complying with the provisions of Article 12.9, the live load factor for the vehicular live loads LL and IM shall be taken as 2.0. combination. Where a permanent load produces uplift, that load would be multiplied by the maximum load factor, regardless of the span in which it is located. If another permanent load reduces the uplift, it would be multiplied by the minimum load factor, regardless of the span in which it is located. For example, at Strength I Limit State where the permanent load reaction is positive and live load can cause a negative reaction, the load combination would be 0.9DC DW (LL + IM). If both reactions were negative, the load combination would be 1.25DC DW (LL + IM). For each force effect, both extreme combinations may need to be investigated by applying either the high or the low load factor as appropriate. The algebraic sums of these products are the total force effects for which the bridge and its components should be designed. PS, CR, SH, TU, and TG are superimposed deformations as defined in Article Load factors for TU, and TG are as shown in Table Load factors for PS, CR, and SH are as shown in Table For prestressed members in typical bridge types, secondary prestressing, creep and shrinkage are generally designed for in the service limit state. In concrete segmental structures, CR and SH are factored by γ P for DC because analysis for time-dependent effects in segmental bridges is nonlinear. Abutments, piers, columns, and bent caps are to be considered as substructure components. The calculation of displacements for TU utilizes a factor greater than 1.0 to avoid undersizing joints, expansion devices, and bearings. Applying these criteria for the evaluation of the sliding resistance of walls: The vertical earth load on the rear of a cantilevered retaining wall would be multiplied by γ pmin (1.00) and the weight of the structure would be multiplied by γ pmin (0.90) because these forces result in an increase in the contact stress (and shear strength) at the base of the wall and foundation. The horizontal earth load on a cantilevered retaining wall would be multiplied by γ pmax (1.50) for an active earth pressure distribution because the force results in a more critical sliding force at the base of the wall. Similarly, the values of γ pmax for structure weight (1.25), vertical earth load (1.35) and horizontal active earth pressure (1.50) would represent the critical load combination for an evaluation of foundation bearing resistance. Water load and friction are included in all strength load combinations at their respective nominal values. For creep and shrinkage, the specified nominal values should be used. For friction, settlement, and 94
111 The load factor for temperature gradient, γ TG, should be considered on a project-specific basis. In lieu of project-specific information to the contrary, γ TG may be taken as: 0.0 at the strength and extreme event limit states, 1.0 at the service limit state when live load is not considered, and 0.50 at the service limit state when live load is considered. water loads, both minimum and maximum values need to be investigated to produce extreme load combinations. The load factor for temperature gradient should be determined on the basis of the: Type of structure, and Limit state being investigated. Open girder construction and multiple steel box girders have traditionally, but perhaps not necessarily correctly, been designed without consideration of temperature gradient, i.e., γ TG = 0.0. The load factor for settlement, SE, should be considered on a project-specific basis. In lieu of projectspecific information to the contrary, SE, may be taken as 1.0. Load combinations which include settlement shall also be applied without settlement. For segmentally constructed bridges, the following combination shall be investigated at the service limit state: DC DW EH EV ES WA CR SH TG EL PS ( ) 95
112 Table Load Combinations and Load Factors Load Combination Limit State Strength I (unless noted) DC DD DW EH EV ES EL PS CR SH LL IM CE BR PL LS WA WS WL FR TU TG SE Use One of These at a Time EQ BL IC CT CV γ p /1.20 γ TG γ SE Strength II γ p /1.20 γ TG γ SE Strength III γ p /1.20 γ TG γ SE 1.4 Strength IV γ p /1.20 Strength V γ p /1.20 γ TG γ SE 0.4 Extreme γ p γeq Event I Extreme γ p Event II Service I /1.20 γ TG γ SE 0.3 Service II /1.20 Service III /1.20 γ TG γ SE Service IV / Fatigue I LL, IM & CE only 1.50 Fatigue II LL, IM & CE only Load Factors for Construction Loads Evaluation at the Strength Limit State All appropriate strength limit state load combinations in Table , modified as specified herein, shall be investigated. When investigating Strength Load Combinations I and III for maximum force effects during construction, load factors for the weight of the structure and appurtenances, DC and DW, shall not be less than Unless otherwise specified by the Owner, construction loads including dynamic effects (if applicable) shall be added in Strength Load Combination I with a load factor not less than 1.5 when investigating for maximum force effects. Unless otherwise specified by the Owner, the load factor for wind during construction in Strength Load Combination III shall be the same as shown in Table The appropriate wind speed shall be C The load factors presented here should not relieve the contractor of responsibility for safety and damage control during construction. Construction loads are loads that act on the structure only during construction. Often the construction loads are not accurately known at the time of design. Construction loads include but are not limited to the weight of materials, removable forms, personnel, and equipment such as deck finishing machines or loads applied to the structure through falsework or other temporary supports. The Owner may consider noting the construction loads assumed in the design on the contract documents. The weight of the wet concrete deck and any stay-in-place forms should be considered as DC loads. For steel superstructures, the use of higher-strength steels, composite construction, and limit-states design 96
113 determined as specified in Article 3.8 for bridges during construction. not be less than 1.25 when investigating for maximum force effects. Any applicable construction loads shall be included with a load factor not less than Unless otherwise specified by the Owner, primary steel superstructure components shall be investigated for maximum force effects during construction for an additional load combination consisting of the applicable DC loads and any construction loads that are applied to the fully erected steelwork. For this additional load combination, the load factor for DC and construction loads including dynamic effects (if applicable) shall not be less than 1.4. approaches in which smaller factors are applied to dead load force effects than in previous service-load design approaches have generally resulted in lighter members overall. To ensure adequate stability and strength of primary steel superstructure components during construction, an additional strength limit state load combination is specified for the investigation of loads applied to the fully erected steelwork. 97
114 4.3 Modifications to Specifications Article WIND LOAD: WL AND WS Horizontal Wind Pressure Exposure Conditions General Wind load shall be assumed to be distributed on the area exposed to the wind. The exposed area shall be the sum of areas of all components, including floor system, railing, and sound barriers, as seen in elevation perpendicular to the wind direction. The wind shall be assumed to come from any horizontal direction. The direction of the wind shall be varied to determine the extreme force effect in the structure or in its components. Areas that do not contribute to the extreme force effect under consideration may be neglected in the analysis. Alternatively, for typical bridges, wind loads may be determined for the wind in the direction transverse to the bridge in elevation then adjusted for various angles of attack using the provisions of Article Wind Speed The basic wind speed, V, used in the determination of design wind loads on bridges shall be determined from Figure The basic wind speed shall be increased where records, experience or site-specific wind studies indicate that wind speeds higher than those reflected in Figure , based upon 7% probability of exceedance in 50 years, are possible at the bridge location. Unless a site-specific wind study is performed, wind speeds used for different load combinations shall be taken from Table C For most bridges, the same wind pressure will be used for all components of the structure and the wind load is applied as a uniformly distributed load on the entire exposed area of the structure. However, some situations may warrant using different wind pressures on different components. The most common case is when the substructure is unusually tall which may warrant using different structure heights in determining the wind pressure on different portions of the substructure. The general case is to investigate the wind blowing from different directions and to apply the calculated wind pressure to the area of the projection of the structure on a plane perpendicular to the wind direction as specified herein. However, calculating the projected areas may be cumbersome in some cases. As a simplification, the wind loads from skewed wind may be calculated by applying the skew coefficients specified in Table to the wind load calculated for wind direction transverse to the longitudinal axis of the bridge. The exposed area in this case is the structure area as seen in the elevation view looking transverse to the longitudinal axis of the bridge. C Previous editions of these specifications were based on fastest-mile wind speed. Since that criteria was based on distance, the effect was to average the wind speed over different lengths of time. The use of fastestmile wind speed is no longer utilized by modern wind codes and the provisions herein are based on 3-second gust wind speed which means that the wind speed is averaged over three seconds. Figure shows the design reference 3- second gust wind speed, at an elevation of 30 ft, for Wind Exposure Category C, as defined in Article , with a mean recurrence interval (MRI) of 700 years. The figure is taken from the ASCE 7-10 (2010). The wind pressure determined using the specified basic wind speed with a load factor of 1.0 is approximately equivalent to the wind pressure determined using fastest-mile wind speed with a MRI of 100 years and a load factor of 1.4. This is the reason the load factor for wind load on the structure, WS, in the Strength III load combination has been reduced from the 1.4 used in earlier editions of the specifications to the 98
115 Table Second Gust Wind Speed for Different Load Combinations, V Load Combination 3-Second Gust Wind Speed (mph) Reference 3-second gust wind speed, at the bridge site, at an elevation of 30 ft, in a Surface Roughness C wind environment, with a mean recurrence interval Strength III (MRI) of 700 years, to be taken from Figure For areas designated as a special wind zone in Figure , the owner shall approve the 3- second gust wind speed. Strength V 82 Service I 69 Service IV currently shown. The change in the load factor was instituted when the design wind speed was changed from the fastest-mile wind used earlier to the reference 3-second gust wind speeds shown in Figure Strength V and Service I load combinations involve live load on the structure. Earlier editions of the specifications were based on assuming vehicles become unstable at fastest-mile wind speeds higher than 55 mph. The load factors previously specified for wind loads on the structure assumed that the wind pressure from the 55 mph fastest-mile wind speed was applied with load factors of 1.4 and 1.0 for Strength V and Service I load combinations, respectively. Similarly, the Service IV load combination in earlier editions of the specifications was based on a fastest-mile wind speed of 84 mph applied with a load factor of 1.0. This limit on the wind speed for Strength V, Service I and Service IV load combinations have been maintained, however, the wind speed shown for these load combinations in Table reflects the use of 3-second gust wind speeds and the load factor of 1.0 for wind on the structure, WS, currently shown in Table for all load combinations involving wind on the structure. For buildings and other structures, local building officials typically determine the 3-second gust wind speed to be used in the special wind zones under their jurisdiction. Bridge owners will need to develop their own policy for the 3-second gust wind speed to be used in these zones. 99
116 Figure Basic Wind Speed, V, in (mph). 100
 Basic Wind")
117 Figure (cont d) Basic Wind Speed, V, in (mph). 101
118 Wind Sectors For each wind direction to be investigated, the exposure conditions of the bridge shall be determined for the two upwind sectors extending 45 to either side of the wind direction. The exposure conditions in the two sectors shall be determined in accordance with Articles and The exposure condition which results in higher wind loads shall be used in determining the wind load for wind blowing from the direction being investigated. C For a given bridge, the ground surface roughness category may be different for different wind directions based on the obstructions that exist along the direction of the wind. The purpose of examining the two 45 sectors is to determine the maximum wind pressure associated with the wind direction being investigated. Figure C Wind Sectors for Wind from any Direction As required by Article , when wind loads due to skewed wind are determined using the skew coefficient of Article , only wind in the direction transverse to the longitudinal axis of the bridge needs to be investigated. In such cases, the exposure conditions need to be determined only for the 45 sectors associated with the transverse wind Ground Surface Roughness Categories A ground surface roughness within each of the 45 sectors defined in Article shall be determined as follows: C The surface roughness categories are used in determining the wind exposure category of the structure as defined in Article Surface Roughness B: Urban and suburban areas, wooded areas, or other terrain with numerous closely spaced obstructions having the size of single-family dwellings or larger; Surface Roughness C: Open terrain with scattered obstructions having heights generally less than 30 ft. including flat open country and grasslands; and Surface Roughness D: Flat, unobstructed areas and water surfaces; this category includes smooth mud flats, salt flats, and unbroken ice. The surface roughness categories shown herein match those in ASCE 7-10 (2010). Some of the earlier editions of ASCE 7 included a separate category for urban exposure. However, for buildings, particularly tall ones, it is thought that there is not enough urban surface roughness, even in large urban areas, to develop a true urban exposure conditions. Hence, the urban exposure category was eliminated from ASCE 7. However, for a low-bridge in an urban area, an urban exposure could occur in nature. Using surface roughness B for both urban and suburban areas results in a slightly conservative wind loads for structures in urban areas Wind Exposure Categories C The exposure category of the structure shall be determined as follows: 102
119 Wind Exposure Category B: Wind Exposure Category B shall apply where the Ground Surface Roughness Category B, as defined in Article , prevails in the upwind direction for a distance greater than 1,500 ft. for structures with a mean height of less than or equal to 30 ft., and for a distance greater than 2,600 ft. or 20 times the height of the structure, whichever is greater, for structures with a mean height greater than 30 ft. Wind Exposure Category C: Wind Exposure Category C shall apply for all cases where Wind Exposure Categories B or D do not apply. Wind Exposure Category D: Wind Exposure Category D shall apply where the Ground Surface Roughness Category D, as defined in Article , prevails in the upwind direction for a distance greater than 5,000 ft. or 20 times the height of the structure, whichever is greater. Wind Exposure Category D shall also apply where Ground Surface Roughness Category B or C exist immediately upwind of the structure, and the structure is within a distance of 600 ft. or 20 times the bridge height, whichever is greater, from an Ground Surface Roughness Category D condition as defined above. Where Ground Surface Roughness Category D prevails in the upwind direction except when Ground Surface Roughness Category B or C exist for a relatively short distance immediately upwind from the structure, the effect of the presence of Ground Surface Roughness Category B or C may not be significant and, therefore, Ground Surface Roughness Category D is conservatively specified for these situations Wind Pressure on Structures: WS General C For completed structures, the wind pressure shall be determined as: where P Z = 2.56 x 10⁻⁶ V 2 K Z G C D ( ) P Z = design wind pressure, ksf V = reference 3-second gust wind speed specified in Table (mph). K Z = pressure exposure and elevation coefficient specified in Table for Strength III load combination and to be taken as 1.0 for other load combinations (DIM). 103 Additional requirements for determining wind pressure on bridges during construction exist in Article The maximum force effects on a bridge component from wind loads may be caused by wind blowing in a direction other than the transverse to the longitudinal axis of the bridge. Maximum load effects from wind loads due to wind in the transverse and skewed direction should be considered in the design. For structure heights less than 30 ft, the proximity to the ground surface causes turbulence for which the effect on wind pressure cannot be accurately determined. Therefore, no reduction in the value of K Z is shown in Table for structure heights less than 30 ft. Strength V, Service I and Service IV load combinations are based on a predetermined wind speed at the elevation of the bridge deck. Therefore, the pressure exposure and elevation coefficient, K Z, is taken as 1.0 for these load combinations. Unlike ASCE 7-10 (2010), which is based on power law wind profiles, AASHTO LRFD bridge design specifications have always been based on logarithmic wind profiles. The values of K z in Table can be obtained from the following equations:
120 K Z (B) = (2.5ln(z /0.9834) ) 2 / (C ) K Z (C) = (2.5ln(z /0.0984) ) 2 / (C ) K Z (D) = (2.5ln(z /0.0164) ) 2 / (C ) Where K Z (B), K Z (C) and K Z (D) are K Z for Wind Exposure Category B, C and D, respectively. G = gust effect factor determined using a structurespecific study or as specified in Table for Strength III load combination and 1.0 for other load combinations (DIM). The gust effect factor, G, is a function of the size and dynamic characteristics of the structure including bridge natural frequency and damping. The values specified in Table are average values for sound barriers and typical bridge structures. For long span arches, cable-stayed and suspension bridges, using wind tunnel testing to determine a project-specific gust effect factor is warranted. The 0.85 gust effect factor specified for sound barriers in Table is consistent with the gust effect factor in ASCE7-10 (2010) for walls and implies that wind gusts are not likely to engulf the entire structure. However, the loaded area required to produce the maximum wind load on a sound barrier panel and the panel s vertical supports, if used, is relatively small. A higher gust effect factor may be justifiable as wind gusts may engulf the entire area. When the wind speed, K Z, and G specified for Strength V, Service I and Service IV load combinations are substituted in Equation , the resulting wind pressure on bridge structures, P Z, becomes a multiple of the drag coefficient, C D, for the structure being considered. The wind pressure in these cases may be calculated using Table C Table C Wind Pressure on the Structure for Load Combinations Based on Constant Wind Speed C D = drag coefficient determined using a structurespecific study or as specified in Table (DIM). Load combination Strength V Service I Service IV Wind Pressure on the Structure, P Z, for the Specified Wind Speed (ksf) C D C D C D The structure height, Z, used in determining the pressure exposure and elevation coefficient, K z, shall be taken as: For bridge superstructures: The average height of In the case of a long multi-span bridge with large 104
121 the top of the superstructure above the surrounding ground or water surface. For bridge substructures not extending above the elevation of the superstructure: Unless otherwise approved by the owner, the height used in determining the wind pressure on the superstructure. For bridge substructures extending above the elevation of the superstructure: Unless otherwise approved by the owner, the height of the top of the substructure. For ground-mounted sound barriers: The height of the top of the sound barrier above the lower surrounding ground surface. For structure- or traffic barrier-mounted sound barriers: The height of the top of the sound barrier above the low ground or water surface surrounding the support structure. variation in the ground surface elevation under the bridge, such as a bridge crossing a valley, the structure height, Z, may be varied from a span to span. For each span, the structure height, Z, may be taken as the largest value in the span. Determining the wind pressure on substructures not extending above the elevation of the superstructure using the structure height used to determine the wind pressure on the superstructure results in slightly conservative values for most substructures. For extremely tall substructures, using a different height, including varying the height used for different segments of the substructure, may be allowed with the approval of the owner. Substructures extending above the elevation of the superstructure are typically associated with cable stayed bridges and suspension bridges. Wind loads on such structures are typically determined using a structurespecific wind tunnel test. Where the sound barrier is constructed directly atop an embankment, the height of the sound barrier should be measured from the lower ground surface surrounding the embankment. 105
122 Table Pressure Exposure and Elevation Coefficients, K Z Structure Height, Z (ft) Wind Exposure Category B Wind Exposure Category C Wind Exposure Category D Table Gust effect factor, G Structure Type Gust effect factor, G Sound Barriers 0.85 All other structures 1.00 Table Drag Coefficient, C D Component Windward Leeward I-girder and box-girder bridge superstructures 1.3 N/A Trusses, Columns, Sharp Edged Member and Arches Round Member Bridge Substructure 1.6 N/A Sound Barriers 1.3 N/A Loads on the Superstructures C Wind loads on the superstructure shall be used in designing the superstructure components and shall be transmitted to the bearings and the substructure. In the general case of wind analysis, the wind direction shall be varied and the wind load shall be determined as specified in Article The longitudinal and transverse wind loads shall be taken as the algebraic longitudinal and transverse components of the wind load. In lieu of varying the wind direction, the wind load on the superstructure may be taken as the product 106 For trusses, columns, and arches, the wind load transmitted to the substructure will be the sum of the wind loads on the windward and leeward areas.
123 of the skew coefficients specified in Table times the wind load for transverse wind determined using the wind pressure calculated using Equation The wind load on the superstructure components shall be taken as a line load with intensity equal to the wind pressure times the depth of the bridge component exposed to the wind and is applied at the mid-depth of the component. In plan, the longitudinal components of wind loads shall be applied as line loads along the longitudinal axis of the bridge. The skew angle shall be taken as measured from the perpendicular to the longitudinal axis of the bridge in plan. The wind direction for design shall be that which produces the extreme force effect on the component under investigation. The transverse and longitudinal wind load components on the superstructure shall be applied simultaneously. For girder bridges, the wind pressure may be taken as one line load whose intensity is equal to the wind pressure times the depth of the superstructure including the depth of the girders, deck, floor system, railing, and sound barriers, as seen in elevation. For truss bridges, the wind load on different members should be calculated separately and used in designing the members themselves. The effect of shielding from other components should be considered in determining the wind load on the stringers, deck, railing, and sound barriers. The wind loads from different members and from the flooring system are then transferred to the top and bottom planes of wind bracing and are used in designing the wind bracing system, including the end portals and cross-frames, bearings and substructure. The purpose of applying the line load along the longitudinal axis of the bridge in plan is to avoid introducing a moment in the horizontal plane of the superstructure. Table Skew Coefficients for Various Azimuth Angles of Attack Trusses, Columns and Arches Girders Skew Angle (degree) Transverse skew Coefficient Longitudinal skew Coefficient Transverse skew Coefficient Longitudinal skew Coefficient For typical girder and slab bridges having an individual span length of not more than 125 ft and a maximum height of 30.0 ft above low ground or water level the following wind load components may be used: Transverse: 100% of the wind load calculated based on wind direction perpendicular to the exposed surface Longitudinal: 24% of the transverse load Both forces shall be applied simultaneously Forces Applied Directly to the Substructure The transverse and longitudinal forces to be applied directly to the substructure shall be calculated using the wind pressure determined using Equation For wind directions taken skewed to the substructure, the wind pressure shall be resolved into components perpendicular to the end and front elevations of the substructure. The component C When combining the wind forces applied directly to the substructure with the wind forces transmitted to the substructure from the superstructure, all wind forces should correspond to wind blowing from the same direction. 107
124 perpendicular to the end elevation shall act on the exposed substructure area as seen in end elevation, and the component perpendicular to the front elevation shall act on the exposed substructure area as seen in front elevation. The two substructure wind force components shall be applied simultaneously with the wind loads from the superstructure Wind Loads on Sound Barriers The wind pressure on ground-mounted or structure-mounted sound barriers shall be determined using Equation and assuming the wind direction perpendicular to the plane of the sound barrier. The sound barrier panels shall be designed assuming the wind pressure is applied as a uniform load to the entire area of the panels. The vertical support elements, if used, the foundations and the connection of the panel or the vertical support elements to the foundations or the supporting structure, shall be designed for a line load equal in value to the wind pressure multiplied by the sound barrier height. The line load shall be applied at a distance equal to 0.55 times the sound barrier height measured from the bottom of the sound barrier. For determining the location of the line load, the height of the sound barrier shall be taken as the distance from the top of the sound barrier to: For ground-mounted sound barriers: the ground surface immediately adjacent to the sound barrier For structure-mounted sound barriers: the elevation of the sound barrier connection to the supporting structure The wind pressure is applied as a constant pressure over the entire area of the sound barrier. In reality, the wind speed and, consequently, the wind pressure, increase with the increase in height above the surrounding ground surface. Applying the wind load as a line load a location above mid-height of the sound barrier better reflects the effect of the uneven pressure distribution. Where the ground surface elevation is not the same in the front and in the back of a groundmounted sound barrier, the wind forces will need to be determined for each direction as a separate case of loading. The design of all components must satisfy the demand from both cases. Where the sound barrier is mounted on top of a traffic railing or a retaining wall extending above ground, the magnitude and location of the wind loads transmitted to the base of the supporting traffic railing or retaining wall shall be determined as specified above assuming that the height of the exposed area is the sum of the height of the sound barrier plus the height of the supporting railing or retaining wall. The height of the supporting railing or retaining wall to be considered in determining the magnitude and location of the wind load shall be that measured from the top surface of the ground, bridge deck or roadway pavement to the top of the supporting railing or retaining wall Wind Loads on Structures during Construction a Wind Pressure on Structures during Construction C a 108
125 For determining wind pressure on structures during construction, the 3-second reference wind speed, V, used in Equation shall be replaced by RV, where: R = wind speed reduction factor during construction taken as 0.77 for construction periods of 3 years or less, 0.84 for construction periods between 3 and 7 years, and, 0.86 for construction periods between 7 to 9 years. No reduction factor shall be applied for construction periods exceeding 9 years. Traditionally, the wind speed during construction was taken as the wind speed with a mean return interval (MRI) of 10, 20 or 25 years depending on the construction period. The wind pressure from these construction wind speeds was applied with a load factor of 1.4. When a wind speed reduction factor of 0.77, 0.84 or 0.86 are applied to the 3-second reference wind speed defined in Article , the resulting wind speeds correspond to MRI of 42, 97 and 125 years, respectively. These three wind speeds correspond to a 7 percent probability of exceedence in 3, 7 and 9 years, respectively. When the three wind speeds are applied with a load factor of 1.0 as defined for Strength III load combination in Table , the resulting wind pressures are equivalent to those produced by wind speeds with MRI of 10, 20, and 25 years, respectively, when applied assuming a load factor of 1.4, as was specified for Strength III under earlier specifications. Table C a-1 shows the reduction factors associated with a 10, 20 and 25 MRI when a load factor of 1.4 is applied and the associated probability of exceedance for different construction periods. It also shows the equivalent MRI when the wind pressure is determined using a load factor of 1.0. For number of years, N, other than 3, 7 and 9 years, the reduction factor, R, that will produce wind speeds with a 7 percent probability of exceedence in N years and the corresponding MRI s are also shown. Table C a-1 Equivalent MRI for Different Wind Speed Reduction Factors 109 N (years) Probability of exceedence in N years MRI (with load factor=1. 0) MRI (with load factor=1. 4) R
126 Reduction factor values lower than those specified above may be used if approved by the owner. Wind pressure on bridge superstructures or parts thereof, and on substructures during construction before the deck is constructed shall be determined using Equation except that: For determining wind loads on the superstructure that will be transmitted to the substructure, the drag coefficient, C D, shall be taken as the sum of the drag coefficients for all girders as determined using Table a-1 and Table a-2. For determining wind loads that will be used in determining the stresses in a particular girder, the drag coefficient, C D, to be used in determining the wind pressure on that particular girder shall be taken as the base drag coefficient, C D, base, for the exterior girders and one half of this value for interior girders Table a-1 Base Drag Coefficient for Bridge Superstructures during Construction Superstructure Type Base Drag Coefficient (C D, base ) Steel Plate Girders 2.5 Rolled I-beams 2.2 Concrete I-Beams 2.0 Closed and Open Box Girders 2.1 Round Members 1.0 Wind pressures for bridge superstructures, or parts thereof, during construction after the deck is constructed shall be taken as those for completed structures except that the specified reduced wind speed specified herein may be used Values of the reduction factor higher than those specified will result in wind speed with a lower probability of exceedence during the same period. The values of the drag coefficient specified for the interior and exterior girders are the largest values that can be determined using Table a-1 and Table a-2 and assuming the wind direction perpendicular to the bridge from either side. The values of the drag coefficient for open box girders in Table a-1 represent an upperbound value for drag coefficients for different box geometries shown in Table C a-1 (Wassef and Raggett, 2014). The drag coefficients for closed boxes of the same proportions are taken equal to those of open boxes as they are aerodynamically similar. Table C a-1 Base Drag Coefficient for Box-Girders of Different Geometry during Construction Box Geometry Base Drag Coefficient (C D, base ) d/2 d
127 d d 1.66 d d 4 1 d d 1.39 Table a-2 Drag Coefficient for different Girders of Bridge Superstructures during Construction before the Deck is Constructed Girder Windward girder in multi girder systems and for single box-girder systems In two-boxgirder systems with a clear Second girder distance (windward between the side in multigirder two boxes of no more than systems) twice the girders depth In all other systems All other girders Drag Coefficient (C D ) C D, base 0.5 C D, base C D, base For multi-girder systems, the values of C D shown in Table a-1 are for evenly spaced girders (Wassef and Raggett, 2014). Adequate information on the values of C D for girders that are not evenly spaced does not exist in the literature. For such cases, engineering judgment needs to be exercised b Loads from Superstructures during Construction Wind loads from the superstructure for different angles of wind directions shall be determined as specified in Article except that the wind pressures specified in Article a shall be used to determine those loads c Forces Applied Directly to the Substructure during Construction The provisions of Article shall apply except that the wind pressure specified in Article a shall be used d - Wind Loads on Sound Barriers during Construction The provisions of Article shall apply. 111 C d Typically, sound barriers are vertical cantilever structures where the footings and the vertical sound barrier components are constructed first. The design
128 of such structures will be controlled by the wind in its final constructed configuration. As such, no special treatment is specified for sound barriers during construction Wind Pressure on Vehicles: WL When vehicles are present, the design wind pressure shall be applied to both the structure and vehicles. Wind pressure on vehicles shall be represented by an interruptible, moving force of 0.10 klf acting transverse to, and 6.0 ft above, the roadway and shall be transmitted to the structure. Except where specified herein, when wind on vehicles is not taken as transverse to the structure, the components of normal and parallel force applied to the live load may be taken as specified in Table with the skew angle measured from the perpendicular to the longitudinal axis of the bridge in plan. The wind direction for design shall be that which produces the extreme force effect on the component under investigation. The transverse and longitudinal wind load components on the live load shall be applied simultaneously. The wind load on live load shall be applied to the bearings and the substructure. C Historically, the 0.10 klf wind load has been used to determine the wind load on live loads. It was based on a long row of randomly sequenced passenger cars, commercial vans, and trucks exposed to the maximum wind speed beyond which vehicles cannot safely travel. The wind load on live load specified herein has not been changed from its value in earlier editions of these specifications. This horizontal live load should be applied only to the tributary areas producing a force effect of the same kind, similar to the design lane load. Table Wind Components on Live Load Skew Angle (degrees) Transverse Component (klf) Longitudinal Component (klf) For the usual girder and slab bridges having an individual span length of not more than 125 ft and a maximum height of 30.0 ft above low ground or water level, the following wind loading on live load may be used: 0.10 klf, transverse 0.04 klf, longitudinal Both forces shall be applied simultaneously Vertical Wind Pressure C3.8.2 For bridge superstructures after the deck is constructed, unless otherwise determined in Article 3.8.3, a vertical upward wind force equal to 40% of the transverse wind pressure determined using Equation times the width of the deck, including parapets and sidewalks, shall be applied as 112 The intent of this Article is to account for the effect resulting from interruption of the horizontal flow of air by the superstructure. This load is to be applied even to discontinuous bridge decks, such as grid decks. This load may govern where overturning of the bridge is investigated.
129 a line load. This force shall be applied only for the Strength III and Service IV load combinations which do not involve wind on live load, and only when the direction of horizontal wind is taken to be transverse to the longitudinal axis of the bridge. This line load shall be applied at the windward quarter-point of the deck width in conjunction with the horizontal wind loads specified in Article The 40% ratio between the vertical and horizontal wind pressures reflects the ratio between the two components in earlier editions of the specifications where a base horizontal wind pressure of ksf and vertical wind pressure of ksf were used. For flexible bridges, such as cable-stayed and suspension bridges, the vertical force should be checked as an upward or downward force, whichever may control the design Wind-Induced Bridge Motions Bridges in Service General The provisions of this article shall apply to bridges in service and to bridges during construction after the deck and all features affecting their aeroelastic behavior are installed. Force effects of wind-induced vibrations shall be taken into account in the design of bridges and structural components apt to be wind-sensitive. For the purpose of this Article, all bridges with a span to depth ratio, and structural components thereof with a length to width ratio, exceeding 30.0, all cablesupported bridges, and all bridges with fundamental vertical or translational periods greater than 1 second, shall be deemed to be wind-sensitive. The potential of wind-induced vibrations of cables, due to any causative mechanism, shall also be considered Wind-Induced Motions C Because of the complexity of analyses often necessary for an in-depth evaluation of structural wind-induced vibrations, this Article is intentionally kept to a simple statement. Many bridges, decks, or individual structural components have been shown to be insensitive to wind-induced vibrations if the specified ratios are under 30.0, a somewhat arbitrary value helpful only in identifying likely wind-sensitive cases. The most common cable vibrations are due to vortex shedding, rain/wind-induced vibrations, galloping due to the inclination of the cable to the wind, wake galloping, galloping due to aerodynamically unsymmetrical cross-section, excitation from the cable anchorage motion, and buffeting from wind turbulence. Flexible bridges, such as cable-supported or very long spans of any type, may require special studies based on wind tunnel information. In general, appropriate wind tunnel tests involve simulation of the wind environment local to the bridge site. Details of wind tunnel testing are part of the existing wind tunnel state of the art and are beyond the scope of this commentary. C Wind-induced vibrations due to buffeting, vortex excitation, galloping, flutter, and static divergence of wind-sensitive bridges and wind-sensitive components shall be considered where applicable. 113 Excitation due to vortex shedding is the escape of wind-induced vortices behind the member, which tend to excite the component at its fundamental natural frequency in harmonic motion. It is important to keep stresses due to vortex-induced oscillations below the infinite life fatigue stress. Methods exist for estimating such stress amplitudes, but they are outside the scope of this commentary. Tubular components can be protected against vortex-induced oscillation by adding bracing, strakes, or tuned mass dampers or by attaching horizontal flat plates parallel to the tube axis above and/or below the
130 central third of their span. Such aerodynamic damper plates should lie about one-third tube diameter above or below the tube to allow free passage of wind. The width of the plates may be the diameter of the tube. Galloping is a high-amplitude oscillation associated with ice-laden cables or long, flexible members that do not have round cross-sections. Cable-stays, having circular sections, will gallop when the wind is inclined to the axis of the cable, and when their circumferences are deformed by ice, dropping water, or accumulated debris. Flexible bridge decks, as in very long spans and some pedestrian bridges, may be prone to windinduced flutter, a wind-excited oscillation of destructive amplitudes, or, on some occasions, divergence, an irreversible twist under high wind. Analysis methods, including wind tunnel studies leading to adjustments of the deck form, are available for prevention of both flutter and divergence Control of Dynamic Responses For wind-sensitive bridges, peak vertical windinduced accelerations due to vortex shedding or buffeting shall be less than 5% of the acceleration of gravity, g, for steady wind speeds less than or equal to 30 mph, and shall be less than 10% of the acceleration of gravity, g, for steady wind speeds greater than 30 mph and less than or equal to 50 mph. Wind-sensitive bridges and wind-sensitive structural components thereof, including cables, shall be designed to be free of fatigue damage due to vortexinduced or galloping oscillations. Bridges shall be designed to be free of divergence, galloping and catastrophic flutter up to a steady, 10-minute averaged wind speed numerically equal to 0.85 times the design wind speed applicable at the completed bridge at the superstructure elevation. For the purpose of determining the 10-minute averaged wind speed, the design wind speed applicable for the completed bridge at the superstructure elevation shall be taken equal to V(K z ) 1/2, for which V and K z are as defined in Article C Cables in stayed-girder bridges have been successfully stabilized against excessive dynamic responses by attaching mechanical dampers to the bridge at deck level or by cross-tying multiple cablestays. The 5% and 10% of the acceleration of gravity, g, for winds below 30 mph and winds between 30 mph and 50 mph, respectively, are typical limits for the motion criteria for pedestrian comfort. They were used successfully in the past in the design of vehicular flexible bridge systems such as cable-stayed and suspension bridges. For higher wind speeds, strength considerations, not motion considerations, govern the design. The specified 10-minute averaged wind speed, numerically equal to 0.85 V(K z ) 1/2, is that with an approximate mean recurrence interval of 10,000 years. Since catastrophic flutter vibrations take some time to develop, a 10-minute averaged wind speed is used to evaluate the stability of the bridge Bridges During Construction General The provisions of this article shall apply to bridges during construction before the deck is constructed and to essentially completed bridges before all features affecting their aeroelastic behavior, if any, are installed Wind-Induced Motions The peak displacements in the direction of the 114 C The most common wind-induced motions of
131 wind due to buffeting from wind turbulence shall be taken equal to the static displacements determined using the wind pressures of Article a. Open- or closed-top box girders shall be deemed wind-sensitive to vortex-induced motions, and possible galloping instabilities, where the mean 10- minute averaged wind speed, U, satisfies: where: U / nd 5 ( ) U = mean 10-minute averaged wind speed taken as specified in Article (fps), n = fundamental vertical natural frequency of vibration of the box girder (Hz) D = the vertical dimension of the box-girder (ft) The motions of bridges deemed to be windsensitive shall be investigated further. components of the bridge during construction, before the construction of the deck, are the along-wind buffeting of the member due to wind turbulence, vortex-induced motions, and galloping aeroelastic instability. The wind pressures determined using the provisions of Article a yield static displacements that are equivalent to the peak alongwind displacements due to buffeting from turbulence in the wind. Vortex-induced and galloping motions perpendicular to the direction of the wind are not likely to occur for rolled I-beams and plate girders, particularly if they are braced together. However, significant vortex-induced and galloping motions of box girders, with open or closed tops, are possible and should be investigated. (Wassef and Raggett, 2014). The limit on U/nD represents a lower bound critical value for box girders. Table C , shows critical values of U/nD measured for boxgirders of different shapes (Wassef and Raggett, 2014). Table C Critical values of U / nd for box girders of different shapes Box Geometry Critical value of (U / nd) D/2 D 5.0 D D 8.0 D D 4 1 D D 8.5 The vertical natural frequency of vibration, n, for the box-girder may be estimated as follows: For simple spans: n = (π / 2L 2 ) (gei / m) 1/2 For cantilevers: n = (π / 8L 2 ) (gei / m) 1/2 where: L = beam length (ft) 115
132 g = gravitational acceleration: 32.2 (ft/s 2 ) E = Young's Modulus (psf) I = Moment of inertia of the girder about the horizontal axis (ft 4 ) m = weight per unit length (plf) Control of Dynamic Responses Bridge components during construction shall be free of divergence, galloping and catastrophic flutter up to a steady, 10-minute averaged wind speed numerically equal to 0.73 times the design wind speed applicable for the completed bridge at the superstructure elevation. For the purpose of determining the 10-minute averaged wind speed, the design wind speed applicable for the completed bridge at the superstructure elevation shall be taken equal to V(K z ) 1/2, for which V and K z are as defined in Article Site-Specific and Structure- Specific Studies The requirements of Article may be satisfied using: A site specific analysis of historical wind data in non-hurricane areas, and a site specific numerical simulation of potential hurricane wind speeds, may be used to determine design wind criteria Representative wind tunnel tests using approved procedures may be utilized to determine wind loads and to evaluate aeroelastic stability C This check is intended primarily for box-girders as vortex-induced and galloping motions perpendicular to the direction of the wind are not likely to occur for rolled I-beams and plate girders. The specified 10-minute averaged wind speed, numerically equal to 0.73 V(K z ) 1/2, is that with an approximate mean recurrence interval of 1000 years. Since galloping or catastrophic flutter vibrations take some time to develop, a 10-minute averaged wind speed is used to evaluate the stability of the boxgirder. C3.8.4 Wind tunnel testing of bridges and other civil engineering structures is a highly developed technology, which may be used to study the wind response characteristics of a structural model or to verify the results of analysis (Simiu, 1976). Add the following references to AASHTO LRFD Section 3 reference list: ASCE Minimum Design Loads for Building and Other Structures, ASCE American Society of Civil Engineers, Reston, VA. Wassef, W. and Raggett, J., 2014, Updating the AASHTO LRFD Wind Load Provisions, Report for NCHRP Project 20-7, Task 325, Transportation Research Board, National Research Council, Washington, DC. 116
133 4.4 Modifications to Specifications Article Construction Loads Construction loads and conditions that are assumed in the design and that determine section dimensions, camber, and reinforcing and/or prestressing requirements shall be shown as maxima allowed in the contract documents. In addition to erection loads, any required temporary supports or restraints shall be defined as to magnitude or included as part of the design. The acceptable closure forces due to misalignment corrections shall be stated. Due allowance shall be made for all effects of any changes of the statical structural scheme during construction and the application, changes, or removal of the assumed temporary supports of special equipment, taking into account residual force effects, deformations, and any strain-induced effects. The following construction loads shall be considered: DC = weight of the supported structure (kip) DIFF = differential load: applicable only to balanced cantilever construction taken as two percent of the dead load applied to one cantilever (kip) DW = superimposed dead load (kip) or (klf) CLL = distributed construction live load: an allowance for miscellaneous items of plant, machinery, and other equipment, apart from the major specialized erection equipment; taken as ksf of deck area; in cantilever construction, this load is taken as ksf on one cantilever and ksf on the other; for bridges built by incremental launching, this load may be neglected (ksf) CEQ = specialized construction equipment: the load from segment or material delivery trucks, or both, and any special equipment, including a formtraveler launching gantry, beam and winch, truss, or similar major auxiliary structure and the maximum loads applied to the structure by the equipment during the lifting of segments (kip) IE = dynamic load from equipment: determined according to the type of machinery anticipated (kip) C Construction loads comprise all loadings arising from the Designer's anticipated system of temporary supporting works and/or special erection equipment to be used in accordance with the assumed construction sequence and schedule. Construction loads and conditions frequently determine section dimensions and reinforcing and/or prestressing requirements in segmentally constructed bridges. It is important that the Designer show these assumed conditions in the contract documents. These provisions are not meant to be limitations on the Contractor as to the means that may be used for construction. Controls are essential to prevent damage to the structure during construction and to ensure adequacy of the completed structure. It is also essential for the bidders to be able to determine if their equipment and proposed construction methods can be used without modifying the design or the equipment. The contract documents should require the Engineer's approval of any changes in the assumed erection loadings or conditions. Construction loads may be imposed on opposing cantilever ends by use of the formtraveler, diagonal alignment bars, a jacking tower, or external weights. Cooling of one cantilever with water has also been used to provide adjustment of misalignment. Any misalignment of interior cantilevers should be corrected at both ends before constructing either closure. The frame connecting cantilever ends at closure pours should be detailed to prevent differential rotation between cantilevers until the final structural connection is complete. The magnitude of closure forces should not induce stresses in the structure in excess of those tabulated in Table The load DIFF allows for possible variations in cross-section weight due to construction irregularities. For very gradual lifting of segments, where the load involves small dynamic effects, the dynamic load IE may be taken as ten percent of the lifted weight. The following information is based on some past experience and should be considered very preliminary. Formtravelers for cast-in-place segmental construction for a typical two-lane bridge with 15.0 to 16.0 ft segments may be estimated to weigh 160 to 180 kips. CLE = longitudinal construction equipment load: the longitudinal load from the construction equipment (kip) U = segment unbalance: the effect of any outof-balance segments or other unusual conditions as applicable; applies primarily 117 Weight of formtravelers for wider double-celled box sections may range up to approximately 280 kips. Consultation with contractors or subcontractors experienced in free cantilever construction, with respect to the specific bridge geometry under consideration, is recommended to obtain a design value for formtraveler
134 to balanced cantilever construction but may be extended to include any unusual lifting sequence that may not be a primary feature of the generic construction system (kip) WS = horizontal wind load on structures in accordance with the provisions of Section 3. The wind speed associated with Service I load combination in Article 3.8 shall be used for load combinations e and f in Table and the wind speed associated with Service IV load combination in Article 3.8 shall be used for load combinations c and d in Table (ksf) WE = horizontal wind load on equipment; taken as 0.1 ksf of exposed surface (ksf) WUP = wind uplift on cantilever: ksf of deck area for balanced cantilever construction applied to one side only, unless an analysis of site conditions or structure configuration indicates otherwise (ksf) A = static weight of precast segment being handled (kip) AI = dynamic response due to accidental release or application of a precast segment load or other sudden application of an otherwise static load to be added to the dead load; taken as 100 percent of load A (kip) CR = creep effects in accordance with Article SH = shrinkage in accordance with Article T = thermal: the sum of the effects due to uniform temperature variation (TU) and temperature gradients (TG) ( F) Construction Load Combinations at the Service Limit State Flexural tension and principal tension stresses shall be determined at service limit states as specified in Table , for which the following notes apply: 1. Note 1: equipment not working, 2. Note 2: normal erection, and 3. Note 3: moving equipment. weight. C The stresses in Table limit construction load stresses to less than the modulus of rupture of the concrete for structures with internal tendons and Type A joints. The construction load stresses should not, therefore, generate any cracking. Stress limits shall conform to Article The distribution and application of the individual erection loads appropriate to a construction phase shall be selected to produce the most unfavorable effects. The construction load compressive stress in concrete shall not exceed 0.50 f c, where f c is the compressive strength at the time of load application. 118
135 Tensile stresses in concrete due to construction loads shall not exceed the values specified in Table , except for structures with less than 60 percent of their tendon capacity provided by internal tendons, in which case the tensile stresses shall not exceed f c. The requirements of Table shall apply to vertically post-tensioned substructures. The requirements of Table shall not be applied to construction of cast-in-place substructures supporting segmental superstructures. 119
136 Table Load Factors and Tensile Stress Limits for Construction Load Combinations Load Combination LOAD FACTORS Dead Load Live Load Wind Load Other Loads D C DIFF U CE CLL IE CL E WS WUP WE CR SH TU TG W A EH EV ES a γ TG b γ TG c d e f γ TG γ TG γ TG γ TG STRESS LIMITS Earth Loads Flexural Tension Principal Tension Excluding Other Loads Including Other Loads Excluding Other Loads Including Other Loads f c f c f c f c f c f c f c f c f c f c f c f c f c f c f c f c f c f c f c f c f c f c f c f c See Note
137 Cantilever Construction The provisions specified herein shall apply to both precast and cast-in-place cantilever construction. Longitudinal tendons may be anchored in the webs, in the slab, or in blisters built out from the web or slab. A minimum of two longitudinal tendons shall be anchored in each segment. The cantilevered portion of the structure shall be investigated for overturning during erection. The factor of safety against overturning shall not be less than 1.5 under any combination of loads, as specified in Article Minimum wind velocity for erection stability analyses shall be 5569 mph, unless a better estimate of probable wind velocity is obtained by analysis or meteorological records. Continuity tendons shall be anchored at least one segment beyond the point where they are theoretically required for stresses. The segment lengths assumed in the design shall be shown on the plans. Any changes proposed by the Contractor shall be supported by reanalysis of the construction and computation of the final stresses. The formtraveler weight assumed in stress and camber calculations shall be stated on the plans. C Stability during erection may be provided by moment resisting column/superstructure connections, falsework bents, or a launching girder. Loads to be considered include construction equipment, forms, stored material, and wind. The 6955 mph 3-second gust wind speed, when applied with a load factor of 1.0, is equivalent to the 100 mph fastest-mile wind speed applied with a load factor of 0.30 shown in Table in earlier specifications. The 100 mph fastest-mile wind speed applied with a load factor of 0.30 was meant to be equivalent to 55 mph fastest-mile wind speed applied with a load factor of 1.0. Tendon force requires an induction length due to shear lag before it may be assumed to be effective over the whole section. Lengths of segments for free cantilever construction usually range between 10.0 and 18.0 ft. Lengths may vary with the construction method, the span length and the location within the span. Formtravelers for a typical 40.0-ft wide, two-lane bridge with to 16.0-ft segments may be estimated to weigh 160 to 180 kips. Weight of formtravelers for wider two-cell box sections may range up to 280 kips. Segment length is adjusted for deeper and heavier segments to control segment weight. Consultation with contractors experienced in free cantilever construction is recommended to obtain a design value for formtraveler weight for a specific bridge cross-section. 121
138 4.5 Modifications to Specifications Article LOADS General Unless explicitly modified below, all applicable loads shall be applied in accordance with the provisions of Section Wind Load Except as modified below, tthe provisions of Article shall apply. Wind load shall be applied to the entire surface of sound barriers as a uniformly distributed load. Where post-and-panel construction is utilized, the wind load effects on the posts shall be determined by applying the resultant wind loads from the uniformly loaded panels as concentrated loads to the posts at the mid-height elevation of the exposed portion of the sound barrier. For sound barriers, wind velocity at 30.0 ft above low ground or above design water level, V 30, shall be taken as 1.07 times the wind velocity at the sound barrier location determined from Figure For sound barriers, the factors V o and Z o shall be taken from Table C Note that wind load provisions included in Article are applicable to all structures, including sound barriers. This deviates from earlier specifications where special wind provisions for sound barriers were included. The wind velocities in Figure have a 50-yr return period. The 1.07 multiplier is meant to convert the wind speed return period from the 50-yr period that Figure is based on to a 75-yr return period to be consistent with the design life span assumed in these Specifications. The Guide Specifications for Structural Design of Sound Barriers (1989) included four upstream surface conditions; B1, B2, C, and D; based on a limited study by Washington State Department of Transportation (2006). Upstream Surface Conditions B1 and C are approximately equivalent to the Suburban and Country upstream surface conditions shown in Table and described in Article C The description of these categories is repeated below. Table includes two upstream surface conditions, designated as Sparse Suburban and Coastal, that do not exist in Table The values of V 0 and Z 0 for these two upstream surface conditions were selected to yield wind pressures approximately equal to those obtained for Upstream Surface Conditions B2 and D in the Guide Specifications for Structural Design of Sound Barriers (1989). Coastal Flat, unobstructed areas and water surfaces directly exposed to wind. This category includes large bodies of water, smooth mud flats, salt flats, and unbroken ice. Open Country Open terrain with scattered obstructions having heights generally less than 30.0 ft. This category includes flat open country and grasslands. 122
139 Wind loads on structure-mounted sound barriers located in areas that can be characterized as City, Suburban, Sparse Suburban, and Open Country shall be determined using the values for V 0 and Z o specified for Open Country conditions in Table Sparse Suburban Areas with fewer obstructions than described for Suburban conditions but still more than described for Open Country conditions. Suburban Urban and suburban areas, wooded areas, or other terrain with numerous closely spaced obstructions having the size of singlefamily or larger dwellings. Use of this category shall be limited to those areas for which representative terrain prevails in the upwind direction at least 1,500 ft. City Large city centers with at least 50 percent of the buildings having a height in excess of 70.0 ft. Use of this category shall be limited to those areas for which representative terrain prevails in the upwind direction at least onehalf mile. Possible channeling effects of increased velocity pressures due to the bridge or structure s location in the wake of adjacent structures shall be taken into account. Typically, the collapse of structure-mounted sound barriers poses higher danger to life and property than ground-mounted sound barriers. Therefore, in areas with low wind pressure, structure-mounted sound barriers are designed to a higher minimum wind load than ground-mounted sound barriers having the same upwind surface characteristics. This is accomplished by designing structure-mounted sound barriers to Open Country conditions as a minimum. Table Values of V 0 and Z 0 for Various Upstream Surface Conditions Condition Coastal Open Country Sparse Suburban Suburban City V 0 (mph) Z 0 (ft)
140 Figure Isotach.02 quantiles, in mph: Annual extreme-mile 30.0 ft above ground, 50 yr mean recurrence intervals 124
141 5 COMPARISON OF WIND LOADS DETERMINED USING THE PROPOSED SPECIFICATIONS PROVISIONS TO EXISTING PROVISIONS Comparisons between the wind loads determined using the proposed specifications and the wind loads determined using the existing specifications were performed for trusses, girders, and sound walls. The girder wind load was also calculated for various exposure categories and bridge lengths and compared to the wind loads from the existing specifications. The following variables were considered for the wind pressure comparisons: Exposure category o Open country, o Suburban, o Urban, and o Open water. Structure type o Truss members, o Girders, and o Soundwalls. 3-second gust wind speed o 110 mph to 180 mph in 10 mph increments and o 115 mph. For the wind load comparisons, the main variable was the length; the length was varied from 50 feet to 500 feet in 50 foot increments. The girder depth was assumed be one-thirtieth of the span length, the slab was assumed to be 8 thick and the parapet was 3-6 tall. The graphical results of these comparisons are shown in Appendix A. The following conclusions can be drawn based on the comparisons shown in Appendix A: Trusses: o Proposed specifications result in wind pressures that are similar to or lower than the existing specifications for 3-second gust wind speeds up to approximately 140 mph (which encompasses a majority of the United States) for all exposure categories o For higher speeds, the proposed specifications result in wind pressures that are greater than the existing specifications. Girders: o Pressures: Proposed specifications result in wind pressures that are similar to or lower than the existing specifications for 3-second gust wind speeds up to approximately 140 mph (which encompasses a majority of the United States) for all exposure categories For higher speeds, the proposed specifications result in wind pressures that are greater than the existing specifications. o Wind loads: 125
142 For all span lengths considered, assuming an open country exposure, only the wind loads calculated with 3-second gust wind speeds of 170 mph and 180 mph using the proposed specifications exceed the wind loads from the existing specifications. For the urban/suburban exposure categories, the proposed specifications result in higher wind loads for most wind speeds for bridges near the surface (30 feet above the surrounding ground). For the urban/suburban exposure categories, as the height above the surrounding ground increases, the lower 3-second gust wind speeds result in wind loads that are lower than those from the existing specifications. Soundwalls: o The wind pressures calculated for soundwalls using the proposed specifications are typically between calculated using the existing specifications and those calculated using the 1989 AASHTO Guide Specifications for the Design of Sound Barriers for open country and open water exposure conditions. o For urban/suburban exposure conditions, the wind pressures calculated using the proposed specifications are typically higher than those calculated using the existing specifications and the 1989 AASHTO Guide Specifications for the Design of Sound Barriers. 126
143 6 EXAMPLE OF THE APPLICATION OF PROPOSED WIND LOAD PROVISIONS Determine the wind pressures and loading for a bridge superstructure with the following characteristics: 33 feet above the ground surrounded by numerous closely spaced obstructions with size similar to single family homes; this terrain exists for more than 2,600 feet in the upwind direction. Two-span continuous with equal span lengths of 120 feet 52" deep welded plate girders 8" thick reinforced concrete slab 42" tall concrete parapet Bridge is located in the central United States with 3-second gust wind speed of 115 mph (from Proposed Figure ) P z V 2 K Z G C D Where: P z = design wind pressure, ksf V = reference 3-second gust wind speed taken from Proposed Table K z = pressure exposure and elevation coefficient taken from Proposed Table for Strength III limit state and 1.0 for other limit states G = gust effect factor determined using a structure-specific study or, otherwise, as specified in Proposed Table for Strength III limit state and 1.0 for other limit states C D = drag coefficient determined using a structure-specific study or, otherwise, as specified in Proposed Table Second Gust Wind Speed (in mph) for Different Limit States, V V StrIII 115 V StrV 82 V SerI 69 V SerIV 102 mph mph mph mph mph (from Proposed Table and Figure ) (from Proposed Table ) (from Proposed Table ) (from Proposed Table ) 127
144 Proposed Table Pressure Exposure and Elevation Coefficients, K z Structure Height, Z (ft) Wind Exposure Category B Wind Exposure Category C Wind Exposure Category D < or = Proposed Table Gust effect factor, G Gust effect Structure Type factor, G Sound Barriers 0.85 All other structures 1.00 Proposed Table Drag Coefficient, C D Component Windward Leeward I-girder and box-girder bridge superstructures 1.3 N/A Trusses, Columns, and Arches Sharp Edged Members Round Members Bridge Substructure 1.6 N/A Sound Barriers 1.3 N/A From Proposed AASHTO LRFD Article ; determine the ground surface roughness category. Information indicates bridge is located where numerous closely spaced obstructions similar to single family homes exist. --> Use Surface Roughness B. From Proposed AASHTO LRFD Article ; determine the wind exposure category. Information indicates that "Surface Roughness B" exists for more than 2600 feet in the upwind direction from the bridge. --> Use Wind Exposure Category B. 128
145 Calculate unfactored wind pressures for Strength III Limit State using Proposed AASHTO LRFD Eq P z V 2 K Z G C D (Prop. Eq ) Strength III: V StrIII 115 K ZStrIII G 1.0 C D 1.3 (Prop. Table ) (Prop. Table ) (Prop. Table ) P ZStrIII V StrIII K ZStrIII G C D P ZStrIII ksf For Strength V, Service I, and Service IV, calculate wind pressure using equations given in Proposed AASHTO LRFD Table C P ZStrV C D P ZStrV P ZSerI C D P ZSerI ksf ksf P ZSerIV C D P ZSerIV ksf The wind pressure for Strength V, Service I, and Service IV Limit States may also be determined using Proposed Equation and substituting in appropriate values for all variables. Calculate total superstructure depth, D: d = girder depth t s = slab thickness h p = parapet height d 52 t s 8 h p 42 in in in D = total superstructure depth D d t s h p 12 Note: For bridges with cross-slopes, the increase in the superstructure depth due to the cross-slope should be considered when determining the total superstructure depth for wind load calculations. Calculate force due to wind pressure assuming wind is perpendicular to the structure, using wind pressures calculated using equations from Proposed AASHTO LRFD Table C for Strength V, Service I, and Service IV. 8.5 WS StrIII P ZStrIII D WS StrIII 0.26 WS StrV P ZStrV D WS StrV 0.19 WS SerI P ZSerI D WS SerI 0.13 WS SerIV P ZSerIV D WS SerIV 0.29 ft kip ft kip ft kip ft kip ft 129
146 To determine wind load for wind from different directions, use coefficients for girders from Proposed AASHTO LRFD Table Portion of Proposed Table Girders Skew Angle Transverse Longitudinal The table below shows the longitudinal and transverse components for wind skewed 0 o, 15 o, 30 o, 45 o, and 60 o for the Strength III, Strength V, Service I, and Service IV limit states. Skew Angle Perp. Wind Load (k/ft) Strength III Tran. Comp. Long. Comp. Perp. Wind Load (k/ft) Strength V Tran. Comp. Long. Perp. Wind Comp. Load (k/ft) Service I Tran. Comp. Long. Perp. Wind Comp. Load (k/ft) Service IV Tran. Comp. Long. Comp Determine Wind on Live Load (WL): From AASHTO , the wind on live load is kip/ft for wind perpendicular to the structure. WL kip WL 0.1 kip ft ft Determine force due to wind on live load for various skew angles; use wind on live load components from Proposed AASHTO LRFD Table Skew Angle (degree) Transverse Component (klf) Girders Longitudinal Component (klf)
147 Determine wind pressures during construction according to Proposed AASHTO LRFD a: P z ( RV ) 2 K Z G C D Where : P z = design wind pressure, ksf R = wind speed reduction factor during construction; taken as 0.77 for construction periods of 3 years or less, 0.84 for construction periods between 3 and 7 years, and as 0.86 for construction periods between 7 and 9 years. V = reference 3-second gust wind speed taken from Proposed Table K Z = pressure exposure and elevation coefficient taken from Proposed Table for Strength III and taken as 1.0 for other limit states G = gust effect factor determined using a structure-specific study or, otherwise, as specified in Proposed Table for Strength III limit state and 1.0 for other limit states C D = drag coefficient determined using a structure-specific study or, otherwise, as specified in Proposed Table Proposed Table a-1 Superstructure Type (C D,base ) Plate Girders 2.5 Rolled I-beams 2.2 Closed and Open Box Girders 2.0 Round Members 1.0 Proposed Table a-2 Second girder (windward side in multi-girder systems) Base Drag Coefficient Drag Coefficient Girder (C D ) Windward C D,base In two-box-girder systems with a clear distance between boxes 0.5C D,base of no more than twice the girders depths In all other systems 0 All Other Girders 0.5C D,base From Proposed Table a-1: C Dbase
148 From Proposed Table a-2: C D1 C Dbase 2.5 C D2 C D3 C D4 C D5 0C Dbase C Dbase C Dbase C Dbase 1.25 To determine wind loads on superstructure that are transmitted to the bearings and substructure, use the sum of the drag coefficients, C DSub, determined using Proposed Tables a-1 and a-2. C DSub C D1 C D2 C D3 C D4 C D5 C DSub 6.25 Calculate wind pressure during construction for forces transferred to bearings and substructure (P ZSub ): P zc ( RV ) 2 K Z Gust C DC V StrIII 115 R C 0.77 K ZStrIII G 1 C DSub 6.25 mph 2 P ZSub R C V StrIII K ZStrIII G C DSub P ZSub ksf To determine wind load on any girder that will be used in determining the stresses in that girder, the drag coefficient for the exterior girder, C DE, shall be taken as the base drag coefficient, C D,base and the drag coefficient for the interior girder, C DI, shall be taken as one half C D,base. C DE C Dbase C DE 2.5 C DI 0.5 C Dbase C DI 1.25 Calculate wind pressure during construction for exterior girder (P ZE ): V StrIII 115 mph R C 0.77 K ZStrIII G 1 C DE P ZE R C V StrIII K ZStrIII G C DE P ZE ksf 132
149 Calculate wind pressure during construction for interior girder (P ZI ): V StrIII 115 mph R C 0.77 K ZStrIII G 1 C DI P ZI R C V StrIII K ZStrIII G C DI P ZI ksf The wind pressure during construction for Strength V, Service I, and Service IV can be calculated in a similar manner using the wind speed given in AASHTO LRFD Table For Strength V and Service I, the WL term can be ignored as this only applies to vehicular live load. The provisions of AASHTO LRFD Article can be applied to the wind loads calculated according to AASHTO LRFD Article a when the critical wind angle is not perpendicular to the structure. Summary of Loads: WS - Final Condition: Skew Angle Perp. Wind Load (k/ft) Strength III Tran. Comp. WL - Final Condition: Long. Comp. Perp. Wind Load (k/ft) WS - During Construction (wind perpendicular to bridge): Loads used to Design Interior Girders: Loads used to Design Exterior Girders: Loads Transmitted to Substructure: Strength V Tran. Comp. Long. Perp. Wind Comp. Load (k/ft) Service I Tran. Comp. Long. Perp. Wind Comp. Load (k/ft) Service IV Tran. Comp. Long. Comp Skew Angle (degree) Transverse Component (klf) Girders Longitudinal Component (klf) P ZI P ZE P ZSub ksf ksf ksf 133
150 This page is intentionally left blank. 134
151 REFERENCES AASHTO Standard Specifications for Structural Supports for Highway Signs, Luminaires, and Traffic Signals, 6 th ed AASHTO, Washington, D.C. Andrej, S., C. Iztok, and P. Marjan Analysis of a Bridge Structure and Its Wind Barrier Under Wind Loads. IABSE Structural Engineering International, Vol. 15, No. 4, pp ASCE/SEI 7-05: Minimum Design Loads for Buildings and Other Structures ASCE, Reston, VA. ASCE/SEI 7-10: Minimum Design Loads for Buildings and Other Structures ASCE, Reston, VA. ASCE/SEI 49-12: Wind Tunnel Testing for Buildings and Other Structures ASCE, Reston, VA. Ataei, N., and J. Padgett Probabilistic Modeling of Bridge Deck Unseating during Hurricane Events. ASCE Journal of Bridge Engineering, Vol. 18, No. 4, pp Australian/New Zealand Standard: Structural Design Actions, Part 2: Wind Actions, Standards Australia/Standards New Zealand, Sydney, New South Wales, Australia and Wellington, New Zealand. Canadian Highway Bridge Design Code Includes Supplement 1, Supplement 2, and Supplement 3. Canadian Standards Association International, Toronto, ON, Canada. Chen, Z., M. Liu, X. Hua, and T. Mou Flutter, Galloping, and Vortex-Induced Vibrations of H-Section Hangers. ASCE Journal of Bridge Engineering, Vol. 17, No. 3, pp Consolazio, G., Gurley, K., and Harper, Z., 2013, Bridge Girder Drag Coefficients and Wind- Related Bracing Recommendations, Department of Civil and Coastal Engineering, University of Florida, Gainesville, Florida. Corriols, A., and G. Morgenthal Vortex-Induced Vibrations on Cross Sections in Tandem Arrangement. IABSE Structural Engineering International, Vol. 24, No. 1, pp Design Manual for Roads and Bridges British Highways Agency, England. Ellingwood, B., and P. Tekie Wind Load Statistics for Probability-Based Structural Design. ASCE Journal of Structural Engineering, Vol. 125, No. 4, pp EN (Eurocode 1): Actions on Structures - Part 1-4: General Actions - Wind Actions European Committee for Standardization, Brussels, Belgium. Fujino, Y., and D. Siringoringo Vibration Mechanisms and Controls of Long-Span Bridges: A Review. IABSE Structural Engineering International, Vol. 23, No. 3, pp Holmes, J Effective Static Load Distributions in Wind Engineering. Journal of Wind Engineering and Industrial Aerodynamics, Vol. 90, No. 2, pp
152 Kwok, K., X. Qin, C. Fok, and P. Hitchcock Wind-induced pressure around a sectional twin-deck bridge model: Effects of gap-width on the aerodynamic forces and vortex shedding mechanisms. Journal of Wind Engineering and Industrial Aerodynamics, Vol. 110, pp Larsen, A Winds of Change: how box girders can be improved. BRIDGES Magazine. Larsen, A., and S. Poulin Vortex-Shedding Excitation of Box-Girder Bridges and Mitigation. IABSE Structural Engineering International, Vol. 15, No. 4, pp Larsen, A., and A. Wall Shaping of Bridge Girders to Avoid Vortex Shedding Response. Journal of Wind Engineering & Industrial Aerodynamics: 13 th International Conference on Wind Engineering, Vol , pp Lee, S., M. Feng, S. Kwon, and S. Hong Equivalent Modal Damping of Short-Span Bridges Subjected to Strong Motions. ASCE Journal of Bridge Engineering, Vol. 16, No. 2, pp Liu, Z., and G. Kopp A numerical study of geometric effects on vortex shedding from elongated bluff bodies. Journal of Wind Engineering and Industrial Aerodynamics, Vol. 101, pp Myers, G. and Ghalib, A.. Wind Loads on Steel Box Girders during Construction Using Computational Fluid Dynamic Analysis. Journal 7. Atkins Group. Roads and Bridges Division. Narita, N., K. Yokoyama, H. Sato, and Y. Nakagami Aerodynamic characteristics of continuous box girder bridges relevant to their vibrations in wind. Journal of Wind Engineering and Industrial Aerodynamics, Vol. 29, No. 1-3, pp Simiu, E., and Scanlan, R. H Wind Effects on Structures: Fundamentals and Applications to Design, Third Edition, John Wiley & Sons, New York. Structures Manual: Structures Design Guidelines Florida Department of Transportation, Tallahassee, FL. Vickery, P., D. Wadhera, J. Galsworthy, J. Peterka, P. Irwin, and L. Griffis Ultimate Wind Load Design Gust Wind Speeds in the United States for Use in ASCE-7. ASCE Journal of Structural Engineering, Vol. 136, No. 5, pp Vincent, G Investigation of wind forces on highway bridges. Highway Research Board, Special Report 10, Washington, D. C. "What Will the Introduction of Eurocodes Mean for Bridge Engineers?" BRIDGES Magazine November 2009 Xiang, Y., and Z. Ye Methods of Calculating Wind Loads on Long-Span Girder Bridges with Tall Piers and Comparisons of Values. ASCE Journal of Bridge Engineering, Vol. 17, No. 5, pp Yao-Jun, G., Y. Yong-Xin, P. Jia-Bin, and X. Hai-Fan Wind Induced Damages to a Three- Span, Continuous, Concrete Arch Bridge under Construction. IABSE, Structural Engineering International, Vol. 17, No. 2, pp
153 A. COMPARISON OF WIND LOADS DETERMINED USING THE PROPOSED SPECIFICATIONS PROVISIONS TO EXISTING PROVISIONS A.1 Wind Pressure Comparisons for Trusses and Various Exposure Categories The overall results are that the wind pressures for the proposed revisions, for a majority of the country, will be similar to or lower than the factored wind pressures calculated using the current AASHTO LRFD wind provisions for truss bridges (see Figure A-1 through Figure A-36). Figure A-1 Wind Pressure Comparison Open Country V 30 = 100 mph V prop = 110 mph Figure A-2 Wind Pressure Comparison Open Country V 30 = 100 mph V prop = 115 mph Figure A-3 Wind Pressure Comparison Open Country V 30 = 100 mph V prop = 120 mph Figure A-4 Wind Pressure Comparison Open Country V 30 = 100 mph V prop = 130 mph A-1
154 Figure A-5 Wind Pressure Comparison Open Country V 30 = 100 mph V prop = 140 mph Figure A-6 Wind Pressure Comparison Open Country V 30 = 100 mph V prop = 150 mph Figure A-7 Comparison Open Country V 30 = 100 mph V prop = 160 mph Figure A-8 Comparison Open Country V 30 = 100 mph V prop = 170 mph Figure A-9 Wind Pressure Comparison Open Country V 30 = 100 mph V prop = 180 mph Figure A-10 Wind Pressure Comparison Suburban V 30 = 100 mph V prop = 110 mph A-2
155 Figure A-11 Wind Pressure Comparison Suburban V 30 = 100 mph V prop = 115 mph Figure A-12 Wind Pressure Comparison Suburban V 30 = 100 mph V prop = 120 mph Figure A-13 Wind Pressure Comparison Suburban V 30 = 100 mph V prop = 130 mph Figure A-14 Wind Pressure Comparison Suburban V 30 = 100 mph V prop = 140 mph Figure A-15 Wind Pressure Comparison Suburban V 30 = 100 mph V prop = 150 mph Figure A-16 Wind Pressure Comparison Suburban V 30 = 100 mph V prop = 160 mph Figure A-17 Wind Pressure Comparison Suburban V 30 = 100 mph V prop = 170 mph Figure A-18 Wind Pressure Comparison Suburban V 30 = 100 mph V prop = 180 mph A-3
156 Figure A-19 Wind Pressure Comparison Urban V 30 = 100 mph V prop = 110 mph Figure A-20 Wind Pressure Comparison Urban V 30 = 100 mph V prop = 115 mph Figure A-21 Wind Pressure Comparison Urban V 30 = 100 mph V prop = 120 mph Figure A-22 Wind Pressure Comparison Urban V 30 = 100 mph V prop = 130 mph Figure A-23 Wind Pressure Comparison Urban V 30 = 100 mph V prop = 140 mph Figure A-24 Wind Pressure Comparison Urban V 30 = 100 mph V prop = 150 mph Figure A-25 Wind Pressure Comparison Urban V 30 = 100 mph V prop = 160 mph Figure A-26 Wind Pressure Comparison Urban V 30 = 100 mph V prop = 170 mph A-4
157 Figure A-27 Wind Pressure Comparison Urban V 30 = 100 mph V prop = 180 mph Figure A-28 Wind Pressure Open Water V prop = 110 mph Figure A-29 Wind Pressure Open Water V prop = 115 mph Figure A-30 Wind Pressure Open Water V prop = 120 mph Figure A-31 Wind Pressure Open Water V prop = 130 mph Figure A-32 Wind Pressure Open Water V prop = 140 mph Figure A-33 Wind Pressure Open Water V prop = 150 mph Figure A-34 Wind Pressure Open Water V prop = 160 mph A-5
158 Figure A-35 Wind Pressure Open Water V prop = 170 mph Figure A-36 Wind Pressure Open Water V prop = 180 mph A.2 Wind Pressure Comparisons for Girders and Various Exposure Categories The overall results are that the wind pressures for the proposed revisions, for a majority of the country, will be similar to or lower than the factored wind pressures calculated using the current AASHTO LRFD wind provisions for truss bridges (see Figure A-37 through Figure A-72). Figure A-37 Wind Pressure Comparison Open Country V 30 = 100 mph V prop = 110 mph Figure A-38 Wind Pressure Comparison Open Country V 30 = 100 mph V prop = 115 mph Figure A-39 Wind Pressure Comparison Open Country V 30 = 100 mph V prop = 120 mph Figure A-40 Wind Pressure Comparison Open Country V 30 = 100 mph V prop = 130 mph A-6
159 Figure A-41 Wind Pressure Comparison Open Country V 30 = 100 mph V prop = 140 mph Figure A-42 Wind Pressure Comparison Open Country V 30 = 100 mph V prop = 150 mph Figure A-43 Wind Pressure Comparison Open Country V 30 = 100 mph V prop = 160 mph Figure A-44 Wind Pressure Comparison Open Country V 30 = 100 mph V prop = 170 mph Figure A-45 Wind Pressure Comparison Open Country V 30 = 100 mph V prop = 180 mph Figure A-46 Wind Pressure Comparison Suburban V 30 = 100 mph V prop = 110 mph A-7
160 Figure A-47 Wind Pressure Comparison Suburban V 30 = 100 mph V prop = 115 mph Figure A-48 Wind Pressure Comparison Suburban V 30 = 100 mph V prop = 120 mph Figure A-49 Wind Pressure Comparison Suburban V 30 = 100 mph V prop = 130 mph Figure A-50 Wind Pressure Comparison Suburban V 30 = 100 mph V prop = 140 mph Figure A-51 Wind Pressure Comparison Suburban V 30 = 100 mph V prop = 150 mph Figure A-52 Wind Pressure Comparison Suburban V 30 = 100 mph V prop = 160 mph Figure A-53 Wind Pressure Comparison Suburban V 30 = 100 mph V prop = 170 mph Figure A-54 Wind Pressure Comparison Suburban V 30 = 100 mph V prop = 180 mph A-8
161 Figure A-55 Wind Pressure Comparison Urban V 30 = 100 mph V prop = 110 mph Figure A-56 Wind Pressure Comparison Urban V 30 = 100 mph V prop = 115 mph Figure A-57 Wind Pressure Comparison Urban V 30 = 100 mph V prop = 120 mph Figure A-58 Wind Pressure Comparison Urban V 30 = 100 mph V prop = 130 mph Figure A-59 Wind Pressure Comparison Urban V 30 = 100 mph V prop = 140 mph Figure A-60 Wind Pressure Comparison Urban V 30 = 100 mph V prop = 150 mph Figure A-61 Wind Pressure Comparison Urban V 30 = 100 mph V prop = 160 mph Figure A-62 Wind Pressure Comparison Urban V 30 = 100 mph V prop = 170 mph A-9
162 Figure A-63 Wind Pressure Comparison Urban V 30 = 100 mph V prop = 180 mph Figure A-64 Wind Pressure Open Water V prop = 110 mph Figure A-65 Wind Pressure Open Water V prop = 115 mph Figure A-66 Wind Pressure Open Water V prop = 120 mph Figure A-67 Wind Pressure Open Water V prop = 130 mph Figure A-68 Wind Pressure Open Water V prop = 140 mph Figure A-69 Wind Pressure Open Water V prop = 150 mph Figure A-70 Wind Pressure Open Water V prop = 160 mph A-10
163 Figure A-71 Wind Pressure Open Water V prop = 170 mph Figure A-72 Wind Pressure Open Water V prop = 180 mph A.3 Girder Wind Loads for Various Exposure Categories Figure A-73 through Figure A-112 show the calculated wind load applied to a windward girder with span lengths, L, ranging from 50 feet to 500 ft in 50 foot increments for open country, suburban/urban, and open water conditions using the proposed provisions as well as the factored wind load calculated using the current AASHTO LRFD wind provisions (except for the open water condition). For the open country condition, typically only the proposed provisions using wind speeds of 170 and 180 mph result in wind loads greater than the factored wind loads determined using the current AASHTO provisions for all heights above the surrounding terrain. For suburban/urban conditions, the wind loads developed using the proposed provisions exceed the factored wind loads developed using the current AASHTO LRFD wind provisions for most wind speeds for bridges near the surface (30 feet above ground level). In some graphs, particularly for shorter spans, the minimum wind load requirements in the existing provisions control. This resulted in some graphs representing the existing wind loads starting flat at the specified minimum wind load value before they start increasing. Figure A-73 Wind Load Comparison Open Country (L = 50 ft) Figure A-74 Wind Load Comparison Open Country (L = 100 ft) A-11
")
")
")
")
164 Figure A-75 Wind Load Comparison Open Country (L = 150 ft) Figure A-76 Wind Load Comparison Open Country (L = 200 ft) Figure A-77 Wind Load Comparison Open Country (L = 250 ft) Figure A-78 Wind Load Comparison Open Country (L = 300 ft) Figure A-79 Wind Load Comparison Open Country (L = 350 ft) Figure A-80 Wind Load Comparison Open Country (L = 400 ft) Figure A-81 Wind Load Comparison Open Country (L = 450 ft) Figure A-82 Wind Load Comparison Open Country (L = 500 ft) A-12
 Figure A-86 Wind Load Comparison Suburban (L = 200 ft)")
 Figure A-90 Wind Load Comparison Suburban (L = 400 ft)")
165 Figure A-83 Wind Load Comparison Suburban (L = 50 ft) Figure A-84 Wind Load Comparison Suburban (L = 100 ft) Figure A-85 Wind Load Comparison Suburban (L = 150 ft) Figure A-86 Wind Load Comparison Suburban (L = 200 ft) Figure A-87 Wind Load Comparison Suburban (L = 250 ft) Figure A-88 Wind Load Comparison Suburban (L = 300 ft) Figure A-89 Wind Load Comparison Suburban (L = 350 ft) Figure A-90 Wind Load Comparison Suburban (L = 400 ft) A-13
 Figure A-93 Wind Load")
 Figure A-95 Wind Load Comparison Urban (L = 150 ft) Figure")
 Figure A-98 Wind Load Comparison Urban")
166 Figure A-91 Wind Load Comparison Suburban (L = 450 ft) Figure A-92 Wind Load Comparison Suburban (L = 500 ft) Figure A-93 Wind Load Comparison Urban (L = 50 ft) Figure A-94 Wind Load Comparison Urban (L = 100 ft) Figure A-95 Wind Load Comparison Urban (L = 150 ft) Figure A-96 Wind Load Comparison Urban (L = 200 ft) Figure A-97 Wind Load Comparison Urban (L = 250 ft) Figure A-98 Wind Load Comparison Urban (L = 300 ft) A-14
 Figure A-103 Wind Load Comparison Open Water (L = 50 ft) Figure A-104 Wind Load Comparison Open Water (L = 100 ft) Figure A-105 Wind Load Comparison Open Water (L = 150 ft) Figure A-106")
167 Figure A-99 Wind Load Comparison Urban (L = 350 ft) Figure A-100 Wind Load Comparison Urban (L = 400 ft) Figure A-101 Wind Load Comparison Urban (L = 450 ft) Figure A-102 Wind Load Comparison Urban (L = 500 ft) Figure A-103 Wind Load Comparison Open Water (L = 50 ft) Figure A-104 Wind Load Comparison Open Water (L = 100 ft) Figure A-105 Wind Load Comparison Open Water (L = 150 ft) Figure A-106 Wind Load Comparison Open Water (L = 200 ft) A-15
 Figure A-110 Wind Load Comparison Open Water (L = 400 ft)")


168 Figure A-107 Wind Load Comparison Open Water (L = 250 ft) Figure A-108 Wind Load Comparison Open Water (L = 300 ft) Figure A-109 Wind Load Comparison Open Water (L = 350 ft) Figure A-110 Wind Load Comparison Open Water (L = 400 ft) Figure A-111 Wind Load Comparison Open Water (L = 450 ft) Figure A-112 Wind Load Comparison Open Water (L = 500 ft) A.4 Soundwall Wind Pressure Comparisons Factored wind pressures on soundwalls were calculated using the current AASHTO LRFD, the 1989 AASHTO Guide Specifications for the Design of Sound Barriers (Guide Spec), and the proposed wind provisions. The factored pressures are compared in Figure A-113 through Figure A-132 for open country, suburban, urban, and open water conditions. For the open water conditions, the factored pressures calculated using the proposed provisions are very similar to those from the Guide Spec and typically less than those from the current AASHTO LRFD. For open country conditions, the proposed and existing wind provisions are very similar while for suburban/urban conditions, the pressures calculated using the proposed provisions are higher than those calculated with the current provisions. A-16
Evaluating the Design Safety of Highway Structural Supports
 Evaluating the Design Safety of Highway Structural Supports by Fouad H. Fouad and Elizabeth A. Calvert Department of Civil and Environmental Engineering The University of Alabama at Birmingham Birmingham,
Aerodynamic Measures for the Vortex-induced Vibration of π-shape Composite Girder in Cable-stayed Bridge
 Aerodynamic Measures for the Vortex-induced Vibration of π-shape Composite Girder in Cable-stayed Bridge *Feng Wang 1), Jialing Song 2), Tuo Wu 3), and Muxiong Wei 4) 1), 2, 3), 4) Highway School, Chang
SPECTRAL CHARACTERISTICS OF FLUCTUATING WIND LOADS ON A SEPARATE TWIN-BOX DECK WITH CENTRAL SLOT
 The Seventh Asia-Pacific Conference on Wind Engineering, November 8-, 009, Taipei, Taiwan SPECTRAL CHARACTERISTICS OF FLUCTUATING WIND LOADS ON A SEPARATE TWIN-BOX DEC WITH CENTRAL SLOT Le-Dong Zhu, Shui-Bing
Quantification of the Effects of Turbulence in Wind on the Flutter Stability of Suspension Bridges
 Quantification of the Effects of Turbulence in Wind on the Flutter Stability of Suspension Bridges T. Abbas 1 and G. Morgenthal 2 1 PhD candidate, Graduate College 1462, Department of Civil Engineering,
THE TACOMA NARROWS BRIDGE FAILURE Revision A
 By Tom Irvine Email: tomirvine@aol.com December 29, 1999 THE TACOMA NARROWS BRIDGE FAILURE Revision A Introduction The original Tacoma Narrows Bridge was opened to traffic on July 1, 1940. It was located
PHASE 1 WIND STUDIES REPORT
 PHASE 1 WIND STUDIES REPORT ENVIRONMENTAL STUDIES AND PRELIMINARY DESIGN FOR A SUICIDE DETERRENT SYSTEM Contract 2006-B-17 24 MAY 2007 Golden Gate Bridge Highway and Transportation District Introduction
STRUCTURAL DESIGN FIGURE INTERNATIONAL BUILDING CODE 288aR
 FIGURE 1609.1 288aR 288bR 1609.1.4.1 Building with openings. Where glazing is assumed to be an opening in accordance with Section 1609.1.4, the building shall be evaluated to determine if the openings
Geometry Modification For Minimizing The Aeroelastics Effect
 Geometry Modification For Minimizing The Aeroelastics Effect Fariduzzaman a, Subagyo a, Fadilah Hasim a and Matza Gusto Andika a a Aero-Gas dynamics and Vibration Laboratory (LAGG), BPPT, PUSPIPTEK, Serpong
Yasuyuki Hirose 1. Abstract
 Study on Tsunami force for PC box girder Yasuyuki Hirose 1 Abstract In this study, a waterway experiment was performed in order to understand the influence of tsunami forms on tsunami forces acting on
Basis of Structural Design
 Basis of Structural Design Course 10 Actions on structures: Wind loads Other loads Course notes are available for download at http://www.ct.upt.ro/users/aurelstratan/ Wind loading: normative references
The Challenge of Wave Scouring Design for the Confederation Bridge
 13: Coastal and Ocean Engineering ENGI.8751 Undergraduate Student Forum Faculty of Engineering and Applied Science, Memorial University, St. John s, NL, Canada MARCH 2013 Paper Code. (13 - walsh) The Challenge
WIND-INDUCED LOADS OVER DOUBLE CANTILEVER BRIDGES UNDER CONSTRUCTION
 WIND-INDUCED LOADS OVER DOUBLE CANTILEVER BRIDGES UNDER CONSTRUCTION S. Pindado, J. Meseguer, J. M. Perales, A. Sanz-Andres and A. Martinez Key words: Wind loads, bridge construction, yawing moment. Abstract.
SECTION A INTRODUCTION AND OBJECTIVES
 SECTION A INTRODUCTION AND OBJECTIVES The objective of the Phase 1 wind study is to determine the performance of the Golden Gate Bridge in strong winds with a variety of possible suicide deterrent systems
2001 AASHTO Training Manual
 2001 AASHTO Training Manual December 2004 MSC4014 12/04 Table of Contents I. 2001 AASHTO General Overview 1 General Overview 2 II. Wind and Allowable Stress Design 3 Three Second Gust vs. Fastest Mile
Wind Flow Validation Summary
 IBHS Research Center Validation of Wind Capabilities The Insurance Institute for Business & Home Safety (IBHS) Research Center full-scale test facility provides opportunities to simulate natural wind conditions
RESILIENT INFRASTRUCTURE June 1 4, 2016
 RESILIENT INFRASTRUCTURE June 1 4, 2016 CASE STUDIES ON THE IMPACT OF SURROUNDING BUILDINGS ON WIND-INDUCED RESPONSE John Kilpatrick Rowan Williams Davies and Irwin, Guelph, Ontario, Canada ABSTRACT In
UNIVERSITY OF HONG KONG LIBRARY. Hong Kong Collection
 UNIVERSITY OF HONG KONG LIBRARY Hong Kong Collection CODE OF PRACTICE ON WIND EFFECTS HONG KONG-1983 BUILDING DEVELOPMENT DEPARTMENT HONG KONG PRINTED AND PUBLISHED BY THE GOVERNMENT PRINTER, HONG KONG
Critical Gust Pressures on Tall Building Frames-Review of Codal Provisions
 Dr. B.Dean Kumar Dept. of Civil Engineering JNTUH College of Engineering Hyderabad, INDIA bdeankumar@gmail.com Dr. B.L.P Swami Dept. of Civil Engineering Vasavi College of Engineering Hyderabad, INDIA
EXPERIMENTAL STUDY OF WIND PRESSURES ON IRREGULAR- PLAN SHAPE BUILDINGS
 BBAA VI International Colloquium on: Bluff Bodies Aerodynamics & Applications Milano, Italy, July, 2-24 8 EXPERIMENTAL STUDY OF WIND PRESSURES ON IRREGULAR- PLAN SHAPE BUILDINGS J. A. Amin and A. K. Ahuja
THE BRIDGE COLLAPSED IN NOVEMBER 1940 AFTER 4 MONTHS OF ITS OPENING TO TRAFFIC!
 OUTLINE TACOMA NARROWS BRIDGE FLOW REGIME PAST A CYLINDER VORTEX SHEDDING MODES OF VORTEX SHEDDING PARALLEL & OBLIQUE FLOW PAST A SPHERE AND A CUBE SUMMARY TACOMA NARROWS BRIDGE, USA THE BRIDGE COLLAPSED
External Pressure Coefficients on Saw-tooth and Mono-sloped Roofs
 External Pressure Coefficients on Saw-tooth and Mono-sloped Roofs Authors: Bo Cui, Ph.D. Candidate, Clemson University, 109 Lowry Hall, Clemson, SC 9634-0911, boc@clemson.edu David O. Prevatt, Assistant
2013 Wall of Wind (WoW) Contest Informational Workshop
 Contest Informational Workshop") 2013 Wall of Wind (WoW) Contest Informational Workshop Presented By: Ioannis Zisis February 22, 2013 With Contributions By: Dr. Girma Bitsuamlak, Roy Liu, Walter Conklin, Dr. Arindam Chowdhury, Jimmy Erwin,
2013 Wall of Wind (WoW) Contest Informational Workshop Presented By: Ioannis Zisis February 22, 2013 With Contributions By: Dr. Girma Bitsuamlak, Roy Liu, Walter Conklin, Dr. Arindam Chowdhury, Jimmy Erwin,
Wind Pressure Distribution on Rectangular Plan Buildings with Multiple Domes
 Wind Pressure Distribution on Rectangular Plan Buildings with Multiple Domes Astha Verma, Ashok K. Ahuja Abstract Present paper describes detailed information of the experimental study carried out on the
Influence of rounding corners on unsteady flow and heat transfer around a square cylinder
 Influence of rounding corners on unsteady flow and heat transfer around a square cylinder S. K. Singh Deptt. of Mech. Engg., M. B. M. Engg. College / J. N. V. University, Jodhpur, Rajasthan, India Abstract
ASCE D Wind Loading
 ASCE 7-10 3D Wind Loading 1 All information in this document is subject to modification without prior notice. No part or this manual may be reproduced, stored in a database or retrieval system or published,
RELIABILITY ASSESSMENT, STATIC AND DYNAMIC RESPONSE OF TRANSMISSION LINE TOWER: A COMPARATIVE STUDY
 RELIABILITY ASSESSMENT, STATIC AND DYNAMIC RESPONSE OF TRANSMISSION LINE TOWER: A COMPARATIVE STUDY Yusuf Mansur Hashim M. Tech (Structural Engineering) Student, Sharda University, Greater Noida, (India)
CIVL473 Fundamentals of Steel Design
 Loading for most of the structures are obtained from the relevant British Standards, the manufacturers data and similar sources. CIVL473 Fundamentals of Steel Design CHAPTER 2 Loading and Load Combinations
PHASE 1 WIND STUDIES REPORT
 PHASE 1 WIND STUDIES REPORT ENVIRONMENTAL STUDIES AND PRELIMINARY DESIGN FOR A SUICIDE DETERRENT SYSTEM Contract 2006-B-17 24 MAY 2007 Golden Gate Bridge Highway and Transportation District TABLE OF CONTENTS
GEA FOR ADVANCED STRUCTURAL DYNAMIC ANALYSIS
 SMART SOLUTIONS FOR VIBRATION MONITORING GEA FOR ADVANCED STRUCTURAL DYNAMIC ANALYSIS ANALYSIS OF CIVIL STRUCTURES - EXPO MERLATA PEDESTRIAN BRIDGE ABSTRACT Civil structures and in particular bridges and
DISTRIBUTION: Electronic Recipients List TRANSMITTAL LETTER NO. (13-01) MINNESOTA DEPARTMENT OF TRANSPORTATION. MANUAL: Road Design English Manual
 MINNESOTA DEPARTMENT OF TRANSPORTATION. MANUAL: Road Design English Manual") DISTRIBUTION: Electronic Recipients List MINNESOTA DEPARTMENT OF TRANSPORTATION DEVELOPED BY: Design Standards Unit ISSUED BY: Office of Project Management and Technical Support TRANSMITTAL LETTER NO.
DISTRIBUTION: Electronic Recipients List MINNESOTA DEPARTMENT OF TRANSPORTATION DEVELOPED BY: Design Standards Unit ISSUED BY: Office of Project Management and Technical Support TRANSMITTAL LETTER NO.
An Overview of Wind Engineering Where Climate Meets Design
 An Overview of Wind Engineering Where Climate Meets Design Presented by Derek Kelly, M.Eng., P.Eng. Principal/Project Manager www.rwdi.com RWDI Leadership & Consulting Expertise RWDI Consulting Engineers
Effects of directionality on wind load and response predictions
 Effects of directionality on wind load and response predictions Seifu A. Bekele 1), John D. Holmes 2) 1) Global Wind Technology Services, 205B, 434 St Kilda Road, Melbourne, Victoria 3004, Australia, seifu@gwts.com.au
PRESSURE FLUCTUATIONS ACTING ON A TAPERED TALL BUILDING
 The Seventh Asia-Pacific Conference on Wind Engineering, November 8-12, 29, Taipei, Taiwan PRESSURE FLUCTUATIONS ACTING ON A TAPERED TALL BUILDING Young-Moon Kim 1, Ki-Pyo You 1, Jang-Youl You 2 and Chang-Hyun
Lehigh-FIU Hybrid Wind Simulation Developments
 Lehigh-FIU Hybrid Wind Simulation Developments 2018 NSF Lehigh-FIU NHERI Experimental Facilities User Workshop December 3 rd, 2018 Amal Elawady, PhD Assistant Professor Department of Civil and Environmental
Effects of wind incidence angle on wind pressure distribution on square plan tall buildings
 J. Acad. Indus. Res. Vol. 1(12) May 2013 747 RESEARCH ARTICLE ISSN: 2278-5213 Effects of wind incidence angle on wind pressure distribution on square plan tall buildings S.K. Verma 1, A.K. Ahuja 2* and
Wind effects on tall building frames-influence of dynamic parameters
 Indian Journal of Science and Technology Vol. 3 No. 5 (May 21) ISSN: 974-6846 583 Wind effects on tall building frames-influence of dynamic parameters B. Dean Kumar 1 and B.L.P. Swami 2 1 Department of
Numerical Analysis of Wind loads on Tapered Shape Tall Buildings
 IJSTE - International Journal of Science Technology & Engineering Volume 1 Issue 11 May 2015 ISSN (online): 2349-784X Numerical Analysis of Wind loads on Tapered Shape Tall Buildings Ashwin G Hansora Assistant
Journal of Engineering Science and Technology Review 9 (5) (2016) Research Article. CFD Simulations of Flow Around Octagonal Shaped Structures
 (2016) Research Article. CFD Simulations of Flow Around Octagonal Shaped Structures") Jestr Journal of Engineering Science and Technology Review 9 (5) (2016) 72-76 Research Article JOURNAL OF Engineering Science and Technology Review www.jestr.org CFD Simulations of Flow Around Octagonal
Jestr Journal of Engineering Science and Technology Review 9 (5) (2016) 72-76 Research Article JOURNAL OF Engineering Science and Technology Review www.jestr.org CFD Simulations of Flow Around Octagonal
EFFECTS OF SIDEWALL OPENINGS ON THE WIND LOADS ON PIPE-FRAMED GREENHOUSES
 The Seventh Asia-Pacific Conference on Wind Engineering, November 8-12, 29, Taipei, Taiwan EFFECTS OF SIDEWALL OPENINGS ON THE WIND LOADS ON PIPE-FRAMED GREENHOUSES Yasushi Uematsu 1, Koichi Nakahara 2,
Wind-Induced Oscillations Parametric Wind Tunnel Test
 National Aeronautics and Space Administration Wind-Induced Oscillations Parametric Wind Tunnel Test Sam Yunis, Donald Keller, Thomas Ivanco, Jennifer Pinkerton NASA Langley Presented at Spacecraft and
Wind Loading Code for Building Design in Thailand
 Wind Loading Code for Building Design in Thailand Virote Boonyapinyo a, Panitan Lukkunaprasit b Pennung Warnitchai c and Phoonsak Pheinsusom d a Associate Professor, Department of Civil Engineering, Thammasat
Aerodynamic Control of Flexible Structures in the Natural Wind
 Ian Castro 65 th Birthday Workshop, Southampton University, 28-29. 3. 12. Aerodynamic Control of Flexible Structures in the Natural Wind Mike Graham Department of Aeronautics, Imperial College London.
DYNAMIC RESPONSE ANALYSIS OF THE SECOND SAIKAI BRIDGE A CONCRETE FILLED TUBULAR (CFT) ARCH BRIDGE-
 ARCH BRIDGE-") Arch Bridges ARCH 04 P. Roca and E. Oñate (Eds) CIMNE, Barcelona, 2004 DYNAMIC RESPONSE ANALYSIS OF THE SECOND SAIKAI BRIDGE A CONCRETE FILLED TUBULAR (CFT) ARCH BRIDGE- K. Takahashi *, Q. Wu *, M. Yoshimura,
Arch Bridges ARCH 04 P. Roca and E. Oñate (Eds) CIMNE, Barcelona, 2004 DYNAMIC RESPONSE ANALYSIS OF THE SECOND SAIKAI BRIDGE A CONCRETE FILLED TUBULAR (CFT) ARCH BRIDGE- K. Takahashi *, Q. Wu *, M. Yoshimura,
Application of pushover analysis in estimating seismic demands for large-span spatial structure
 28 September 2 October 2009, Universidad Politecnica de Valencia, Spain Alberto DOMINGO and Carlos LAZARO (eds.) Application of pushover analysis in estimating seismic demands for large-span spatial structure
TOWARD MORE ACCURATE PREDICTION OF DAMAGE DUE TO STRONG WINDS
 TOWARD MORE ACCURATE PREDICTION OF DAMAGE DUE TO STRONG WINDS Kichiro KIMURA Kyushu Institute of Technology ABSTRACT: The insured losses of structures due to strong winds have been always dominant and
Along and Across Wind Loads Acting on Tall Buildings
 Along and Across Wind Loads Acting on Tall Buildings Aiswaria G. R* and Dr Jisha S. V** *M Tech student, Structural Engineering, Mar Baselios College of Engineering and Technology, Kerala aiswariagr@gmail.com
Pressure coefficient on flat roofs of rectangular buildings
 Pressure coefficient on flat roofs of rectangular buildings T. Lipecki 1 1 Faculty of Civil Engineering and Architecture, Lublin University of Technology, Poland. t.lipecki@pollub.pl Abstract The paper
Building Planning PART. Chapter 3. Chapter 3. Building Planning. Climatic and Geographic Design Criteria C
 PART 2 Building Planning Chapter 3 Chapter 3 Building Planning TA B L E R 3 0 1. 2 ( 1 ) Climatic and Geographic Design Criteria C hapter 3 includes the bulk of the nonstructural provisions, including
THREE DIMENSIONAL STRUCTURES OF FLOW BEHIND A
 The Seventh Asia-Pacific Conference on Wind Engineering, November 8-12, 29, Taipei, Taiwan THREE DIMENSIONAL STRUCTURES OF FLOW BEHIND A SQUARE PRISM Hiromasa Kawai 1, Yasuo Okuda 2 and Masamiki Ohashi
Wind Directional Effect on a Single Storey House Using Educational Wind Tunnel
 Wind Directional Effect on a Single Storey House Using Educational Wind Tunnel S S Zaini 1, N Rossli 1, T A Majid 1, S N C Deraman 1 and N A Razak 2 1 Disaster Research Nexus, School of Civil Engineering,
Loads on Structures. Dead Load / Fixed Load Live Load / Imposed Load Earthquake Load Wind Load Snow Load
 Loads on Structures Dead Load / Fixed Load Live Load / Imposed Load Earthquake Load Wind Load Snow Load Characteristics of Wind Load Depends upon - velocity and density of the air height above ground level
A comparison of NACA 0012 and NACA 0021 self-noise at low Reynolds number
 A comparison of NACA 12 and NACA 21 self-noise at low Reynolds number A. Laratro, M. Arjomandi, B. Cazzolato, R. Kelso Abstract The self-noise of NACA 12 and NACA 21 airfoils are recorded at a Reynolds
A Study on Roll Damping of Bilge Keels for New Non-Ballast Ship with Rounder Cross Section
 International Ship Stability Workshop 2013 1 A Study on Roll Damping of Bilge Keels for New Non-Ballast Ship with Rounder Cross Section Tatsuya Miyake and Yoshiho Ikeda Department of Marine System Engineering,
Aerodynamic Control of Long Span Bridges
 AEROELASTICITY Royal Aeronautica Society Monday 14 th March 2016. Aerodynamic Control of Long Span Bridges Michael Graham, David Limebeer*, Kevin Gouder and Xiaowei Zhao** Department of Aeronautics, Imperial
Numerical and Experimental Investigation of the Possibility of Forming the Wake Flow of Large Ships by Using the Vortex Generators
 Second International Symposium on Marine Propulsors smp 11, Hamburg, Germany, June 2011 Numerical and Experimental Investigation of the Possibility of Forming the Wake Flow of Large Ships by Using the
6. EXPERIMENTAL METHOD. A primary result of the current research effort is the design of an experimental
 6. EXPERIMENTAL METHOD 6.1 Introduction A primary result of the current research effort is the design of an experimental setup that can simulate the interaction of a windmill with a vortex wake and record
ValidatingWindProfileEquationsduringTropicalStormDebbyin2012
 Global Journal of Researches in Engineering: e Civil And Structural Engineering Volume 4 Issue Version. Year 24 Type: Double Blind Peer Reviewed International Research Journal Publisher: Global Journals
A Wind-Tunnel Study of a Cubic Rooftop AC Unit on a Low Building
 A Wind-Tunnel Study of a Cubic Rooftop AC Unit on a Low Building Noriaki Hosoya, 1 Jack E. Cermak, 2 and Chris Steele 3 Abstract A wind-tunnel test was conducted to determine gust wind loads on simple
INTERFERENCE EFFECTS OF TWO BUILDINGS ON PEAK WIND PRESSURES
 The Seventh Asia-Pacific Conference on Wind Engineering, November 8-, 9, Taipei, Taiwan INTERFERENCE EFFECTS OF TWO BUILDINGS ON PEAK WIND PRESSURES Wonsul Kim, Yukio Tamura and Akihito Yoshida 3 Ph.D.
High fidelity gust simulations around a transonic airfoil
 High fidelity gust simulations around a transonic airfoil AEROGUST Workshop 27 th - 28 th April 2017, University of Liverpool Presented by B. Tartinville (Numeca) Outline of the presentation 1Objectives
STUDY ON TSUNAMI PROPAGATION INTO RIVERS
 ABSTRACT STUDY ON TSUNAMI PROPAGATION INTO RIVERS Min Roh 1, Xuan Tinh Nguyen 2, Hitoshi Tanaka 3 When tsunami wave propagation from the narrow river mouth, water surface is raised and fluctuated by long
Wind tunnel tests of a non-typical stadium roof
 Wind tunnel tests of a non-typical stadium roof G. Bosak 1, A. Flaga 1, R. Kłaput 1 and Ł. Flaga 1 1 Wind Engineering Laboratory, Cracow University of Technology, 31-864 Cracow, Poland. liwpk@windlab.pl
Study by numerical simulations on the breathing effect in a semi-underground highway with beams and a roof above it
 Study by numerical simulations on the breathing effect in a semi-underground highway with beams and a roof above it M Hagiwara East Nippon Expressway Co., Ltd, Japan A Mizuno, T Tsutaki Kogakuin University,
International Journal of Advanced Engineering Technology E-ISSN
 Research Article PERFORMANCE OF ELEVATED WATER TANKS SUJECTED TO WIND FORCES Dr. Hirde Suchita K. 1, ajare Asmita A. 2, Hedaoo Manoj N. 3 Address for Correspondence 1 Professor in Applied Mechanics, Govt.
The Effect of Von Karman Vortex Street on Building Ventilation
 The Effect of Von Karman Vortex Street on Building Ventilation P.Praveen Kumar Abstract This paper deals with the utilisation of the von Karman vortex street principle to maximise air flow into buildings.
COMPUTATIONAL FLOW MODEL OF WESTFALL'S LEADING TAB FLOW CONDITIONER AGM-09-R-08 Rev. B. By Kimbal A. Hall, PE
 COMPUTATIONAL FLOW MODEL OF WESTFALL'S LEADING TAB FLOW CONDITIONER AGM-09-R-08 Rev. B By Kimbal A. Hall, PE Submitted to: WESTFALL MANUFACTURING COMPANY September 2009 ALDEN RESEARCH LABORATORY, INC.
TESTING APPLICATION STANDARD (TAS)
") TESTING APPLICATION STANDARD (TAS) No. 00(A)-9 TEST PROCEDURE FOR WIND AND WIND DRIVEN RAIN RESISTANCE AND/OR INCREASED WINDSPEED RESISTANCE OF SOFFIT VENTILATION STRIP AND CONTINUOUS OR INTERMITTENT VENTILATION
TESTING APPLICATION STANDARD (TAS) No. 00(A)-9 TEST PROCEDURE FOR WIND AND WIND DRIVEN RAIN RESISTANCE AND/OR INCREASED WINDSPEED RESISTANCE OF SOFFIT VENTILATION STRIP AND CONTINUOUS OR INTERMITTENT VENTILATION
OFFICE OF STRUCTURES MANUAL FOR HYDROLOGIC AND HYDRAULIC DESIGN CHAPTER 11 APPENDIX B TIDEROUT 2 USERS MANUAL
 OFFICE OF STRUCTURES MANUAL FOR HYDROLOGIC AND HYDRAULIC DESIGN CHAPTER 11 APPENDIX B TIDEROUT 2 USERS MANUAL APRIL 2011 APRIL 2011 Page 1 Preface TIDEROUT 2, Build 1.22 dated June 29, 2006 is the current
METHODOLOGY. Signalized Intersection Average Control Delay (sec/veh)
") Chapter 5 Traffic Analysis 5.1 SUMMARY US /West 6 th Street assumes a unique role in the Lawrence Douglas County transportation system. This principal arterial street currently conveys commuter traffic
Chapter 5 Traffic Analysis 5.1 SUMMARY US /West 6 th Street assumes a unique role in the Lawrence Douglas County transportation system. This principal arterial street currently conveys commuter traffic
Development of TEU Type Mega Container Carrier
 Development of 8 700 TEU Type Mega Container Carrier SAKAGUCHI Katsunori : P. E. Jp, Manager, Ship & Offshore Basic Design Department, IHI Marine United Inc. TOYODA Masanobu : P. E, Jp, Ship & Offshore
Volume 2, Issue 5, May- 2015, Impact Factor: Structural Analysis of Formula One Racing Car
 Structural Analysis of Formula One Racing Car Triya Nanalal Vadgama 1, Mr. Arpit Patel 2, Dr. Dipali Thakkar 3, Mr. Jignesh Vala 4 Department of Aeronautical Engineering, Sardar Vallabhbhai Patel Institute
Surrounding buildings and wind pressure distribution on a high rise building
 Surrounding buildings and wind pressure distribution on a high rise building Conference or Workshop Item Accepted Version Luo, Z. (2008) Surrounding buildings and wind pressure distribution on a high rise
Wind tunnel acoustic testing of wind generated noise on building facade elements
 See discussions, stats, and author profiles for this publication at: https://www.researchgate.net/publication/307638896 Wind tunnel acoustic testing of wind generated noise on building facade elements
A Study on the Distribution of the Peak Wind Pressure Coefficient for the Wind Resistant Design of Rooftop Hoardings in High-rise Buildings
 International Journal of Engineering Research and Technology. ISSN 0974-3154 Volume 11, Number 10 (2018), pp. 1583-1594 International Research Publication House http://www.irphouse.com A Study on the Distribution
 et al. [25], Noack et al. [26] for circular cylinder flows, Van Oudheusden [27] for square cylinder and Durgesh [28] for a flat plate model. The first two modes appear as phase-shifted versions of each
STRIDE PROJECT Steel Risers in Deepwater Environments Achievements
 STRIDE PROJECT Steel Risers in Deepwater Environments Achievements 1999-21 Neil Willis Principal Engineer 2H Offshore Engineering 6 th Annual Deepwater Technologies and Developments Conference 21 The presentation
Offshore platforms survivability to underwater explosions: part I
 Computational Ballistics III 123 Offshore platforms survivability to underwater explosions: part I A. A. Motta 1, E. A. P. Silva 2, N. F. F. Ebecken 2 & T. A. Netto 2 1 Brazilian Navy Research Institute,
WAVE LOAD ACTING ON HORIZONTAL PLATE DUE TO BORE
 Proceedings of the 6 th International Conference on the Application of Physical Modelling in Coastal and Port Engineering and Science (Coastlab16) Ottawa, Canada, May 10-13, 2016 Copyright : Creative Commons
Lateral Load Analysis Considering Soil-Structure Interaction. ANDREW DAUMUELLER, PE, Ph.D.
 Lateral Load Analysis Considering Soil-Structure Interaction ANDREW DAUMUELLER, PE, Ph.D. Overview Introduction Methods commonly used to account for soil-structure interaction for static loads Depth to
EXPERIMENTAL INVESTIGATION OF WAKE SURVEY OVER A CYLINDER WITH DIFFERENT SURFACE PROFILES
 EXPERIMENTAL INVESTIGATION OF WAKE SURVEY OVER A CYLINDER WITH DIFFERENT SURFACE PROFILES Abdul Ahad Khan 1, Abhishek M. B 2, Tresa Harsha P George 3 1 Under Graduate student, Department of Aeronautical
Computationally Efficient Determination of Long Term Extreme Out-of-Plane Loads for Offshore Turbines
 Computationally Efficient Determination of Long Term Extreme Out-of-Plane Loads for Offshore Turbines Anand Natarajan Senior Scientist Wind Energy Department, Risø DTU Denmark Introduction IEC 61400-1
Post-mortem study on structural failure of a wind farm impacted by super typhoon Usagi
 Downloaded from orbit.dtu.dk on: Nov 26, 2018 Post-mortem study on structural failure of a wind farm impacted by super typhoon Usagi Chen, Xiao; Li, Chuan Feng; Xu, Jian Zhong Publication date: 2015 Document
The Seventh International Colloquium on Bluff Body Aerodynamics and Applications (BBAA7) Shanghai, China; September 2-6, 2012 Wind tunnel measurements
 Shanghai, China; September 2-6, 2012 Wind tunnel measurements") The Seventh International Colloquium on Bluff Body Aerodynamics and Applications (BBAA7) Shanghai, China; September 2-6, 2012 Wind tunnel measurements of aeroelastic guyed mast models a, Tomasz Lipecki
The Seventh International Colloquium on Bluff Body Aerodynamics and Applications (BBAA7) Shanghai, China; September 2-6, 2012 Wind tunnel measurements of aeroelastic guyed mast models a, Tomasz Lipecki
FLOW CONSIDERATIONS IN INDUSTRIAL SILENCER DESIGN
 FLOW CONSIDERATIONS IN INDUSTRIAL SILENCER DESIGN George Feng, Kinetics Noise Control, Inc., 3570 Nashua Drive, Mississauga, Ontario Vadim Akishin, Kinetics Noise Control, Inc., 3570 Nashua Drive, Mississauga,
SOIL-STRUCTURE INTERACTION ANALYSIS OF THE MANHATTAN BRIDGE FOUNDATIONS
 10NCEE Tenth U.S. National Conference on Earthquake Engineering Frontiers of Earthquake Engineering July 21-25, 2014 Anchorage, Alaska SOIL-STRUCTURE INTERACTION ANALYSIS OF THE MANHATTAN BRIDGE FOUNDATIONS
Wind Tunnel Study on the Structural Stability of a Container Crane According to the Boom Shape
 Proceedings of the 4th WSEAS International Conference on Fluid Mechanics, Gold Coast, Queensland, Australia, January 17-19, 2007 64 Wind Tunnel Study on the Structural Stability of a Container Crane According
Low Speed Wind Tunnel Wing Performance
 Low Speed Wind Tunnel Wing Performance ARO 101L Introduction to Aeronautics Section 01 Group 13 20 November 2015 Aerospace Engineering Department California Polytechnic University, Pomona Team Leader:
TRAFFIC STUDY GUIDELINES Clarksville Street Department
 TRAFFIC STUDY GUIDELINES Clarksville Street Department 9/1/2009 Introduction Traffic studies are used to help the city determine potential impacts to the operation of the surrounding roadway network. Two
Adaptive Pushover Analysis of Irregular RC Moment Resisting Frames
 Kalpa Publications in Civil Engineering Volume 1, 2017, Pages 132 136 ICRISET2017. International Conference on Research and Innovations in Science, Engineering &Technology. Selected papers in Civil Engineering
INTERIM ADVICE NOTE 171/12. Risk Based Principal Inspection Intervals
 INTERIM ADVICE NOTE 171/12 Risk Based Principal Inspection Intervals Summary This Interim Advice Note sets out the requirements and guidance for service providers using risk based inspection intervals.
Turn Lane Warrants: Concepts, Standards, Application in Review
 Turn Lane Warrants: Concepts, Standards, Application in Review David J. DeBaie P.E., P.T.O.E. 2004 ITE, District 1 Annual Meeting Burlington, Vermont Introduction Turning lanes at intersections reduce
Sizing of extraction ventilation system and air leakage calculations for SR99 tunnel fire scenarios
 Sizing of extraction ventilation system and air leakage calculations for SR99 tunnel fire scenarios Yunlong (Jason) Liu, PhD, PE HNTB Corporation Sean Cassady, FPE HNTB Corporation Abstract Extraction
Aerodynamic Terms. Angle of attack is the angle between the relative wind and the wing chord line. [Figure 2-2] Leading edge. Upper camber.
![Aerodynamic Terms. Angle of attack is the angle between the relative wind and the wing chord line. [Figure 2-2] Leading edge. Upper camber.](/thumbs/82/86661300.jpg "Aerodynamic Terms. Angle of attack is the angle between the relative wind and the wing chord line. [Figure 2-2] Leading edge. Upper camber.") Chapters 2 and 3 of the Pilot s Handbook of Aeronautical Knowledge (FAA-H-8083-25) apply to powered parachutes and are a prerequisite to reading this book. This chapter will focus on the aerodynamic fundamentals
Chapters 2 and 3 of the Pilot s Handbook of Aeronautical Knowledge (FAA-H-8083-25) apply to powered parachutes and are a prerequisite to reading this book. This chapter will focus on the aerodynamic fundamentals
A New Strategy for Harbor Planning and Design
 A New Strategy for Harbor Planning and Design Xiuying Xing, Ph.D Research Associate Sonny Astani Department of Civil and Environmental Engineering University of Southern California Los Angeles, CA 90089-2531
EXPERIMENTAL ANALYSIS OF THE CONFLUENT BOUNDARY LAYER BETWEEN A FLAP AND A MAIN ELEMENT WITH SAW-TOOTHED TRAILING EDGE
 24 TH INTERNATIONAL CONGRESS OF THE AERONAUTICAL SCIENCES EXPERIMENTAL ANALYSIS OF THE CONFLUENT BOUNDARY LAYER BETWEEN A FLAP AND A MAIN ELEMENT WITH SAW-TOOTHED TRAILING EDGE Lemes, Rodrigo Cristian,
AERODYNAMIC CHARACTERISTICS OF SPIN PHENOMENON FOR DELTA WING
 ICAS 2002 CONGRESS AERODYNAMIC CHARACTERISTICS OF SPIN PHENOMENON FOR DELTA WING Yoshiaki NAKAMURA (nakamura@nuae.nagoya-u.ac.jp) Takafumi YAMADA (yamada@nuae.nagoya-u.ac.jp) Department of Aerospace Engineering,
NIST TECHNICAL NOTE 1655 Toward a Standard on the Wind Tunnel Method
 NIST TECHNICAL NOTE 1655 Toward a Standard on the Wind Tunnel Method Emil Simiu Cover Photo: Boundary Layer Wind Tunnel Laboratory, The University of Florence, Prato, Italy. NIST TECHNICAL NOTE 1655 Toward
EXPERIMENTAL RESEARCH ON COEFFICIENT OF WAVE TRANSMISSION THROUGH IMMERSED VERTICAL BARRIER OF OPEN-TYPE BREAKWATER
 EXPERIMENTAL RESEARCH ON COEFFICIENT OF WAVE TRANSMISSION THROUGH IMMERSED VERTICAL BARRIER OF OPEN-TYPE BREAKWATER Liehong Ju 1, Peng Li,Ji hua Yang 3 Extensive researches have been done for the interaction
STUDIES ON THE OPTIMUM PERFORMANCE OF TAPERED VORTEX FLAPS
 ICAS 2000 CONGRESS STUDIES ON THE OPTIMUM PERFORMANCE OF TAPERED VORTEX FLAPS Kenichi RINOIE Department of Aeronautics and Astronautics, University of Tokyo, Tokyo, 113-8656, JAPAN Keywords: vortex flap,
Numerical Simulation And Aerodynamic Performance Comparison Between Seagull Aerofoil and NACA 4412 Aerofoil under Low-Reynolds 1
 Advances in Natural Science Vol. 3, No. 2, 2010, pp. 244-20 www.cscanada.net ISSN 171-7862 [PRINT] ISSN 171-7870 [ONLINE] www.cscanada.org *The 3rd International Conference of Bionic Engineering* Numerical