The study of MJO impact on wave height and wind speed in Indonesian Seas
|
|
|
- Jonah Pitts
- 5 years ago
- Views:
Transcription

1 IOP Conference Series: Earth and Environmental Science PAPER OPEN ACCESS The study of MJO impact on wave height and wind speed in Indonesian Seas To cite this article: I Hilmi et al 2018 IOP Conf. Ser.: Earth Environ. Sci View the article online for updates and enhancements. Related content - Effect of oceanic current on typhoon-wave modeling in the East China Sea Cui Hong, He Hai-Lun, Liu Xiao-Hui et al. - Ocean wave characteristic in the Sunda Strait using Wave Spectrum Model R Rachmayani, N S Ningsih, S R Adiprabowo et al. - Long term variation of sea level anomaly (September 1992-January 2017) in the Indonesian sea from multi-mission satellite altimetry data Dina A. Sarsito, Kosasih Prijatna, Dudy D. Wijaya et al. This content was downloaded from IP address on 30/10/2018 at 15:02
2 The study of MJO impact on wave height and wind speed in Indonesian Seas I Hilmi 1, N S Ningsih 1, I Sofian 2, F Hanifah 1, A M Rizal 1 1 Research Group of Oceanography, Faculty of Earth Sciences and Technology, Bandung Institute of Technology (ITB), Jl.Ganesha No 10, Bandung 40312, Indonesia 2 Geospatial Information Agency (BIG), Jl. Raya Jakarta-Bogor, Cibinong 16911, Indonesia irfan.hilmiu@gmail.com Absract. Indonesia is passed by an atmospheric phenomenon, called the Madden-Julian Oscillation (MJO), which has an impact on the wave height in the Indonesian Seas. The significant wave height is simulated using WAVEWATCH-III (WW3) numerical model in Indonesian region (90 o E-150 o E, 20 o N-20 o S) forced by surface winds from Cross-Calibrated Multi-Platform (CCMP), Navy Global Environmental Model (NAVGEM), and Navy Operational Global Atmospheric Prediction System (NOGAPS). This simulation is concentrated on MJO phase 3, 4, and 5 which passed through Indonesia and its adjacent waters that occurred in particular time between In this study, the impact of MJO was analyzed during every monsoon season. In addition, wind speed analysis was carried out to further enrich the analysis of the MJO impact. The simulation result shows that MJO exerts the highest impact during phase 5 and DJF, which contributes to the increase of wind speed (WS) and significant wave height (SWH) in Indonesian inner seas by 6 m/s and 30 cm, respectively, and in southern Lesser Sunda Island by 8 m/s and 1.2 m, respectively. MJO can also contribute to decreasing of the WS and SWH, when it occurred during DJF and MAM phase 3, and JJA phase 4. There is no noticabe change of WS and SWH during SON. 1. Introduction Madden-Julian Oscillation (MJO) is a planetary-scale eastward propagation of convection and precipitation zone along the equator with days of oscillation period (Madden and Julian, 1972). The enhanced convection is mainly caused by a formation of low-pressure area associated with high sea surface temperature (SST) that starts around east of Africa. It propagates with average speed of 5 m/s from western Indian Ocean to the eastern Pacific Ocean, bringing with it a number of impacts on some areas such as weather, climate, and ocean condition. Zhang (2005; 2013), in his study, briefly summarized that MJO has influences on precipitation, sea surface temperature, tropical cyclone activities, flood, Indonesian forest fires, and even global and lightning electromagnetic field. Among the various influences brought by MJO, SST is one of the notable impact on the ocean condition along the equator. The change in SST will influence the wind condition and furthermore, will also have an effect on wave condition. Duwaliser et al (2013) on his study using 6 years ( ) of National Oceanic and Atmospheric Administration (NOAA) WAVEWATCH-III hindcast data forced by National Centers for Environmental Prediction (NCEP) wind data, found that MJO, depending on its phase, may cause Content from this work may be used under the terms of the Creative Commons Attribution 3.0 licence. Any further distribution of this work must maintain attribution to the author(s) and the title of the work, journal citation and DOI. Published under licence by Ltd 1
3 both positive and negative anomaly globally. Moreover, As studied by Marshall et al (2015), MJO is able to cause a large fetch (~ km) over a period of weeks. Using WAVEWATCH-III wave hindcast model from Centre for Australian Weather and Climate Research (CAWCR) forced by Climate Forecast System Reanalysis (CFSR) 10-m wind data for period, this study by Marshall et al (2015) also found that MJO have different impact, both positive and negative, on wind speed (WS) globaly ranging from 1-5 m/s, and on significant wave height (SWH) ranging from cm based on its phase and location. In addition, Marshall et al (2015) also found that MJO can cause an increase in wave period, indicating that the wave generation is more influenced by remote wind forcing caused by MJO rather than by swell. This result furthermore shows that the wind anomalies caused by MJO is able to cause both positive and negative anomalies on SWH condition. This purpose of this paper is to further expand the study about MJO effect on wave, especially within the Indonesian Archipelago where MJO propagate through regularly. To meet this goal, the study will focus mainly on region adjacent to Indonesia s waters to investigate how MJO affects the wind and wave condition around Indonesia. Only MJO phase 3, 4, 5 that happened between will be included in this study as they occurred near Indonesia, with phase 3 occurring west of Indonesia, phase 4 adjacent to Java and Lesser Sunda Islands, and phase 5 east Indonesia. MJO occurrence in every season (DJF, 1 st transitional period of monsoon, JJA, and 2 nd transitional period of monsoon) will be considered. The time of occurrence has been chosen to not coincide with the event of El-Niño Southern Oscillation (ENSO) and Indian Ocean Dipole (IOD) to exclude their effect on winds and wave condition around Indonesia. It is also well-known that MJO tends to be more active in the ENSO-neutral event compared to one with ENSO occurrence. This approach will allow us understand how the phase and season play an important role on the effect of MJO on WS and SWH around Indonesian regions, without interference from ENSO and IOD, the most dominant interannual phenomena in the region. The assessment of the MJO impact is done by using output result from wave hindcast model, WAVEWATCH-III (WW3) forced with 25 years ( ) of surface wind reanalysis. The method and data used in wave hindcasting will be described in Section 2. Section 3 will reveal the impact of MJO on WS and SWH around Indonesia region, and study is summarized in Section Materials and Method Wave hindcast in this study is produced using WAVEWATCH-III with structured x 0125 grid resolution over the Indonesian region (90 E-150 E, 20 N-20 S). This domain is large enough to cover South China Sea (SCS), western Pacific Ocean, and eastern Indian Ocean as to see the MJO impact on those areas as well. Cross-Calibrated Multi-Platform (CCMP) is used as the wind forcing with resolution of 0.25 x 0.25 and interval of 6 hours. As for the bathymetry, the ETOPO data with 30-arc second ( ) resolution is being used with unchanged depth over time. The time of each MJO phase in this study is obtained from Australian Bureau of Meteorology website (bom.gov.au) that use RMM method and MJO diagram from Wheeler and Hendon (2014) to determine the MJO phase. The MJO phase is then compared to monthly Ocean Nino Index (ONI) data from NOAA and Indian Ocean Dipole (IOD) index from Japan Agency for Marine-Earth Science and Technology (JAMSTEC) to eliminate MJO occurences that coincide with any ENSO and IOD event. Rather than using composite data of MJO over years, this study will focus on one MJO occurrence on each phase and season that occur in ENSO and IOD neutral year from Although there is a strong El-Niño event on 1997, ONI data from NOAA does not show any El-Niño event on March, thus, March 1997 is considered ENSO-neutral month. Moreover, the choosen MJO should satisfy the following requirements. According to study by Ramdhani (2015), only the strong MJO (index>1) is used in this study, as the strength of MJO is proportionate to the effect it caused on WS and SWH. MJO with index more than 1 indicates that the low-pressured area created is able to cause significant change in the state of wind and wave. On contrary, with index less than 1, MJO will be classified as weak or even considered inactive. Thus, giving insignificant change in the state of wind and wave. In addition to that, the MJO choosen must have a minimum duration of 5 days to be able to induce a significant anomaly (Ramdhani, 2015). With this duration, wind anomalies caused by MJO will have enough time 2
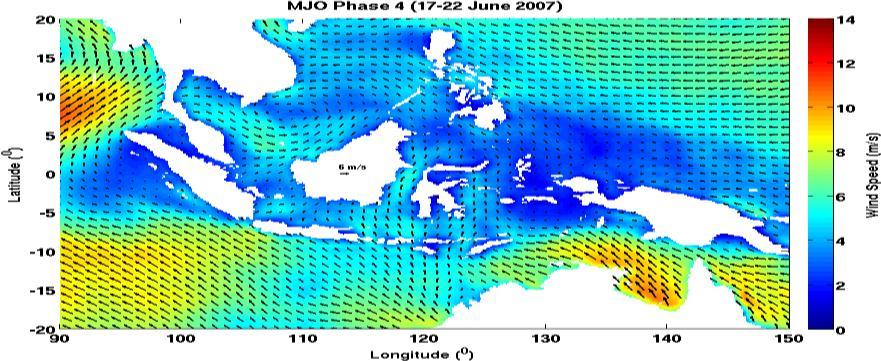
4 to create large fetch and transfering energy to the sea and create SWH higher than the normal state. The selected MJO occurrence will then be separated into 4 seasons; northeast monsoon (DJF), first monsoon s transitional period (MAM), southwest monsoon (JJA), an second monsoon s transitional period (SON) to observe which season gives the biggest effect on MJO s impact. It is hoped that by adhering to these requirements, this study will provide the result of highest anomaly an MJO can cause on WS and SWH around Indonesia region on each season. MJO choosen in this study is shown in the Table 1. Figure 1. Three of buoy locations used in verification Table 1. Chosen time of MJO occurrence for each phase and season Phase 3 Phase 4 Phase 5 No MJO DJF January February February 2009 December 2008 MAM 4 10 March March March 1990 March 1997 JJA June June August 2001 August 1993 SON October October November 2004 October


5 Figure 2. Verification result (from left to right) for Kepulauan Seribu, Pluit, and Karawang with period of H o is buoy significant wave height and H m is model significant wave height. The diagonal line indicates y=x. Result of the hindcast is validated using 1 year ( ) SEAWATCH buoy data from BPPT (Badan Pengkajian dan Penerapan Teknologi ) in 3 locations shown in figure 1; Kepulauan Seribu, Pluit, and Karawang. All of the locations are located in shallow water area in Indonesian inner seas. Generally, the validation result from figure 2 shown that the 3 locations give good verification result with each Correlation Coefficient (CC) being 0.63, 0.52, and 0.74 from left to right, respectively. In every location, almost all of the SWH give an underestimate result, with buoy s SWH being higher than model s SWH, shown by dot on the picture that mainly located below the line. It is possible because the location of the buoy is in the shallow water area which does not exactly coincide with the WAVEWATCH-III native grid, resulting in a slightly lower SWH compared to the buoy.statistical parameter here is also including bias to see the difference between model s SWH and buoy s SWH. All 3 locations give low bias and RMSE result, meanings that there is a small difference between the buoy s SWH and model s SWH, which is to be expected from the result in shallow region. (a) (b) 4
 of AVISO satellite data on a larger area covering all Indonesia region.")
6 (c) Figure 3 Spatial statistical parameter validated using AVISO satellite data consist of (a) correlation; (b) bias; and RMSE (c). Aside from using buoy, verification is also conducted using 7 years ( ) of AVISO satellite data on a larger area covering all Indonesia region. Compared to the verification using buoy data, this verification is able to show the statistical parameter spatially over the Indonesia region. However, despite being able to provide SWH data covering a wide area, AVISO satellite comes with a disadvantage of poor ability to differentiate between land and sea, resulting in unavailability of some SWH data near land and unreliable result in some of the near coastal area. In addition to that, the location of verification is chosen on every point on model that coincides with the point of AVISO to mitigate the difference in grid between model and AVISO. The result of CC, bias, and RMSE of this method is shown in figure 3, with the white area being devoid of SWH data from AVISO. Spatial correlation gives quite satisfactory result in a large part of the model s domain. The two data sets are most consistent around SCS with CC close to 1, followed by Indonesian inner seas, Banda Sea, and Pacific Ocean with the result ranging from 0.7 to 0.8. CC in the Indian Ocean are similar to those in the Pacific Ocean. Generally, the bias result is also quite good with result ranging from 0 m to -0.2 m around SCS, Pacific Ocean, and Indonesian inner seas, and ranging from -0.2 m in 0.2 m in Indian Ocean. The more accurate depiction of deviation between AVISO and WW3 model is provided in the spatial RMSE. In Indonesian inner seas, RMSE result is close to 0 m while in Banda Sea it is ranging from 0 m to 0.2 m, as expected of the result in a closed seas that have quite small SWH. In the oceans, however, the result is larger, 0 m to 0.6 m in Pacific Ocean and 0.3 m to 0.4 m in Indian Ocean. This large result is to be expected and proportional to the high SWH occurs in these areas. 5


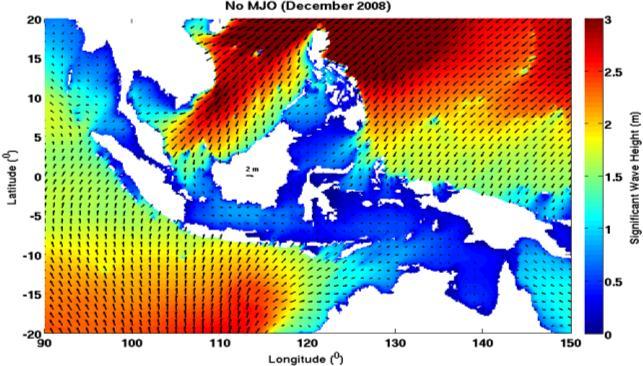


7 MSAT IOP Conf. Series: Earth and Environmental Science 162 (2018) doi: / /162/1/ Figure 4. Averaged wind speed anomalies of each MJO phase in DJF season Figure 5. Averaged significant wave height anomalies of each MJO phase in DJF season 6


 in inner seas, in the southern Java and Lesser Sunda Islands by 8 m/s (from 5 m/s to 13 m/s) and in Banda Sea by")
8 3. Results and Discussion 3.1. DJF and MAM season As shown in figure 4, anomalies on wind speed caused by MJO in DJF season can be seen clearly on each picture. Compared to the condition of no MJO, each phase of the MJO shows quite different change. The wind speed in MJO phase 3 is seen as the lowest among the others, indicating that MJO may cause a decrease in wind speed. It may have occured because on phase 3, MJO is located around western of Indonesia. It means, the low-pressured area in the west of Indonesia will force wind over the Java Sea to blow westward. This direction is the opposite of the northwest monsoon that blows over Indonesia region, resulting in a net decrease in the wind speed over the Java Sea. On the other hand, there is an increase of WS shown in phase 4 and 5, with phase 5 being the phase with the most impact on the WS. On phase 4, the WS seems to increase for about 2 m/s in inner seas and 5 m/s in the southern Java, raising the WS to 8 m/s from 6 m/s and to 10 m/s from 5 m/s respectively. The strongest impact shown by phase 5 increase the WS by 6 m/s (from 6 m/s to 12 m/s) in inner seas, in the southern Java and Lesser Sunda Islands by 8 m/s (from 5 m/s to 13 m/s) and in Banda Sea by 5 m/s (from 5 m/s to 10 m/s ). This increase is to be expected as some of the study on MJO found that the strongest impact of MJO around Indonesia region is observed in phase 5 in DJF season (Duwaliser et al (2013); Marshall et al (2015); Ramdhani (2015)). Strongest impact on phase occurs because in this phase, the MJO-driven low-pressured areais situated in the eastern part of Indonesia, forcing the wind to blow eastward to the low-pressured area. When this happens during the northwest monsoon, MJO-forced wind will blow in the same direction with the northwest monsoon and resulted in the amplification of the wind speed and larger fetch, hence the signifcant increase in wind speed across inner seas and southern Java. Figure 6. Averaged wind speed anomalies of each MJO phase in MAM season. 7

")


9 MSAT IOP Conf. Series: Earth and Environmental Science 162 (2018) doi: / /162/1/ MJO Phase 3 (4-10 MJO Phase 4 (1 6 MJO Phase 5 (7 13 Figure 7. Averaged significant wave height anomalies of each MJO phase in MAM season Figure 8. Averaged wind speed anomalies of each MJO phase in JJA season 8
, while the most significant decrease in this phase occurred in southern Lesser Sunda Islands with a decrease by 0.5 m (from 1.4 m to 0.9 m).")

 in inner seas and increased by 0.5 m in southern Java (from 1.5 m to 2 m).")
10 The impact on SWH is also in accordance with the WS. In figure 5, it can be observed that there is a small decrease of SWH in phase 3 compared to No-MJO state. SWH in Java Sea is decreased by 0.1 m (from 0.5 m to 0.4 m), while the most significant decrease in this phase occurred in southern Lesser Sunda Islands with a decrease by 0.5 m (from 1.4 m to 0.9 m). Oppositely, the raise of SWH is shown by MJO phase 4 and 5 as the result of increase in WS in these phases. Wind is one of the most important wave generator in Indonesian inner seas and southern Java, thus, the stronger the wind blows over those areas, the higher the wave will be generated. Wind amplification on the event of MJO phase 5 transfers much more energy into the sea over the MJO duration, resulted in much higher wave compared to the other phase. In phase 4, the SWH is increased by 30 cm (from 0.5 m to 0.8 m) in inner seas and increased by 0.5 m in southern Java (from 1.5 m to 2 m). The most significant change in SWH can be found in phase 5, which raise the SWH in the inner seas by 1 m (from 0.5 m to 1.5 m), in southern Java by 0.7 m (from 1.5 m to 2.2 m), 0.8 m in Banda Sea (from 0.4 m to 1.2 m), and 1.2 m in southern Lesser Sunda Islands (from 1.4 m to 2.6 m). This large increases is may be due to the strong wind force created by MJO s low-pressured area in eastern part of Indonesia. Figure 9. Averaged significant wave height of each MJO phase in JJA season. MJO event and the WS anomalies in MAM season are shown in figure 6. As the first monsoon s transitional period, MAM has a similar wind direction to the DJF season, but with lower WS. Overall, WS and SWH anomaly on MAM season resembles that of DJF season, albeit much smaller. The most significant increase of WS is found in MJO phase 5, which yields a rise of 2 m/s over the inner seas and southern Java, and 3 m/s on Banda Sea. WS increase also occurred on phase 4 with a smaller magnitude and area coverage, 2 m/s in southern Java and 1 m/s in inner seas. On the phase 3, MJO causes a decrease in the WS over the inner seas and southern Java by 2 m/s (from 5 m/s to 3 m/s). This occurrence of increasing and decreasing WS happened because of the same mechanism as the change that happened in DJF season. Increase on MJO phase 4 and 5 occurred because of amplification in WS by the lowpressured area created by MJO in east of Indonesia, while a decrease in phase 3 happened because of wind collision caused by low-pressured area in west of Indonesia. SWH anomalies shown in figure 7 also follow the pattern of WS anomalies. The highest wave height occurrence is found in phase 5, with 9


, causing the change in wind speed")
11 an increase of 0.3 m in inner seas and 0.5 m in southern Java and Lesser Sunda Islands. MJO phase 4 does not pose significant increase in inner seas (0.2 m) but it causes 0.4 m increase of wave height in southern Java and Lesser Sunda Islands. MJO also causes the SWH to decrease in phase 3, but the change is insignificant (0.2 m over the inner seas and 0.3 m in southern Java). Figure 10. Averaged wind speed anomalies of each MJO phase in SON season JJA and SON Being the opposite of the DJF season, JJA season has a reversed monsoon wind direction that flows from southern hemisphere to northern hemisphere across Indonesia, creating a southeastern monsoon. Low-pressured area created by MJO in this season also tends to be located farther north compared to DJF and MAM season (Wheeler and Hendon, 2004; Gotschalck, 2014), causing the change in wind speed and wave height mainly happened in northern part of Indonesia. This anomaly happens because in JJA season, the sun is located closer to the northern hemisphere (NH), resulting in NH area becomes warmer than the souther hemisphere (SH). In this season, MJO which happened mainly because of the warm SST can be easily formed in the warm NH rather than SH due to lack of sunlight heating in that area. There is no significant change in WS except on MJO phase 5. As can be inferred from figure 8, Compared to the event of no MJO, WS during MJO phase 3 and 4 seems to only decreased in SCS, 3 m/s in phase 3 and 5 m/s in phase 4. The change is hypothesized as the effect of low-pressured area around middle and western of Indonesia caused by MJO. The low-pressured area located in southern of SCS attracts wind over the SCS to blow southward. This direction is the opposite of the southwestern monsoon that blows northward in SCS, resulting in decrease of WS over the SCS. The significant change in WS occurred on MJO phase 5 in SCS and southeastern of Philippine. Low-pressured area created by MJO in this phase is located around east of Phillipines, forcing the wind over the SCS to blows eastward, as well as the wind over western and eastern Phillipine, North Maluku, and Sulu Sea to blow even stronger. It can be seen from figure 6 that the wind over the SCS in phase 5 tends to shift eastward as 10


12 the result of wind forcing by low-pressured area east of Phillipine. This change is followed by an increase of WS in Sulu Sea by 2 m/s, and in both eastern and western Philippine by 5 m/s and 3 m/s respectively. This change in WS is also followed by change in SWH, which significantly happened in MJO phase 5 that cause an increase of 0.5 m in Sulu Sea and 1 m in eastern Philippine. Conversely, the significant decrease in wave height can be found over the SCS in phase 3 and 4, where the SWH is decreased by around 0.5 m and 0.8 m respectively. Figure 11. Averaged significant wave height of each MJO phase in SON season. In contrast to the other seasons, MJO event in SON season does not seem to have any impact on both WS and SWH over Indonesia region. The only notable change on WS occurs on MJO phase 5 in northern SCS and northern Philippine, followed by high SWH in the same area that comes from the north. Even so, it is thought not to be the effect of MJO, but rather the effect of certain natural phenomenon occurring at that time in the higher latitude which propagates southward into the SCS. This lack of change of WS and SWH compared to the other seasons might be due to the weak nature of the WS in SON as the second monsoon transitional period, so the MJO cannot cause significant change despite having enough power to do so. The uncertainty of the wind direction in this phase is also thought to play a role in minimizing the MJO effect, depending on whether it blows upwind or downwind the low-pressured area. 4. Conclusion The low-pressured area created by MJO in phase 3, 4, and 5 that occurred adjacent to Indonesia is able to cause anomalies in WS and eventually influencing the SWH. Increases in WS and SWH occur because the location of MJO s low-pressured area is situated downwind of the monsoon, regardless of its season and phase. It forces the wind to blow to the low-pressured area along with the moonson and creates an amplification of the WS. MJO phase 5 on DJF season is the prime example on how MJO is able to cause significant change of WS in southern Java by 8 m/s, inner seas by 6 m/s, and Banda Sea 11
13 by 5 m/s, and cause significant change in SWH by 0.7 m in southern Java, 1 m in inner seas, 0.8 m in Banda Sea, and 1.2 m in southern Lesser Sunda Islands, respectively. On MAM, MJO phase 5 also has the same effect, but with lower value of increase, which is 2 m/s in wind speed over inner seas and southern Java, 0.3 m of wave height in inner seas, and 0.5m in Southern Lesser Sunda Islands. In lieu of increasing anomalies, MJO can also causes decreasing anomalies as occuring in MJO phase 3 on both season if its location is upwind of the monsoon. In DJF and MAM season, due to the heating in southern hemisphere, MJO tends to occur southward, resulting in WS and SWH anomalies mainly occur in inner seas, southern Java, Banda Sea, and around Lesser Sunda Straits. On the contrary, MJO tends to occur northward in JJA and SON seasons, thus creating WS and SWH anomaly in the northern part of Indonesia such as SCS, Sulu Sea, and western Pacific Ocean. The most significant impact on this season can be seen on MJO phase 5 which increases WS by 2 m/s in Sulu Sea, 3 m/s on western Philippine, and 5 m/s on eastern Philippine, followed by increase in SWH by 0.5 m in Sulu Sea and western Philippine. In SON, MJO does not seem to be creating any WS and SWH anomalies during any of its phases. Acknowledgement This work is supported by a grant of Ministry of Research, Technology, and Higher Education of the Republic of Indonesia (Project: Excellent Research of University). Authors are also thankful to the Agency for the Assessment and Application of Technology for given buoy data for model verification. References [1] A G Marshall et al., Madden julian oscillation impacts on global ocean surface waves, Ocean Modelling (2015), dx.doi.org/10.016/j.ocemod [2] Gottschaclk J, Kousky V, Higgins W and L Heureux M 2014 MJO Summary (National Oceanic and Atmospheric Administration) [3] Madden R A and Julian P R 1972 Description of global-scale circulation cells in the tropics with day period. J. Atmos. Sci [4] Ramdhani A 2015 Pengaruh Siklon Tropis dan Madden-Julian Oscillation (MJO) Terhadap Kejadian Gelombang Tinggi di Perairan Indonesia Bagian Dalam (Doctoral Dissertation. Institut Teknologi Bandung). [5] Waliser D E, Wu B, Yung Y L, Guan B, Webb F and Kedar S 2013 The Impact of the MJO on Global Ocean Surface Wave Heights, Bull. Am. Meteorol. Soc. 94. [6] Wheeler M C and Hendon H H 2004 An All-Season Real-Time Multivariate MJO Index: Development of an Index for Monitoring and Prediction, Monthly Weather Rev 132 (8), [7] Zhang C 2005 Madden-Julian Oscillation Rev. of. Geophysics. 43 (2). [8] Zhang C 2013 Madden-Julian Oscillation: Bridging Weather and Climate Bull. Am Meteorol. Soc. 94,
APPENDIX B NOAA DROUGHT ANALYSIS 29 OCTOBER 2007
 APPENDIX B NOAA DROUGHT ANALYSIS 29 OCTOBER 2007 ENSO Cycle: Recent Evolution, Current Status and Predictions Update prepared by Climate Prediction Center / NCEP October 29, 2007 Outline Overview Recent
ENSO Cycle: Recent Evolution, Current Status and Predictions. Update prepared by Climate Prediction Center / NCEP 4 September 2012
 ENSO Cycle: Recent Evolution, Current Status and Predictions Update prepared by Climate Prediction Center / NCEP 4 September 2012 Outline Overview Recent Evolution and Current Conditions Oceanic Niño Index
 1 2 http://ds.data.jma.go.jp/tcc/tcc/index.html http://ds.data.jma.go.jp/tcc/tcc/index.html Climate in Japan World Climate Extratropics Tropics Oceanograhpic conditions World Climate Page 2 Extratropics
ENSO Cycle: Recent Evolution, Current Status and Predictions. Update prepared by Climate Prediction Center / NCEP 8 March 2010
 ENSO Cycle: Recent Evolution, Current Status and Predictions Update prepared by Climate Prediction Center / NCEP 8 March 2010 Outline Overview Recent Evolution and Current Conditions Oceanic Niño Index
ENSO Wrap-Up. Current state of the Pacific and Indian Ocean
 18-11-2014 ENSO Wrap-Up Current state of the Pacific and Indian Ocean Tropical Pacific Ocean moves closer to El Niño The Pacific Ocean has shown some renewed signs of El Niño development in recent weeks.
Changes of The Hadley Circulation Since 1950
 Changes of The Hadley Circulation Since 1950 Xiao-Wei Quan, Henry F. Diaz, Martin P. Hoerling (NOAA-CIRES CDC, 325 Broadway, Boulder, CO 80305) Abstract The Hadley circulation is changing in response to
Surface chlorophyll bloom in the Southeastern Tropical Indian Ocean during boreal summer-fall as reveal in the MODIS dataset
 Surface chlorophyll bloom in the Southeastern Tropical Indian Ocean during boreal summer-fall as reveal in the MODIS dataset Iskhaq Iskandar 1 and Bruce Monger 2 1 Jurusan Fisika, Fakultas MIPA, Universitas
Influence of El Nino Southern Oscillation and Indian Ocean Dipole in biennial oscillation of Indian summer monsoon
 Influence of El Nino Southern Oscillation and Indian Ocean Dipole in biennial oscillation of Indian summer monsoon 4.1 Introduction The main contributors to the interannual variability of Indian summer
Effect of sea surface temperature on monsoon rainfall in a coastal region of India
 Loughborough University Institutional Repository Effect of sea surface temperature on monsoon rainfall in a coastal region of India This item was submitted to Loughborough University's Institutional Repository
Variability in the tropical oceans - Monitoring and prediction of El Niño and La Niña -
 Variability in the tropical oceans - Monitoring and prediction of El Niño and La Niña - Jun ichi HIROSAWA Climate Prediction Division Japan Meteorological Agency SST anomaly in Nov. 1997 1 ( ) Outline
Biennial Oscillation of Tropical Ocean-Atmosphere System Associated with Indian Summer Monsoon
 Biennial Oscillation of Tropical Ocean-Atmosphere System Associated with Indian Summer Monsoon 2.1 Introduction The Indian summer monsoon displays substantial interannual variability, which can have profound
Hui Wang, Mike Young, and Liming Zhou School of Earth and Atmospheric Sciences Georgia Institute of Technology Atlanta, Georgia
 Water Cycle between Ocean and Land and Its Influence on Climate Variability over the South American-Atlantic Regions as Determined by SeaWinds Scatterometers Rong Fu Hui Wang, Mike Young, and Liming Zhou
Effect of late 1970 s Climate Shift on Interannual Variability of Indian Summer Monsoon Associated with TBO
 Effect of late 97 s Climate Shift on Interannual Variability of Indian Summer Monsoon Associated with TBO 7. Introduction Biennial variability has been identified as one of the major modes of interannual
Lecture 13 El Niño/La Niña Ocean-Atmosphere Interaction. Idealized 3-Cell Model of Wind Patterns on a Rotating Earth. Previous Lecture!
 Lecture 13 El Niño/La Niña Ocean-Atmosphere Interaction Previous Lecture! Global Winds General Circulation of winds at the surface and aloft Polar Jet Stream Subtropical Jet Stream Monsoons 1 2 Radiation
Tropical Pacific Ocean remains on track for El Niño in 2014
 1 of 10 3/06/2014 3:33 PM ENSO Wrap-Up Current state of the Pacific and Indian Ocean Tropical Pacific Ocean remains on track for El Niño in 2014 Issued on Tuesday 3 June 2014 Product Code IDCKGEWWOO The
Analysis of 2012 Indian Ocean Dipole Behavior
 Analysis of 2012 Indian Ocean Dipole Behavior Mo Lan National University of Singapore Supervisor: Tomoki TOZUKA Department of Earth and Planetary Science, University of Tokyo Abstract The Indian Ocean
Global Impacts of El Niño on Agriculture
 Global Impacts of El Niño on Agriculture Presented to the University of Arkansas Division of Agriculture s Food and Agribusiness Series Webinar Series Presented by: Mark Brusberg and Brian Morris USDA
Local vs. Remote SST Forcing in Shaping the Asian-Australian Monsoon Variability
 Local vs. Remote SST Forcing in Shaping the Asian-Australian Monsoon Variability Tim Li IPRC and Dept. of Meteorology, Univ. of Hawaii Acknowledgement. B. Wang, C.-P. Chang, P. Liu, X. Fu, Y. Zhang, Kug
Influence of enhanced convection over Southeast Asia on blocking ridge and associated surface high over Siberia in winter
 5th Session of the East Asia winter Climate Outlook Forum (EASCOF-5), 8-10 November 2017, Tokyo, Japan Influence of enhanced convection over Southeast Asia on blocking ridge and associated surface high
An ocean-atmosphere index for ENSO and its relation to Indian monsoon rainfall
 An ocean-atmosphere index for ENSO and its relation to Indian monsoon rainfall A A MUNOT and G B PANT Indian Institute of Tropical Meteorology, Pune 411 008, India An Ocean-Atmosphere Index (OAI) for ENSO
ENSO Update Eastern Region. Michelle L Heureux Climate Prediction Center / NCEP/ NOAA 29 November 2016
 ENSO Update Eastern Region Michelle L Heureux Climate Prediction Center / NCEP/ NOAA 29 November 2016 Summary La Niña conditions are present.* ENSO Alert System Status: La Niña Advisory Equatorial sea
The role of large-scale modes of climate variability on the Cape Point wave record
 GODAE OceanView 5th COSS-TT meeting, Cape Town 2017 The role of large-scale modes of climate variability on the Cape Point wave record Jennifer Veitch1, Andrew Birkett2, Juliet Hermes1, Christo Rautenbach,
General Introduction to Climate Drivers and BoM Climate Services Products
 General Introduction to Climate Drivers and BoM Climate Services Products Climate Information Services Australian Bureau of Meteorology Yuriy Kuleshov El Niño Southern Oscillation (ENSO) El Niño Southern
Understanding El Nino-Monsoon teleconnections
 Understanding El Nino-Monsoon teleconnections Dr Neena Joseph Mani Earth & Climate Science INSA Anniversary General meeting, Session: Science in IISER Pune 27 th December 2017 Mean State of the equatorial
Interannual variation of northeast monsoon rainfall over southern peninsular India
 Indian Journal of Geo-Marine Science Vol. 40(1), February 2011, pp 98-104 Interannual variation of northeast monsoon rainfall over southern peninsular India * Gibies George 1, Charlotte B. V 2 & Ruchith
Decadal changes in the relationship between Indian and Australian summer monsoons
 Decadal changes in the relationship between Indian and Australian summer monsoons By C. Nagaraju 1, K. Ashok 2, A. Sen Gupta 3 and D.S. Pai 4 1 CES, C-DAC Pune, India 2 CCCR, IITM, Pune, India 3 Universities
OCN 201 Lab Fall 2009 OCN 201. Lab 9 - El Niño
 OCN 201 Lab Fall 2009 OCN 201 Lab 9 - El Niño El Niño is probably one of the most widely publicized oceanic phenomena. If there s one single reason for that it s probably the fact that El Niño s presence
3. Climatic Variability. El Niño and the Southern Oscillation Madden-Julian Oscillation Equatorial waves
 Georges (1998) 3. Climatic Variability El Niño and the Southern Oscillation Madden-Julian Oscillation Equatorial waves ENVIRONMENTAL CONDITIONS FOR TROPICAL CYCLONES TO FORM AND GROW Ocean surface waters
The Air-Sea Interaction. Masanori Konda Kyoto University
 2 The Air-Sea Interaction Masanori Konda Kyoto University 2.1 Feedback between Ocean and Atmosphere Heat and momentum exchange between the ocean and atmosphere Atmospheric circulation Condensation heat
Investigation of Common Mode of Variability in Boreal Summer Intraseasonal Oscillation and Tropospheric Biennial Oscillation
 Investigation of Common Mode of Variability in Boreal Summer Intraseasonal Oscillation and Tropospheric Biennial Oscillation 5. Introduction The Asian summer monsoon is one of the most vigorous and energetic
Intermountain West Climate Summary
 Intermountain West Climate Summary A product of The Western Water Assessment Issued October 2010 Vol. 6, Issue 6 ENSO and Intermountain West Water Supply: A Review of Water Year 2010 and Outlook for Water
Lecture 14. Heat lows and the TCZ
 Lecture 14 Heat lows and the TCZ ITCZ/TCZ and heat lows While the ITCZ/TCZ is associated with a trough at low levels, it must be noted that a low pressure at the surface and cyclonic vorticity at 850 hpa
Your web browser (Safari 7) is out of date. For more security, comfort and the best experience on this site: Update your browser Ignore
 is out of date. For more security, comfort and the best experience on this site: Update your browser Ignore") Your web browser (Safari 7) is out of date. For more security, comfort and the best experience on this site: Update your browser Ignore L A NIÑA El Niño-Southern Oscillation (ENSO) For the complete encyclopedic
Your web browser (Safari 7) is out of date. For more security, comfort and the best experience on this site: Update your browser Ignore L A NIÑA El Niño-Southern Oscillation (ENSO) For the complete encyclopedic
Indian Ocean Dipole - ENSO - monsoon connections and Overcoming coupled model systematic errors
 Indian Ocean Dipole - ENSO - monsoon connections and Overcoming coupled model systematic errors Hilary Spencer, Rowan Sutton and Julia Slingo CGAM, Reading University h.spencer@reading.ac.uk Monsoon -
Tropical Cyclone Climate in the Asia- Pacific Region and the Indian Oceans
 Tropical Cyclone Climate in the Asia- Pacific Region and the Indian Oceans Johnny Chan Guy Carpenter Asia-Pacific Climate Impact Centre School of Energy and Environment City University of Hong Kong Annual
Atmospheric study of the impact of Borneo vortex and Madden-Julian oscillation over Western Indonesian maritime area
 Journal of Physics: Conference Series PAPER OPEN ACCESS Atmospheric study of the impact of Borneo vortex and Madden-Julian oscillation over Western Indonesian maritime area To cite this article: R M Saragih
The General Circulation and El Niño. Dr. Christopher M. Godfrey University of North Carolina at Asheville
 The General Circulation and El Niño Dr. Christopher M. Godfrey University of North Carolina at Asheville Global Circulation Model Air flow broken up into 3 cells Easterlies in the tropics (trade winds)
Monitoring and prediction of El Niño and La Niña
 Monitoring and prediction of El Niño and La Niña Akio NARUI El Niño Monitoring and Prediction Group Climate Prediction Division Japan Meteorological Agency Outline 1. Introduction of El Niño and La Niña
Lecture 24. El Nino Southern Oscillation (ENSO) Part 1
 Part 1") Lecture 24 El Nino Southern Oscillation (ENSO) Part 1 The most dominant phenomenon in the interannual variation of the tropical oceanatmosphere system is the El Nino Southern Oscillation (ENSO) over the
Lecture 24 El Nino Southern Oscillation (ENSO) Part 1 The most dominant phenomenon in the interannual variation of the tropical oceanatmosphere system is the El Nino Southern Oscillation (ENSO) over the
El Niño climate disturbance in northern Madagascar and in the Comoros
 El Niño climate disturbance in northern Madagascar and in the Comoros Rabeharisoa J. M.¹, Ratiarison A.¹, Rakotovao N.¹, Salim Ahmed Ali¹ ² (*) ¹ Laboratoire de Dynamique de l Atmosphère, du Climat et
Climate-Ocean Variability, Fisheries and Coastal Response in Indonesian waters
 Climate-Ocean Variability, Fisheries and Coastal Response in Indonesian waters Jonson Lumban-Gaol 1, Stefano Vignudelli 2 and Takahiro Osawa 3 1 Department of Marine Science and Technology Bogor Agriculture
Overview. Learning Goals. Prior Knowledge. UWHS Climate Science. Grade Level Time Required Part I 30 minutes Part II 2+ hours Part III
 Draft 2/2014 UWHS Climate Science Unit 3: Natural Variability Chapter 5 in Kump et al Nancy Flowers Overview This module provides a hands-on learning experience where students will analyze sea surface
Mechanistic links between the tropical Atlantic and the Indian monsoon in the absence of El Nino Southern Oscillation events
 Mechanistic links between the tropical Atlantic and the Indian monsoon in the absence of El Nino Southern Oscillation events Vijay Pottapinjara 1*, Roxy Mathew Koll2, Raghu Murtugudde3, Girish Kumar M
Appendix E Mangaone Stream at Ratanui Hydrological Gauging Station Influence of IPO on Stream Flow
 NZ Transport Agency Peka Peka to North Ōtaki Expressway Hydraulic Investigations for Expressway Crossing of Mangaone Stream and Floodplain Appendix E Mangaone Stream at Ratanui Hydrological Gauging Station
Data Analysis of the Seasonal Variation of the Java Upwelling System and Its Representation in CMIP5 Models
 Data Analysis of the Seasonal Variation of the Java Upwelling System and Its Representation in CMIP5 Models Iulia-Mădălina Ștreangă University of Edinburgh University of Tokyo Research Internship Program
The Setting - Climatology of the Hawaiian Archipelago. Link to Video of Maui Waves
 The Setting - Climatology of the Hawaiian Archipelago Link to Video of Maui Waves What caused this week s weather? What caused this weekend s weather? Today s Objective: Provide overview and description
Currents. History. Pressure Cells 3/13/17. El Nino Southern Oscillation ENSO. Teleconnections and Oscillations. Neutral Conditions
 Teleconnections and Oscillations Teleconnection climate anomalies being related to each other over a large scale Oscillations: Macroscale movement of atmospheric systems that can influence weather, climate,
- terminology. Further Reading: Chapter 07 of the text book. Outline. - characteristics of ENSO. -impacts
 (1 of 14) Further Reading: Chapter 07 of the text book Outline - terminology - characteristics of ENSO -impacts (2 of 14) Today: Introduction We want to look at another source of variability in the atmosphere
Lecture 13. Global Wind Patterns and the Oceans EOM
 Lecture 13. Global Wind Patterns and the Oceans EOM Global Wind Patterns and the Oceans Drag from wind exerts a force called wind stress on the ocean surface in the direction of the wind. The currents
The Relationship between ENSO/IOD and Rainfall Extremes in Australia
 The Relationship between ENSO/IOD and Rainfall Extremes in Australia Karin Senior Meteorologist, Bureau of Meteorology, Melbourne, Australia E-mail: K.@bom.gov.au Dörte Jakob Manager Hydrometeorological
How fast will be the phase-transition of 15/16 El Nino?
 How fast will be the phase-transition of 15/16 El Nino? YOO-GEUN HAM D E P A R T M E N T O F O C E A N O G R A P H Y, C H O N N A M N A T I O N A L U N I V E R S I T Y 2015/16 El Nino outlook One of strongest
Large-Scale Overview of YOTC Period (ENSO, MJO, CCEWs,.)
") WCRP /WWRP-THORPEX YOTC Implementation Planning Meeting East-West Center, University of Hawaii July 13-15, 2009 Large-Scale Overview of YOTC Period (ENSO, MJO, CCEWs,.) Matthew Wheeler Centre for Australian
WCRP /WWRP-THORPEX YOTC Implementation Planning Meeting East-West Center, University of Hawaii July 13-15, 2009 Large-Scale Overview of YOTC Period (ENSO, MJO, CCEWs,.) Matthew Wheeler Centre for Australian
GEOS 201 Lab 13 Climate of Change InTeGrate Module Case studies 2.2 & 3.1
 Discerning Patterns: Does the North Atlantic oscillate? Climate variability, or short term climate change, can wreak havoc around the world. Dramatic year to year shifts in weather can have unanticipated
Indian Ocean dynamics and interannual variability associated with the tropospheric biennial oscillation (TBO)
") Indian Ocean dynamics and interannual variability associated with the tropospheric biennial oscillation (TBO) Gerald Meehl National Center for Atmospheric Research Julie Arblaster, Johannes Loschnigg,
Indian Ocean dynamics and interannual variability associated with the tropospheric biennial oscillation (TBO) Gerald Meehl National Center for Atmospheric Research Julie Arblaster, Johannes Loschnigg,
Climate briefing. Wellington region, February Alex Pezza and Mike Thompson Environmental Science Department
 Climate briefing Wellington region, February 2016 Alex Pezza and Mike Thompson Environmental Science Department For more information, contact the Greater Wellington Regional Council: Wellington PO Box
Subsurface Ocean Indices for Central-Pacific and Eastern-Pacific Types of ENSO
 Subsurface Ocean Indices for Central-Pacific and Eastern-Pacific Types of ENSO Jin-Yi Yu 1*, Hsun-Ying Kao 1, and Tong Lee 2 1. Department of Earth System Science, University of California, Irvine, Irvine,
Air Pressure and Wind
 Air Pressure and Wind 19.1 Understanding Air Pressure Air Pressure Defined Air pressure is the pressure exerted by the weight of air. Air pressure is exerted in all directions down, up, and sideways. The
NOTES AND CORRESPONDENCE. Variations of the SO Relationship with Summer and Winter Monsoon Rainfall over India:
 3486 JOURNAL OF CLIMATE VOLUME 12 NOTES AND CORRESPONDENCE Variations of the SO Relationship with Summer and Winter Monsoon Rainfall over India: 1872 1993 G. NAGESWARA RAO Department of Meteorology and
ENSO and monsoon induced sea level changes and their impacts along the Indian coastline
 Indian Journal of Marine Sciences Vol. 35(2), June 2006, pp. 87-92 ENSO and monsoon induced sea level changes and their impacts along the Indian coastline O.P.Singh* Monsoon Activity Centre, India Meteorological
5. El Niño Southern Oscillation
 5. El Niño Southern Oscillation Copyright 2006 Emily Shuckburgh, University of Cambridge. Not to be quoted or reproduced without permission. EFS 5/1 Ocean-Atmosphere Coupling Tropical atmosphere/ocean,
Climate variability and changes in the marginal Far-Eastern Seas
 PICES-26 November 2-3, 26 San Diego, USA Climate variability and changes in the marginal Far-Eastern Seas Elena I. Ustinova and Yury D. Sorokin Pacific Fisheries Research Centre (TINRO-Centre) 699 Shevchenko
Lecture 33. Indian Ocean Dipole: part 2
 Lecture 33 Indian Ocean Dipole: part 2 Understanding the processes I continue the discussion of the present understanding of the processes involved in the evolution of the mean monthly SST, and convection
The Local Characteristics of Indonesian Seas and Its Possible Connection with ENSO and IOD: Ten Years Analysis of Satellite Remote Sensing Data
 Earth Science Research; Vol. 2, No. 2; 2013 ISSN 1927-0542 E-ISSN 1927-0550 Published by Canadian Center of Science and Education The Local Characteristics of Indonesian Seas and Its Possible Connection
GEOS 513 ENSO: Past, Present and Future
 GEOS 513 ENSO: Past, Present and Future Jessica Conroy Department of Geosciences Stephen W. Bieda, III Department of Atmospheric Sciences February 22, 2006: Regional Teleconnections (Observations) References:
Chapter. Air Pressure and Wind
 Chapter Air Pressure and Wind 19.1 Understanding Air Pressure Air Pressure Defined Air pressure is the pressure exerted by the weight of air. 19.1 Understanding Air Pressure Air Pressure Defined Air pressure
Propagation of planetary-scale zonal mean wind anomalies and polar oscillations
 Article Atmospheric Science July 2012 Vol.57 No.20: 2606 261 doi: 10.1007/s113-012-5168-1 SPECIAL TOPICS: Propagation of planetary-scale zonal mean wind anomalies and polar oscillations QIAN WeiHong *
Trade winds How do they affect the tropical oceans? 10/9/13. Take away concepts and ideas. El Niño - Southern Oscillation (ENSO)
") El Niño - Southern Oscillation (ENSO) Ocean-atmosphere interactions Take away concepts and ideas What is El Niño, La Niña? Trade wind and Walker circulation. What is the Southern Oscillation? Tropical
El Niño - Southern Oscillation (ENSO) Ocean-atmosphere interactions Take away concepts and ideas What is El Niño, La Niña? Trade wind and Walker circulation. What is the Southern Oscillation? Tropical
Wave Energy Atlas in Vietnam
 Wave Energy Atlas in Vietnam Nguyen Manh Hung, Duong Cong Dien 1 1 Institute of Mechanics, 264 Doi Can Str. Hanoi, Vietnam nmhungim@gmail.com; duongdienim@gmail.com Abstract Vietnam has achieved remarkable
Atmospheric Waves James Cayer, Wesley Rondinelli, Kayla Schuster. Abstract
 Atmospheric Waves James Cayer, Wesley Rondinelli, Kayla Schuster Abstract It is important for meteorologists to have an understanding of the synoptic scale waves that propagate thorough the atmosphere
RECTIFICATION OF THE MADDEN-JULIAN OSCILLATION INTO THE ENSO CYCLE
 RECTIFICATION OF THE MADDEN-JULIAN OSCILLATION INTO THE ENSO CYCLE By William S. Kessler and Richard Kleeman Journal of Climate Vol.13, 1999 SWAP, May 2009, Split, Croatia Maristella Berta What does give
Wind Driven Circulation Indian Ocean and Southern Ocean
 Wind Driven Circulation Indian Ocean and Southern Ocean Lecture 18 MAR 350 Spring 2017 Reading: Knauss Chapter 7 ECCO2 model animation ecco2_sst_flow (2).mp4 Mean surface height and currents DPO Fig. 11.1
Global Structure of Brunt Vaisala Frequency as revealed by COSMIC GPS Radio Occultation
 ICGPSRO, May 14-16, 2013, Taiwan Session 3A; U3-2B-208-05 14:10-14:25, May 14 Global Structure of Brunt Vaisala Frequency as revealed by COSMIC GPS Radio Occultation Noersomadi National Institute of Aeronautics
Section 1. Global Wind Patterns and Weather. What Do You See? Think About It. Investigate. Learning Outcomes
 Chapter 5 Winds, Oceans, Weather, and Climate Section 1 Global Wind Patterns and Weather What Do You See? Learning Outcomes In this section, you will Determine the effects of Earth s rotation and the uneven
Increasing intensity of El Niño in the central equatorial Pacific
 Click Here for Full Article GEOPHYSICAL RESEARCH LETTERS, VOL. 37,, doi:10.1029/2010gl044007, 2010 Increasing intensity of El Niño in the central equatorial Pacific Tong Lee 1 and Michael J. McPhaden 2
SURFLINE TEAHUPOO, TAHITI SURF REPORT
 SURFLINE TEAHUPOO, TAHITI SURF REPORT Historical Analysis of Swell Patterns in April & May, 1997 2009 Prepared for Billabong ~ by Sean Collins, July 2009 Billabong has requested assistance to choose improved
Weather drivers in Victoria
 August 2008 Weather drivers in Victoria Key facts Major weather drivers in Victoria are: El Niño - Southern Oscillation frontal systems cut-off lows blocking highs Southern Annular Mode cloudbands Figure
Review for the second quarter. Mechanisms for cloud formation
 Review for the second quarter Mechanisms for cloud formation 1 Rising air expands and cools; Sinking air compresses and warms. (18) (24) Dry adiabatic lapse rate (10 o C/km): the rate of temperature decrease
What happened to the South Coast El Niño , squid catches? By M J Roberts Sea Fisheries Research Institute, Cape Town
 What happened to the South Coast El Niño 1997-98, squid catches? By M J Roberts Sea Fisheries Research Institute, Cape Town Introduction FROM ALL ACCOUNTS, the intense 1997-98 c impacted most regions in
18.1 Understanding Air Pressure 18.1 Understanding Air Pressure Air Pressure Defined Measuring Air Pressure Air pressure barometer
 18.1 Understanding Air Pressure 18.1 Understanding Air Pressure Air Pressure Defined Air pressure is the pressure exerted by the weight of air. Air pressure is exerted in all directions down, up, and sideways.
THE QUASI-BIENNIAL OSCILLATION S INFLUENCE ON LIGHTNING PRODUCTION AND DEEP CONVECTION IN THE TROPICS. A Thesis CELINA ANNE HERNANDEZ
 THE QUASI-BIENNIAL OSCILLATION S INFLUENCE ON LIGHTNING PRODUCTION AND DEEP CONVECTION IN THE TROPICS A Thesis by CELINA ANNE HERNANDEZ Submitted to the Office of Graduate Studies of Texas A&M University
Weather drivers in South Australia
 August 2008 Key facts Weather drivers in South Australia Major weather drivers in South Australia are: El Niño - Southern Oscillation frontal systems cut-off lows blocking highs Indian Ocean Dipole cloudbands
LONG- TERM CHANGE IN PRE- MONSOON THERMAL INDEX OVER CENTRAL INDIAN REGION AND SOUTH WEST MONSOON VARIABILITY
 LONG- TERM CHANGE IN PRE- MONSOON THERMAL INDEX OVER CENTRAL INDIAN REGION AND SOUTH WEST MONSOON VARIABILITY *S.S. Dugam Indian Institute of Tropical Meteorology, Pune-411008 *Author for Correspondence
EL NIÑO AND ITS IMPACT ON CORAL REEF ECOSYSTEM IN THE EASTERN INDIAN OCEAN
 CHAPTER C H A P T E R 0334 EL NIÑO AND ITS IMPACT ON CORAL REEF ECOSYSTEM IN THE EASTERN INDIAN OCEAN Lix J. K. 1, Sajeev R. 1, Grinson George 2, Santosh K. M. 1 and Phiros Shah 2 1 Cochin University of
9/25/2014. Scales of Atmospheric Motion. Scales of Atmospheric Motion. Chapter 7: Circulation of the Atmosphere
 Chapter 7: Circulation of the Atmosphere The Atmosphere: An Introduction to Meteorology, 12 th Lutgens Tarbuck Lectures by: Heather Gallacher, Cleveland State University Scales of Atmospheric Motion Small-
El Niño Unit (2.5 pts)
") T. James Noyes, El Camino College El Niño Unit (Topic 9B) page 1 Name: Section: El Niño Unit (2.5 pts) El Niño is a warm ocean current that flows along the Equator and towards the west coast of South America
T. James Noyes, El Camino College El Niño Unit (Topic 9B) page 1 Name: Section: El Niño Unit (2.5 pts) El Niño is a warm ocean current that flows along the Equator and towards the west coast of South America
IX. Upper Ocean Circulation
 IX. Upper Ocean Circulation World Ocean Covers 71% of Earth s surface Contains 97% of surface water Arctic Ocean NH: 61% ocean, 39% land Pacific Ocean Atlantic Ocean Southern Ocean Indian Ocean SH: 81%
ATMS 310 Tropical Dynamics
 ATMS 310 Tropical Dynamics Introduction Throughout the semester we have focused on mid-latitude dynamics. This is not to say that the dynamics of other parts of the world, such as the tropics, are any
An Atlas of Oceanic Internal Solitary Waves (February 2004) by Global Ocean Associates Prepared for Office of Naval Research Code 322 PO
 by Global Ocean Associates Prepared for Office of Naval Research Code 322 PO") Overview The is located in the western Pacific Ocean north of the Indonesian Island of Celebes and south of the Sulu Sea and the Philippines (Figure 1). It is a deep-water sea, roughly circular with several
Overview The is located in the western Pacific Ocean north of the Indonesian Island of Celebes and south of the Sulu Sea and the Philippines (Figure 1). It is a deep-water sea, roughly circular with several
REMINDERS: UPCOMING REVIEW SESSIONS: - Thursday, Feb 27, 6:30-8:00pm in HSS 1330
 REMINDERS: Midterm 2: Friday, February 28 - lecture material covering chapters 6, 7, and 15 (since first midterm and through Wed lecture) - same Format as first midterm UPCOMING REVIEW SESSIONS: - Thursday,
Global Learning And Evidence Exchange (GLEE) Climate Smart Agriculture: Africa
 Climate Smart Agriculture: Africa") Tamuka Magadzire, FEWS NET Scientist, Southern Africa Gideon Galu, FEWS NET Scientist, East Africa tmagadzire@fews.net, ggalu@fews.net Global Learning And Evidence Exchange (GLEE) Climate Smart Agriculture:
Tamuka Magadzire, FEWS NET Scientist, Southern Africa Gideon Galu, FEWS NET Scientist, East Africa tmagadzire@fews.net, ggalu@fews.net Global Learning And Evidence Exchange (GLEE) Climate Smart Agriculture:
ESCI 485 Air/sea Interaction Lesson 9 Equatorial Adjustment and El Nino Dr. DeCaria
 ESCI 485 Air/sea Interaction Lesson 9 Equatorial Adjustment and El Nino Dr. DeCaria Reference: El Nino, La Nina, and the Southern Oscillation, Philander THE TWO-LAYER SHALLOW WATER MODEL The ocean can
Ocean color data for Sardinella lemuru management in Bali Strait
 Ocean color data for Sardinella lemuru management in Bali Strait Jonson Lumban Gaol 1, B. P. Pasaribu 1, K. Mahapatra 2, Y. Okada and T. Osawa 3 1 Department of Marine Science and Technology Bogor Agriculture
ENSO: El Niño Southern Oscillation
 ENSO: El Niño Southern Oscillation La Niña the little girl El Niño the little boy, the child LO: explain a complete ENSO cycle and assess the net affects on fish recruitment John K. Horne University of
Physical mechanisms of the Australian summer monsoon: 2. Variability of strength and onset and termination times
 JOURNAL OF GEOPHYSICAL RESEARCH, VOL. 111,, doi:10.1029/2005jd006808, 2006 Physical mechanisms of the Australian summer monsoon: 2. Variability of strength and onset and termination times Kwang-Yul Kim,
Equatorial upwelling. Example of regional winds of small scale
 Example of regional winds of small scale Sea and land breezes Note on Fig. 8.11. Shows the case for southern hemisphere! Coastal upwelling and downwelling. Upwelling is caused by along shore winds, that
Intraseasonal Variability in Sea Level Height in the Bay of Bengal: Remote vs. local wind forcing & Comparison with the NE Pacific Warm Pool
 Intraseasonal Variability in Sea Level Height in the Bay of Bengal: Remote vs. local wind forcing & Comparison with the NE Pacific Warm Pool Shang-Ping Xie 1,3, Xuhua Cheng 2,3, Julian P. McCreary 3 1.
Subsurface Ocean Temperature Indices for Central-Pacific and Eastern-Pacific Types of El Niño and La Niña Events
 Subsurface Ocean Temperature Indices for Central-Pacific and Eastern-Pacific Types of El Niño and La Niña Events Jin-Yi Yu 1*, Hsun-Ying Kao 2, Tong Lee 3, and Seon Tae Kim 1 1 Department of Earth System
Lecture 29. The El-Niño Southern Oscillation (ENSO) La Niña = the girl; corresponds to the opposite climate situation
 La Niña = the girl; corresponds to the opposite climate situation") Lecture 29 The El-Niño Southern Oscillation (ENSO) El Niño is Spanish for Christ child, the name given by fishermen to a warm ocean current off the coast of Peru/Ecuador that in some years occurs near
Lecture 29 The El-Niño Southern Oscillation (ENSO) El Niño is Spanish for Christ child, the name given by fishermen to a warm ocean current off the coast of Peru/Ecuador that in some years occurs near
PROC. ITB Eng. Science Vol. 36 B, No. 2, 2004,
 PROC. ITB Eng. Science Vol. 36 B, No. 2, 2004, 133-139 133 Semiannual Kelvin Waves Propagation along the South Coast of Sumatra-Jawa-Bali and the Lesser Sunda Islands Observed by TOPEX/POSEIDON and ERS-1/2
Geostrophic and Tidal Currents in the South China Sea, Area III: West Philippines
 Southeast Asian Fisheries Development Center Geostrophic and Tidal Currents in the South China Sea, Area III: West Philippines Anond Snidvongs Department od Marine Science, Chulalongkorn University, Bangkok