Oskarshamn site investigation. RAMAC and BIPS logging in boreholes KLX10 and HLX31. Jaana Gustafsson, Christer Gustafsson Malå Geoscience AB/RAYCON
|
|
|
- Mervin Carroll
- 5 years ago
- Views:
Transcription
1 P Oskarshamn site investigation RAMAC and BIPS logging in boreholes KLX10 and HLX31 Jaana Gustafsson, Christer Gustafsson Malå Geoscience AB/RAYCON February 2006 Svensk Kärnbränslehantering AB Swedish Nuclear Fuel and Waste Management Co Box 5864 SE Stockholm Sweden Tel Fax
2 ISSN SKB P Oskarshamn site investigation RAMAC and BIPS logging in boreholes KLX10 and HLX31 Jaana Gustafsson, Christer Gustafsson Malå Geoscience AB/RAYCON February 2006 Keywords: BIPS, RAMAC, Radar, TV. This report concerns a study which was conducted for SKB. The conclusions and viewpoints presented in the report are those of the authors and do not necessarily coincide with those of the client. A pdf version of this document can be downloaded from
3 Abstract This report includes the data gained in geophysical logging operations performed within the site investigation at Oskarshamn. The logging operations presented here includes borehole radar (RAMAC) and BIPS logging in the core drilled borehole KLX10 and in the percussion drilled borehole HLX31. All measurements were conducted by Malå Geoscience AB/ RAYCON during October and November The objective of the radar surveys is to achieve information on the rock mass around the borehole. Borehole radar is used to investigate the nature and the structure of the rock mass enclosing the boreholes. The objective of the BIPS logging is to achieve information of the borehole including occurrence of rock types as well as determination of fracture distribution and orientation. This report describes the equipment used as well as the measurement procedures and data gained. For the BIPS survey, the result is presented as images. Radar data is presented in radargrams and the identified reflectors are listed. The borehole radar data quality from KLX10 and HLX31 was relatively satisfying, but in some parts of lower quality due to more conductive conditions. This conductive environment of course reduces the possibility to distinguish and interpret possible structures in the rock mass which otherwise could give a reflection. However, the borehole radar measurements resulted in 250 identified radar reflectors in KLX10 and of these 34 were orientated (strike/dip). In HLX31 38 radar reflectors were identified. The BIPS images from KLX10 and HLX31 is of very good quality and makes the geological core logging very easy to perform.
4 Sammanfattning Denna rapport omfattar geofysiska loggningar inom platsundersökningsprogrammet för Oskarshamn. Mätningarna som presenteras här omfattar borrhålsradarmätningar (RAMAC), och BIPS-loggningar i kärnborrhålet KLX10, samt i hammarborrhålet HLX31. Alla mätningar är utförda av Malå Geoscience AB/RAYCON under oktober och november Syftet med radarmätningarna är att samla information om bergmassan runt borrhålet. Borrhålsradar används till att karakterisera bergets egenskaper och strukturer i bergmassan närmast borrhålet. Syftet med BIPS-loggningen är att skaffa information om borrhålet inkluderande förekommande bergarter och bestämning av sprickors fördelning och deras orientering. Rapporten beskriver utrustningen som använts liksom mätprocedurer och en beskrivning och tolkning av data som erhållits. För BIPS-loggningen presenteras data som plottar längs med borrhålet. Radardata presenteras i radargram och en lista över tolkade radarreflektorer ges. Borrhålsradardata från KLX10 och HLX31 var relativt tillfredställande, men bitvis med sämre djuppenetration troligen till stor del beroende på en konduktiv miljö. En konduktiv miljö minskar möjligheterna att identifiera strukturer från borrhålsradardata. Dock har 250 radarreflektorer identifierats i KLX10 och av dessa har 34 orienterats (med strykning/ stupning). I HLX31 har 38 radarreflektorer identifierats. BIPS-bilderna från KLX10 och KLX31 är av mycket bra kvalitet vilket gör den geologiska borrkärnekarteringen enkel.
5 Contents 1 Introduction 7 2 Objective and scope 9 3 Equipment Radar measurements RAMAC TV-Camera, BIPS 12 4 Execution General RAMAC Radar BIPS Length measurements Analyses and Interpretatoin Radar BIPS Nonconformities 19 5 Results RAMAC logging BIPS logging 33 References 35 Appendix 1 Radar logging in KLX10, 0 to 993 m, dipole antennas 250, 100 and 20 MHz 37 Appendix 2 Radar logging in HLX30, 0 to 129 m, dipole antennas 250, 100 and 20 MHz 47 Appendix 3 BIPS logging in KLX10, 12 to 992 m 49 Appendix 4 BIPS logging in HLX31, 9 to 128 m 101
6 1 Introduction This report presents the data gained in geophysical logging operations, which is one of the activities performed within the site investigation at Oskarshamn. The logging operations presented here includes borehole radar (RAMAC) and BIPS in the core drilled borehole KLX10 and in the percussion drilled borehole HLX31. The work was carried out in accordance with activity plan AP PS and AP PS In Table 1-1 controlling documents for performing this activity are listed. Both activity plans and method descriptions are SKB s internal controlling documents. This report includes measurements from 100 to 1,000 m in KLX10 and from 0 to 130 in HLX31. The results from the measurements in KLX08, HLX30 and HLX33 are presented earlier in another report /1/. The borehole KLX10 are percussion drilled with a diameter of 197 mm down to m, from there the borehole is core drilled with a diameter of 76 mm. The percussion drilled borehole HLX31 is drilled with diameter of 139 mm. All measurements were conducted by Malå Geoscience AB/RAYCON during October and November The investigation site and location of the boreholes is shown in Figure 1-1. The used investigation techniques comprised: Borehole radar measurements (Malå Geoscience AB:s RAMAC system) with dipole and directional radar antennas. Borehole TV logging with the so-called BIP-system (Borehole Image Processing System), which is a high resolution, side viewing, colour borehole TV system. The delivered raw and processed data have been inserted in the database of SKB (SICADA) and data are traceable by the activity plan number. Table 1 1. Controlling documents for the performance of the activity (SKB internal controlling documents). Activity plan Number Version Borrhålsradar och BIPS i KLX08, HLX30, HLX31 och HLX33 AP PS Borrhålsradar och BIPS i KLX10 AP PS Method descriptions Number Version Metodbeskrivning för TV- loggning med BIPS SKB MD Metodbeskrivning för borrhålsradar SKB MD
7 HSH04!? HSH03 HSH06!?!? HSH01 KSH01 KSH03!.!. HLX37!?!? HLX36!?!? HLX28 HLX29 HLX32 HLX34!?!? Mederhult!.!? HLX20 HLX27!?!. KLX06 HLX26!?!?!.!. KLX05 HLX02!?!?!? HLX03 HLX04 HLX05!? HLX01!. KLX01!?!?!? HLX07 HLX06 HLX35 KLX04 HLX13 HLX14!. KLX08!?!? KLX02!?!?!? HLX31 HLX25 HLX11!.!. HLX30 HLX21 HLX33 HLX23!?!?!?!? HLX10!?!?!? HLX12!? KLX10 HLX24 HLX22!. KLX03 HLX15 KLX09 KLX07 HLX16!?!?!?!? HLX17 HLX19!? Lilla Laxemar HLX18 HLX09!? HLX08!. Hålö!? Äspö KBH03!? HAV13 HAV02!?!? HAV05!?!? HAV03!? HAV07 HAV14 KAV01 HAV04!?!?!?!. HAV08 HAV06 HAV01 Ävrö!?!?!.!?!?!?!? Simpevarp!.!. KSH02 HSH02 HSH05!?!. HAV09 KAV04 HAV10 HAV12!? HAV M Simpevarp and Laxemar subarea!. Cored borehole ± From GSD-Fastighetskartan Lantmäteriet Gävle 2001, Consent M2001/5268 Coordinate system: RT gon V Date: , 21: M!? Percussion borehole Figure 1-1. Map of the location of the boreholes KLX10 and HLX31, in the Laxemar subarea, Oskarshamn.
8 2 Objective and scope The objective of the radar and BIPS surveys is to achieve information on the borehole conditions (borehole wall) as well as on the rock mass around the borehole. Borehole radar is engaged to investigate the nature and the structure of the rock mass enclosing the boreholes, and borehole TV for geological surveying of the borehole including determination of rock types as well as fracture distribution and orientation. This report describes the equipment used for the radar and BIPS as well as the measurement procedures and data gained. For the BIPS survey, the result is presented as images. Radar data is presented in radargrams and the identified reflectors are listed.
. A system description is given in the SKB internal controlling document MD 252.021.")
9 3 Equipment 3.1 Radar measurements RAMAC The RAMAC GPR system owned by SKB is a fully digital GPR system where emphasis has been laid on fast survey speed and easy field operation. The system operates dipole and directional antennas (see Figure 3-1). A system description is given in the SKB internal controlling document MD The borehole radar system consists of a transmitter and a receiver antenna. During operation an electromagnetic pulse, within the frequency range of 20 MHz up to 250 MHz, is emitted into the bedrock. Once a feature, e.g. a water-filled fracture, with sufficiently different electrical properties is encountered, the pulse is reflected back to the receiver and recorded. Receiver (Rx) The directional antenna Glass fiber rod separating the two antennas Transmitter (Tx) Figure 3-1. Example of a borehole radar antenna. 11
.")
10 3.2 TV-Camera, BIPS The BIPS 1500 system used is owned by SKB and described in SKB internal controlling document MD The BIPS method for borehole logging produces a digital scan of the borehole wall. In principle, a standard CCD video camera is installed in the probe in front of a conical mirror (see Figure 3-2). An acrylic window covers the mirror part and the borehole image is reflected through the window and displayed on the cone, from where it is recorded. During the measuring operation, pixel circles are grabbed with a resolution of 360 pixels/circle. The system orientates the BIPS images according to two alternative methods, either using a compass (vertical boreholes) or with a gravity sensor (inclined boreholes). CCD Video Camera Pixel circle Figure 3-2. The BIP-system. Illustration of the conical mirror scanning. 12


11 4 Execution 4.1 General RAMAC Radar The measurements in KLX10 and HLX31 were carried out with dipole radar antennas, with frequencies of 250, 100 and 20 MHz. In KLX10 measurements were also carried out using the directional antenna, with a central frequency of 60 MHz. During logging the dipole antennas (transmitter and receiver) were lowered continuously into the borehole and data were recorded on a field PC along the measured interval. The measurement with the directional antenna is made step wise, with a short pause for each measurement occasion. The antennas (transmitter and receiver, both for dipole and directional) are kept at a fixed separation by glass fiber rods according to Tables 4-1 to 4-3. See also Figures 3-1 and 4-1. All measurements were performed in accordance with the instructions and guidelines from SKB (internal document MD ). All cleaning of the antennas and cable was performed according to the internal document SKB MD before the logging operation. The functionality of the directional antenna was tested before measurements in KLX10. This was performed by measurements in the air, where the receiver antenna and the transmitter antenna are placed apart. While transmitting and measuring the receiver antenna is turned around and by that giving the direction from the receiver antenna to the transmitter antenna. The difference in direction is measured by compass and the result difference achieved from the directional antenna was about 8 degrees. This can be considered to be good due to the disturbed environment, with metallic objects etc at the test site. For more information on system settings used in the investigation of KLX10 and HLX31, see Tables 4-1 and 4-2 below. Figure 4-1. The principle of radar borehole reflection survey and an example of result. 13
12 Table 4-1. Radar logging information from KLX10. Site: Oskarshamn Logging company: RAYCON BH: KLX10 Equipment: SKB RAMAC Type: Directional/Dipole Manufacturer: MALÅ GeoScience Operator: CG Antenna Directional 250 MHz 100 MHz 20 MHz Logging date: Reference: T.O.C. T.O.C. T.O.C. T.O.C. Sampling frequency (MHz): 615 2, Number of samples: Number of stacks: 32 Auto Auto Auto Signal position: Logging from (m): Logging to (m): Trace interval (m): Antenna separation (m): Table 4-2. Radar logging information from HLX31. Site: Oskarshamn Logging company: RAYCON BH: HLX31 Equipment: SKB RAMAC Type: Dipole Manufacturer: MALÅ GeoScience Operator: CG Antenna 250 MHz 100 MHz 20 MHz Logging date: Reference: T.O.C. T.O.C. T.O.C. Sampling frequency (MHz): 2, Number of samples: Number of stacks: Auto Auto Auto Signal position: Logging from (m): Logging to (m): Trace interval (m): Antenna separation (m): BIPS All measurements were performed in accordance with the instructions and guidelines from SKB (internal document MD ). All cleaning of the probe and cable was performed according to the internal document SKB MD before the logging operation. During the measurement, a pixel circle with a resolution of 360 pixels/circle was used and the digital circles were stored at every 1 mm on a MO-disc in the surface unit. The maximum speed during data collection was 1.5 m/minute. 14


13 A gravity sensor was used to measure the orientation of the images in the boreholes KLX10 and HLX31. In order to control the quality of the system, calibration measurements were performed in a test pipe before logging and after logging. Figures 4-3 and 4-4 show the results of the test logging performed before and after the logging of HLX31 and KLX10. The results showed no difference regarding the colours and focus of the images. Results of the test loggings were included in the delivery of the raw data. The BIPS logging information is found in the header for every single borehole presented in Appendices 3 and 4 in this report... Before HLX31 After HLX31 Figure 4-3. Results from logging in the test pipe before and after the logging campaign in October 20 th,
. The length is adjusted to the bottom of casing when visible in the BIPS image.")

14 Before KLX10 After KLX10 Figure 4-4. Results from logging in the test pipe before and after the logging campaign in November 22 th to 24 th, Length measurements During logging the depth recording for the RAMAC systems is taken care of by a measuring wheel mounted on the cable winch. The logging is measured from TOC (Top of Casing). The length is adjusted to the bottom of casing when visible in the BIPS image. During the BIPS logging in core drilled boreholes, where the reference marks in the borehole wall is visible on the image, the position where the depth mark is visible is marked with scotch tape on the logging cable. During BIPS logging the measured length was adjusted to true length according to depth mark visible in the BIPS image. The adjusted true length is marked with red in the image plot together with the non-adjusted measured length. The non-adjusted length is marked with black as seen in Appendices 3 to 4. The tape marks on the logging cable are then used for controlling the RAMAC measurement. The experience we have from earlier measurements with dipole antennas in the core drilled boreholes in Forsmark and Oskarshamn for the radar logging is that the depth divergence is less than 100 cm in the deepest parts of a 1,000 m deep borehole. The depth divergence is taken into account in the resulting tables in Chapter 5. 16

15 4.2 Analyses and Interpretatoin Radar The result from radar measurements is most often presented in the form of a radargram where the position of the probes is shown along one axis and the radar wave propagation and reflection is shown along the other axis. The amplitude of the received signal is shown in the radargram with a grey scale where black colour corresponds to the large positive signals and white colour to large negative signals. Grey colour corresponds to no reflected signals. The presented data in this report is adjusted for the measurement point of the antennas. The measurement point is defined to be the central point between the transmitter and the receiver antenna. The two basic patterns to interpret in borehole measurements are point and plane reflectors. In the reflection mode, borehole radar essentially gives a high-resolution image of the rock mass, showing the geometry of plane structures which may or may not, intersect the borehole (contact between layers, thin marker beds, fractures) or showing the presence of local features around the borehole (cavities, lenses etc). The distance to a reflecting object or plane is determined by measuring the difference in arrival time between the direct and the reflected pulse. The basic assumption is that the speed of propagation is the same everywhere. There are several ways to determine the radar wave propagation velocity. Each of them has its advantages and its disadvantages. For this logging campaign the velocity determination was performed between KLX07A and KLX07B by keeping the transmitter fixed in one borehole while moving the receiver downwards in a nearby borehole. The velocity measurement was performed with the 20 MHz antennas in boreholes KLX07A and KLX07B /2/. The result is plotted in Figure 4-5 and the calculation shows a velocity varying between 110 and 117 m/micro seconds. The lower velocities most probably represent a fracture zone in the depth interval 40 to 60 m. Figure 4-5. Results from velocity measurements /2/. 17
16 The visualization of data is made with ReflexWin, a Windows based processing software for filtering and analysis of borehole radar data. The processing steps are shown in Tables 4-3 and 4-4. It should be observed that the processing steps in Tables 4-3 and 4-4 below refer to Appendices 1 and 2 in this report. The filters applied affect the whole borehole length and are not always suitable in all parts, depending on the geological conditions and conductivity of the borehole fluid. During interpretation further processing can be done, most often in form of bandpass filtering. This filtering can be applied just in parts of the borehole, where needed. For the interpretation of the intersection angle between the borehole axis and the planes visible on the radargrams the RadinterSKB software has been used. The interpreted intersection points and intersection angles of the detected structures are presented in the Tables 5-3 and 5-4 and are also visible on the radargrams in Appendices 1 and 2. Table 4-3. Processing steps for borehole radar data from KLX10. Site: Oskarshamn Logging company: RAYCON BH: KLX10 Equipment: SKB RAMAC Type: Directional/Dipole Manufacturer: MALÅ GeoScience Interpret: JG Antenna Directional 250 MHz 100 MHz 20 MHz Processing: Move start time ( 56 samples) Move start time ( 22.7) Move start time ( 43.6) Move start time ( 99.9) DC shift ( ) DC shift ( ) DC shift ( ) DC shift (1,800 2,000) Time gain (start 99 lin 150 exp 1) Gain (start 20 lin 2.1 exp 0.6) Gain (start 60 lin 2.5 exp 0.6) Gain (start 122 lin 6.2 exp 0.17) (FIR) Table 4-4. Processing steps for borehole radar data from HLX31. Site: Oskarshamn Logging company: RAYCON BH: HLX31 Equipment: SKB RAMAC Type: Dipole Manufacturer: MALÅ GeoScience Interpret: JG Antenna 250 MHz 100 MHz 20 MHz Processing: Move start time ( 24) Move start time ( 45.6) Move start time ( 79.4) DC removal ( ) DC removal ( ) DC removal (1,800 2,000) Gain (start 32 linear 2 exp. 1.1) Gain (start 48 linear 2.5 exp 0.6) Gain (start 146 linear 3.6, exp 0.2) 18
17 4.2.2 BIPS The visualization of data is made with BDPP, a Windows based processing software for filtering, presentation and analysis of BIPS data. As no fracture mapping of the BIPS image is performed, the raw data was delivered on a CD-ROM together with printable pictures in *.pdf format before the field crew left the investigation site. The printed results were delivered with measured length, together with adjusted length according to the length marks visible in the BIPS image. For printing of the BIPS images the printing software BIPP from RaaX was used. 4.3 Nonconformities No nonconformities occurred during the two logging campaigns in October and November. 19
18 5 Results The results from the BIPS measurements for KLX10 and HLX31 were delivered as raw data (*.bip-files) on CD-ROM disks and MO-disks to SKB together with printable BIPS pictures in *.pdf format before the field crew left the investigation site. The information of the measurements was registered in SICADA, and the digital data and VHS tapes stored by SKB. The RAMAC radar data was delivered as raw data (file format *.rd3 or *.rd5) for KLX10 and HLX31 with corresponding information files (file format *.rad) whereas the data processing steps and results are presented in this report. Relevant information, including the interpretation presented in this report, was inserted into the SKB database SICADA. The delivered raw and processed data have been inserted in the database of SKB (SICADA) and data are traceable by the activity plan number. 5.1 RAMAC logging The results of the interpretation of the radar measurements are presented in Tables 5-1 to 5-4 and in Table 5-7. Radar data is also visualized in Appendices 1 and 2. It should be remembered that the images in Appendices 1 and 2 are only a composite picture of all events 360 degrees around the borehole, and do not reflect the orientation of the structures. Only the larger visible structures are interpreted in RadinterSKB. Overviews of the two different boreholes are given in Figure 5-1 below. A number of minor structures also exist but not interpreted as indicated in Appendices 1 and 2. Often a number of structures can be noticed, but most probably lying so close to each other that it is impossible to distinguish one from the other (see Figure 5-2). Larger structures parallel to the borehole, if present, are also indicated in Appendices 1 and 2. It should also be pointed out that reflections interpreted will always get an intersection point with the borehole, but being located further away. They may in some cases not reach the borehole. The data quality from KLX10 and HLX31, (as seen in Appendices 1 and 2) is satisfying, but in relatively large parts of lower quality due to more conductive conditions. This is seen for both boreholes (see for instance 250 MHz data in Appendices 1 and 2). A conductive environment makes the radar wave to attenuate, which decreases the penetration. This conductive environment of course also reduces the possibility to distinguish and interpret possibly structures in the rock which otherwise could give a reflection. This effect is also seen in the directional antenna for KLX10, which makes it more difficult to interpret the direction to the identified structures. Further on, depending on the size of the borehole, the conductivity and the antenna frequency, so called ringing can be achieved, which again makes the interpretation of single structures quite complicated. This is seen for instance in the data from KLX10, (250 and 100 MHz data) for the first 100 m, where the borehole diameter is larger, see Figure 5-3. In parts with an increased conductivity and thereby a decreased depth penetration most often only the edges of structures can be distinguished, giving an intersection angle of 90 degrees. 21
 of the radar data for the two different")
and depth (y-scale) differs between the")
 where a number of structures are")

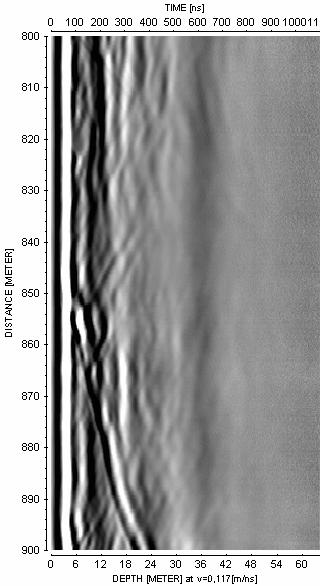
19 HLX31 KLX10 Figure 5-1. An overview (20 MHz data) of the radar data for the two different boreholes; HLX31 and KLX10. Observe that the length (x-scale)and depth (y-scale) differs between the different boreholes. Figure 5-2. Example of data from KLX10 (250 MHz data) where a number of structures are seen but lying so close to each other, that one can not be distinguished from the other. Figure 5-3. Example of data from KLX10, 250 MHz. The effect of the two different borehole diameters are clearly seen, in the amount of so called ringing, in the upper part compared to the lower part of the picture. 22
20 In Appendix 1, KLX10, three distinct anomalies can be identified for all antenna frequencies, at depths of 226, 328 and 338 m. These are due to perforated steel plates placed in the borehole to prevent the borehole walls to collapse. As also seen in Appendices 1 and 2 the resolution and penetration of radar waves depend on the antenna frequency used. Low antenna frequency gives less resolution but higher penetration depth compared to a higher frequency. If structures can be identified with all three antenna frequencies, it can probably be explained by that the structure is quite significant. In Table 5-1 and 5-2 below the distribution of identified structures along the borehole are listed for KLX10 and HLX31. Table 5-1. Identified structures as a function of depth in KLX10. Depth (m) No. of structures Table 5-2. Identified structures as a function of depth in HLX31. Depth (m) No. of structures

21 Tables 5-3 and 5-4 summarises the interpretation of radar data from KLX10 and HLX31. For KLX10 the direction to the reflector (object) is also given. As seen some radar reflectors in Table 5-3 are marked with ±, which indicates an uncertainty in the interpretation of direction. The direction can in these cases be ± 180 degrees. The direction to the reflector (object) is defined in Figure 5-4. As the borehole inclination is less than 85 degrees the direction to object is calculated using gravity roll. The direction to object and the intersection angle are recalculated to strike and dip, also given in Table 5-3. The plane strike is the angle between line of the plane s cross-section with the surface and the Magnetic North direction. It counts clockwise and can be between 0 and 359 degrees. A strike of 0 degrees implies a dip to the east while a strike of 180 degrees implies a dip to the west. The plane dip is the angle between the plane and the surface. It can vary between 0 and 90 degrees. Observe that a structure can have several different angles, if the structure is undulating, and thereby also different intersection depths is given. This is seen for structure 20 in Table 5-3 and Appendix 1. To this structure, most likely, also structure 20x belongs. Figure 5-4. Definition of intersection angle, direction to object using gravity roll, dip and strike using the right hand rule as presented in Table
22 Table 5-3. Interpretation of radar reflectors from the dipole antennas 250, 100 and 20 MHz, and the directional antenna 60 MHz in borehole KLX10. RADINTER MODEL INFORMATION (Directional antenna) Site: Oskarshamn Borehole name: KLX10 Nominal velocity (m/µs): Name Intersection depth Intersection angle RadInter direction to object (gravity roll) Dip 1 Strike 1 Dip 2 Strike ± ± x ± ± ±
23 RADINTER MODEL INFORMATION (Directional antenna) Site: Oskarshamn Borehole name: KLX10 Nominal velocity (m/µs): Name Intersection depth Intersection angle RadInter direction to object (gravity roll) Dip 1 Strike 1 Dip 2 Strike ± ± ± ± ± ±
24 RADINTER MODEL INFORMATION (Directional antenna) Site: Oskarshamn Borehole name: KLX10 Nominal velocity (m/µs): Name Intersection depth Intersection angle RadInter direction to object (gravity roll) Dip 1 Strike 1 Dip 2 Strike ± ± ± ± ±
25 RADINTER MODEL INFORMATION (Directional antenna) Site: Oskarshamn Borehole name: KLX10 Nominal velocity (m/µs): Name Intersection depth Intersection angle RadInter direction to object (gravity roll) Dip 1 Strike 1 Dip 2 Strike ± ± ± ± ±
26 RADINTER MODEL INFORMATION (Directional antenna) Site: Oskarshamn Borehole name: KLX10 Nominal velocity (m/µs): Name Intersection depth Intersection angle RadInter direction to object (gravity roll) Dip 1 Strike 1 Dip 2 Strike ± ± ±
27 RADINTER MODEL INFORMATION (Directional antenna) Site: Oskarshamn Borehole name: KLX10 Nominal velocity (m/µs): Name Intersection depth Intersection angle RadInter direction to object (gravity roll) x Dip 1 Strike 1 Dip 2 Strike ±
28 Table 5-4. Interpretation of radar reflectors from the dipole antennas 250, 100 and 20 MHz, in borehole HLX31. RADINTER MODEL INFORMATION (20, 100 and 250 MHz Dipole Antennas) Site: Oskarshamn Borehole name: HLX31 Nominal velocity (m/µs): Object type Name Intersection depth PLANE PLANE PLANE PLANE PLANE PLANE PLANE PLANE PLANE PLANE PLANE PLANE PLANE PLANE PLANE PLANE PLANE PLANE PLANE PLANE PLANE PLANE PLANE PLANE PLANE PLANE PLANE PLANE PLANE PLANE PLANE PLANE PLANE PLANE PLANE PLANE PLANE PLANE Intersection angle 31
29 In Appendices 1 and 2, the amplitude of the first arrival is plotted against the depth, for the 250 MHz dipole antennas. The amplitude variation along the borehole indicates changes of the electrical conductivity of the volume of rock surrounding the borehole. A decrease in this amplitude may indicate fracture zones, clay or rock volumes with increases in water content, i.e. increases in electric conductivity. The decrease in amplitude is shown in Tables 5-5 and 5-6. Finally, the structures considered as the most important (clear in the radargram, identified with several antenna frequencies, stretching out far from the borehole wall etc) are listed in Table 5-7 below. Table 5-5. Borehole length intervals in KLX10 with decreased amplitude for the 250 MHz antenna. Length (m) Length (m) Table 5-6. Borehole length intervals in HLX31 with decreased amplitude for the 250 MHz antenna. Length (m) Length (m) Table 5-7. Some important structures in KLX10 and HLX31. Borehole KLX10 HLX31 Structures 22, 43, 52, 60, 65, 98, 107, 123, 125, 147, 149, 197, 199, 214, 214x, 215, 221, 238, 242, 243, 244, 247 8, 12, 26 and 37 32
30 Observe that it can be very difficult to classify different structures in an objective manner, along a borehole. This is due to the fact that the water quality (the conductivity) amongst others varies along the borehole length and by that reason affects the results of the radar logging, by for instance attenuating the radar waves differently. Also the intersection angle of the identified structures affects the amplitude on the resulting radargram. A small angle will most often give a increased amplitude than a larger angle, and by that a more clear structure. 5.2 BIPS logging The BIPS pictures from KLX10 and HLX31 are presented in Appendices 3 and 4. In order to control the quality of the system, calibration measurements were performed in a test pipe before and after the logging. The resulting images displayed with no difference regarding the colours and focus of the images. Results of the test loggings were included in the delivery of the raw data. To get the best possible depth accuracy, the BIPS images are adjusted to the reference mark on the cable for the logging in KLX10. For HLX31 the marks on the logging cable at 110 m was used for adjustment of the depth. The error in the depth recording depends mainly on the tension of the cable and error of the depth readings from the measuring wheel. The adjusted depth is showed in red colour and the recording depth have black colour in the printouts. Several inspections in KLX10 has been performed with the BIPS during the drilling phase. The aim was to check the stability of the borehole walls. This inspections resulted that perforated steel plates was placed at 226 m, 328 m and 338 m to avoid rock pieces to enter in to the borehole and cause equipment to jam. The BIPS images from the boreholes are of very good quality. No discolouring on the borehole wall in combination with very good water quality results in very good images and makes the geological core logging very easy to perform. Also in HLX31 the water condition is perfect and resulted in images of very high quality. 33
31 References 1 Gustafsson J, Gustafsson C, Oskarshamn site investigation. RAMAC and BIPS logging in boreholes KLX08, HLX30 and HLX33 and deviation logging in boreholes HLX30 and HLX33. SKB P , Svensk Kärnbränslehantering AB. 2 Gustafsson J, Gustafsson C, Oskarshamn site investigation. RAMAC and BIPS logging in boreholes KLX07A, KLX07B, HLX34 and HLX35 and deviation logging in boreholes KLX07B, HLX34 and HLX35. SKB P , Svensk Kärnbränslehantering AB. 35


32 Appendix 1 Radar logging in KLX10, 0 to 993 m, dipole antennas 250, 100 and 20 MHz LAXEMAR KLX MHz 100 MHz 20 MHz 37


33 LAXEMAR KLX MHz 100 MHz 20 MHz 38


34 LAXEMAR KLX MHz 100 MHz 20 MHz 39


35 250 MHz LAXEMAR KLX MHz 20 MHz 40


36 LAXEMAR KLX MHz 100 MHz 20 MHz 41


37 250 MHz LAXEMAR KLX MHz 20 MHz 42


38 250 MHz LAXEMAR KLX MHz 20 MHz 43


39 LAXEMAR KLX MHz 100 MHz 20 MHz 44


40 LAXEMAR KLX MHz 100 MHz 45


41 LAXEMAR KLX MHz 100 MHz 20 MHz 46


42 Appendix 2 Radar logging in HLX30, 0 to 129 m, dipole antennas 250, 100 and 20 MHz LAXEMAR HLX MHz 100 MHz 20 MHz 47

43 LAXEMAR HLX MHz 100 MHz 20 MHz 48
44 BIPS logging in KLX10, 12 to 992 m Appendix 3 Project name: Laxemar Image file : c:\work\r5483o~1\bips\klx10_a.bip BDT file : c:\work\r5483o~1\bips\klx10_a.bdt Locality : LAXEMAR Bore hole number : KLX10 Date : 05/11/22 Time : 09:09:00 Depth range : m Azimuth : 251 Inclination : 85 Diameter : mm Magnetic declination : 0.0 Span : 4 Scan interval : 0.25 Scan direction : To bottom Scale : 1/25 Aspect ratio : 70 % Pages : 5 Color :
45 Project name: Laxemar Bore hole No.: KLX10 Azimuth: 251 Inclination: 85 Depth range: m ( 1 / 5 ) Scale: 1/25 Aspect ratio: 70 % 50
46 Project name: Laxemar Bore hole No.: KLX10 Azimuth: 251 Inclination: 85 Depth range: m ( 2 / 5 ) Scale: 1/25 Aspect ratio: 70 % 51
47 Project name: Laxemar Bore hole No.: KLX10 Azimuth: 251 Inclination: 85 Depth range: m ( 3 / 5 ) Scale: 1/25 Aspect ratio: 70 % 52
48 Project name: Laxemar Bore hole No.: KLX10 Azimuth: 251 Inclination: 85 Depth range: m ( 4 / 5 ) Scale: 1/25 Aspect ratio: 70 % 53
49 Project name: Laxemar Bore hole No.: KLX10 Azimuth: 251 Inclination: 85 Depth range: m ( 5 / 5 ) Scale: 1/25 Aspect ratio: 70 % 54
50 Project name: Laxemar Image file : c:\work\r5483o~1\bips\klx10_b.bip BDT file : c:\work\r5483o~1\bips\klx10_b.bdt Locality : LAXEMAR Bore hole number : KLX10 Date : 05/11/22 Time : 10:44:00 Depth range : m Azimuth : 251 Inclination : 85 Diameter : 76.0 mm Magnetic declination : 0.0 Span : 4 Scan interval : 0.25 Scan direction : To bottom Scale : 1/25 Aspect ratio : 175 % Pages : 19 Color :
51 Project name: Laxemar Bore hole No.: KLX10 Azimuth: 251 Inclination: 85 Depth range: m ( 1 / 19 ) Scale: 1/25 Aspect ratio: 175 % 56
52 Project name: Laxemar Bore hole No.: KLX10 Azimuth: 251 Inclination: 85 Depth range: m ( 2 / 19 ) Scale: 1/25 Aspect ratio: 175 % 57
53 Project name: Laxemar Bore hole No.: KLX10 Azimuth: 251 Inclination: 85 Depth range: m ( 3 / 19 ) Scale: 1/25 Aspect ratio: 175 % 58
54 Project name: Laxemar Bore hole No.: KLX10 Azimuth: 251 Inclination: 85 Depth range: m ( 4 / 19 ) Scale: 1/25 Aspect ratio: 175 % 59
55 Project name: Laxemar Bore hole No.: KLX10 Azimuth: 251 Inclination: 85 Depth range: m ( 5 / 19 ) Scale: 1/25 Aspect ratio: 175 % 60
56 Project name: Laxemar Bore hole No.: KLX10 Azimuth: 251 Inclination: 85 Depth range: m ( 6 / 19 ) Scale: 1/25 Aspect ratio: 175 % 61
57 Project name: Laxemar Bore hole No.: KLX10 Azimuth: 251 Inclination: 85 Depth range: m ( 7 / 19 ) Scale: 1/25 Aspect ratio: 175 % 62
58 Project name: Laxemar Bore hole No.: KLX10 Azimuth: 251 Inclination: 85 Depth range: m ( 8 / 19 ) Scale: 1/25 Aspect ratio: 175 % 63
59 Project name: Laxemar Bore hole No.: KLX10 Azimuth: 251 Inclination: 85 Depth range: m ( 9 / 19 ) Scale: 1/25 Aspect ratio: 175 % 64
60 Project name: Laxemar Bore hole No.: KLX10 Azimuth: 251 Inclination: 85 Depth range: m ( 10 / 19 ) Scale: 1/25 Aspect ratio: 175 % 65
61 Project name: Laxemar Bore hole No.: KLX10 Azimuth: 251 Inclination: 85 Depth range: m ( 11 / 19 ) Scale: 1/25 Aspect ratio: 175 % 66
62 Project name: Laxemar Bore hole No.: KLX10 Azimuth: 251 Inclination: 85 Depth range: m ( 12 / 19 ) Scale: 1/25 Aspect ratio: 175 % 67
63 Project name: Laxemar Bore hole No.: KLX10 Azimuth: 251 Inclination: 85 Depth range: m ( 13 / 19 ) Scale: 1/25 Aspect ratio: 175 % 68
64 Project name: Laxemar Bore hole No.: KLX10 Azimuth: 251 Inclination: 85 Depth range: m ( 14 / 19 ) Scale: 1/25 Aspect ratio: 175 % 69
65 Project name: Laxemar Bore hole No.: KLX10 Azimuth: 251 Inclination: 85 Depth range: m ( 15 / 19 ) Scale: 1/25 Aspect ratio: 175 % 70
66 Project name: Laxemar Bore hole No.: KLX10 Azimuth: 251 Inclination: 85 Depth range: m ( 16 / 19 ) Scale: 1/25 Aspect ratio: 175 % 71
67 Project name: Laxemar Bore hole No.: KLX10 Azimuth: 251 Inclination: 85 Depth range: m ( 17 / 19 ) Scale: 1/25 Aspect ratio: 175 % 72
68 Project name: Laxemar Bore hole No.: KLX10 Azimuth: 251 Inclination: 85 Depth range: m ( 18 / 19 ) Scale: 1/25 Aspect ratio: 175 % 73
P Oskarshamn site investigation. RAMAC and BIPS logging in borehole KLX11A. Jaana Gustafsson, Christer Gustafsson Malå Geoscience AB/RAYCON
 P-06-156 Oskarshamn site investigation RAMAC and BIPS logging in borehole KLX11A Jaana Gustafsson, Christer Gustafsson Malå Geoscience AB/RAYCON June 2006 Svensk Kärnbränslehantering AB Swedish Nuclear
P Forsmark site investigation. RAMAC and BIPS logging in borehole KFM07A. Jaana Gustafsson and Christer Gustafsson Malå GeoScience AB/RAYCON
 P-05-52 Forsmark site investigation RAMAC and BIPS logging in borehole KFM07A Jaana Gustafsson and Christer Gustafsson Malå GeoScience AB/RAYCON March 2005 Svensk Kärnbränslehantering AB Swedish Nuclear
P Äspö Hard Rock Laboratory. BIPS logging in borehole KC0045F. Christer Gustafsson Malå Geoscience AB. August 2010
 P-10-36 Äspö Hard Rock Laboratory BIPS logging in borehole KC0045F Christer Gustafsson Malå Geoscience AB August 2010 Svensk Kärnbränslehantering AB Swedish Nuclear Fuel and Waste Management Co Box 250,
P Oskarshamn site investigation. RAMAC and BIPS logging in borehole KLX06. Revised April 2006
 P-05-30 Revised April 2006 Oskarshamn site investigation RAMAC and BIPS logging in borehole KLX06 Jaana Gustafsson, Christer Gustafsson Malå Geoscience AB / RAYCON January 2005 Svensk Kärnbränslehantering
P Oskarshamn site investigation. RAMAC, BIPS and deviation logging in borehole KLX27A. Jaana Gustafsson, Christer Gustafsson Malå Geoscience AB
 P-08-30 Oskarshamn site investigation RAMAC, BIPS and deviation logging in borehole KLX27A Jaana Gustafsson, Christer Gustafsson Malå Geoscience AB March 2008 Svensk Kärnbränslehantering AB Swedish Nuclear
P Oskarshamn site investigation. RAMAC, BIPS and deviation logging in borehole KLX15A
 P-07-117 Oskarshamn site investigation RAMAC, BIPS and deviation logging in borehole KLX15A Jaana Gustafsson, Christer Gustafsson Malå Geoscience AB/RAYCON May 2007 Svensk Kärnbränslehantering AB Swedish
P Oskarshamn site investigation. RAMAC and BIPS logging in boreholes KSH03A, KSH03B, HAV09, HAV10 and BIPS in KAV01. Revised April 2006
 P-04-48 Revised April 2006 Oskarshamn site investigation RAMAC and BIPS logging in boreholes KSH03A, KSH03B, HAV09, HAV10 and BIPS in KAV01 Jaana Gustafsson, Christer Gustafsson Malå Geoscience AB / RAYCON
P Oskarshamn site investigation. Borehole: KAV01 Results of tilt testing. Panayiotis Chryssanthakis Norwegian Geotechnical Institute, Oslo
 P-04-42 Oskarshamn site investigation Borehole: KAV01 Results of tilt testing Panayiotis Chryssanthakis Norwegian Geotechnical Institute, Oslo March 2004 Svensk Kärnbränslehantering AB Swedish Nuclear
P Oskarshamn site investigation. Measurements of brook gradients. Mårten Strömgren, Lars Brydsten, Fredrik Lindgren Umeå University
 P-06-05 Oskarshamn site investigation Measurements of brook gradients Mårten Strömgren, Lars Brydsten, Fredrik Lindgren Umeå University December 2006 Svensk Kärnbränslehantering AB Swedish Nuclear Fuel
NERC GEOPHYSICAL EQUIPMENT FACILITY LOAN 904 SCIENTIFIC REPORT
 NERC GEOPHYSICAL EQUIPMENT FACILITY LOAN 904 SCIENTIFIC REPORT M. Disney, N. MacBean Department of Geography, University College London, Pearson Building, Gower Street, London, WC1E 6BT. Tel. 020 7679
AN31E Application Note
 Balancing Theory Aim of balancing How an unbalance evolves An unbalance exists when the principle mass axis of a rotating body, the so-called axis of inertia, does not coincide with the rotational axis.
14/10/2013' Bathymetric Survey. egm502 seafloor mapping
 egm502 seafloor mapping lecture 10 single-beam echo-sounders Bathymetric Survey Bathymetry is the measurement of water depths - bathymetry is the underwater equivalent of terrestrial topography. A transect
Wave phenomena in a ripple tank
 Wave phenomena in a ripple tank LEP Related topics Generation of surface waves, propagation of surface waves, reflection of waves, refraction of waves, Doppler Effect. Principle Water waves are generated
Comparative temperature measurements in an experimental borehole heat exchanger. Vincent Badoux 1, Rita Kobler 2
 European Geothermal Congress 2016 Strasbourg, France, 19-24 Sept 2016 Comparative temperature measurements in an experimental borehole heat exchanger Vincent Badoux 1, Rita Kobler 2 1 GEOTEST AG, Bernstrasse
EXPERIMENTAL RESULTS OF GUIDED WAVE TRAVEL TIME TOMOGRAPHY
 18 th World Conference on Non destructive Testing, 16-20 April 2012, Durban, South Africa EXPERIMENTAL RESULTS OF GUIDED WAVE TRAVEL TIME TOMOGRAPHY Arno VOLKER 1 and Hendrik VOS 1 TNO, Stieltjesweg 1,
Instrumentation & Data Acquisition Systems
 Instrumentation & Data Acquisition Systems Section 3 -Level Robert W. Harrison, PE Bob@TheHarrisonHouse.com Made in USA 1 Level Section Question Which level measuring technology is the best solution when
M. Mikkonen.
 Wind study by using mobile sodar technology M. Mikkonen Oulu University of Applied Sciences, School of Engineering, Oulu, Finland t3mimi00@students.oamk.com Abstract In this paper is presented a concept
Figure 2: Principle of GPVS and ILIDS.
 Summary Bubbly flows appear in many industrial applications. In electrochemistry, bubbles emerge on the electrodes in e.g. hydrolysis of water, the production of chloride and as a side-reaction in metal
Gravity wave effects on the calibration uncertainty of hydrometric current meters
 Gravity wave effects on the calibration uncertainty of hydrometric current meters Marc de Huu and Beat Wüthrich Federal Office of Metrology METAS, Switzerland E-mail: marc.dehuu@metas.ch Abstract Hydrometric
R The Simpevarp repository. Modelling changes in the flow, pressure and salinity fields, due to a repository for spent nuclear fuel
 R-05-56 The Simpevarp repository Modelling changes in the flow, pressure and salinity fields, due to a repository for spent nuclear fuel Urban Svensson, Computer-aided Fluid Engineering AB December 2006
Waves Wave Characteristics
 Name: Date: Waves 4.4 Wave Characteristics. A transverse travelling wave has amplitude A 0 and wavelength λ. The distance between a crest and its neighbouring trough, measured in the direction of energy
from ocean to cloud PARAMETRIC SUB-BOTTOM PROFILER, A NEW APPROACH FOR AN OLD PROBLEM
 PARAMETRIC SUB-BOTTOM PROFILER, A NEW APPROACH FOR AN OLD PROBLEM Geoff Holland, Alcatel-Lucent Submarine Networks Geoff.holland@alcatel-lucent.com Alcatel-Lucent Submarine Networks Ltd, Christchurch Way,
Flow Scanner. Production logging in multiphase horizontal wells
 Flow Scanner Production logging in multiphase horizontal wells Applications Multiphase flow profiling in nonvertical wells Identification of fluid and gas entries in multiphase well or liquid in gas wells
BIT User Manual. 1. About this manual. 2. Know your BIT 1.1. WARNING System Components
 BIT User Manual About this manual WARNING Know your BIT System Components Operation Methods Maintenance, charging 3.3.1. Cleaning General handling Software Setup Calibrating the BIT Inclinometer calibration
Aalborg Universitet. Published in: Proceedings of Offshore Wind 2007 Conference & Exhibition. Publication date: 2007
 Aalborg Universitet Design Loads on Platforms on Offshore wind Turbine Foundations with Respect to Vertical Wave Run-up Damsgaard, Mathilde L.; Gravesen, Helge; Andersen, Thomas Lykke Published in: Proceedings
Drilling Efficiency Utilizing Coriolis Flow Technology
 Session 12: Drilling Efficiency Utilizing Coriolis Flow Technology Clement Cabanayan Emerson Process Management Abstract Continuous, accurate and reliable measurement of drilling fluid volumes and densities
Level MEASUREMENT 1/2016
 Level MEASUREMENT 1/2016 AGENDA 2 A. Introduction B. Float method C. Displacer method D. Hydrostatic pressure method E. Capacitance method G. Ultrasonic method H. Radar method I. Laser method J. Level
Wade Reynolds 1 Frank Young 1,2 Peter Gibbings 1,2. University of Southern Queensland Toowoomba 4350 AUSTRALIA
 A Comparison of Methods for Mapping Golf Greens Wade Reynolds 1 Frank Young 1,2 Peter Gibbings 1,2 1 Faculty of Engineering and Surveying 2 Australian Centre for Sustainable Catchments University of Southern
COPYRIGHT. Production Logging Flowmeter Survey Solution Guide
 Production Logging Flowmeter Survey Solution Guide Applying Slippage & Liquid Holdup equations, solve for Q oil and Q water at 6130 ft and 6216 ft @ 6130 ft, the % ratio of flow is about 100 %, or 9190
HUMOR 20. High Accuracy Humidity Calibrator. Water T, p1 HUMOR 20 V1.0
 High Accuracy Humidity Calibrator The role of humidity calibrations that are accurate, reproducible, and documentable is becoming more and more important. ISO quality guidelines and regulations according
Flow in a shock tube
 Flow in a shock tube April 30, 05 Summary In the lab the shock Mach number as well as the Mach number downstream the moving shock are determined for different pressure ratios between the high and low pressure
The Challenge of Wave Scouring Design for the Confederation Bridge
 13: Coastal and Ocean Engineering ENGI.8751 Undergraduate Student Forum Faculty of Engineering and Applied Science, Memorial University, St. John s, NL, Canada MARCH 2013 Paper Code. (13 - walsh) The Challenge
VORTEX SHEDDING AND VORTEX FORMATION FROM A PAIR OF IN-LINE FORCED OSCILLATING TANDEM ARRANGED CIRCULAR CYINDERS IN A UNIFORM FLOW
 5 th International Symposium on Flow Visualization June 5-8,, Minsk, Belarus VORTEX SHEDDING AND VORTEX FORMATION FROM A PAIR OF IN-LINE FORCED OSCILLATING TANDEM ARRANGED CIRCULAR CYINDERS IN A UNIFORM
New power in production logging
 New power in production logging Locating the zones where fluids enter the wellbore in a producing or injecting well is an important aspect of production logging. It is relatively straightforward to establish
Increased streamer depth for dual-sensor acquisition Challenges and solutions Marina Lesnes*, Anthony Day, Martin Widmaier, PGS
 Increased streamer depth for dual-sensor acquisition Challenges and solutions Marina Lesnes*, Anthony Day, Martin Widmaier, PGS Summary The towing depth applicable to dual-sensor streamer acquisition has
Deploying the TCM-1 Tilt Current Meter in an Inverted (Hanging) Orientation By: Nick Lowell, Founder & President
 Orientation By: Nick Lowell, Founder & President") Lowell Instruments Application Note #TCMA Deploying the TCM-1 Tilt Current Meter in an Inverted (Hanging) Orientation By: Nick Lowell, Founder & President 1 Introduction The TCM-1 Tilt Current Meter (TCM)
Lowell Instruments Application Note #TCMA Deploying the TCM-1 Tilt Current Meter in an Inverted (Hanging) Orientation By: Nick Lowell, Founder & President 1 Introduction The TCM-1 Tilt Current Meter (TCM)
Acoustic Emission Testing of The Shell 0f Electromagnetic Valve
 17th World Conference on Nondestructive Testing, 25-28 Oct 2008, Shanghai, China Acoustic Emission Testing of The Shell 0f Electromagnetic Valve guozhen XU 1, yiwei CHEN 1, zhihua CAO 2 ABSTRACT Shanghai
Beamex. Calibration White Paper. Weighing scale calibration - How to calibrate weighing instruments
 Beamex Calibration White Paper info@beamex.com Weighing scale calibration - How to calibrate weighing instruments Weighing scale calibration - How to calibrate weighing instruments Weighing scales, weighing
A review of best practices for Selection, Installation, Operation and Maintenance of Gas meters for Flare Applications used for Managing facility
 A review of best practices for Selection, Installation, Operation and Maintenance of Gas meters for Flare Applications used for Managing facility mass balance and compliance 1. What, When and Why? 2. Flare
4.4 WAVE CHARACTERISTICS 4.5 WAVE PROPERTIES Student Notes
 4.4 WAVE CHARACTERISTICS 4.5 WAVE PROPERTIES Student Notes I. DIFFERENT TYPES OF WAVES A. TRANSVERSE AND LONGITUDINAL WAVES B. WAVE PULSES AND TRAVELLING WAVES C. SOUND AND WATER WAVES II. DEFINING TERMS
Results and Discussion for Steady Measurements
 Chapter 5 Results and Discussion for Steady Measurements 5.1 Steady Skin-Friction Measurements 5.1.1 Data Acquisition and Reduction A Labview software program was developed for the acquisition of the steady
Section 1 Types of Waves. Distinguish between mechanical waves and electromagnetic waves.
 Section 1 Types of Waves Objectives Recognize that waves transfer energy. Distinguish between mechanical waves and electromagnetic waves. Explain the relationship between particle vibration and wave motion.
Wave Motion. interference destructive interferecne constructive interference in phase. out of phase standing wave antinodes resonant frequencies
 Wave Motion Vocabulary mechanical waves pulse continuous periodic wave amplitude period wavelength period wave velocity phase transverse wave longitudinal wave intensity displacement amplitude phase velocity
LONG METAL SPRING ITEM # ENERGY - MOTION
 T E A C H E G U I R D S E LONG METAL SPRING ITEM # 3638-01 ENERGY - MOTION Waves are all around us. From sound waves, to electromagnetic waves, to seismic waves, we experience wave motion on a daily basis.
ANALYSIS OF THE POSITIVE FORCES EXHIBITING ON THE MOORING LINE OF COMPOSITE-TYPE SEA CAGE
 194 He, W., Li, C.: Analysis of the positive forces exhibiting on ANALYSIS OF THE POSITIVE FORCES EXHIBITING ON THE MOORING LINE OF COMPOSITE-TYPE SEA CAGE Wei He 1* Chunliu Li 2 1 Ocean College, Agricultural
Inspection of CANDU Reactor Pressure Tubes Using Ultrasonics
 17th World Conference on Nondestructive Testing, 25-28 Oct 2008, Shanghai, China Inspection of CANDU Reactor Pressure Tubes Using Ultrasonics Michael TRELINSKI Inspection & Maintenance Services Ontario
KINEMATIC ANALYSIS OF SHOT PUT IN ELITE ATHLETES A CASE STUDY
 KINEMATIC ANALYSIS OF SHOT PUT IN ELITE ATHLETES A CASE STUDY Weimin Liu and Mingxuan Wang Jiangsu Research Institute of Sports Science, Nanjing, People's Republic of China This paper presented the application
1 THE TEST FACILITY DISCO-C
 1 THE TEST FACILITY DISCO-C 1.1 General layout of the test facility A schematic diagram of the test facility DISCO-C is shown in figure 1.1, which consists of three major parts, i.e., the pressure vessel,
Waves. Kevin Small or
 Waves Opening note: X-rays can penetrate your body. Sound waves can make thinks vibrate; water waves can knock you over in the sea. Infrared waves can warm you up and slinky waves are fun to play with.
OUS31. Technical Information
 Technical Information OUS Turbidity sensor Installation and immersion sensor for drinking water and industrial water according to the 90 scattered light method Application All phases of drinking water
DEVIL PHYSICS THE BADDEST CLASS ON CAMPUS AP PHYSICS
 DEVIL PHYSICS THE BADDEST CLASS ON CAMPUS AP PHYSICS LSN 11-7: WAVE MOTION LSN 11-8: TYPES OF WAVES; LONGITUDINAL AND TRANSVERSE LSN 11-9: ENERGY TRANSPORTED BY WAVES Physics of Waves Questions From Reading
The Discussion of this exercise covers the following points:
 Exercise 3-2 Orifice Plates EXERCISE OBJECTIVE In this exercise, you will study how differential pressure flowmeters operate. You will describe the relationship between the flow rate and the pressure drop
A PPLICATION. Water Filled Tubes. Drilled Shafts S TANDARDS. Depth Wheel & Cables. CT Method. Signal goes around defect or is blocked.
 CT Method N D E C R O S S H O L E T O M O G R A P H Y A PPLICATION Crosshole Tomography testing is used to accurately characterize the size, location and severity of defects commonly found within newly
DURRIDGE STAINLESS STEEL SOIL GAS PROBE
 DURRIDGE STAINLESS STEEL SOIL GAS PROBE CONTENTS 1. Introduction... 3 2. Placement... 3 3. Connection... 4 4 Measurement... 4 4.1 GRAB Protocol... 5 4.2 Continuous Monitoring... 6 4.3 Thoron Protocol...
ABB MEASUREMENT & ANALYTICS DATA SHEET. WaterMaster FEW530 Electromagnetic water meter
 ABB MEASUREMENT & ANALYTICS DATA SHEET WaterMaster FEW530 Electromagnetic water meter 2 WATE RMASTE R F E W 530 ELECT ROMAGNE TIC WATE R ME TE R DS/FE W530/FE T3 -E N RE V. A Measurement made easy Cost
FTC130 Transmitter. Operating Manual
 Seite 1 von 11 FTC130 Transmitter Fast Thermal Conductivity Analyzer Operating Manual 1.09KD180724CWI1V05 Messkonzept GmbH Seite 2 von 11 1. Intended Use... 3 2. Description... 4 3. Measuring gases and
SNAKY SPRING WAVE DEMONSTRATION ITEM # ENERGY - MOTION
 T E A C H E G U I R D S E SNAKY SPRING WAVE DEMONSTRATION ITEM # 3640-00 ENERGY - MOTION Waves are all around us. From sound waves, to electromagnetic waves, to seismic waves, we experience wave motion
Specifications for Synchronized Sensor Pipe Condition Assessment (AS PROVIDED BY REDZONE ROBOTICS)
") Specifications for Synchronized Sensor Pipe Condition Assessment (AS PROVIDED BY REDZONE ROBOTICS) A. Scope of Work The work covered by these specifications consists of furnishing all materials, labor,
Specifications for Synchronized Sensor Pipe Condition Assessment (AS PROVIDED BY REDZONE ROBOTICS) A. Scope of Work The work covered by these specifications consists of furnishing all materials, labor,
ATION TITLE. Survey QC, Decision Making, and a Modest Proposal for Error Models. Marc Willerth, MagVAR
 1 a Modest Proposal for Error Models ATION TITLE Marc Willerth, MagVAR Speaker Information Marc Willerth VP of Survey Technologies April 11, 2018 MagVAR 2 Speaker Bio Marc Willerth Magnetic Variation Services,
SCHEINWORKS Measuring and Analysis Systems by
 Pressure Measurement Systems for standing and walking analysis Germany since 1879 Pressure Measurement Systems for standing and walking analysis Documentation of Gait image Stance Symmetry of all parameters
PROJECT MANAGER MINES, COUNTERMINE AND DEMOLITIONS [COUNTERMINE DIVISION] FORT BELVOIR, VIRGINIA
![PROJECT MANAGER MINES, COUNTERMINE AND DEMOLITIONS [COUNTERMINE DIVISION] FORT BELVOIR, VIRGINIA](/thumbs/74/70052589.jpg "PROJECT MANAGER MINES, COUNTERMINE AND DEMOLITIONS [COUNTERMINE DIVISION] FORT BELVOIR, VIRGINIA") PROJECT MANAGER MINES, COUNTERMINE AND DEMOLITIONS [COUNTERMINE DIVISION] FORT BELVOIR, VIRGINIA PROCEDURES FOR MATCHING THE ELECTROMAGNETIC RESPONSE OF SIMULANT MINE INSERT COMBINATIONS TO THE RESPONSE
PROJECT MANAGER MINES, COUNTERMINE AND DEMOLITIONS [COUNTERMINE DIVISION] FORT BELVOIR, VIRGINIA PROCEDURES FOR MATCHING THE ELECTROMAGNETIC RESPONSE OF SIMULANT MINE INSERT COMBINATIONS TO THE RESPONSE
HUMOR 20 HUMOR 20. High-precision Humidity Calibrator. Water T, p1
 High-precision Humidity Calibrator The role of humidity calibrations that are accurate, reproducible, and documentable is becoming more and more important. ISO quality guidelines and regulations according
INTERACTION BETWEEN WIND-DRIVEN AND BUOYANCY-DRIVEN NATURAL VENTILATION Bo Wang, Foster and Partners, London, UK
 INTERACTION BETWEEN WIND-DRIVEN AND BUOYANCY-DRIVEN NATURAL VENTILATION Bo Wang, Foster and Partners, London, UK ABSTRACT Ventilation stacks are becoming increasingly common in the design of naturally
CONSTRUCTION OF LNG RECEIVING TERMINAL ON THE SAINT LAWRENCE TIDAL CURRENT CONDITIONS IN THE LEVIS AREA
 RABASKA PROJECT CONSTRUCTION OF LNG RECEIVING TERMINAL ON THE SAINT LAWRENCE TIDAL CURRENT CONDITIONS IN THE LEVIS AREA FINAL REPORT MARCH 2006 N/Réf. : 24237.360 3075, ch. des Quatre-Bourgeois Sainte-Foy
Paper #: POWER
 Proceedings of POWER2008 ASME Power 2008 July 22-24, 2008, Orlando, Florida, USA Paper #: POWER2008-60061 THE USE OF AN EDDY CURRENT INSPECTION OF BRASS TUBES IN A SURFACE CONDENSER TO PROVIDE A CONDITION
1. What are the differences and similarities among transverse, longitudinal, and surface waves?
 Assignment Waves Reading: Giancoli, Chapters 11, 12, 22, 24 Holt, Chapters 12, 14 Objectives/HW The student will be able to: 1 Define, apply, and give examples of the following concepts: wave, pulse vs.
485 Annubar Primary Flow Element Installation Effects
 ROSEMOUNT 485 ANNUBAR 485 Annubar Primary Flow Element Installation Effects CONTENTS Mounting hole diameter Alignment error Piping Geometry Induced Flow Disturbances Pipe reducers and expansions Control
DUALEM EM EQUIPMENT. Geostudi Astier srl Via Nicolodi, Livorno Italy
 DUALEM EM EQUIPMENT DUALEM instruments (e.g. the DUALEM-1) incorporate a DUALEM sensor as well as an internal WAAS-enabled GPS receiver, a hand-held weatherproof display/keypad/power-supply, a carrying
Waves. harmonic wave wave equation one dimensional wave equation principle of wave fronts plane waves law of reflection
 Waves Vocabulary mechanical wave pulse continuous periodic wave amplitude wavelength period frequency wave velocity phase transverse wave longitudinal wave intensity displacement wave number phase velocity
Sound scattering by hydrodynamic wakes of sea animals
 ICES Journal of Marine Science, 53: 377 381. 1996 Sound scattering by hydrodynamic wakes of sea animals Dmitry A. Selivanovsky and Alexander B. Ezersky Selivanovsky, D. A. and Ezersky, A. B. 1996. Sound
Technical Information Conducal CLY421
 TI00496C/07/EN/01.12 71142150 Products Solutions Services Technical Information Conducal CLY421 Conductivity calibration set for ultrapure water applications Factory calibrated measurement box Certified
SVENSK STANDARD SS-ISO :2005
 SVENSK STANDARD Fastställd 2005-09-02 Utgåva 1 Vibration och stöt Provningar med köldprovocering för att uppskatta yttre kärlfunktion Del 2: Mätning och bedömning av fingrarnas systoliska blodtryck (ISO
Expert Hydrostatic Level Transmitters
 Expert Hydrostatic s General Features MJK Expert hydrostatic level transmitters are designed for level measurement by submerging the transmitter in open channels, drains and tanks. Expert hydrostatic level
IDeA Competition Report. Electronic Swimming Coach (ESC) for. Athletes who are Visually Impaired
 for. Athletes who are Visually Impaired") IDeA Competition Report Electronic Swimming Coach (ESC) for Athletes who are Visually Impaired Project Carried Out Under: The Department of Systems and Computer Engineering Carleton University Supervisor
IDeA Competition Report Electronic Swimming Coach (ESC) for Athletes who are Visually Impaired Project Carried Out Under: The Department of Systems and Computer Engineering Carleton University Supervisor
Chapter 12: Mechanical Waves and Sound
 Chapter 12 Lecture Chapter 12: Mechanical Waves and Sound Goals for Chapter 12 To describe mechanical waves. To study superposition, standing waves and sound. To present sound as a standing longitudinal
Acoustic Pulse Reflectometry Brings an End to Tube Inspection Sampling By Dr. Noam Amir, Chief Technology Officer, AcousticEye
 SINCE2011 Singapore International NDT Conference & Exhibition, 3-4 November 2011 Acoustic Pulse Reflectometry Brings an End to Tube Inspection Sampling By Dr. Noam Amir, Chief Technology Officer, AcousticEye
better measurement Simply a question of SCHMIDT Flow Sensor SS The cost-effective alternative in pressurised systems up to 10 bars.
 Simply a question of better measurement SCHMIDT Flow Sensor SS 20.261 The cost-effective alternative in pressurised systems up to 10 bars. Compressed air technology Industrial processes A cost analysis
Internal riser inspections on FPSO storage & production facilities
 Internal riser inspections on FPSO storage & production facilities by Jurgen F P Elbertse A Hak Industrial Services bv, Rhenen, Netherlands Contents of this Paper: Introduction Preparations Testing Mobilization
Chapter 14 Waves. Apr 30 7:11 AM
 Chapter 14 Waves http://faraday.physics.utoronto.ca/iyearlab/intros/standingwaves/flash/long_wave.html Apr 30 7:11 AM 1 May 5 7:16 AM 2 May 5 7:17 AM 3 May 5 7:17 AM 4 May 5 7:19 AM 5 May 5 7:29 AM 6 May
 Chapter 14 Waves http://faraday.physics.utoronto.ca/iyearlab/intros/standingwaves/flash/long_wave.html Apr 30 7:11 AM May 5 7:16 AM 1 May 5 7:17 AM May 5 7:17 AM 2 May 5 7:19 AM May 5 7:29 AM 3 May 5 7:30
Using PV Diagram Synchronized With the Valve Functioning to Increase the Efficiency on the Reciprocating Hermetic Compressors
 Purdue University Purdue e-pubs International Compressor Engineering Conference School of Mechanical Engineering 21 Using PV Diagram Synchronized With the Valve Functioning to Increase the Efficiency on
WAVES. Unit 3. Sources: Ck12.org
 WAVES Unit 3 Sources: Ck12.org BELLRINGER DAY 01 1. How do you think energy travels? 2. Are all waves the same? Explain. LONGITUDINAL WAVES Amplitude, Rarefaction, and Compression WHAT ARE WAVES? Waves
Tutorial for the. Total Vertical Uncertainty Analysis Tool in NaviModel3
 Tutorial for the Total Vertical Uncertainty Analysis Tool in NaviModel3 May, 2011 1. Introduction The Total Vertical Uncertainty Analysis Tool in NaviModel3 has been designed to facilitate a determination
RESOLUTION MSC.94(72) (adopted on 22 May 2000) PERFORMANCE STANDARDS FOR NIGHT VISION EQUIPMENT FOR HIGH-SPEED CRAFT (HSC)
 (adopted on 22 May 2000) PERFORMANCE STANDARDS FOR NIGHT VISION EQUIPMENT FOR HIGH-SPEED CRAFT (HSC)") MSC 72/23/Add.1 RESOLUTION MSC.94(72) EQUIPMENT FOR HIGH-SPEED CRAFT (HSC) THE MARITIME SAFETY COMMITTEE, RECALLING Article 28(b) of the Convention on the International Maritime Organization concerning
MSC 72/23/Add.1 RESOLUTION MSC.94(72) EQUIPMENT FOR HIGH-SPEED CRAFT (HSC) THE MARITIME SAFETY COMMITTEE, RECALLING Article 28(b) of the Convention on the International Maritime Organization concerning
ScanFish Katria. Intelligent wide-sweep ROTV for magnetometer surveys
 ScanFish Katria Intelligent wide-sweep ROTV for magnetometer surveys User-friendly control and monitoring software solution The ScanFish Katria comes with the ScanFish III Flight software, which is an
i-clicker Discussion Question
 PHY132 Introduction to Physics II Class Class 3 Outline: Outline: Ch. 21, sections 21.1-21.4 The Principle of Superposition Standing Waves Nodes and Antinodes Musical Instruments QuickCheck 1.1 i-clicker
2 Available: 1390/08/02 Date of returning: 1390/08/17 1. A suction cup is used to support a plate of weight as shown in below Figure. For the conditio
 1. A suction cup is used to support a plate of weight as shown in below Figure. For the conditions shown, determine. 2. A tanker truck carries water, and the cross section of the truck s tank is shown
Impact of imperfect sealing on the flow measurement of natural gas by orifice plates
 Impact of imperfect sealing on the flow measurement of natural gas by orifice plates Rubens Silva Telles 1, Kazuto Kawakita 2 1 IPT Instituto de Pesquisas Tecnológicas, São Paulo, Brazil, rtelles@ipt.br
APPLICATION OF GPS RTK TECHNIQUE TO SHIP HULL TRAJECTORY DETERMINATION DURING LAUNCHING
 POSTER PAPER SESSION APPLICATION OF GPS RTK TECHNIQUE TO SHIP HULL TRAJECTORY DETERMINATION DURING LAUNCHING Zofia Rzepecka, Alojzy Wasilewski Institute of Geodesy, University of Warmia and Mazury in Olsztyn
Bye-Laws to Rules 35 to 37 Courses
 Appendix 1 Bye-Laws to Rules 35 to 37 Courses 1. FISA Manual for Rowing Championships In addition to conforming to the Rules of Racing and to the Racing Byelaws a course and all its technical equipment
Walk - Run Activity --An S and P Wave Travel Time Simulation ( S minus P Earthquake Location Method)
") Walk - Run Activity --An S and P Wave Travel Time Simulation ( S minus P Earthquake Location Method) L. W. Braile and S. J. Braile (June, 2000) braile@purdue.edu http://web.ics.purdue.edu/~braile Walk
Walk - Run Activity --An S and P Wave Travel Time Simulation ( S minus P Earthquake Location Method) L. W. Braile and S. J. Braile (June, 2000) braile@purdue.edu http://web.ics.purdue.edu/~braile Walk
In Vessel Composter Installation & Commissioning Manual
 In Vessel Composter Installation & Commissioning Manual Contents Customer responsibilities Transportation Lifting Delivery Pre-installation requirements Installation Drainage Ventilation Levelling Unpacking
APPENDIX A1 - Drilling and completion work programme
 APPENDIX A1 - Drilling and completion work programme Information about the well and drilling To the extent possible, the international system of units (SI) should be adhered to, and the drilling programme
Kennedy Bridge - Summary of Pier 6 Movement Records
 KENNEDY BRIDGE - SUMMARY OF PIER 6 MOVEMENT RECORDS TECHNICAL MEMORANDUM Kennedy Bridge - Summary of Pier 6 Movement Records PREPARED FOR: COPY TO: MnDOT Dale Thomas / CH2M HILL File PREPARED BY: DATE:
Vibrating Wire Load Cell (3, 4, 5 And 6 Gauge Cells) User Manual
 User Manual") Vibrating Wire Load Cell (3, 4, 5 And 6 Gauge Cells) User Manual Man 188 1.1.0 06/08/2014 Chris Rasmussen Philip Day Chris Rasmussen Manual No. Revision Date Originator Checked Authorised for Issue User
Vibrating Wire Load Cell (3, 4, 5 And 6 Gauge Cells) User Manual Man 188 1.1.0 06/08/2014 Chris Rasmussen Philip Day Chris Rasmussen Manual No. Revision Date Originator Checked Authorised for Issue User
3.6 Magnetic surveys. Sampling Time variations Gradiometers Processing. Sampling
 3.6 Magnetic surveys Sampling Time variations Gradiometers Processing Sampling Magnetic surveys can be taken along profiles or, more often, on a grid. The data for a grid is usually taken with fairly frequent
HUMOR 20. High-precision Humidity Calibrator HUMOR 20. Operation
 High-precision Humidity Calibrator The role of humidity calibrations that are accurate, reproducible, and documentable is becoming more and more important. ISO quality guidelines and regulations according
New Highly Productive Phased Array Ultrasonic Testing Machine for Aluminium Plates for Aircraft Applications
 19 th World Conference on Non-Destructive Testing 2016 New Highly Productive Phased Array Ultrasonic Testing Machine for Aluminium Plates for Aircraft Applications Christoph HENKEL 1, Markus SPERL 1, Walter
PAPER 2 THEORY QUESTIONS
 PAPER 2 THEORY QUESTIONS 1 (a) Water waves are transverse waves. Sound is a longitudinal wave. (i) Describe the difference between transverse waves and longitudinal waves. In your account, draw a diagram
WAVES. Pulses are disturbances or a single wave motion. A continuous production of pulses will give rise to a progressive wave (wave train).
.") 1 WAVES Types of Waves Pulses Pulses are disturbances or a single wave motion. A continuous production of pulses will give rise to a progressive wave (wave train). Progressive Waves A progressive wave
1 WAVES Types of Waves Pulses Pulses are disturbances or a single wave motion. A continuous production of pulses will give rise to a progressive wave (wave train). Progressive Waves A progressive wave