FINAL REPORT FOR NCHRP (375) Improvements to Dry-Back Procedure of AASHTO T 209. December 2017
|
|
|
- Estella Cobb
- 5 years ago
- Views:
Transcription
1 FINAL REPORT FOR NCHRP (375) Improvements to Dry-Back Procedure of AASHTO T 209 December 2017 TRANSPORTATION RESEARCH BOARD NAS-NRC LIMITED USE DOCUMENT This proposal is for use of recipient in selection of a research agency to conduct work under the National Cooperative Highway Research Program. After research agency has been selected, the rejected proposals are to be returned to the Board. These proposals are regarded as fully privileged, and dissemination of the information included herein must be approved by the Program Director. Pavement Systems, LLC 6105 Maiden Lane, Bethesda, MD, Phone (202) i
2 TABLE OF CONTENTS LIST OF TABLES... v LIST OF FIGURES... vi Acknowledgements... 1 CHAPTER 1 INTRODUCTION AND RESEARCH APPROACH Introduction and Background Problem Statement Project Objectives Project Scope...3 CHAPTER 2 literature Review Review of Research Projects Consequence of Not Using Dry-Back Gmm Review of State Agency Test Methods Results of State DOT Survey Questions in the Survey Responses to the Survey Questions Review of NCHRP 9-26 Phase 4 Study...9 CHAPTER 3 Investigation into NCHRP PROJECT 9-26 Phase 4 Dry-back Data State DOTs Trigger Measures for Performing Dry-back Evaluation of Trigger Measures and Trigger Values by Analysis of NCHRP Project 9-26 Phase 4 Data Comparison of Conventional and Dry-Back Gmm of NCHRP 9-26 Phase 4 ILS S1-9.5 Mixture S1-19 Mixture S2-9.5 Mixture S2-19 Mixture Explanation of ILS Results Analysis of NCHRP 9-26-Phase 4 Conditioning Time Data Selected Trigger Measures and Trigger Values Investigating Effect of Various Mixture Properties on the Differences between Conventional and Dry-back Data Using NCHRP 9-26 (Phase 4) Conditioning Time Study Data CHAPTER 4 Laboratory Investigation Selection of Materials ii
3 4.2 Testing of Mixtures AASHTO T 209 Dry-Back Procedure Accelerated Methods CoreDry for Rapid Drying Back Accelerated Method using Rotating Tumbler Modified SSD Criteria for Reducing Dry-back Time and Effort of AASHTO T CHAPTER 5 RESEARCH RESULTS Results According to AASHTO T 209 Dry-Back Dry-Back at Mixture Design Relationship between Time to SSD Condition and Mixture Variables Relationship between Time to SSD and Aggregate Absorption Relationship between Time to SSD and Aggregate Gradation Relationship between Time to SSD and Mixture Gradation Relationship between Mixture Gradation and Aggregate Gradation Modified SSD Criteria Results of CoreDry Results of Accelerated Rotating Tumbler Dry-back Method Effect of Mixture Gradation on Accelerated Dry-back Time CHAPTER 6 FINDINGS and CONCLUSIONS Summary Literature Review Analysis of NCHRP 9-26 (Phase 4) Data Laboratory Investigation Findings Literature Review Analysis of NCHRP Project 9-26 (Phase 4) Data Laboratory Investigations Recommendations REFERENCES Appendix A- Survey Results and analysis Appendix B- Dry-back Instructions and Data sheet Appendix C- Results of Analysis of NCHRP 9-26 Phase 4 ILS Data iii
4 Table C-1- Comparison from physical and statistical point of view of conventional and dry-back Gmm of mixture with 9.5-mm Source 1 absorptive aggregate from NCHRP 9-26 Phase 4 Interlaboratory Study; shaded cells indicate significance of difference Table C-2- Comparison from physical and statistical point of view of conventional and dry-back Gmm of mixture with 19.0-mm Source 1 absorptive aggregate from NCHRP 9-26 Phase 4 Interlaboratory Study; shaded cells indicate significance of difference Table C-3- Comparison from physical and statistical point of view of conventional and dry-back Gmm of mixture with 9.5-mm Source 2 absorptive aggregate from NCHRP 9-26 Phase 4 Interlaboratory Study; shaded cells indicate significance of difference Table C-4- Comparison from physical and statistical point of view of conventional and dry-back Gmm of mixture with 19.0-mm Source 2 absorptive aggregate from NCHRP 9-26 Phase 4 Interlaboratory Study; shaded cells indicate significance of difference iv
5 LIST OF TABLES Table 3-1- Percentages of significant differences between conventional and dry-back Gmm in NCHRP Project 9-26 ILS based on statistical and physical criteria Table 3-2- Percentages of significant differences between conventional and dry-back Gmm in NCHRP Project 9-26 ILS based on statistical and selected physical criteria with adjusted threshold values Table 3-3- Evaluation of significance of difference between conventional and dry-back Gmm values from physical and statistical standpoints for mixtures with 9.5 mm NMAS of Source 1 aggregates Table 3-4- Evaluation of the significance of difference between conventional and dry-back Gmm values from physical and statistical standpoints for mixtures with 19 mm NMAS of Source 1 aggregates Table 3-5- Evaluation of the significance of difference between conventional and Gmm values from physical and statistical standpoints for mixtures with 9.5 mm NMAS of Source 2 aggregates Table 3-6- Evaluation of the significance of difference between conventional and Gmm values from physical and statistical standpoints for mixtures with 19 mm NMAS of Source 2 aggregates Table 4-1 Material types and mixture IDs Table 4-2- Properties of the mixtures tested in this study Table 5-1 Gmm results according to T 209 dry-back method Table 5-2-Mixture percent passing #8 sieve and time to AASHTO T 209 saturated surface Dry time for the 12 mixtures in this study Table 5-4- SSD time of the 12 mixtures tested according to T 209 dry-back procedure and accelerated dry-back method; Two criteria used for the T 209 dry-back time: mass loss of 0.05% between consecutive measurements and mass difference of 0.17% between dry-back mass and the original dry mass; the criterion for the accelerated dry-back time is mass difference of 0.17% from the original dry mass Table 5-4- Results of t-test for comparison of Gmm from T 209 dry-back procedure and accelerated dry-back method; shaded P-values indicate statistically significant differences v
6 LIST OF FIGURES Figure 2-1- WV drying rack and fan setup... 7 Figure 3-1-Effect of aggregate source (absorption level) and aggregate gradation on differences in air voids calculated from conventional (without dry-back= w/o DB) and dry-back (with dryback=w/ DB) Gmm for different conditioning durations Figure 3-2-Change in effective asphalt content with increase in conditioning time for 9.5-mm mixtures Figure 4-1- Rotating tumbler (also known as Aggregate Washer) for accelerated dry-back Figure 5-1-Relationship of the difference between conventional and dry-back Gmm with the level of aggregate absorption (Top graph) and amount of RAP (bottom graph) Figure 5-2- Relationships between Time to SSD and level of aggregate absorption and the amount of RAP Figure 5-3- Relationship between time to SSD condition and various variables of aggregate gradation Figure 5-4-Relationship between time to T 209 SSD condition and percent of mixture passing #8 sieve Figure 5-5-Correlations of mixture percent passing #8 sieve with the aggregate percent passing #4 and smaller sieve sizes Figure 5-6-Relationship between AASHTO T 209 SSD time based on the threshold of 0.05% mass loss in an interval and time to reach 0.17% difference between original and final mass Figure 5-7-Percent loss of Moisture in 12 mixtures dried back using CoreDry; mass measurements were performed every 10 drying cycles equivalent to 17 min Figure 5-8-Relationship between the T 209 SSD time and the accelerated SSD time Figure 5-9-The relationship between T 209 dry-back Gmm and the accelerated rotating tumbler dry-back Gmm Figure 5-10-Relationship between the accelerated dry-back time and mixture percent passing #8 sieve vi
7 ACKNOWLEDGEMENTS The research reported herein was performed under NCHRP Project 20-07(375) by Pavement Systems LLC. Dr. Haleh Azari was the principal investigator on the study. Specialized Engineering Company graciously provided help with testing the mixture samples according to dry-back procedure of AASHTO T 209. Their contribution to this study is greatly regarded. The author wishes to acknowledge the state departments of transportation who participated in the survey and provided mixtures for the study. Their support is most appreciated. The help of Mr. Henry Lacinak from AASHTO for distributing the survey to the state DOTs and summarizing the survey results is very much valued. 1
8 CHAPTER 1 INTRODUCTION AND RESEARCH APPROACH 1.1 Introduction and Background AASHTO T 209, Theoretical Maximum Specific Gravity and Density of Hot Mix Asphalt [1], is the basis for asphalt mixture compaction specifications, which specify a percentage of the maximum specific gravity obtained with this test procedure. Maximum specific gravity (Gmm) is required to be determined on regular basis for design of the mixtures and to assure that the required level of compaction is being achieved in the field. T 209 requires measurement of the mass and volume of representative loose asphalt mixture samples. Prior to determining the sample volume, any pockets of air in the voids between particles must be removed. To accomplish this, air is forced out of the voids through a vacuum suction process and the voids are backfilled with water. During the vacuum suction process, if the surfaces of aggregates in the mixture are not completely coated with asphalt (due, for example, to the presence of RAP in mixture and/or insufficient asphalt content), water can be absorbed into aggregate particles and under the asphalt film. For the mixtures containing high absorptive aggregates and slags, the amount of water absorbed into the pores can be significant. In case of asphalt mixtures with well coated aggregate particles, the volume of the mixture is determined by weighing the mixture when submerged in water and then subtracting it from the original dry mass. However, for a mixture in which water has been absorbed into aggregate pores, the Saturated Surface Dry (SSD) mass of the mixture, in place of the original dry mass, is used for determining the volume. To obtain the SSD mass, AASTHO T 209 includes supplemental procedures for porous aggregates. The supplemental (Dry-back) procedure accounts for the water absorption by the aggregate during testing. The procedure requires that after the mixture is weighed in water, excess water is drained and the mixture is dried back on a flat surface in front of a fan. The dry back process involves measuring the mass of the mixture every 15 minutes until the SSD condition, which is defined as when the loss in mass is less than 0.05% for an interval, is reached. Theoretically, the Dry-back procedure provides a more accurate value with which to measure compaction in the field. AASHTO currently recommends using the Dry-back Procedure when the water absorption of the individual aggregate is greater than 1.5%. 1.2 Problem Statement The dry-back procedure has several challenges. First, it is not certain if 1.5% water absorption is the appropriate trigger value for performing a dry-back procedure. It has been observed that the dry-back procedure run on mixes with aggregates with 1.5% water absorption resulted in a difference between the two procedures that is insignificant in relation to the effect on compaction. Second, the dry back method produces Gmm values with higher variability than the conventional AASHTO T 209 method due to the possible loss of particles during the process. Third, the dry-back procedure includes steps that are very subjective in determining when the mix has reached the SSD condition, possibly increasing the variability of the results. Fourth, the procedure is time consuming. It typically takes about 2 hours to reach the SSD mass. 2
9 1.3 Project Objectives The objectives of this research were several fold. First, to determine the appropriate trigger measure and to identify the appropriate trigger value, which necessitates use of dry-back procedure. Second, to determine improvements that can be made to the dry-back procedure to make it less subjective and to produce more repeatable and reliable test results. Third, to explore various methods to accelerate the dry-back process to make it less time consuming. Fourth, to explore various criteria for determining the SSD condition and select the most reliable and straightforward criterion. The results of the research can be used to modify and improve the current AASHTO T 209 test procedure. 1.4 Project Scope Accomplishment of the project objectives required the following tasks: Task 1. Perform a literature review including recent research on AASHTO T 209 and the impacts highly absorptive aggregates may have on laboratory testing and pavement performance. Include agencies modifications to AASHTO T 209 and interview these agencies material experts on the purpose of the modifications. Task 2. Analyze NCHRP 9-26 (Phase 4) data, including conventional and dry-back Gmm of asphalt mixtures with highly absorptive aggregates, to determine the correct trigger measure and trigger value that necessitates use of dry-back procedure. Task 3. Perform a laboratory investigation of the significance of the water absorption of the aggregate and RAP materials on the dry-back procedure. Include mixtures with various RAP contents and aggregate sources with different levels of absorption from various locations. Task 4. Perform a laboratory investigation to improve methods to ensure proper dry back of field and laboratory mixtures. Task 5. Determine if modifications can be made to the procedure to reduce effort and/or time of the dry back process. Task 6. Determine a reliable criterion for determining Saturated Surface Dry (SSD) condition for a reduced effort and/or time of the dry-back procedure. Task 7. Recommend revisions to AASHTO T 209 to include in the supplemental (Dry-back) procedure. 3
10 CHAPTER 2 LITERATURE REVIEW For the first task of the project, a literature review was performed, which included a review of recent research projects on the dry-back procedure of AASHTO T 209 and a review of state highway agency test methods. The results of a survey of the state DOTs, performed to inquire about their experience with the dry-back procedure, was studied. The results of the NCHRP 9-26 (Phase 4) [2] study involving measurements of maximum specific gravity of mixtures with absorptive aggregates were reexamined. The applicability of the dry-back data in the NCHRP 9-26 study for evaluating various trigger measures was investigated. The results of the literature search, the states DOT survey, and review of NCHRP 9-26 study are discussed in the following sections. 2.1 Review of Research Projects In a study performed by NCAT in 1992 [3], it was found that by using a minimum residual pressure of 30 mm Hg (in combination with 15 min vacuum time at 77 F), the need for running the supplementary procedure (Section11 of ASTM 2041) can generally be avoided when testing a thoroughly coated mix. At the time of the study, ASTM D2041 did not specify restriction on the lower limit of the residual pressure and a residual pressure of 30 mm of Hg or less could be used. The authors stated that setting the lower limit of residual pressure is especially important while testing mixtures with highly absorptive aggregates since such aggregates can absorb water during the vacuuming phase of the Rice method, which necessitates the use of a supplementary (dry-back) procedure that is time-consuming and prone to testing errors. This finding was based on testing of two mixtures, one with aggregate water absorption of 1.68% and another with aggregate water absorption of 0.38% tested using combinations of three residual pressure of 16, 23, and 30 mm Hg and three vacuuming time of 5, 10, and 15 min at three temperatures of 69, 77, and 85 F. In search for the best combination of test variables, the researchers aimed at maximizing the value of the theoretical maximum specific gravity (Gmm) before running the supplementary (dry-back) procedure or reducing the difference between the Gmm values before and after running the supplementary procedure. To avoid performing the time-consuming dry back procedure, the Asphalt Institute suggests fully coating the exposed aggregates in recycled asphalt pavement (RAP) and in mixtures broken from field cores by adding 1 to 2% asphalt binder [4]. To remove the effect of the additional binder on Gmm calculation, the mass and volume of the added asphalt is subtracted in the mass-volume equation. While this method could ensure sealing of the exposed aggregate; heating of the original field mixture and curing of the mixture after addition of asphalt could impose the possibility of changing the Gmm of the original mixture. To prevent water absorption into the pores of aggregates, the Corelok method [5] was examined for measuring the Gmm of mixtures with absorptive aggregates in a number of research studies. In this method, mixture is vacuumed dry inside a plastic bag which avoids absorption of water into aggregate pores. Florida DOT has compared the Gmm measured from Corelok with those from Rice and dry back in a study involving eight mixtures with aggregates of various absorption levels [6]. They found that Corelok results are significantly higher than the dry-back results for mixtures with aggregates with high water absorption level. Therefore, they did not recommend replacing the dry-back with Corelok. In a similar study at the University of Cincinnati, a range of mix types and aggregate sources, including slag aggregate, resulting in 33 samples was used to compare Corelok and T 209 [7]. 4
11 The results indicated that for mixtures with low absorptive aggregates, Corelok Gmm is lower than the T 209 Gmm and for mixtures with high absorptive aggregates Corelok provides higher Gmm than T 209. West Virginia DOT also compared Corelok, Rice, and dry-back methods [8]. In addition, they investigated the effects of residual moisture in aggregates, conditioning duration, and increasing asphalt content by 0.5%. Gmm values measured by Corelok were statistically compared with the conventional Rice and dry-back results for mixtures with different percentages of slag (12%, 27%, and 42%), two conditioning durations (0 and 2 hrs.), two levels of aggregate residual moisture (0 and 2%), and two levels of asphalt content (design and design+0.5%). The results of the study indicated that Corelok provided the same Gmm as the conventional Rice but significantly different Gmm from dry-back. The Corelok Gmm were consistently higher than dry-back Gmm. The effect of residual moisture was found insignificant, while the effect of conditioning was found significant. The 2-hr conditioning provided significantly higher Gmm than no conditioning. The additional 0.5% asphalt was not found effective in reducing the difference between Rice and dry-back Gmm values, which may have to do with the high void content in slag aggregates. 2.2 Consequence of Not Using Dry-Back Gmm For determination of maximum specific gravity of asphalt mixtures, the original dry mass of the mixture is divided by its volume. The volume of the mixture is equivalent to the volume of water displaced when mixture is submerged in water. For water kept at 25ºC, specific gravity of water is 1g/cm 3 and volume of water is equal to the mass of the water displaced. The mass of water displaced is the difference between the dry mass of the mixture and its mass in water. Therefore, the volume in the denominator is determined by subtracting the mass of mixture in water from the mass of the mixture in air. During the vacuum saturation of an asphalt mixture, if the aggregate surfaces in the mixture are not completely covered with asphalt (due to RAP in the mixture and/or insufficient asphalt), water could be absorbed into the pores of the aggregates. For mixtures containing highly absorptive aggregates and slag aggregates, the amount of water seeping into the pores could be significant. When such a mixture, with water in its pores, is placed in the water bath, due to the larger mass of the mixture than the original dry weight, a greater volume of water would be displaced. To capture the larger volume, the Saturated Surface Dry (SSD) mass of the mixture is used in place of the original dry mass in the denominator of the Gmm formula. As a result, a lower maximum specific gravity will be measured. Failing to use the SSD mass when the difference between conventional and regular Gmm is significant, would have impacts on both laboratory testing and pavement performance. In the laboratory, higher Gmm means using higher binder content than may actually needed to achieve the required 4% air voids. The laboratory mechanical test results of such mixture would then underestimate the rutting performance and overestimate the cracking performance in the field. With the increased use of RAP in mixtures, this might be problematic. In the field, failing to use dry-back Gmm (if significantly different from conventional Gmm) could result in over compaction of the pavement. A higher level of compaction would be required to achieve the desired density in the field, e.g., 93% of the maximum specific gravity. If Gmm is off by more than 0.01, density will be off by approximately 4%. In this case, the 5
12 contractor would over compact to 97% density in order to achieve 93% density. This means extra cost to the contractors and eventually to the state DOT. 2.3 Review of State Agency Test Methods The state agencies test procedures were reviewed to identify their approaches to the use of the dry-back procedure. Any supplementary information or modifications to AASHTO T 209 regarding the dry-back procedure in the states test methods were identified and are discussed below. North Carolina DOT performs the dry-back procedure on the first four Rice tests for any job mix formula. The average of the differences between conventional and dry-back procedure is used as a correction factor. For all the Rice tests thereafter, the established correction factor is subtracted from the Gmm values obtained without the dry-back procedure. After that, the dry-back procedure will be repeated on every eighth Rice test and a new correction factor will be computed [9]. Caltrans uses the supplemental dry-back procedure of AASHTO T 209 for reclaimed asphalt pavement (RAP) and for asphalt mixtures where the combined virgin aggregate water absorption is 2.0 % or more [10]. Arizona uses the dry-back procedure (referred as fan drying method) for the first four samples taken at the beginning of production on a project [11]. The maximum specific gravity is determined without fan drying (conventional procedure) and on fan dried samples. If the difference in resultant air voids, when determined as described in Arizona Test Method 416 Section 9, is greater than 0.2%, subsequent samples will be subjected to fan drying. During the course of the project comparisons are made on approximate 10-sample intervals to determine a need for fan drying. In case of dispute, fan drying is used. Ohio DOT uses the dry-back procedure referred to as the SSD method if a 12.5-mm surface course contains air-cooled blast furnace slag (No. 8 or larger) or a 19-mm or Type 2 intermediate course contains dolomite, air-cooled blast furnace slag, or limestone virgin coarse aggregate (No. 8 or larger). They require the contractor to perform the Supplemental Procedure for Mixtures Containing Porous Aggregate (SSD) to determine the amount of retained water. If the retained water in the JMF is greater than 0.18 percent based on the dry mass of mix, then the SSD procedure should be applied for both the JMF testing and in quality control testing [12]. City of Columbus, Ohio requires performing the dry-back procedure for determining Gmm for every mix design. However, use of an alternate forced air system is allowed in place of an electric fan as long as (1) the 15-minute interval mass measurement shows less than 0.05 percent mass loss from the preceding mass for at least 1 hour and (2) forced air flow over the sample(s) is constant during a test and over multiple tests [13]. Several states have modified the setup for fan drying the mixture. In Supplement 1036 of Ohio DOT, use of a 12 inch (305 mm) diameter full height sieve meeting the requirements of ASTM E11 is specified for the SSD procedure instead of a pan as specified in T 209. The fan axis must be perpendicular to the sieve mesh with air flowing thru the sieve. This setup would ensure that the air flow can readily escape the sieve bottom [12]. West Virginia uses a drying rack fabricated from two No. 30 sieves held at an angle for each test replicate. A fan is placed behind each of the sieves to blow air up through the bottom of the sieves (Figure 2-1) [8]. 6

13 Figure 2-1- WV drying rack and fan setup Several state DOTs perform additional steps to improve the accuracy of the dry-back procedure. Colorado DOT uses a filter paper for draining the water and obtaining the mixture. Filter paper is first oven dried and its mass is recorded. The filter paper is then placed into a filter paper cone holder. Water is drained from the specimen through the filter paper cone with care not to lose any of the specimen. After allowing the specimen to drain completely, the specimen is emptied from the filter paper into a weighed pan and placed before an electric fan. The filter paper with any mixture remained on it is dried in the oven at 110 C ± 5 for more than 30 min. The mass of filter paper before draining and after drying in the oven provides the mass of the mixture remaining on the filter paper. This mass is then added to the SSD mass of the sample [14]. Texas DOT requires performing the instructions in Sections (dry-back procedure) of the state test method if the aggregate is expected to absorb water during the test, i.e., when the surfaces of any absorptive aggregate are not completely coated or are coated very thinly with asphalt. This problem may increase when highly effective vacuum pumps are used and if the samples remain exposed to this vacuum for an excessive time. Very porous aggregates, such as light-mass aggregates, are listed as particularly prone to absorbing water during this test. Texas DOT follows a similar procedure to the T 209 supplemental procedure; however, they suggest verifying the validity of the end-point by drying for an additional 30-minute period when practical. If a loss greater than 0.5 g occurs after 30 min, drying should be continued until a new constant endpoint is reached. The test method notes that Gmm from conventional and dry-back methods are rarely equal, even when no water absorption occurs, and that in some instances, the determination of the SSD condition is inaccurate because of the moisture commonly contained inside fine aggregate conglomerates. Therefore, some values will tend to indicate more correction than is justified. The decision on accepting the correction factor is based on several factors such as if mixture is lean, if high vacuum is used on mixture with high absorptive aggregates, if there are fractured aggregates in the mix, and if the difference between conventional and dry-back Gmm is more than 1% [15]. 7
14 2.4 Results of State DOT Survey A survey of the state DOTs was performed to determine the applicability of the dry-back procedure for the mixtures used in different states. The survey results are summarized in Appendix A Questions in the Survey 14 questions were asked in the survey. Key questions are as follows: 1. How often do you run the dry-back procedure? a. Conventionally b. Not on a conventional basis c. Never 2. Under what conditions do you decide to run the dry-back procedure? a. When mixtures have absorptive aggregates b. If broken aggregates in the mixture show sign of water absorption c. If aggregates are not well coated with asphalt 3. What trigger values (i.e., specific values of water or asphalt absorption) do you use to determine if the dry-back procedure is to be used (e.g., 1.5 % aggregate water absorption, etc.)? 4. What steps do you take in achieving the SSD condition as part of the dry-back procedure? a. Steps specified in AASHTO T 209 or ASTM D2041 b. Your agency s specification. Please explain. 5. How do you determine if the mix has reached SSD condition? a. Criteria used in AASHTO T 209 or ASTM D2041 b. Your agency s criteria. Please explain. 6. Have you made any modifications to AASHTO T 209 or used any specific device for reducing the subjectivity of SSD determination and/or shortening the time specified for the dry-back procedure? Please explain. In the survey, a question was also asked regarding the use of field cores for Gmm measurements. The responses to this question will be applicable to the next phase of the project. 8
15 2.4.2 Responses to the Survey Questions Responses were received from 29 states. The responses are summarized in Appendix A. Below is the highlight of the responses: states follow AASHTO T 209, 1 state follow ASTM D2041, and 8 states follow either a local test procedure or a modified T states do not run the dry-back procedure, 10 states run dry-back but not on a conventional basis, and 6 states use dry-back conventionally. SDDOT prefers to run the maximum specific gravity test at a higher asphalt content and coat the aggregate so the dry-back procedure is not needed during the mix design testing states use the dry-back if mixtures have absorptive aggregates, 7 states use dry-back if aggregates are not well coated with asphalt, and 2 states use dry-back if there are broken aggregates in the mixtures. Other responses included performing dry back on every eighth QC sample; when aggregate water absorption is above 1.5%; for pavement cores; at the initial mix design stage; if the difference between mixture dry air mass and fan dried mass is more than 0.2%; when the mixture includes slag and Plum Run dolomite; for forensic and investigational purposes only; or when using RAP mixtures. 4. Different states use different trigger values for use of the dry-back procedure. Some states use 1.5% water absorption (same as AASHTO T 209). Other states use 1.2% or 2% water absorption as the trigger value. Another trigger measure in using dry back is the difference between dry mass and fan-dried mass; if the difference is more than 0.2 %, then the dry-back method will be used. 5. In achieving SSD condition, some states use CoreDry at low heat and dry at 125 F similar to AASHTO T 166 (section 6.1). Some other states allow the use of newspaper or wax-coated paper to speed up moisture removal. 2.5 Review of NCHRP 9-26 Phase 4 Study The NCHRP Project 9-26 Phase 4 study was conducted to determine precision estimates of volumetric properties including maximum specific gravity (Gmm) of asphalt mixtures with high absorptive aggregates. Additionally, the effect of short-term conditioning duration on the volumetric properties of the same mixtures was investigated. Two gradations of two sources of absorptive aggregates were used to prepare four asphalt mixtures. To develop precision estimates, loose mixtures were sent out to laboratories participating in the interlaboratory study (ILS); the participants were asked to perform the dry-back procedure on 3 replicates of each of the 4 mixtures and provide the data for analysis. To investigate the effect of conditioning duration on the volumetric properties, 2 replicates of each of the four mixtures were conditioned in the oven for various durations and the change in their volumetric properties including dryback Gmm was investigated. The dry-back results indicated an increase in Gmm of the mixtures with increase in conditioning duration, which might be caused by both stiffening of the asphalt binder and continued absorption of asphalt into the aggregate pores [2]. The statistical and physical significance of the differences between conventional and dry-back Gmm of the mixtures with highly absorptive aggregates from the NCHRP Project 9-26 Phase 4 9
16 study were reanalyzed for the evaluation of the trigger measures and trigger values used by the state DOTs. The results of the reanalysis will be discussed in Chapter 3. 10
17 CHAPTER 3 INVESTIGATION INTO NCHRP PROJECT 9-26 PHASE 4 DRY-BACK DATA Prior to performing a laboratory investigation, the dry-back data from the NCHRP Project 9-26 Phase 4 study are analyzed to investigate conditions when performing dry-back is necessary. As discussed in Chapter 2, several physical trigger measures are being used by the state DOTs for deciding if dry back should be performed. In addition, these data can be used to investigate the effects of several mixture variables such as aggregate gradation, aggregates absorption, and effective asphalt content on the significance of the difference between conventional and dry-back Gmm. The mass/volume data from the dry-back Gmm measurements were used for this investigation. The data correspond to four mixtures from two sources of absorptive aggregates and two gradations 9.5-mm and 19.0-mm NMAS. Source 1 aggregate has water absorption of about 5% and Source 2 aggregate has water absorption of about 4%. Both the ILS data and the conditioning time study data were reanalyzed. In the ILS, each of the four mixtures was tested by more than 20 laboratories; however, not all laboratories provided the complete set of raw dryback data. Therefore, not all of the results collected in the ILS could be reanalyzed for this study. For the conditioning time study, the data from four mixtures conditioned for 2, 4, 6, 8, 16, and 32 hours were reanalyzed. Since Gmm was increased with increase in conditioning time, it could also be assumed that the mixtures after each conditioning duration are independent of each other and their dry-back data could be treated as separate sets of data. For the investigation in this chapter, the dry-back and conventional Gmm data were compared and the significance of their differences are examined both statistically and from a practical view point using the state DOTs trigger measures. The relationships between the decisions made based on the statistical and physical criteria were evaluated to determine the applicability of the DOTs trigger measures and the trigger values for performing dry-back. 3.1 State DOTs Trigger Measures for Performing Dry-back As discussed in Chapter 2, several state DOTs use different trigger measures and values in place of aggregate absorption level (specified in AASHTO T 209) to decide if dry back should be performed. A summary of the criteria and their threshold values are as follows: 1. The single-operator d2s of AASHTO T 209. The within-laboratory precision estimate of AASHTO T 209 is used to decide when dry-back should be performed. If the difference between dry-back and conventional Gmm is larger than the single operator d2s of 0.011, then the states require performing the dry-back procedure. This trigger measure is referred to as Gmm difference. 2. The allowable percent difference of 1% between the conventional and dry-back Gmm values. If the difference between dry-back and conventional Gmm is larger than 1%, dryback is required. This is similar to trigger #1, but is expressed in terms of percent. This trigger is referred to as percent Gmm difference. 3. A maximum difference of 0.17%, 0.18%, or 0.2% (different values used by different states) between the final dry-back mass and the original dry mass. If the difference in dry 11
18 and dry-back mass is larger than the 0.17%, 0.18%, or 0.2% then dry back should be performed. This trigger is referred to as percent mass difference. 4. The maximum difference of 5 g between the original dry mass and the final dry-back mass. This is similar to trigger # 3, but is expressed in terms of absolute mass. This trigger is referred to as mass difference. 5. The allowable difference of 0.2% between air voids computed from the conventional and dry-back Gmm for a specific Gmb. If the difference exceeds 0.2%, dry back is required. This trigger is referred to as percent air void difference. 3.2 Evaluation of Trigger Measures and Trigger Values by Analysis of NCHRP Project 9-26 Phase 4 Data The Gmm data from the interlaboratory and conditioning studies of Phase 4 of NCHRP Project 9-26 were used to evaluate the trigger measures and their values by examining the significance of the difference between the dry-back and conventional Gmm both physically and statistically. The results of the analysis could determine the reliability of each trigger measure and its corresponding value. The statistical significance of the difference between conventional and dry-back Gmm was investigated using a two-sample t-test. The computed t-value was compared with the critical t- value at a 5% level of significance corresponding to a one-tail t-distribution. The one-tailed t distribution was used since the dry-back Gmm is always smaller than the conventional Gmm Comparison of Conventional and Dry-Back Gmm of NCHRP 9-26 Phase 4 ILS Four groups of data are available from testing of the four mixtures with absorptive aggregates (2 sources of aggregates x 2 gradations). Only the data sets with complete raw data could be used for this analysis. The number of data sets after eliminating the incomplete sets are as follows: 15 sets of data for the mixture with 9.5-mm NMAS gradation of Source 1 aggregate (S1-9.5), 14 seta of data for the mixture with 19.0 mm NMAS gradation of Source 1 aggregate (S1-19), 17 sets of data for the mixture with 9.5-mm NMAS gradation of Source 2 aggregate (S2-9.5), 15 sets of data for the mixture with 19.0-mm NMAS gradation of Source 2 aggregate (S2-19). The conventional and dry-back data and the significance of their differences from physical (i.e., the differences exceed the trigger values of the five criteria discussed in Section 3.1) and statistical stand points are shown in the tables of Appendix C. A summary of the percentages of cases where the difference between conventional and dry-back Gmm is significant (statistically or physically) are summarized in Error! Reference source not found.. The sample IDs 12
19 represent aggregate source (Source 1=1 or Source 2=2) and aggregate gradation (9.5-mm=9.5 or 19.0 mm= 19). The observations are discussed as follows: Table 3-1- Percentages of significant differences between conventional and dry-back Gmm in NCHRP Project 9-26 ILS based on statistical and physical criteria Mix ID # of Labs Statistic ally Significa nt Differen ce Mass Diff, Threshold 5 g Physically Significant Difference % Mass Diff, Threshold 0.17% Gmm Diff, Threshold % Gmm Diff, Threshold 1% % AV Diff, Thresho ld 0.2% S Number of Significant Differences S S S S % 7% 53% 40% 0% 100% Percentages of Significant Differences S % 57% 93% 79% 0% 100% S % 41% 65% 47% 6% 82% S % 27% 33% 20% 7% 100% Average 71% 33% 61% 46% 3% 96% S1-9.5 Mixture For the S1-9.5 mixture, the results of statistical analysis indicate that in 11 out of 15 laboratories, the difference between conventional and dry-back Gmm is significant. The trigger measures and their values indicated different decisions regarding the significance of the difference between conventional and dry-back data: o The mass difference trigger indicated that the difference between dry and dryback masses was significant in only laboratory # 4. o The percent mass difference exceeds the threshold of 0.17% in 8 out of 15 laboratories. Out of the 8 cases, there are 6 agreements with the statistical results. There are also 2 cases of agreement with statistical results where the differences between conventional and dry-back data are not practically significant. Therefore, there are a total of 8 cases where percent mass difference and statistical testing provide the same decisions. For this mixture, the threshold values of 0.18% and 0.2% provide a 7 and 6 cases of agreements with the statistical results, respectively. o The Gmm difference exceeds the threshold of in 6 laboratories. Out of the 6 cases, 4 agree with the statistical results. There are also 2 cases of agreements with statistical results where the differences between conventional and dry-back data are not practically significant. This totals to 6 agreements 13
20 S1-19 Mixture between statistical results and decisions based on Gmm difference. If the trigger value is decreased to 0.010, the number of agreements with the statistical results would increase to 7 cases. o None of the laboratories exceeded the percent Gmm difference of 1%. However, there are 2 cases of agreements with statistical results where the differences between conventional and dry-back data are not practically significant. The threshold value of 1% could be lowered to obtain a greater number of agreements with the decisions based on other physical trigger measures and the statistical criteria. A lower threshold value of 0.4% provides 6 agreements with the statistical results. o The percent air void difference exceeds the threshold value of 0.2% in all 15 laboratories. Out of the 15 cases of a significant difference, there are 11 agreements with the statistical results. By using a larger threshold value of 0.4%, the number of agreements with statistical results decreases from 11 to 7. For S1-19 mixture, statistical results show that the difference between conventional and dry-back Gmm is significant for 10 out of the 14 laboratories. The trigger measures indicated different decisions regarding the significance of the differences: o The mass difference trigger indicated that in 8 out of 14 laboratories the difference between dry and dry-back mass is more than 5 g. Out of the 8 cases, 6 agree with the statistical results. There are also 2 cases of agreements with the statistical results when the the differences are insignificant. This totals to 8 agreements between mass difference criteria and statistical results. o The percent mass difference is more than 0.17% in 13 out of 14 laboratories. Out of the 13 cases of significance, 9 agree with the statistical results. For the cases where the differences between conventional and dry-back are not significant, the percent mass difference and statistical criteria do not agree. Therefore, there are total of 9 cases where percent mass difference and statistical results provide the same decisions. If the threshold value changes to 0.2%, there would be the 8 cases of agreements with the statistical results. o The Gmm difference trigger exceeds in 11 laboratories. In 7 cases, decisions agree with the decisions based on statistical results. There is no case of agreement with statistical results when the differences are not significant. By using the threshold value to 0.010, the number of agreements with the statistical results increases to 9. o The percent Gmm difference shows that in none of the laboratories, the percent difference exceeds 1%. This threshold could be lowered to obtain better agreements with the decisions based on other trigger measures and statistical criteria. A threshold value of 0.4% provides 9 agreements with the statistical results. o The percent air void difference exceeds the threshold value of 0.2% in all 14 laboratories. Among these cases, there are 10 agreements with the statistical 14
21 S2-9.5 Mixture decisions. The fact that a larger number of significant differences are determined by the percent air void difference criteria than by other trigger measures might indicate that the threshold value of 0.2% is too low and can be increased. A threshold value of 0.4 % provides 9 agreements with the statistical results. For S2-9.5 mixture, statistical results show that the difference between conventional and dryback Gmm is significant for 11 out of the 17 laboratories. Different physical criteria indicated different decisions regarding the significance of the differences: S2-19 Mixture o The mass difference trigger measure indicates that in 7 out of 17 laboratories, the difference between dry and dry-back mass is more than 5 g. Out of the 7 significant cases, 6 agree with the statistical results. There are also 5 cases of agreement when the differences between conventional and dry-back Gmm are not significant. This totals to 11 cases of agreements. o The percent mass difference indicates that in 11 out of 17 laboratories, the difference between dry and dry-back mass is more than 0.17%. Out of the 11 cases, 8 agree with the statistical results. There are also 3 cases of agreements where the differences are not significant. Therefore, there are total of 11 agreements between the decisions based on percent mass difference measure and statistical criteria. For this mixture, the threshold value of 0.18% provide 10 agreements with the statistical results. o The Gmm difference shows that in 8 laboratories the difference between conventional and dry-back Gmm is more than In 6 of the 8 cases, the decisions agree with the statistical results. There are also 4 cases of agreement with statistical results when the differences are not significant. This totals to 10 agreements between statistical results and physical criteria of Gmm difference. By using the threshold value of 0.010, the number of agreements with the statistical results does not change. o The percent Gmm difference shows that in only 1 laboratory, the percent difference exceeds 1%. By decreasing the threshold to 0.4%, the number of agreements increases to 11. o The percent air void differences indicate that in 14 out of 17 laboratories, the difference in air voids exceeds the 0.2% threshold. Out of the 14 cases, 11 agree with the statistical results. There are also 3 cases of agreement with statistical results when the differences are not significant. This totals to 14 cases of agreement between the decisions based on air void difference and statistical analysis. By using the threshold of 0.4%, the number of agreements would decrease to 10 cases. For S2-19 mixture, statistical results show that the difference between conventional and dry-back Gmm is significant for 11 out of the 15 laboratories. The physical criteria indicated different decisions regarding the significance of the differences: 15
22 o The mass difference trigger indicates that in 4 out of 15 laboratories, the difference between dry and dry-back mass is more than 5 g. All 4 cases agree with the statistical results. There are also agreements with the statistical results in 4 cases when the differences between conventional and dry-back Gmm are not significant. Therefore, there is a total of 8 agreements between the decisions based on mass difference criteria and statistical analysis. o The percent mass difference indicate that in 5 out of 15 laboratories, the difference is more than 0.17%. All 5 cases agree with the statistical results. The percent mass difference and statistical results agree in 4 cases where the differences are not significant. Therefore, there are total of 9 out of 15 agreements between the decisions based on statistical and percent mass difference criteria. If the threshold value changes to 0.18%, there would be 8 cases of agreements with the statistical results. o The Gmm difference shows that in 3 laboratories the difference is more than In all three cases, the decisions agree with the statistical results. There are also 4 cases of agreement with statistical results when the differences are not significant. Therefore, there are total of 7 agreements between the decisions made based on statistical measure and Gmm difference criteria. By using the threshold value to 0.010, the number of agreements with the statistical results does not change. o The percent Gmm difference shows that in only 1 laboratory the percent Gmm difference exceeds 1%. By decreasing the trigger value to 0.4%, there would be 9 agreements with the statistical decisions. o The percent air void differences indicate that in all 15 laboratories, the difference in air voids exceeds the 0.2% threshold. Out of the 15 case, there are 11 cases of agreement with statistical results. There are no cases of agreement when the differences are not significant. If the threshold value is increased to 0.4%, the number of agreements would decrease to to Explanation of ILS Results The following explanations can be provided based on the above observations from the analysis of the ILS data: 1. Discrepancies between the decisions based on the physical and statistical criteria could be due to very small or very large differences in replicate values of either conventional or dry-back data groups. If the difference between replicates of one group is very small compared to the difference between the two groups, statistical analysis could determine that the difference between the two groups is significant, where it might not be a meaningful significance from physical standpoint. Conversely, if the differences between the replicates in one group are very large compared to the difference between the two groups, statistical analysis could determine that the difference between the two groups (conventional and dry-back Gmm) is not significant, where it might be significant from physical standpoint. 16
23 2. In the cases where the decisions based on the physical and statistical criteria are different and the values of the physical criteria are not close to the threshold value, it makes sense to make the decision based on the physical criteria. 3. In the cases where the decisions based on physical and statistical criteria are different but the values of the physical criteria are close to their threshold values, the threshold values are adjusted to obtain the same decision based on both physical and statistical criteria. 4. The trigger measure of mass difference and its threshold value do not appear reliable in detecting the dry-back condition. The trigger detected only a few significant differences between conventional and dry-back data. Moreover, using an absolute mass as a trigger measure might not be appropriate considering that the mass requirement is different for mixtures with different NMAS. 5. The trigger measure of percent mass difference provides the second best agreement with the statistical results (after the air void difference trigger). It seems that the threshold value of 0.17% provides more agreements with the statistical results than the threshold value of 0.18% and 0.20%. 6. The trigger value of for the trigger measure of Gmm difference indicated better agreement with the decisions from other trigger measures and those from statistical criteria than the trigger value of The trigger measure of air void difference with threshold value of 0.2% provide the most number of agreements with the statistical results. However, a threshold value of 0.4% provides the best agreement with the other trigger measures (percent mass difference and Gmm difference). Considering that the allowable difference between replicate air voids is 1% (±0.5% from the design air voids), the threshold of 0.2% seems rather small from practical stand point. 8. In summary, the following trigger values provide the best agreements between the decisions made based on the selected trigger measures: 0.17% for percent mass difference, for the Gmm difference, and 0.4% for the air void difference. Table 3-2 shows that by adjusting the threshold values for the Gmm difference and % air voids difference, the average percentages of physical significance become in better agreement with each other and with the average percentage of statistical significance. 17
24 Table 3-2- Percentages of significant differences between conventional and dry-back Gmm in NCHRP Project 9-26 ILS based on statistical and selected physical criteria with adjusted threshold values Number of Significant Difference Percentages of Significant Difference Mixture ID # of Labs Statistically Significant Difference Physically Significant Difference % Mass Diff, Threshold 0.17% Gmm Diff, Threshold % AV Diff, Threshold 0.4% S S S S S % 53% 47% 47% S % 93% 93% 93% S % 65% 59% 59% S % 33% 20% 27% Average 71% 61% 55% 56% 3.3 Analysis of NCHRP 9-26-Phase 4 Conditioning Time Data From the conditioning study, there are mass and volume data corresponding to the conventional and dry-back Gmm of 20 mixtures: 2 aggregate sources x 2 aggregate NMAS x 5 conditioning durations. The significance of the difference between conventional and dry-back data of the conditioning study were evaluated statistically and using the three trigger measures selected based on the analysis of the NCHRP 9-26 (Phase 4) ILS data: percent mass difference (trigger value=0.17%), Gmm difference (trigger value=0.010), and air void difference (trigger value=0.4%). The decisions based on these trigger measures showed the best agreement with each other and with the statistical decisions. The results of the comparisons are shown in Table 3-3 through Table 3-6. The values of the trigger measures are provided in Columns 4, 7, and 10 of each table. The P-values for the statistical significance are provided in Column 11. A P-value smaller than 0.05 would indicate a statistically significant difference between conventional and dry-back Gmm values. In the table, the numbers in the sample IDs represent aggregate source (1 or 2), aggregate gradation (1=9.5-mm, 2=19.0 mm), replicate (1 or 2), aging duration (2=2 hr., 4= 4 hr., 8=8 hr., 16=16 hr., 32=32 hr.), respectively. The cases of significant difference are shaded grey. 18
25 Table 3-3 shows the results of comparisons of conventional and dry-back Gmm data for the mixture with 9.5-mm NMAS of Source 1 aggregate. The shaded values of the trigger measures indicate that the differences between the dry-back and conventional Gmm are significant for 2-hr., 16-hr., and 32-hr. conditioned mixtures. The statistical analysis agreed on the significance of the differences for 2-hr. and 32-hr. conditioned mixtures. Table 3-3- Evaluation of significance of difference between conventional and dry-back Gmm values from physical and statistical standpoints for mixtures with 9.5 mm NMAS of Source 1 aggregates Diff. Diff. Dry-back & %Diff. Dry-back & %Air Air Drybacback Dry- Conventional Air Dry and Dry-back Conventional Conventional Gmb Void- Dry Voids Mass Gmm Gmm Conventional Dryback Wt. Wt. Gmm (Allowable=0.4%) (Threshold=0.17%) (Allowable= 0.010) Sample ID P-value Two- Sample t-test Table 3-4 provides the results of comparisons for the mixture with 19-mm NMAS of Source 1 aggregate. The shaded values of the trigger measures indicate that the differences between the dry-back and conventional Gmm are significant for 2-hr., 8-hr., and 32-hr. conditioned mixtures. However, the statistical analysis shows a significant difference only for the 2-hr. conditioned mixture. 19
26 Table 3-4- Evaluation of the significance of difference between conventional and dry-back Gmm values from physical and statistical standpoints for mixtures with 19 mm NMAS of Source 1 aggregates Diff. Diff. Dry-back & %Diff. Dry-back & %Air Air Drybacback Dry- Conventional Air Dry and Dry-back Conventional Conventional Gmb Void- Dry Voids Mass Gmm Gmm Conventional Dryback Wt. Wt. Gmm (Allowable=0.4%) (Threshold=0.17%) (Allowable= 0.010) Sample ID P- value Two- Sample t-test Table 3-5 provides the results of comparisons of the conventional and dry-back Gmm for the mixture with 9.5- NMAS of Source 2 aggregates. The differences between conventional and dry-back Gmm are significant for all conditioning durations based on both physical and statistical criteria. 20
27 Table 3-5- Evaluation of the significance of difference between conventional and Gmm values from physical and statistical standpoints for mixtures with 9.5 mm NMAS of Source 2 aggregates Diff. Diff. %Diff. Dry-back & %Air Dry-back & Air Drybacback Dry- Dry and Dry-back Conventional Conventional Gmb Void- Conventional Air Dry Mass Gmm Gmm Conventional Dryback (Allowable=0.4%) Voids Wt. Wt. Gmm (Threshold=0.17%) (Allowable= 0.010) Sample ID P- value Two- Sample t-test Table 3-6 provides the comparison of conventional and dry-back data for the mixture with 19-mm NMAS of Source 2 aggregates. As indicated, based on the values of the trigger measures, the differences between conventional and dry-back Gmm are significant for all but 32-hr conditioned mixtures. The results of the statistical analysis indicate that the differences are significant for all but 2-hr and 32-hr conditioned mixtures. 21
28 Table 3-6- Evaluation of the significance of difference between conventional and Gmm values from physical and statistical standpoints for mixtures with 19 mm NMAS of Source 2 aggregates Diff. Diff. Dry-back & %Diff. Dry-back & %Air Air Drybacback Dry- Conventional Air Dry and Dry-back Conventional Conventional Gmb Void- Dry Voids Mass Gmm Gmm Conventional Dryback Wt. Wt. Gmm (Allowable=0.4%) (Threshold=0.17%) (Allowable= 0.010) Sample ID P- value Two- Sample t-test
29 Thus, the trigger measures and statistical results agree in the majority but not all cases. As mentioned before, the reason for the discrepancy could be that the differences between the replicates of each group (conventional and/or dry-back) are either too large or too small relative to the difference between averages of the two groups. 3.4 Selected Trigger Measures and Trigger Values The analysis of NCHRP 9-26 (Phase 4) conditioning time study data confirmed the applicability of the three trigger measures that were selected as the most reliable measures from the analysis of NCHRP 9-26 (Phase 4) ILS data. The selections of the trigger measures were made based on obtaining the best agreements between their corresponding decisions and the decision from statistical analysis regarding the significance of the difference between conventional and dryback data. Below is a summary of the selected trigger measures and trigger values. The trigger measure of percent difference between dry and dry-back mass with the trigger value of 0.17%. A percent difference between dry and dry-back mass of more than the threshold value of 0.17% is considered significant, which requires performing of the dryback procedure. The allowable difference between conventional and dry-back Gmm. The trigger value of which is slightly smaller than the AASHTO T 209 single-operator d2s (0.011) is selected as the trigger value. The maximum allowable difference in air voids has a meaningful and practical application for acceptance and quality assurance of asphalt mixtures. A maximum difference of 0.4% in air voids computed using conventional and dry-back Gmm (assuming constant Gmb) is found to be an appropriate threshold value for deciding if dry-back is required. This threshold value is less than half of the allowable difference between replicate air void values (±0.5% from design). 3.5 Investigating Effect of Various Mixture Properties on the Differences between Conventional and Dry-back Data Using NCHRP 9-26 (Phase 4) Conditioning Time Study Data In previous section, it was found that the difference between conventional and dry-back air voids is a reliable physical criterion for deciding if the difference between conventional and dry-back Gmm are significant. Examining the difference between air voids computed from conventional and dry-back Gmm measured after various conditioning times could reveal some information regarding the effect of aggregate absorption, gradation, and effective binder content on both conventional and dry-back Gmm measurements. Figure 3-1 shows the effect of aggregate source and gradation on the differences between air voids calculated from conventional (without dry-back=w/o DB) and dry-back (with dry-back=w/ DB) Gmm for different conditioning durations. A dash red line in the graph represents the allowable tolerance of 0.4% in air voids difference (established in previous section). Any value exceeding 0.4%, would indicate that the difference between conventional and dry-back data is significant. Several observations can be made from the graphs. 23
30 The top graph of Figure 3-1 indicates that for the mixtures with 9.5-mm NMAS, the differences between conventional and dry-back air voids are more significant for the mixtures with Source 2 aggregates than for the mixtures with Source 1 aggregates. This is contrary to the expectation that the conventional and dry-back air voids should be more different for mixtures with more absorptive aggregates. An investigation into this indicated that although Source 1 aggregates were more absorptive than Source 2 aggregates, the mixtures with Source 1 aggregate have more effective asphalt binder than the mixtures with Source 2 aggregate (Figure 3-2). Higher effective binder indicates better coating of aggregates and therefore, less difference between conventional and dryback results. This could indicate that adequate effective asphalt content could reduce the effects on Gmm caused by high level of absorption of the aggregates. Comparison of the differences between conventional and dry-back air voids of mixtures with 9.5-mm and 19.0-mm NMAS mixtures of Source 2 aggregate in the top and bottom graphs of Figure 3-1 shows that more number of differences are significant (exceeding 0.4% threshold) for the mixtures with 9.5-mm NMAS than for the mixtures with mm NMAS. This could indicate that mixtures with finer gradation retain more moisture than the mixtures with coarser gradation. This moisture might be mistakenly considered as the moisture in aggregate pores, which would increase the difference between conventional and dry-back air voids. A longer drying time might be considered for mixtures with finer gradation to ensure SSD has been achieved. For the 9.5-mm mixture with Source 1 aggregate (top graph in Figure 3-1), there is a trend of decrease in air void differences with increase in conditioning time from 2 to 8 hours of conditioning. Nevertheless, with further increase in conditioning, the difference in air voids start to increase and reaching a maximum for the 32-hour conditioned mixture. This might indicate that with up to 8 hours of conditioning more asphalt have been absorbed into the pores which have caused less water being absorbed during vacuum suction. However, conditioning in excess of 8 hours might have caused brittleness and cracking of asphalt film resulting in seepage of moisture into aggregate pores during vacuum suction. For the 9.5-mm mixture with Source 2 aggregate (top graph in Figure 3-1), there is a similar trend of decrease in air voids differences with the increase in conditioning time up to 8 hours, which is then followed by an increase in air voids differences for the 16-hr. conditioned mixture. However, the increase in air voids differences is not seen for the 32- hr. conditioned mixture. This is probably due to significant stripping and loss of binder films during vacuum suction, which would affect conventional Gmm as well as the dryback Gmm. The lower effective binder of the mixture with Source 2 aggregates is speculated to be the cause of stripping when mixture is conditioned for 32 hours. There is no specific trend in the differences between the air voids computed from conventional and dry-back Gmm of the mixtures with 19.0-mm gradation of either Source 1or Source 2 aggregates conditioned for various durations (bottom graph of 24
31 Figure 3-1). This might indicate that mixtures with coarser gradation are less affected by the changes in the level of water absorption as a function of conditioning time than mixtures with finer gradation. Difference in Air Voids, 9.5-mm w/o DB-w/DB Difference in Air Voids, % Conditoining Time, hrs S1-9.5 S2-9.5 Allowable Difference in Air Voids, % Difference in Air Voids, 19-mm w/o DB-w/DB Conditoining Time, hrs S1-19 S2-19 Allowable Figure 3-1-Effect of aggregate source (absorption level) and aggregate gradation on differences in air voids calculated from conventional (without dry-back= w/o DB) and dry-back (with dry-back=w/ DB) Gmm for different conditioning durations 25
32 Effective Asphalt Content, % Effective Asphalt at Various Conditioning Time 9.5-mm Mixture Conditioning Time, hr Source 1 Source 2 Figure 3-2-Change in effective asphalt content with increase in conditioning time for 9.5-mm mixtures 26
33 CHAPTER 4 LABORATORY INVESTIGATION The laboratory investigation aimed to explore methods to improve the dry-back procedure by testing mixtures with components such as absorptive aggregates, slag aggregates, and recycled pavement, which are known to contribute to the use of the dry-back procedure. The mixtures were tested according to the AASHTO T 209 dry-back procedure and two alternative procedures with potential for reducing the subjectivity of the process and accelerating the procedure. A new criterion is introduced to reduce the efforts involved during the T 209 dry-back process. The selected mixtures, the performed tests, and the modified criterion are discussed in this chapter. 4.1 Selection of Materials Error! Reference source not found. presents the materials used in this study. The materials were selected based on the results of the survey of the state DOTs (Chapter 2). The mixtures that are typically subjected to dry-back procedure due to having absorptive aggregates, RAP materials, and slag aggregates were obtained from the states who participated in the survey. A total of 11 mixtures were received from 8 state DOTs for the study. Additionally, one mixture was obtained from the 2015 ALF Fatigue experiment. Error! Reference source not found. also presents the five categories to which each mixture would correspond. The variables of the 12 mixtures are shown in Table 4-2; the mixtures cover a wide range of variables: aggregate gradation, aggregate absorption, binder grade, slag content, and RAP content. Table 4-1 Material types and mixture IDs Materials Type Mixtures UT-3 Control Mixture- Aggregate absorption below 1.5 CO Mixture with Aggregate Absorption >2% and <3% MO-6 Mixture with Aggregate Absorption >3 % Mixture with Slag Aggregate Mixture with RAP NC WV-2 WV-2B MO-6B UT-4 ALF NE MS FL 27
34 Table 4-2- Properties of the mixtures tested in this study ID State Mix. ID NMAS, mm Binder PG 1 NC Agg. Abs. % RAP, % RSF9.5A % 2 WV % 2B WV % 3 UT w/o RAP US % Slag % - 59% 15% - 4 UT w/rap SR % - 5 ALF Lane % - 6 MO SP % 9% 6B MO SP % - 7 CO FBR % - 8 FL SP B (TL-C) % - 9 NE NH-80-9(80) % - 10 MS ST % Testing of Mixtures The 12 mixtures were tested according to three methods. First, they were tested according to Section 15 of AASHTO T 209, Supplemental Procedure for Mixtures Containing Porous Aggregates. Second, the mixtures were dried back using the CoreDry device, which is used by several state DOTs for rapid drying of aggregates. Third, the mixtures were dried back using a rotating tumbler to accelerate the drying process. Two replicates of each mixture were prepared for each test according to Section of 9 of AASHTO T 209. Testing of the mixtures according to the dry-back procedure of AASHTO T 209 was performed at Specialized Engineering s facility in Hanover, Maryland. Testing of the mixtures using the CoreDry and rotating tumbler methods was performed at Pavement Systems laboratory. A summary of each method is given below. 28
35 4.2.1 AASHTO T 209 Dry-Back Procedure The complete set of steps for measuring maximum specific gravity of the 12 asphalt mixtures according to the dry-back procedure of AASHTO T 209 is provided in Appendix B. The dryback procedure involves first draining the water from the sample. The sample is then spread on a flat surface in front of a fan to remove the surface moisture. The mass of the sample is then determined at 15-min intervals. The sample is occasionally stirred between the measurement intervals for consistent drying. When the loss in mass is less than 0.05% for an interval, the sample is considered surface dry. This procedure requires about 2 hr Accelerated Methods With the increased use of recycled pavements in the design of asphalt mixtures, the possibility of having exposed aggregate surfaces makes performing the dry-back procedure inevitable. During the busy schedule of the state DOTS during the construction season, spending 2 hours or more on performing the dry-back procedure could be overwhelming. Therefore, it is desirable to explore if the dry-back procedure can be accelerated and if the accelerated method could serve as a reliable alternative to AASHTO T 209 dry-back procedure. Two different methods are explored here for possible reduction of the drying time: a method involving CoreDry device and a method involving a rotating tumbler [5]. CoreDry for Rapid Drying Back Several state DOTs use CoreDry to speed the dry-back process of Gmm mixtures. Setting 1 of the device, which is the same setting used for drying field cores and compacted mixtures with a vacuum level of 10 mmhg and low heat level of 120ºF is used by the states and also explored in this study for drying back of Gmm mixtures. Mixture samples are placed inside a cylindrical basket that is placed inside the incubator of the CoreDry device. The mixture is subjected to several drying intervals. Each interval includes ten 1.7-min cycles of vacuum, accompanied by low level heat. The mass of the wet mixture before and after each drying interval is measured to determine the Saturated Surface Dry (SSD) mass of the mixture. Accelerated Method using Rotating Tumbler A set up including a rotating tumbler and a conventional air blower was used for the accelerated drying back of the Gmm samples. The rotating tumbler, also known as aggregate washer, holds a cylindrical bucket that rotates at a speed of 30 revolutions per minute and uniformly tumbles its content. The aggregate washer was examined as part of the NCHRP [16] study and is currently used by several state DOTs for conventional Gmm measurements. NCHRP showed that the aggregate washer was effective for releasing the entrapped air during the vacuum suction process due to constant agitation. Figure 4-1 shows the rotating tumbler setup for the accelerated dry-back process. The following explains the steps for performing the accelerated drying back process: After the mixture is weighed in water, it is drained over a #200 sieve. Care is taken not to lose any particles of the mixture. The mixture is then transferred to the tumbler bucket (this step is avoided if aggregate washer was also used for vacuum suction). The mass of the bucket and the wet mixture is recorded and the bucket is placed in the tumbler to be rotated. An air blower, such as a conventional hair dryer, positioned on a stand, blows room temperature air to the mixture inside the rotating bucket. The tumbler is stopped at various intervals and the mass of bucket and 29
36 its contents is measured and recorded. The first mass measurement is after a 15-min drying interval. The subsequent measurements are performed at 5-min intervals until SSD condition is reached. To determine the SSD condition, a criterion in addition to the AASHTO T 209 criterion is utilized. The percent mass difference of 0.17 %, which was selected as a reliable trigger measure for deciding if dry-back is necessary in Chapter 3, can also serve as a criterion for determining if SSD condition has been reached. After the first drying interval, which is 15 min., the dry-back mass is checked against the original dry mass by calculating percent mass difference. If the difference of dry-back and dry mass is 0.17% or less, the final mass is considered the SSD mass. If the difference of dry-back and dry mass is more than 0.17%, the drying continues in 5-min intervals and the mass is checked after each interval. When the change in mass for an interval is 0.05% or less (the same criterion as T 209), the SSD condition has been reached and the final mass at that point is considered the SSD mass. 4.3 Modified SSD Criteria for Reducing Dry-back Time and Effort of AASHTO T 209 Use of percent mass difference in combination with the T 209 criterion provides a major advantage in reducing the time and effort of the current T 209 dry-back procedure. Since at the initial stages of drying, only the surface water is being lost, knowing the rate at which the moisture is being dried is not necessarily important. Therefore, frequent mass measurements for an initial period can be eliminated. Consequently, the first drying interval can be lengthened, e.g., to 60 min without any mass measurements. The percent difference between the dry-back mass and dry mass after the 60-min drying period will provide an assessment of the amount of remaining moisture. At this stage the majority of the surface moisture is dried and the remaining moisture is in either fine conglomerates or inside aggregate pores. A percent mass difference of less than 0.17% would indicate that the remaining moisture is not significant and the drying process can be stopped. A percent mass difference of greater than 0.17% would indicate that drying back should be continued, but at smaller time intervals, e.g., 15 min. At this stage the application of the T 209 criterion is important for identifying the SSD condition. A percent mass loss in an interval that is less than 0.05% (as specified in AASHTO T 209) would indicate the SSD condition has been reached. 30
 for accelerated dry-back")
37 Figure 4-1- Rotating tumbler (also known as Aggregate Washer) for accelerated dry-back 31
38 CHAPTER 5 RESEARCH RESULTS In this chapter the results of testing the 12 mixtures according to the AASHTO T 209 dry-back method, and with the CoreDry device and the accelerated rotational tumbler device, are discussed. The factors affecting the time to reach SSD are investigated. Moreover, the correlations between the dry-back data corresponding to AASHTO T 209 and the accelerated tumbler method are explored. 5.1 Results According to AASHTO T 209 Dry-Back Table 5-1 provides the replicate values of the conventional and dry-back Gmm of the 12 mixtures tested according to AASHTO T 209. The differences of the conventional and dry-back Gmm are provided in the last column of the table. The table indicate that the differences between dry-back and conventional Gmm of one or both replicates of five of the mixtures are physically significant; i.e., the difference exceeds the threshold of (established in Chapter 3). The samples with significant difference between their conventional and dry-back Gmm are highlighted grey in Table 5-1 and correspond to the following mixtures: two mixtures from Utah, the ALF mixture, the two mixtures from MO, and the mixtures from CO and MS. Four of the five mixtures that showed significant difference between the dry-back and dry Gmm have different percentages of RAP and aggregates with absorption level of above 1.5%. However, contrary to the expectation, UT#3 and CO mixtures with no RAP or absorptive aggregates, which served as control mixtures, exhibited a significant difference between the conventional and the dry-back Gmm values. On the other hand, the NC mixture with highly absorptive aggregates (5.6%), WV mixtures with 59% and 15% of slag, and the NE mixture with 30% RAP did not indicate a significant difference between the conventional and dry-back Gmm values. This suggests that the percentage of RAP, level of aggregate absorption, and percentage of slag content, are not by themselves defining factors for use of dry-back. The effect of these factors most probably have been offset by adequate effective asphalt, which has covered any exposed aggregates surfaces. 32
39 Table 5-1 Gmm results according to T 209 dry-back method ID State NMAS, mm Binder PG Agg. Abs. % Slags % RAP, % 1 NC Average Dryback Gmm Average Conventional Gmm Difference (Dryback- Conventional) WV w/slag 9.5 PG % B WV w/slag 9.5 PG % UT w/o RAP % UT w/rap % ALF % 6 MO % 6B MO % 7 CO % 8 FL % 9 NE % 10 MS %
40 The importance of aggregate absorption and RAP content on Gmm differences of the 12 mixtures is also examined graphically. The relationship between the differences and the aggregates absorption level and between differences and percent RAP content for the 12 mixtures are shown in Figure 5-1. As seen from the figures, the R 2 values for both relationships are very small, indicating that aggregate absorption and RAP content have no effect on the differences between the conventional and dry-back Gmm values of the mixtures in this study. Differences between Regular and Dry-back Gmm vs. Aggregate Water Absorption Gmm Difference R² = Aggregate water absorption, % Gmm Difference Differences between Regular and Dry-back Gmm vs. Amount of RAP R² = % 5% 10% 15% 20% 25% 30% 35% Percentage of RAP Figure 5-1-Relationship of the difference between conventional and dry-back Gmm with the level of aggregate absorption (Top graph) and amount of RAP (bottom graph) Dry-Back at Mixture Design Use of the dry-back procedure requires a lot more care and effort than performing conventional Gmm measurements. It takes an extra 2 hrs. of the technician time and the results are generally 34
41 more variable than the Gmm values from conventional method. Therefore, it is preferable to avoid using dry-back when it is not absolutely necessary to perform it. The literature suggests that the effects from aggregates with high level of absorption, slags, and RAP on maximum specific gravity measurements could be offset by using adequate binder to fill the pores and to cover the exposed surfaces of the aggregates [4]. Therefore, if the amount of asphalt is optimized in a mix design, conventional and dry-back procedures of AASHTO T 209 likely would not provide significantly different Gmm values. For mixtures containing aggregates with known absorption level, optimizing the design for adequate effective binder is a straightforward task. The binder content can be adjusted until the difference between conventional and dry-back Gmm values are not significant. However, for mixtures with RAP, due to uncertainty with the quality of RAP materials, optimizing the mix design does not provide the certainty that the surface of aggregates would not be exposed during production. For these mixtures performing the dry-back procedure on a regular basis cannot be avoided Relationship between Time to SSD Condition and Mixture Variables The supplemental procedure of T 209 infers that a mixture has reached SSD condition when the change in the retained moisture, between the 15-min interval measurements, is 0.05% or less. The procedure states that this process takes about 2 hours. Although the majority of the mixtures in this study reached the SSD condition, the time it took for each mixture to exhibit 0.05% or less mass change in consecutive measurements was different. For some mixtures the SSD condition was reached before 2 hours and for other mixtures the SSD condition was not reached after 3 hours of drying. Relationship between Time to SSD and Aggregate Absorption To explore the possible reasons for the prolonged drying of some of the mixtures, the relationships between time of drying (to 0.05% mass change) and aggregate absorption level and percent RAP in the mixture were explored. Figure 5-2 shows a graphical representation of the relationships. As shown from the figure, there are no relationships between SSD time and aggregate absorption level and between SSD time and mixtures RAP amount. This suggests that aggregate absorption and RAP content are not necessarily the determining factor for the length of the drying process. 35
42 Time to 0.05% Moisture, min Time to 0.05 % Moisture vs. Aggregate Water Absorption R² = Aggregate water absorption, % Time to 0.05% Moisture vs. Percent RAP Time to 0.05% Moisture, mm R² = % 5% 10% 15% 20% 25% 30% 35% Percent RAP Figure 5-2- Relationships between Time to SSD and level of aggregate absorption and the amount of RAP Relationship between Time to SSD and Aggregate Gradation In a continued search for the possible causes of various SSD times, the effect of aggregate gradation was investigated. Figure 5-3 shows the relationship between SSD time and various aggregate gradation variables such as nominal maximum aggregate size (NMAS) and percent passing of different sieve sizes. As indicated from the figure, other than the small relationship between SSD time and percent passing #100 (R 2 = 0.30), the relationships between SSD time and aggregate gradation parameters are not significant. 36
43 Time to 0.05% Moisture, min Time to 0.05 % Moisture vs. NMAS R² = NMAS, mm Time to 0.05% Moisture, mm Time to 0.05% Moisture vs. Percent Passing # R² = Passing #30,% Time to 0.05% Moisture, mm Time to 0.05% Moisture vs. Percent Passing # R² = Passing #4,% Time to 0.05% Moisture, min Time to 0.05 % Moisture vs. Percent Passing # R² = Passing #50, % Time to 0.05% Moisture, mm Time to 0.05% Moisture vs. Percent Passing # R² = Passing #8,% Time to 0.05% Moisture, min Time to 0.05 % Moisture vs. Percent Passing # R² = Passing #100, % Time to 0.05% Moisture, mm Time to 0.05% Moisture vs. Percent Passing # R² = Passing #16, % Time to 0.05% Moisture, min Time to 0.05 % Moisture vs. Percent Passing # R² = Passing #200, % Figure 5-3- Relationship between time to SSD condition and various variables of aggregate gradation Relationship between Time to SSD and Mixture Gradation Although gradation of aggregates did not show significant correlation with the time to SSD, the laboratory observations suggested that mixture gradation could be a factor affecting the time to SSD condition. The effect on moisture retained in fine conglomerates of mixture has been also 37
44 stated in the TX DOT specification [15]. To investigate the effect of mixture gradation, loose mixtures of the 12 mixtures were sieved over # 8 sieve. The average percent passing #8 sieve and the average time to 0.05% change in moisture are provided in Table 5-2 and shown in Figure 5-4. As indicated from the figure, there is a high correlation (R 2 = 0.70) between the time of drying and percent of mixture passing the # 8 sieve, meaning that it would take a longer time for mixtures with more fine particles to reach the SSD condition. For example, for the Colorado mixture with 23.9% passing #8 sieve, it takes min to reach SSD condition while for the ALF Lane 9 mixture with 1.9% passing #8 sieve it only takes 104 min to reach SSD condition. Table 5-2-Mixture percent passing #8 sieve and time to AASHTO T 209 saturated surface Dry time for the 12 mixtures in this study Mixture Source Mixture % Passing #8 AASHTO T 209 Time to 0.05% Consecutive Moisture Loss, min NC WV WV UT w/o RAP UT w/rap ALF MO MO CO FL NE MS Time to T209 SSD Condition vs. Mixture Percent Passing #8 Time to 0.05% Moisture, min R² = Mixture Percent Passing #8 Figure 5-4-Relationship between time to T 209 SSD condition and percent of mixture passing #8 sieve 38
45 The above observations suggest that a prolonged drying time may not be always associated with moisture seeping into the pores. Rather, the moisture within fine agglomerates and the moisture surrounding the fine particles could be causing a prolonged drying time. However, unlike the moisture that seeped into the pores, the moisture on the surface of fine aggregates would be dried out within a practical drying time, i.e., 2 to 3 hours by means of air flow and agitation. For this reason, it is important to allow sufficient drying time to reach the SSD conditions so that the persistent moisture between fine particles is not misinterpreted as moisture in the aggregate pores. Relationship between Mixture Gradation and Aggregate Gradation To evaluate if aggregate class sizes correspond to the percent mixture passing # 8 sieve, the relationships between the percent passing #8 sieve of the 12 mixtures with the percent of aggregates passing #4 and smaller sieve sizes were explored. Figure 5-5 provides the correlations. As shown from the figure, all correlations are rather small. The largest correlation is with aggregate percent passing #16 (R 2 =0.30), which could be a random effect. The low correlation between the finer portion of aggregate and mixture gradations is reasonable since the finer particles of a mixture are random coagulation of various size fine aggregates. 39
46 Mixture Percent Passing #8 vs. Aggregate Percent Passing #4 Mixture Percent Passing #8 vs. Aggregate Percent Passing #30 Mixture Percent Passing # R² = Aggregate Percent Passing #4 Mixture Percent Passing # R² = Aggregate Percent Passing #30 Mixture Percent Passing #8 vs. Aggregate Percent Passing #8 Mixture Percent Passing #8 vs. Aggregate Percent Passing #50 Mixture Percent Passing # R² = Aggregate Percent Passing #8 Mixture Percent Passing # R² = Aggregate Percent Passing #50 Mixture Percent Passing #8 vs. Aggregate Percent Passing #16 Mixture Percent Passing #8 vs. Aggregate Percent Passing #200 Mixture Percent Passing # R² = Aggregate Percent Passing #16 Mixture Percent Passing # R² = Aggregate Percent Passing #200 Figure 5-5-Correlations of mixture percent passing #8 sieve with the aggregate percent passing #4 and smaller sieve sizes Modified SSD Criteria It is possible to reduce the effort and time involved in drying back the mixture according to the AASHTO T 209 supplemental procedure using modified criteria. In Chapter 3, percent mass difference as well as percent air voids difference and Gmm difference were found to be effective trigger measures for determining if dry-back is needed. Since any of these measures determine the significance of the effect of the retained moisture from a practical stand point, they can also serve as criteria in determining if the amount of moisture left during the dry-back process is significant. The percent mass difference, in particular, is effective in determining the SSD condition since it can be readily calculated at the time of drying by subtracting the dry-back mass from the original dry mass. It was also shown in Chapter 3 that a decision on the significance of the difference between dry-back and original dry mass was in good agreement with the decision 40
47 regarding the significance of the difference between conventional and dry-back air voids, which serves as an important quality control and acceptance parameter. In this respect, percent mass difference is selected as a criterion for determining the SSD condition. If a mixture, during the dry-back process, reaches within 0.17% or less of its original dry mass, it can be stated that the SSD mass would not be significantly different from the original dry mass and, therefore, the dry-back process can be stopped. The final mass is used as the SSD mass. However, if the difference between the dry-back mass and original mass remains more than 0.17% of the original mass for several subsequent mass measurements, the SSD condition is determined using the T 209 criterion. When the change in mass is less than 0.05% for an interval, SSD is reached. In a case, where the mass loss in the interval is less than 0.05%, but the percent mass difference is more than 0.17%, the resulting dry-back Gmm would be significantly different from the conventional Gmm. Use of percent mass difference as a SSD criterion may reduce the effort during the dry-back process. To find out if the dry-back mass is less than or more than the threshold value (0.17% of the original mass), the mass measurements do not have to be performed as frequently as after each 15-min interval. There can be longer intervals and less frequent measurements. For example, an initial time interval of 60 min followed by several 15-min. intervals can be used. The percent mass difference is calculated after each drying interval. If the difference is 0.17% or less, the process can be stopped and the final mass is taken as the SSD mass. If the difference is more than 0.17%, then additional 15-min drying intervals are performed until the change in mass is 0.05% or less for an interval. To investigate the applicability of the percent mass difference trigger measure and its threshold value as a SSD criterion, the time to percent mass difference of 0.17% was correlated to the T 209 time to SSD (time to 0.05% consecutive mass loss) for the 12 mixtures. Figure 5-6 shows the relationship. The figure shows that the correlation between the two sets of drying times is good (R 2 =0.81). For the majority of the mixtures, 0.17% criterion provides a shorter time to SSD than the T 209 criterion (0.05%). This suggests that the dry-back process could be stopped earlier and that the dry-back mass would not be significantly different from the original dry mass. 41
48 Time to 0.05% change in moisture, min Relationship between Time to 0.17% Difference from Dry Mass and Time to 0.05% Mass Loss in an Interval R² = Time to 0.17% retained Moisture, min Figure 5-6-Relationship between AASHTO T 209 SSD time based on the threshold of 0.05% mass loss in an interval and time to reach 0.17% difference between original and final mass 5.2 Results of CoreDry The 12 mixtures in this study were dried back using the CoreDry device to explore if the device can be considered for reducing the time and effort of the dry-back process. CoreDry applies a 10 mm Hg vacuum at 120ºF, which is typically used to rapidly dry the compacted samples after bulk specific gravity measurements. The percent moisture loss per 10-cycle interval (equivalent to 17 min.) for the 12 mixtures are shown in Figure 5-7. It is important to note that in each operation, about half of each mixture was dried back (approximately 1000 g). Figure 5-7 shows that the drying time of the samples using CoreDry are approximately half of the time reported for the mixtures tested according to AASHTO T 209 dry-back procedure (Table 5-3). For example, the dry-back time of AASHTO T 209 procedure for the NC mixture is min. and the CoreDry drying time for the half-sized sample of the same mixture is 78.2 min. (46 cycles x 1.7 min./cycle). Considering the size of the samples tested using CoreDry, it can be stated that CoreDry does not provide saving in the time of the drying back process. The drying patterns of the mixtures using CoreDry are also shown in Figure 5-7. A decreasing exponential trend for loss of moisture with time (or cycle), similar to the trend observed for the dry-back process of AASHTO T 209, can be seen from the graphs. However, note that for some mixtures, the percent moisture loss does not consistently follow the exponential trend and there is occasional reduction of percent loss during one or more drying intervals. For example, for the NE mixture, the percent moisture loss shows a consistent decrease during the first two 10-cycle intervals; however, during the third 10-cycle interval the percent moisture loss is considerably smaller than the percent loss in previous intervals. In the fourth 10-cycle interval, the percent moisture loss increases and follows the exponential trend. 42
49 This observation might be explained by the CoreDry mechanism. The CoreDry vacuum may be more effective in drying moisture in the outer edge of the samples than in the inner core. The drying of the inner core would take place at a slower rate than the outer edge. The rate of drying in the inner core increases when there is considerable loss of moisture in the outer core. Therefore, the rate reductions observed for some mixtures are probably due to transition of vacuum from outer edge to the inner core after the outer edge has considerably dried out. This mechanism would work well for the compacted mixtures since moisture does not penetrate into the core of the samples. However, for the un-compacted mixtures moisture needs to be dried consistently throughout the sample. Another limitation of the CoreDry is possibility of missing the SSD point. Due to the high vacuum, after the surface moisture is removed, the moisture in the pores are exposed to vacuum. The mixture could pass the SSD condition within a relatively short period of time due to suction of moisture out of the pores. This is not desired since the purpose of drying back is to determine the mass at the SSD point. 43
50 Percent Moisture Loss per 10 CoreDry Cycles NC Mixture Percent Moisture Loss per Ten CoreDry Cycles WV-2 Mixture Percent Moisture Loss per Ten CoreDry Cycles WV-2B Mixture Moisture Loss, % Cycles Moisture Loss, % Cycles Moisture Loss, % Cycles Percent Moisture Loss per Ten CoreDry Cycles UT-3 Mixture Percent Moisture Loss per Ten CoreDry Cycles UT-4 Mixture Percent Moisture Loss per Ten CoreDry Cycles ALF Mixture Moisture Loss, % Cycles Moisture Loss, % Cycles Moisture Loss, % Cycles Percent Moisture Loss per 10 CoreDry Cycles MO-6 Mixture Percent Moisture Loss per 10 CoreDry Cycles MO-6B Mixture Percent Moisture Loss per 10 CoreDry Cycles CO Mixture Moisture Loss, % Moisture Loss, % Moisture Loss, % Cycles Cycles Cycles Percent Moisture Loss per 10 CoreDry Cycles FL Mixture Percent Moisture Loss per Ten CoreDry Cycles NE Mixture Percent Moisture Loss per Ten CoreDry Cycles MS Mixture Moisture Loss, % Cycles Moisture Loss, % Cycles Moisture Loss, % Cycles Figure 5-7-Percent loss of Moisture in 12 mixtures dried back using CoreDry; mass measurements were performed every 10 drying cycles equivalent to 17 min. 5.3 Results of Accelerated Rotating Tumbler Dry-back Method Table 5-3 provides the Gmm values and times to SSD from testing the 12 mixtures according to the accelerated tumbler method. The SSD condition is determined based on the criterion of percent difference between the dry-back mass and the original dry mass using the threshold value of 0.17%. For the comparison, the time to SSD following the T 209 dry-back method using both the 0.05% criterion (consecutive mass loss) and the 0.17% criterion (percent difference of dryback mass and original dry mass) are also included in the table. As indicated from the table, the accelerated SSD time ranges from 10 min. to 26 min., T 209 SSD time using 0.05% threshold ranges from 104 min. to min., and T 209 SSD time using 0.17% threshold ranges from 89 min. to 170 min. 44
51 Table 5-3- SSD time of the 12 mixtures tested according to T 209 dry-back procedure and accelerated dryback method; Two criteria used for the T 209 dry-back time: mass loss of 0.05% between consecutive measurements and mass difference of 0.17% between dry-back mass and the original dry mass; the criterion for the accelerated dry-back time is mass difference of 0.17% from the original dry mass Mixture source Mixture % Passing #8 Aggregate % Passing #16 Accelerated Dry-back Gmm Accelerated Time to 0.17% Mass Difference (from Original Dry Mass) AASHTO T 209 Time to 0.05% Consecutive Mass Loss AASHTO T 209 Time to 0.17 % Mass Difference (from Original Dry Mass) NC WV WV(2B) UT w/o RAP UT w/rap ALF MO MO(2) CO FL NE MS Figure 5-8 shows the relationship between T 209 SSD time based on the 0.05% criteria and the accelerated SSD time based on 0.17% criteria. The figure shows that for the 12 mixtures in this study, the accelerated SSD time has a very good correlation (R 2 =0.83) with the T 209 SSD time Relationship between Accelearated SSD Time and T 209 SSD Time Accelerated SSD Time, min R² = T 209 SSD Time, min Figure 5-8-Relationship between the T 209 SSD time and the accelerated SSD time 45
52 Error! Reference source not found. shows the relationship between T 209 dry-back Gmm values with those using the accelerated method. As shown from the figure, there is a very good agreement between the Gmm values from the two methods. This suggests that the same dry-back Gmm values can be measured with the accelerated tumbler method in one-fourth of the time required to perform the T 209 dry-back measurements. The good correlation between the accelerated tumbler method and the AASHTO T 209 procedure is expected because of the similarities in the fundamental mechanisms underlying the two methods. In both processes, mixtures are subjected to agitation. In addition, in both methods, room temperature air is blown over the mixtures by a fan. This distinguishes the tumbler method from the CoreDry method, where the sample is stationary inside the incubator and vacuum is used for drying. Relationship between Gmm from T 209 Dry-back and Accelerated Rotating Tumbler Dry-Back Method Linear (Equality Line) T 209 Dry-Back Gmm y = x R² = Accelerated Rotating Tumbler Dry-Back Gmm Figure 5-9-The relationship between T 209 dry-back Gmm and the accelerated rotating tumbler dry-back Gmm Table 5-4 provides the results of a t-test for statistical comparison of the Gmm values from the accelerated rotating tumbler method and those from the T 209 dry-back method. The p-values smaller than 0.05 indicate a significant difference between the Gmm of the two methods and are shaded gray in the table. As indicated from the table, only for two out of the 12 mixtures, the Gmm values from the two methods are significantly different. 46
53 Table 5-4- Results of t-test for comparison of Gmm from T 209 dry-back procedure and accelerated dry-back method; shaded P-values indicate statistically significant differences Mixture ID T 209 Dry-Back Gmm Accelerated Dry-Back Difference NC NC WV WV WV(2) WV(2) UT w/o RAP UT w/o RAP UT w/rap UT w/rap ALF ALF MO MO MO(2) MO(2) CO CO FL FL NE NE MS MS P-value Effect of Mixture Gradation on Accelerated Dry-back Time Figure 5-10 shows the relationship between the accelerated dry-back time and the mixture percent passing # 8 sieve. Similar to the relationship between T 209 dry-back time and the mixture percent passing #8 sieve, the correlation is relatively high. This suggests that the time it will take for the mixture to reach to the SSD condition is more determined by the moisture covering the surface and retained within agglomerates of the fine particles than the moisture in the aggregate pores. This relationship between time to SSD and mixture fineness could be helpful for predicting the time to SSD. If time to SSD is estimated, it is possible to decide when to make the first weight 47
54 measurement; that is the point when the sample has lost most of its surface moisture. From that point, shorter drying increments can be applied to identify the SSD point. The 0.17% criterion in combination of 0.05% criteria can be used for the SSD determination Relationship between Mixture Percent Passing #8 and Accelerated SSD Time Accelerated SSD Time, min R² = Mixture Passing #8, % Figure 5-10-Relationship between the accelerated dry-back time and mixture percent passing #8 sieve 48
55 CHAPTER 6 FINDINGS AND CONCLUSIONS The objectives of this research are the following: first, to determine the appropriate trigger measure and trigger value that requires performing the dry-back procedure when it is absolutely necessary in relation to the effect on compaction; second, to determine improvements that can be made to the dry-back procedure to make it less subjective and to produce more repeatable and reliable test results; third, to explore various methods to accelerate the dry-back process to make it less time consuming; and fourth, to explore various criteria for determining the condition of Saturated Surface Dry (SSD) and select the most reliable, straightforward criterion. A summary of findings of the study are discussed below. 6.1 Summary Literature Review A comprehensive literature review of the most recent research on the AASHTO T 209 Dry-Back procedure was performed. In addition, the state DOTs were surveyed to ask about the techniques they use for improvement of the dry-back procedure. Furthermore, phone conversations with several state DOTs were conducted and their concerns regarding the dry-back method was queried. A summary of the literature review, survey, and the phone conversations are provided in Chapter 2. The findings are grouped into the following categories: 1) alterations to the dry-back method practiced by DOTs 2) techniques to accelerate the dry-back procedure 3) use of different triggers to reduce frequency of performing dry-back and to avoid performing dry-back unnecessarily Analysis of NCHRP 9-26 (Phase 4) Data In NCHRP Project 9-26 Phase 4 precision estimates were developed for volumetric properties, including Gmm, of asphalt mixtures with highly absorptive aggregates. The study also looked at the effect of laboratory conditioning time on volumetric properties, including Gmm. The raw data from the dry-back procedure performed on the asphalt mixtures in the NCHRP 9-26 Phase 4 study were analyzed to evaluate five trigger measures and their corresponding values used by the state DOTs for determining the conditions when dry-back is necessary. The evaluation of the trigger measures was performed statistically and from a practical point of view, i.e., physical significance with respect to laboratory testing and field performance. The data from the NCHRP Project 9-26 (Phase 4) study were also used to investigate the effect of aggregate absorption, aggregate gradation, and effective asphalt content on the significance of the difference between conventional and dry-back Gmm. The results of this investigation and the evaluation of the trigger measures are provided in Chapter Laboratory Investigation For the laboratory investigation, 12 field mixtures were selected based on the results of the literature review and responses to the survey. Eleven mixtures were obtained from 9 state DOTs and one mixture was obtained from the FHWA ALF facility. Two of the mixtures served as controls; they contained no RAP, slag, or absorptive aggregates. The other 10 mixtures included RAP, slag, absorptive aggregates, or combinations of the three and have been subjected to the 49
56 dry-back procedure on a regular basis by the state DOTs. These 10 mixtures covered a wide range of aggregate sources with varying levels of water absorption, different percentages of slag, different percentages of RAP, and variety of different NMAS. The 12 mixtures were tested according to three different methods: the supplemental dry-back procedure of AASHTO T 209; the CoreDry method for rapid mixture dry-back; and a rotating tumbler, also known as aggregate washer, along with a small air blower, to accelerate the dryback process. 6.2 Findings Literature Review A summary of findings of the literature review and the survey of the state DOTs are as follows: 1. The decision on performing the dry-back procedure should not be made based on the level of aggregate water absorption alone. Other factors, such as low level of effective asphalt content, high vacuum level, fractured aggregates in the mix, RAP content, or materials from pavement cores, could cause a significant difference between conventional and dry-back Gmm. 2. Several trigger measures, other than the level of aggregate absorption, are used by the DOTs for deciding if dry-back is necessary. The trigger measures have physical meanings in laboratory testing and pavement performance. They include allowable difference between conventional and dry-back Gmm based on AASHTO T 209 single operator d2s, allowable difference between dry and dry-back air voids, and the percent difference between original dry mass and the dry-back mass. Various threshold values for these trigger measures are being used. 3. States are also applying different modifications to T 209 to expedite the dry-back process. Examples of these are use of a meshed angled surface in place of solid flat surface or use of different devices such as Corelok and CoreDry. 4. To reduce variability of the dry-back Gmm, states are practicing methods to prevent loss of fine particles when draining excess water, such as use of filter paper to collect fine particles and drying them separately in the oven. The mass of the dried particles is then added to the SSD mass. 5. To avoid performing dry-back on a regular basis during construction season, DOTs determine an adjustment factor from performing dry-back during the mix design process. During production, the adjustment factor is applied to the Gmm values determined using conventional method. Different state DOTs reevaluate the adjustment factor at different frequencies, e.g., every eighth QC Gmm measurement Analysis of NCHRP Project 9-26 (Phase 4) Data The NCHRP Project 9-26 (Phase 4) data revealed the applicability of the trigger measures and their corresponding trigger values for determining when dry-back is needed. The effect of aggregate absorption level, aggregate gradation, and effective asphalt content on the significance 50
57 of the difference between conventional and dry-back Gmm was also investigated. The findings are as follows: 1. Among the five trigger measures used by the state DOTs, three were selected and their trigger values were adjusted. The selection of trigger measures and trigger values was based on obtaining the best agreements with the statistical results and with each other. 2. The three trigger measures and their values are 1) difference between air voids computed using conventional and dry-back Gmm with the trigger value of 0.4%, 2) allowable difference between Gmm values (single laboratory d2s value) with the trigger value of 0.010, and 3) the percent difference between the dry-back mass and the original dry mass with the trigger value of 0.17%. 3. Analysis of data from the conditioning time study of NCHRP Project 9-26 Phase 4 data indicated that differences between the conventional and dry-back Gmm are more significant for mixtures with finer gradation than for mixtures with coarser gradation. 4. Contrary to the expectation, the difference between the air voids computed from the conventional and dry-back Gmm was shown to be less significant for the mixture with higher absorptive aggregate than for the mixture with lower absorptive aggregate. An investigation into this indicated that the mixture with higher absorptive aggregate had higher effective asphalt content than the mixture with lower absorptive aggregate. Therefore, sufficient effective asphalt could offset the effect of aggregate absorption on Gmm measurement Laboratory Investigations 1. In this study, several of the mixtures with high percentages of RAP and/or highly absorptive aggregates exhibited dry-back Gmm that were not significantly different from the conventional Gmm. The mixtures might have been produced with adequate effective asphalt content. It may be concluded that despite the level of aggregate absorption, amount of slag, and the percentages of RAP, use of dry-back seems unnecessary if pores of aggregates are filled and surfaces of aggregates are covered with asphalt. 2. For mixtures with absorptive aggregates, dry-back may only be necessary during the mix design process to ensure the amount of binder is adequate. A mixture optimized for asphalt content should meet the following criteria: the difference between the Gmm values from the conventional and dry-back methods is or less; the difference in the original dry and dry-back mass is 0.17% or less; the difference in the air voids computed using the conventional and dry-back Gmm is 0.4% or less. Optimizing the mixture for asphalt content eliminates the need for performing dry-back on regular basis. 3. For mixtures with RAP, due to uncertainty in RAP qualities, optimizing the mix design would not be enough for reducing the number of dry-back procedures. For these mixtures, use of dry-back on regular basis seems necessary. With the increased use of RAP in asphalt mixtures, frequent conduct of dry-back could be very time consuming, which could become a burden during the construction season. It is therefore desirable to reduce the technician effort and/or accelerate the dry-back process. 4. Three types of moisture may be retained in asphalt mixtures: The first type is the moisture on the surface of individual particles. The drying time at this stage depends on 51
58 the amount of fine particles in the mixture. The second type is the moisture that has trapped in fine conglomerates of a mixture. It takes longer for this moisture to be dried. The third type is the moisture that has seeped inside the pores of aggregates due to uncoated or cut aggregate surfaces. This moisture takes the longest to dry. The first two types of moisture can be dried using blowing air and occasional agitation within a reasonable time period; however, the moisture that is in the pores of aggregate can only be removed using vacuum suction or by blowing air for a relatively long time. 5. The time to SSD condition was found to have direct relationship with the percentage of mixture passing the # 8 sieve (finer portion). For the 12 mixtures in this study, a relatively high correlation was observed between percentage of mixture passing #8 sieve and the time to SSD condition (R 2 =0.70). The higher the finer portion of a mixture, the longer it took for the mixture to reach the SSD condition. 6. Modified criteria for determining SSD condition were utilized. The modified criteria are a combination of percent difference between the dry and dry-back mass with a threshold value of 0.17% and percent mass loss in an interval with a threshold value of 0.05% (specified in T 209). As a SSD criterion, any difference of 0.17% or less between the dry-back mass and the original dry mass would be insignificant from practical point of view and the drying process can be stopped. If the difference is larger than 0.17%, the drying continuous and the change in mass in an interval will be compared with 0.05%. threshold value (as specified in T 209). A change of less than 0.05% for two consecutive intervals would indicate SSD condition. 7. The effort involved with the dry-back process of T 209 can be reduced by using the modified criteria. The first mass measurement is performed after 60 min. of drying when the moisture that is being dried is mainly on the surface of the particles. The measured mass is used to determine percent difference with the original dry mass. If the difference is 0.17% or less, the mass is the SSD mass. If the difference is more than 0.17%, the drying continues in 15-min interval following T 209 dry-back process to determine the amount of moisture in the pores. After each 15-min interval, mass is measured and the change in mass for that interval is determined. A change of less than 0.05% in two consecutive intervals would indicate the SSD condition. 8. The dry-back procedure can be significantly accelerated by using a rotating tumbler device. Asphalt mixture is tumbled inside a bucket while being blown by an air blower. 9. The time to SSD condition using the rotating tumbler method is approximately one-fourth of the time to SSD condition using the T 209 dry-back procedure, yet a very good correlation exists between the Gmm values from the accelerated tumbler procedure and from the T 209 dry-back procedure. 10. To determine the condition of SSD with the accelerated method, the modified criteria, suggested for reducing effort of T 209 dry-back procedure in #6, is used. The only difference is that the time intervals are considerably shorter due to constant agitation of the mixture in the tumbler. The first mass measurement is performed after the first 15- min drying interval, when water at the surface of aggregates are dried out. If percent difference between this mass and the original dry mass is less than 0.17%, this mass is considered SSD mass. If the difference is more than 0.17%, drying continuous in 5-min intervals. Depending on the amount of fine particles in the mixture, one or more 5-min 52
59 intervals are required to dry the moisture in the fine conglomerates. A percent change of 0.05% or less in a 5-min interval would indicate the SSD condition. 11. The vacuum suction of the CoreDry could pull moisture out of the particle pores. In this case, the condition of SSD could be missed within a short period of time. 12. Lack of agitation during the drying back process in a CoreDry might cause inconsistent drying of the mixture, where the outer edge of a sample could get more dried than the inner core. Occasional reduction in the drying rate was observed for some mixtures during the drying process, which could indicate that the moisture in the inner core of the sample is less accessible to vacuum than the moisture in the outer edge. 6.3 Recommendations Based on the the findings of this study, the following recommendations are made: 1. AASHTO T 209 indicates aggregate water absorption as the trigger measure to decide performing the dry-back procedure. While aggregate water absorption could be a significant factor, it is not the only factor that could lead to dry-back. There are other conditions such as testing mixture with RAP or testing pavement cores, which may require use of dry-back. These conditions should be included in AASHTO T 209, in addition to aggregate absorption, as the factors that could lead to the use of dry-back. 2. The test method specifies that the dry-back procedure should be performed if water absorption of the aggregates in the mixture is as small as 1.5%. The results of this study indicated that mixture with higher absorptive aggregates could produce dry-back Gmm that is not significantly different from conventional Gmm. It is recommended to remove the 1.5% absorption as a trigger measure for the dry-back procedure. 3. The results of testing the mixtures in this study as well as the review of the literature and the survey of State DOTs indicated that adequate effective binder could eliminate the need for preforming the dry-back procedure even if mixtures include highly absorptive aggregates and RAP. Therefore, it is recommended that trigger measure of 1.5% water absorption in AASHTO T 209 to be replaced by the trigger measure and trigger value of percent difference of 0.17% between the dry-back and the original dry mass. If this value exceeds, the mixture is required to be dried back. 4. It was shown in this study that it is possible to have mixtures with absorptive aggregates and the dry-back mass not to be significantly different from the original dry mass. This can be accomplished by optimizing mixtures for asphalt content to ensure there are adequate asphalt to coat the aggregates regardless of the level of aggregate absorption. In this respect, dry-back can be performed mainly at the time of mix design and less frequently during the production. It is recommended to use the trigger measure of percent difference between dry-back and dry mass of 0.17% when optimizing the design and adjusting the binder content. It is also recommended that after adjusting the binder content, in addition to the volumetric properties, mechanical performance of the optimized mixture to be evaluated to ensure the resistance of the mixture to rutting and fatigue is balanced. 5. For mixtures with RAP, due to uncertainty in the RAP quality, performing of dry-back on regular basis seems necessary. Since performing dry-back is labor intensive and time 53
60 consuming it could create a burden during the construction season. It is recommended to either modify the T 209 dry-back process to make it less labor intensive or to accelerate the dry-back process by adopting the rotating tumbler. 6. It is recommended to use the modified criterion for deciding on the condition of SSD. A criterion of 0.17% or less for the difference between the dry-back and the original dry mass in combination with the T 209 criterion of less than 0.05% in mass change for an interval could be used to reduce the effort and or the time needed for the dry-back procedure. 7. it is recommended to make AASHTO T 209 dry-back procedure less labor intensive by reducing the frequency of the mass measurements. The mass measurements can be eliminated for the first 60 min of drying since during this time only surface moisture is being dried. After 60 min. of drying, the mass is measured and the percent difference of the mass with the original dry mass is calculated. A value of less than 0.17% indicates the SSD condition has been reached. A value of greater than 0.17% necessitate continuation of the drying following the AASHTO T 209 dry-back process until SSD is reached. The condition of SSD is recognized when the change is mass in the interval is less than 0.05%. 8. It is recommended to use the rotating tumbler set up to accelerate the drying back process. The tumbler method produces not significantly different Gmm from the T 209 in one-fourth of the time needed for the T 209 dry-back process. The drying back process includes a 15-min initial interval followed by one or more 5-min intervals. The modified criteria suggested in #6 for determining SSD condition of T 209 also applies for the accelerated method: difference of less than 0.17 % between the dry-back mass and the original dry mass after the first 15-min interval and mass change of less than 0.05% for a 5-min interval. 9. It is recommended to explore the application of the findings in this study for the pavement cores with cut surfaces. These include use of the accelerated rotating tumbler method, the recommended trigger measure and trigger value for determining if dry-back is needed, and the recommended criteria and threshold values for determining if SSD condition has been reached. 10. It is recommended to further investigate the relationship between mixture fineness and time to SSD. This information can be used in predicting how long is the initial stage of drying when only surface moisture is being dried. Knowing this information eliminates the need for frequent mass measurements during this period. 54
61 REFERENCES 1. Standard Specifications for Transportation Materials and Methods of Sampling and Testing, Thirty Sixth Edition, American Association of State Highway and Transportation Officials, Washington, DC. 2. Azari, H., Lutz, R., Spellerberg, P., Precision Estimates of Selective Volumetric Properties of HMA Using Absorptive Aggregates, NCHRP Web Document 109, Kandhal, P. and Khatri, M., Improved Rice Method for Determining Theoretical Maximum Specific Gravity of Asphalt Paving Mixtures NCAT Report 92-03, Blow, M., A better way to measure RAP and core Gmm-Find theoretical specific gravity of RAP and cored material, Asphalt Institute Magazine, asphaltmagazine.com/a-betterway-to-measure-rap-and-core-gmm 5. InstroTek Inc., 2011, Aggregate Gravity & Absorption Test 6. Sholar, G.A., G. Page, J. Musselman, P. Upshaw, and H. Mosley, Investigation of the CoreLok for Maximum, Aggregate and Bulk Specific Gravity Test, Research Report FL/DOT/SMO/03-462, Rajagopal, A. and Cargo, D., A Comparative Evaluation of the Corelok Device in Determining Reliable Bulk Specific Gravity and Maximum Specific Gravity Test Results,, University of Cincinnati Report, State Job No , Crane, J., Effect of Residual Moisture and Zero Conditioning Time on Maximum Theoretical Specific Gravity, West Virginia University Thesis, Maximum Specific Gravity (Gmm) of Asphalt Mix-Rice Method (NCDOT-T-209) NCDOT QMS Asphalt Manual, California Test 309, Method of Test for Determining Theoretical Maximum Specific Gravity and Density of Hot Mix Asphalt, California Department of Transportation, ARIZ 417e, Maximum Theoretical Specific Gravity and Density of Field Produced Bituminous Mixtures- Rice Test (A Modification of AASHTO T 209), Materials Testing Manual, Arizona Department of Transportation, Supplement 1036, Procedure for Determining Theoretical Maximum Specific Gravity, State of Ohio Department of Transportation, Method of Test for Determination of Percent Air Voids in Compacted Dense Asphalt Concrete Mixes, City of Columbus, Ohio, Colorado Procedure 51-14, Standard Method of Test for Determining the Maximum Specific Gravity of HMA, TX DOT Designation: Tex-227-F, Theoretical Maximum Specific Gravity of Bituminous Mixtures, Azari, H., T 209: Effect of Agitation Equipment Type on Theoretical Maximum Specific Gravity Values, NCHRP Web Document 369,
62 APPENDIX A- SURVEY RESULTS AND ANALYSIS 56

63 Survey Results & Analysis for SOM Questionnaire - TS 2c Improvements to AASHTO T 209 Dry Back Procedure Tuesday, September 29, 2015 Powered by Vovici EFM 57
64 Executive Summary This report contains a detailed statistical analysis of the results to the survey titled SOM Questionnaire - TS 2c Improvements to AASHTO T 209 Dry-back Procedure. The results analysis includes answers from all respondents who took the survey in the 29 day period from Monday, August 31, 2015 to Tuesday, September 29, completed responses were received to the survey during this time. 58
65 Survey Results & Analysis AZ Survey: SOM Questionnaire - TS 2c Improvements to AASHTO T 209 Dry-back Procedure Author: Henry Lacinak Filter: Responses Received: 29 Standard ARIZ 417 (T 209 modified) CA T 209 Never CT Dry-back: Frequency TS 2c Improvements to AASHTO T 209 Dry-back Procedure (2015 Survey Summary) Conditions to run Dryback procedure: Conventionally >0.2% Difference b/w Air v. Fan Drying T 209 Never - Water absorption is typically <1.5% Trigger Values: Dry-back (fan dry) and Air dry are performed on the first four samples at the beginning of production. If the difference in resultant air voids is >0.2%, we continue to perform fan drying. Steps taken to achieve SSD Condition: ARIZ 417 steps are similar to T 209 Determine if SSD is reached: ARIZ 417 steps are similar to T 209 Used asphalt field cores for Gmm determination Yes Yes Sample offered No 59
66 DE T 209 Not If aggregates are not well Conventionally coated with asphalt We run dry-backs only when testing rap. T 209 or D2041 T 209 or D2041 Yes Yes FL FM 1-T 209 Not At the initial mix design Conventionally stage. T 209 or D2041 Mass loss <0.5g in 15 min. Yes Yes GA T 209 Never Aggregate water absorption. All aggregates in our state have absorption in the range between 0.38% and 0.73%, which is <1.5%, the absorption required in Section 15 of T-209. T 209 or D2041 T 209 Not When Mixtures have Conventionally absorptive aggregates Note 12 AASHTO T 209 T 209 or D2041 T 209 or D2041 No No ID If broken aggregates in the mixture show sign of water absorption If aggregates are not well coated with asphalt KS KT-39: local test procedure for Gmm Never KY T 209 Not When Mixtures have Conventionally absorptive aggregates Type of aggregate used (by experience) T 209 or D2041 T 209 or D2041 No Not Sure 60
67 blast furnace slag or plum run dolomite ME T 209 Never No MI D2041 Never No MN T 209 Never Yes No MO T 209 Conventionally When Mixtures have absorptive aggregates If aggregates are not well coated with asphalt Water absorption over 2.0%. T 209 or D2041 MS T 209 Conventionally Every 8th QC sample Every mix T 209 or D2041 T 209 or D2041 T 209 or D2041 MT T 209 Never No No NC NH NCDOT-T 209 (modified version of T 209) Conventionally Absorptive aggregates T 209 Conventionally If aggregates are not well coated with asphalt >1.5 % aggregate water absorption. Specific quarries identified with these absorption values and any asphalt containing these aggregates require Dryback. T 209 or D2041 T 209 or D2041 NJ T 209 Never Yes No NM T 209 Never For investigative work only We don't use dry-back procedure at our lab. T 209 or D2041 T 209 or D2041 Yes Yes Yes Yes No Yes Yes Yes No Not Sure 61
68 NY T 209 Never Yes Not Sure OR PA SC SD T 209 Conventionally Absorptive aggregates T 209 (modified) Not If pavement cores & Conventionally aggregates are not well coated T 209 Not If aggregates are not well Conventionally coated with asphalt SD 312 Not When Mixtures have Conventionally absorptive aggregates If broken aggregates in the mixture show sign of water absorption If aggregates are not well coated with asphalt Absorption > 1.2% Drain water from sample over a #40 sieve None We have low absorption materials like granite, but if we have cut or uncoated aggregate, we will run the dry-back procedure. Not typically 2.0% either way. Prefer to run the maximum specific gravity test at a higher asphalt content and not use the dry-back procedure. T 209 or D2041 T 209 or D2041 T 209 or D2041 < 0.5g loss after 15 min T 209 or D2041 T 209 or D2041 (syringes to remove visible water) T 209 or D2041 TN T 209 Never Yes No No Yes Yes Yes Not Sure No Not Sure Not Sure 62
69 VA WA WV MTO Ontario T 209 Not When Mixtures have Conventionally absorptive aggregates WAQTC FOP for AASHTO T 209 The majority of our aggregate sources have lower absorption values. Therefore, we don't explore the dryback procedure. T 209 or D2041 T 209 or D2041 Never Yes T 209 Not When Mixtures have Conventionally absorptive aggregates MTO LS264 Not When Mixtures have Conventionally absorptive aggregates If aggregates are not well coated with asphalt 1.5% absorption in the aggregate We have a limit for absorption of 2% so unless it is a nonstandard mix, there would not be an aggregate considered porous in our mixes. T 209 or D2041 T 209 or D2041 ASTM D , Section 11 Yes Yes Yes No Not Sure Not Sure 63
70 2) What standard do you follow for measuring maximum specific gravity of asphalt mixtures? 64
 SD 312 MTO Laboratory Standard LS-264")
71 Other Responses: KT-39: local test procedure for Gmm NCDOT-T-209 (modified version of T 209) AASHTO T 209 Modified WAQTC FOP for AASHTO T 209 We use FM 1-T 209 ARIZ 417 (A Modification of T209) SD 312 MTO Laboratory Standard LS
72 3) How often do you run the Dry-back procedure? 66
73 4) Under what conditions do you decide to run the Dry-back procedure? Other Responses: NA every 8th QC sample Water absorption typically below 1.5% Not applicable with very low absorption. pavement cores & aggr not well coated used with field cores - investigation At the initial mix design stage. >0.2% Difference b/w Air v. Fan Drying blast furnace slag or plum run dolomite For investigative work only 67
74 5) What trigger values (i.e., specific values of water or asphalt absorption) do you use to determine if the dry-back procedure to be used (e.g. 1.5 % aggregate water absorption, etc.)? What trigger values (i.e., specific values of water or asphalt absorption) do you use to determine if the dry-back procedure to be used (e.g. 1.5 % aggregate water absorption, etc.)? when aggregate asphalt absorption is greater than 1.2% NA dry-back is conducted on every mix n/a Aggregate water absorption. All the aggregates in our state are with absorption in the range between 0.38% and 0.73%, which is less than 1.5%, the absorption required in Section 15 of T-209. >1.5 % aggregate water absorption. We have identified the specific quarries with these absorption values and any asphalt containing these aggregates require Dryback. No trigger. We have low absorption materials like granite, but if we have cut or uncoated aggregate, we will run the dry-back procedure.. Not typically going to have 2.0% or more either way. We run dry-backs only when testing rap. N/A Dry-back (fan dry) and Air dry are performed on the first four samples at the beginning of production. If the difference in resultant air voids is >0.2%, we continue to perform fan drying. 1.5% absorption in the aggregate - Water absorption over 2.0%. SDDOT prefers to run the maximum specific gravity test at a higher asphalt content and not use the dry-back procedure 68
75 type of aggregate used (by experience) The majority of aggregate sources available in Virginia have lower absorption values. Therefore, we don't explore the dry-back procedure. Note 12 AASHTO T 209 We don't use dry-back procedure at our lab. We have a limit for absorption of 2% so unless it is a non-standard mix, there would not be an aggregate considered porous in our mixes. 6) What steps do you take in achieving the SSD condition as part of the dry-back procedure? 69
76 Other Responses: Drain water from sample over a #40 sieve NA NA n/a Not applicable ARIZ 417 steps are similar to T209 70

77 Other Responses: less than 0.5g loss after 15 minutes NA NA n/a shringes to remove visible water Weight loss less than 0.5g in 15 min. ARIZ 417 steps are simlilar to T209 ASTM D , Section 11 71
78 8) Have you made any modifications to the test method or used any specific device for improving the subjectivity of SSD determination and/or the shortening the time specified for the dry-back procedure? Please explain. NC Have you made any modifications to the test method or used any specific device for improving the subjectivity of SSD determination and/or the shortening the time specified for the dry-back procedure? Please explain. We allow the use of newspaper or wax-coated paper to speed up moisture removal. Care must be taken to prevent loss of sample during removal from the paper. SC CoreDry or CoreLok Device Low heat - incubator, dry at 125 degrees F similar to T166 (section 6.1) to speed process?? SD SDDOT prefers to run the maximum specific gravity test at a higher asphalt content and not use the dry-back procedure and coat the aggregate so the dry-back procedure is not needed during the mix design testing. 72

79 9) Have you ever used asphalt pavement field cores for Gmm determination? How did you resolve the minimum mass requirement in the test method since the mass of compacted samples are typically smaller than the minimum sample size? AZ Add together multiple cores or take larger cores 73
80 CT 6" cores used. Mass typically over the minimum required. DE Cut larger cores. FL Used enough cores to get the proper mass. GA Yes. We had to cut several cores in the same sub lot and combined the materials to meet minimum sample size of Table 1 in Section 7 of T-209. MN Tested as is. MO Several cores are taken from the HMA lift the maximum specific gravity value is desired. May need 4 to 10 cores depending on lift thickness. MS Only conducted for forensic studies and not for acceptance. In this case the procedure is modified to fit the available material. NC Mix multiple cores together to meet minimum mass requirements. NJ We use 6 inch diameter cores so lifts over 1.5 inches usually have sufficient mass. In our specification we waive the minimum mass requirement. NY Combine cores from the same day's production. OR Don't use cores PA Waived minimum mass requirement when necessary. SC Try to cut 6-8" cores to ensure enough material. Also combining cores by heating and quartering samples down to NMA size. SD Combine two or more cores to get the minimum mass needed for the maximum specific gravity test TN We combine material from several core specimens to form a representative sample VA We try to use 6" cores whenever possible, and typically combine to make a representative specimen for testing. WA WV MTO Ontario WSDOT has a standard operating procedure (SOP) for forensic testing that allows use of roadway cores to determine Gmm even though the samples may meet the minimum mass requirements. The results are not use for acceptance. We only calculate Gmm from field core for forensic investigation of pavement problems. Typically we pull multiple cores to get the minimum sample size. We moved back to using loose mix MRD for that very reason. 74
81 75
82 11) Have you made any modifications to the test method for the purpose of determining SSD condition of the field core mixtures having cut/exposed faces of aggregates resulted from drilling operation? Have you made any modifications to the test method for the purpose of determining SSD condition of the field core mixtures having cut/exposed faces of aggregates resulted from drilling operation? (Please give details) AZ No, only would be used for forensic purposes. FL No. We only perform Gmm on field cores in rare instances, such as forensic investigations. GA No needs, since all our aggregates have very low water absorption (0.38% to 0.73%). MO Cores are heated up so as to break them apart. Asphalt mix from the middle of the cores is removed for testing purposes. Exposed aggregate along the outside edge is excluded. The HMA mixture is mixed and split down to the testing size. MS The core is heated and the cut aggregate is scraped away from the core and removed from the sample. NC We have tried removing cut faces from the sample - not sure if there is any appreciable difference in test results. OR Don't use cores PA For pavement cores, we use the dry-back procedure in AASHTO T 209. SC SD No. I do not feel like visually removing cut or broken aggregates is a good approach. This affects the blend and percentage of binder in the sample. Fines hold more binder. lowering Gmm. We mix the core sample or sometimes add a set percent of binder to the cores to coat all aggregate particles and then run the maximum specific gravity test TN During sample preparation all cut/exposed aggregate is removed and remain material remixed. VA We try to pick them out from the specimen. Therefore, SSD determination is not necessary. WA WSDOT uses AASHTO T 331 for Gmb determination of cores. 12) Would you provide a 5-gallon bucket of the mixture that you typically use the Dry-back procedure on? 76
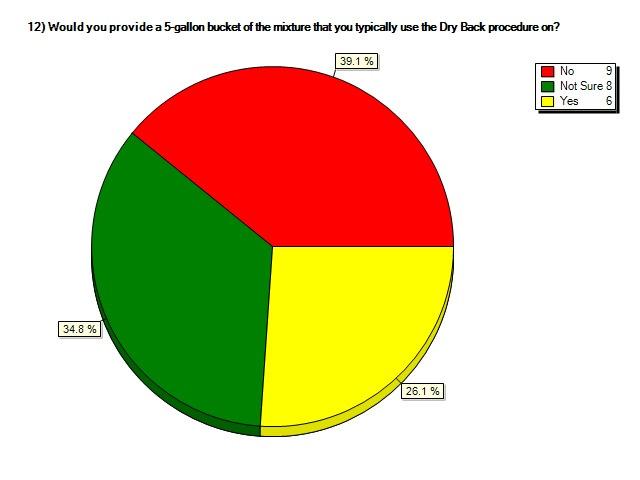
83 77
PRECISION ESTIMATES OF AASHTO T324, HAMBURG WHEEL-TRACK TESTING OFCOMPACTED HOT MIX ASPHALT (HMA) APPENDICES FOR FINAL REPORT
 APPENDICES FOR FINAL REPORT") Project No. 10-87-2B DRAFT 6/06/14 PRECISION ESTIMATES OF AASHTO T324, HAMBURG WHEEL-TRACK TESTING OFCOMPACTED HOT MIX ASPHALT (HMA) APPENDICES FOR FINAL REPORT Prepared for National Cooperative Highway
Project No. 10-87-2B DRAFT 6/06/14 PRECISION ESTIMATES OF AASHTO T324, HAMBURG WHEEL-TRACK TESTING OFCOMPACTED HOT MIX ASPHALT (HMA) APPENDICES FOR FINAL REPORT Prepared for National Cooperative Highway
ASPHALT PLANT LEVEL 1
 ASPHALT PLANT LEVEL 1 Module 6: Maximum Specific Gravity FM 1 T 209 FDOT Course Release: 10, Module 6 1 Specification Year: January 2015 The terms Gmm or Maximum Specific Gravity or Rice gravity are often
OHD L-47. Guidelines for Resolving Differences in Test Results
 Guidelines for Resolving Differences in Test Results Page 1 of 21 1 SCOPE 1.1 The guidelines provided are as follows: 1.1.1 Standard Practice for the Evaluation of Different Superpave Gyratory Compactors
ASPHALT PLANT LEVEL 1
 ASPHALT PLANT LEVEL 1 Module 5: Bulk Specific Gravity FM 1 T 166 FDOT Course Release: 10, Module 5 1 Specification Year: January 2015 Release 10 5-1 FM 1 T 166 Bulk specific gravity of compacted mixtures.
IN-PLACE DENSITY WAQTC FOP AASHTO T 209 (16)
") THEORETICAL MAXIMUM SPECIFIC GRAVITY (Gmm) AND DENSITY OF HOT MIX ASPHALT (HMA) PAVING MIXTURES FOP FOR AASHTO T 209 Scope This procedure covers the determination of the maximum specific gravity (Gmm)
THEORETICAL MAXIMUM SPECIFIC GRAVITY (Gmm) AND DENSITY OF HOT MIX ASPHALT (HMA) PAVING MIXTURES FOP FOR AASHTO T 209 Scope This procedure covers the determination of the maximum specific gravity (Gmm)
SPECIFIC GRAVITY AND ABSORPTION OF AGGREGATE BY VOLUMETRIC IMMERSION METHOD
 Standard Method of Test for Volumetric Absorption & Specific Gravity Test Procedure SPECIFIC GRAVITY AND ABSORPTION OF AGGREGATE BY VOLUMETRIC IMMERSION METHOD AASHTO TP XXXX 1. SCOPE 1.1. This method
Jan 10, 2002 LAB MANUAL
 Jan 10, 2002 LAB MANUAL 1810.0 1810 BULK SPECIFIC GRAVITY (GMB), DENSITY AND PERCENT ABSORBED WATER OF COMPACTED BITUMINOUS SPECIMENS AASHTO Designation T 166 (MN/DOT Modified) 1810.1 SCOPE This test method
ASPHALT WAQTC FOP AASHTO T 209 (12)
") THEORETICL MXIMUM SPECIFIC GRVITY (G mm ) ND DENSITY OF HOT MIX SPHLT (HM) PVING MIXTURES FOP FOR SHTO T 209 Scope This procedure covers the determination of the maximum specific gravity (G mm ) of uncompacted
THEORETICL MXIMUM SPECIFIC GRVITY (G mm ) ND DENSITY OF HOT MIX SPHLT (HM) PVING MIXTURES FOP FOR SHTO T 209 Scope This procedure covers the determination of the maximum specific gravity (G mm ) of uncompacted
RESISTANCE OF COMPACTED ASPHALT MIXTURE TO MOISTURE INDUCED DAMAGE (Kansas Test Method KT-56)
") 5.9.56 RESISTANCE OF COMPACTED ASPHALT MIXTURE TO MOISTURE INDUCED DAMAGE (Kansas Test Method ) 1. SCOPE This test covers preparation of specimens and measurement of the change of tensile strength resulting
5.9.56 RESISTANCE OF COMPACTED ASPHALT MIXTURE TO MOISTURE INDUCED DAMAGE (Kansas Test Method ) 1. SCOPE This test covers preparation of specimens and measurement of the change of tensile strength resulting
Apr 16, 2010 LAB MANUAL 1810
 Apr 16, 2010 LAB MANUAL 1810 1810 BULK SPECIFIC GRAVITY (GMB), DENSITY AND PERCENT ABSORBED WATER OF COMPACTED BITUMINOUS SPECIMENS AASHTO Designation T 166 (MN/DOT Modified) 1810.1 SCOPE This test method
IMPROVED RICE METHOD FOR DETERMINING THEORETICAL MAXIMUM SPECIFIC GRAVITY OF ASPHALT PAVING MIXTURES
 NCAT Report No. 92-3 IMPROVED RICE METHOD FOR DETERMINING THEORETICAL MAXIMUM SPECIFIC GRAVITY OF ASPHALT PAVING MIXTURES by Prithvi S. Kandhal Maqbool A. Khatri May 1992 Presented at the Annual Meeting
SUPERPAVE MIX DESIGN. Superpave Mix Design 1
 SUPERPAVE MIX DESIGN Superpave Mix Design 1 Superpave Gyratory Compaction and Mixture Requirements Section objectives Describe the Superpave gyratory compactor Review the Superpave mixture requirements
2014 PennDOT Gmm Verification Program
 2014 PennDOT Gmm Verification Program 2015 PAPA Regional Technical Meeting PennDOT 2014 Gmm Verification Program FHWA Stewardship Review mandated that PennDOT develop a program to verify that the Gmm value
BULK SPECIFIC GRAVITY AND UNIT WEIGHT OF COMPACTED HOT MIX ASPHALT (HMA) (Kansas Test Method KT-15)
 (Kansas Test Method KT-15)") 5.9.15 BULK SPECIFIC GRAVITY AND UNIT WEIGHT OF COMPACTED HOT MIX ASPHALT (HMA) (Kansas Test Method ) 1. SCOPE This method of test covers the procedure for determining the bulk specific gravity of specimens
5.9.15 BULK SPECIFIC GRAVITY AND UNIT WEIGHT OF COMPACTED HOT MIX ASPHALT (HMA) (Kansas Test Method ) 1. SCOPE This method of test covers the procedure for determining the bulk specific gravity of specimens
CONTRACTOR MIX DESIGN GUIDELINES ASPHALT CONCRETE
 CONTRACTOR MIX DESIGN GUIDELINES For ASPHALT CONCRETE OREGON DEPARTMENT OF TRANSPORTATION CONTRACTOR MIX DESIGN GUIDELINES for ASPHALT CONCRETE These guidelines outline the procedures to be used in developing,
Improved Rice Method for Determining Theoretical Maximum Specific Gravity of Asphalt Paving Mixtures
 TRANSPORTATION RESEARCH RECORD 1353 9 Improved Rice Method for Determining Theoretical Maximum Specific Gravity of Asphalt Paving Mixtures PRITHVI S. KANDHAL AND MAQBOOL A. KHATRI The Rice method (ASTM
Tex-227-F, Theoretical Maximum Specific Gravity of Bituminous Mixtures
 Gravity of Bituminous Mixtures Overview Effective date: August 1999 to October 2004. Use this method to measure the theoretical maximum specific gravity (commonly referred to as 'Rice' gravity) of a bituminous
INTERNATIONAL SLURRY SURFACING ASSOCIATION TECHNICAL BULLETIN. 800 Roosevelt Road, Building C-312, Glen Ellyn, IL 60137
 INTERNATIONAL SLURRY SURFACING ASSOCIATION TECHNICAL BULLETIN 800 Roosevelt Road, Building C-312, Glen Ellyn, IL 60137 No. 144 Revised 2013 Test Method for Classification of Slurry Surfacing Materials
Kraton Ultra-thin HMA / WMA Overlay Study
 1 I. Overview Kraton Ultra-thin HMA / WMA Overlay Study Project: Oregon Department of Transportation I-5 Rock Point Evans Creek Contractor: Knife River Materials Existing Pavement - Condition: Binder Utilized:
METHOD OF TEST FOR THEORETICAL MAXIMUM RELATIVE DENSITY OF BITUMINOUS PAVING MIXTURES LS-264 R27 ASTM D2041/D2041M
 3. APPARATUS 3.1 BEAKERS OR VESSELS: Stainless steel vessel, 4000 ml capacity, no spout... 3.2 BALANCE: 4000 g capacity with an accuracy of ± 0.1 g... 3.3 RIFFLE SPLITTER: For splitting hot mix samples.
Comparison of T-84, CoreLok, and SS Detect. Idaho Asphalt Conference. Lawrence H. James, Ph.D. InstroTek, Inc. October 23 th, 2014
 Comparison of T-84, CoreLok, and SS Detect Idaho Asphalt Conference Lawrence H. James, Ph.D. InstroTek, Inc. October 23 th, 2014 Goal Review of the assumptions, areas of subjectivity and procedural difficulties
Aug 17, 2001 LAB MANUAL MAXIMUM SPECIFIC GRAVITY (RICE VOIDS TEST) OF PAVING MIXTURES AASHTO Designation T 209 (Mn/DOT Modified))
 OF PAVING MIXTURES AASHTO Designation T 209 (Mn/DOT Modified))") Aug 17, 2001 LAB MANUAL 1807.0 1807 MAXIMUM SPECIFIC GRAVITY (RICE VOIDS TEST) OF PAVING MIXTURES AASHTO Designation T 209 (Mn/DOT Modified)) 1807.1 SCOPE This test method covers the determination of the
Aug 17, 2001 LAB MANUAL 1807.0 1807 MAXIMUM SPECIFIC GRAVITY (RICE VOIDS TEST) OF PAVING MIXTURES AASHTO Designation T 209 (Mn/DOT Modified)) 1807.1 SCOPE This test method covers the determination of the
Commonwealth of Pennsylvania PA Test Method No. 742 Department of Transportation October Pages LABORATORY TESTING SECTION. Method of Test for
 Commonwealth of Pennsylvania PA Test Method No. 742 Department of Transportation 14 Pages LABORATORY TESTING SECTION Method of Test for BITUMEN CONTENT OF BITUMINOUS CONCRETE MIXTURES (Pennsylvania Pycnometer
DETERMINING OPTIMUM RESIDUAL ASPHALT CONTENT (RAC) FOR POLYMER-MODIFIED SLURRY SEAL (MICROSURFACING) MIXTURES
 FOR POLYMER-MODIFIED SLURRY SEAL (MICROSURFACING) MIXTURES") Test Procedure for DETERMINING OPTIMUM RESIDUAL ASPHALT CONTENT (RAC) FOR POLYMER-MODIFIED SLURRY SEAL (MICROSURFACING) MIXTURES TxDOT Designation: Tex-240-F Effective Date: December 2004 1. SCOPE 1.1
Test Procedure for DETERMINING OPTIMUM RESIDUAL ASPHALT CONTENT (RAC) FOR POLYMER-MODIFIED SLURRY SEAL (MICROSURFACING) MIXTURES TxDOT Designation: Tex-240-F Effective Date: December 2004 1. SCOPE 1.1
Lab Session #4 AN Physical Properties
 Lab Session #4 AN Physical Properties The main goal of this laboratory session is to provide a practical experience in the determination of the physical properties for AN and ANFO. The students will determine
In Place Density Determination of Asphalt Concrete by the Coring Method
 In Place Density Determination of Asphalt Concrete by the Coring Method 1. Scope: This procedure is for determining the density of in place asphalt concrete pavement. 2. Apparatus: 2.1 Scale or balance
Asphalt Mixture Quality Acceptance
 Supplemental Technical Specification for Asphalt Mixture Quality Acceptance SCDOT Designation: SC-M-400 (January 1, 2018) 1. SCOPE Use this specification for the acceptance of both hot mix and warm mix
SPECIFICATION FOR REPEATED LOAD TRIAXIAL (RLT) TESTING FOR PAVEMENT MATERIALS
 TESTING FOR PAVEMENT MATERIALS") SPECIFICATION FOR REPEATED LOAD TRIAXIAL (RLT) TESTING FOR PAVEMENT MATERIALS 1. SCOPE This specification details the six (6) stage permanent strain Repeated Load Triaxial (RLT) test for unbound and modified
SPECIFICATION FOR REPEATED LOAD TRIAXIAL (RLT) TESTING FOR PAVEMENT MATERIALS 1. SCOPE This specification details the six (6) stage permanent strain Repeated Load Triaxial (RLT) test for unbound and modified
HCMTCB ASPHALT CERTIFICATION KEY ELEMENTS LIST
 HCMTCB ASPHALT CERTIFICATION KEY ELEMENTS LIST Release Date: November 6, 2014 AASHTO T-168 Sampling of Bituminous Material Funnel Device 1 Select units to be sampled by what method? 2 Relative size and
Method of Test for Determining the Cutout Correction and In Place Density of Asphalt Concrete by the Nuclear Gauge Method
 Method of Test for Determining the Cutout Correction and In Place Density of Asphalt Concrete by the Nuclear Gauge Method 1. Scope: This test is for determining the in place density of asphalt concrete
IN-PLACE DENSITY OF BITUMINOUS MIXES USING THE NUCLEAR MOISTURE-DENSITY GAUGE FOP FOR WAQTC TM 8
 OF BITUMINOUS MIXES USING THE NUCLEAR MOISTURE-DENSITY GAUGE FOP FOR WAQTC TM 8 Scope This test method describes a test procedure for determining the density of bituminous mixes by means of a nuclear gauge
Method of Test for Sieve Analysis
 Method of Test for Sieve Analysis 1. Scope: This test is for determining sieve analysis of subbase, base course, mineral aggregate (Surface course materials), concrete aggregates, fillers, and similar
Oct 1, 2002 LAB MANUAL SPECIFIC GRAVITY & ABSORPTION of FINE AGGREGATE AASHTO Designation T 84 (Mn/DOT Modified)
") Oct 1, 2002 LAB MANUAL 1205.0 1205 SPECFC GRAVTY & ABSORPTON of FNE AGGREGATE AASHTO Designation T 84 (Mn/DOT Modified) 1205.1 GENERAL This test method is intended for use in determining the bulk and apparent
Oct 1, 2002 LAB MANUAL 1205.0 1205 SPECFC GRAVTY & ABSORPTON of FNE AGGREGATE AASHTO Designation T 84 (Mn/DOT Modified) 1205.1 GENERAL This test method is intended for use in determining the bulk and apparent
9 QUALITY ASSURANCE PROCEDURES
 9 QUALITY ASSURANCE PROCEDURES Random Numbers Design Mix Formula Lot/Sublot -- QC/QA HMA and SMA Acceptance Samples Adjustment Period -- QC/QA HMA and SMA Mixture Acceptance QC/QA HMA HMA SMA Pay Factors
Hot Mix Asphalt (HMA) Quality Assurance
 Quality Assurance") Supplemental Technical Specification for March 3, 2010 Hot Mix Asphalt (HMA) Quality Assurance SCDOT Designation: SC-M-400 (05/10) 1. SCOPE Base field acceptance of hot mix asphalt (HMA) mixtures on asphalt
Supplemental Technical Specification for March 3, 2010 Hot Mix Asphalt (HMA) Quality Assurance SCDOT Designation: SC-M-400 (05/10) 1. SCOPE Base field acceptance of hot mix asphalt (HMA) mixtures on asphalt
Tex-207-F, Determining Density of Compacted Bituminous Mixtures
 Overview Effective date: August 1999 to October 2004. Use this method to determine the bulk specific gravity of specimens of compacted bituminous mixtures. Use the bulk specific gravity of the compacted
FINAL REPORT INVESTIGATION OF TEST METHODS, PAVEMENTS, AND LABORATORY DESIGN RELATED TO ASPHALT PERMEABILITY
 FINAL REPORT INVESTIGATION OF TEST METHODS, PAVEMENTS, AND LABORATORY DESIGN RELATED TO ASPHALT PERMEABILITY G. W. Maupin, Jr. Principal Research Scientist (The opinions, findings, and conclusions expressed
Inspection and Acceptance of Asphalt Mix Design Laboratories
 Supplemental Technical Specification for Inspection and Acceptance of Asphalt Mix Design Laboratories SCDOT Designation: SC-M-405 (05/1/14) 1. SCOPE 1.1 This specification covers the process for inspection
Hot Mix Asphalt (HMA) Quality Assurance
 Quality Assurance") Supplemental Technical Specification for May 2, 2008 Hot Mix Asphalt (HMA) Quality Assurance SCDOT Designation: SC-M-400V (06/08) 1. SCOPE Base field acceptance of hot mix asphalt (HMA) mixtures on asphalt
Supplemental Technical Specification for May 2, 2008 Hot Mix Asphalt (HMA) Quality Assurance SCDOT Designation: SC-M-400V (06/08) 1. SCOPE Base field acceptance of hot mix asphalt (HMA) mixtures on asphalt
IN-PLACE DENSITY AND MOISTURE CONTENT OF SOIL AND SOIL- AGGREGATE BY NUCLEAR METHODS (SHALLOW DEPTH) FOP FOR AASHTO T 310
 FOP FOR AASHTO T 310") AND MOISTURE CONTENT OF SOIL AND SOIL- AGGREGATE BY NUCLEAR METHODS (SHALLOW DEPTH) FOP FOR AASHTO T 310 Scope This procedure covers the determination of density, moisture content, and relative compaction
AND MOISTURE CONTENT OF SOIL AND SOIL- AGGREGATE BY NUCLEAR METHODS (SHALLOW DEPTH) FOP FOR AASHTO T 310 Scope This procedure covers the determination of density, moisture content, and relative compaction
Using RAP in Asphalt Mixtures
 Using RAP in Asphalt Mixtures R. Michael (Mike) Anderson Asphalt Institute Workshop: Modified Asphalt in a RAP World Albuquerque, NM June 16, 2016 Acknowledgments DTFH61-08-H-00030 Cooperative Agreement
Asphalt Mixture Quality Assurance
 Supplemental Technical Specification for Asphalt Mixture Quality Assurance SCDOT Designation: SC-M-400 (10/13) 1. SCOPE Base field acceptance of asphalt mixtures on asphalt binder content, air voids, voids
Project Update: Characterization of Alaskan Hot-Mix Asphalt containing RAP
 Project Update: Characterization of Alaskan Hot-Mix Asphalt containing RAP Jenny Liu, Sheng Zhao and Beaux Kemp 06/25/15 Outline Introduction Problem Statement Background Objectives Recycled Asphalt Pavement
Missouri University of Science & Technology. MoDOT TENSILE STRENGTH RATIO (TSR) TRAINING/CERTIFICATION COURSE
 TRAINING/CERTIFICATION COURSE") Missouri University of Science & Technology Department of Civil, Architectural, and Environmental Engineering MoDOT TENSILE STRENGTH RATIO (TSR) TRAINING/CERTIFICATION COURSE 9-20-06 1-29-07 11-18-09 11-10-10
Missouri University of Science & Technology Department of Civil, Architectural, and Environmental Engineering MoDOT TENSILE STRENGTH RATIO (TSR) TRAINING/CERTIFICATION COURSE 9-20-06 1-29-07 11-18-09 11-10-10
Chapter 37 Tex-241-F, Superpave Gyratory Compacting of Test Specimens of Bituminous Mixtures
 Chapter 37 Tex-241-F, Superpave Gyratory Compacting of Test Specimens of Bituminous Contents: Section 1 Overview... 37-2 Section 2 Apparatus... 37-3 Section 3 Calibration... 37-5 Section 4 Preparations...
NCHRP Project Synthesis Topic Tack Coat Specifications, Materials, and Construction Practices
 NCHRP Project 20-05 Synthesis Topic 48-02 Tack Coat Specifications, Materials, and Construction Practices Danny Gierhart, P.E. Dave Johnson, P.E. Principal Investigators What Exactly Is a Synthesis? A
Sept 23, 2014 LAB MANUAL
 Sept 23, 2014 LAB MANUAL 1000.0 1000 STANDARD PRACTICES 1000.1 CALCULATIONS and FORMS Throughout this manual there are test calculation procedures. These calculations are provided so that a technician
BALANCED MIX DESIGN APPROACH. Robert Lee, P.E. Flexible Pavements Director
 BALANCED MIX DESIGN APPROACH Robert Lee, P.E. Flexible Pavements Director TxAPA Annual Meeting - 2016 Initial Thoughts Dry mixes are prevalent in our industry. Lowering N-design and raising lab molded
OHD L-44 METHOD OF TEST FOR MEASUREMENT OF WATER PERMEABILITY OF COMPACTED PAVING MIXTURES
 Page 1 of 7 METHOD OF TEST FOR MEASUREMENT OF WATER PERMEABILITY OF COMPACTED PAVING MIXTURES 1. SCOPE A. This test method covers the laboratory determination of the water conductivity of a compacted asphalt
Gilson Aqua-Check Moisture Tester MA-26X
 OPERATING MANUAL Gilson Aqua-Check Moisture Tester MA-26X Rev: 01/2019 PHONE: 800-444-1508 P.O. Box 200, Lewis Center, Ohio 43035-0200 740-548-7298 E-mail: customerservice@gilsonco.com Product Web Page:
DEVELOPMENT AND TESTING OF AIR EXCHANGE RATE METHODS TO IMPROVE COST EFFECTIVENESS WHILE MAINTAINING ACCURACY
 DEVELOPMENT AND TESTING OF AIR EXCHANGE RATE METHODS TO IMPROVE COST EFFECTIVENESS WHILE MAINTAINING ACCURACY Prepared by: Joachim Eberharter (Joachim.Eberharter@tetratech.com) and James Elliot (Tetra
Calibration and Validation of the Shell Fatigue Model Using AC10 and AC14 Dense Graded Hot Mix Asphalt Fatigue Laboratory Data
 Article Calibration and Validation of the Shell Fatigue Model Using AC10 and AC14 Dense Graded Hot Mix Asphalt Fatigue Laboratory Data Mofreh Saleh University of Canterbury, Private Bag 4800, Christchurch,
December 2017 Research Report: UCPRC-RR
 December 2017 Research Report: UCPRC-RR-2016-05 Authors: A. Mateos and D. Jones Partnered Pavement Research Center (PPRC) Contract Strategic Plan Element 3.32 (DRISI Task 2672): Support for Superpave Implementation
IA ASPHALT EVAULATION PERFORMANCE EVAULATION
 IA ASPHALT EVAULATION PERFORMANCE EVAULATION SiteManager ID: PHONE #: Technician: DATE: E-Mail: Level: PASS FAIL AASHTO T-168 AASHTO R-47 OHD L-26 AASHTO T-30 AASHTO T-176 ASSHTO T-312 OHD L-45 (CORELOK)
SUPPORTING NOTES FOR THE EVALUATION OF UNBOUND ROAD BASE AND SUB-BASE AGGREGATES
 SUPPORTING NOTES FOR THE EVALUATION OF UNBOUND ROAD BASE AND SUB-BASE AGGREGATES (These notes are guidelines only and must not be included in the Contract Documents). 1. SCOPE These Notes are guidelines
Vacuum Pycnometer BM705. Impact Test Equipment Ltd & User Guide. User Guide
 Vacuum Pycnometer BM705 Impact Test Equipment Ltd www.impact-test.co.uk & www.impact-test.com User Guide User Guide Impact Test Equipment Ltd. Building 21 Stevenston Ind. Est. Stevenston Ayrshire KA20
Soil Aggregate *Nominal Maximum Minimum Weight No. of Splits to Obtain Designation Sieve Size of Particle of Sample, Ibs Portion for Test
 STATE OF OHIO DEPARTMENT OF HIGHWAYS SUPPLEMENT 1005 METHOD OF TEST FOR SIEVE ANALYSIS OF ALL MATERIALS FOR USE IN ITEMS 304, 411, 603 Type 1 & 2, and 617 April 12, 2002 1005.1 Scope 1005.2 Sample Preparation
Use Part II for absorptive mixtures that have more than 2.0 percent water absorption.
 Overview Effective dates: November 2004 December 2004. Use this test method to determine the bulk specific gravity of compacted bituminous mixture specimens. Use the bulk specific gravity of the specimens
AGGREGATE INFORMATION
 100 90 NEW YORK STATE Facility No. Formula No. Plant Region 11 MATERIALS BUREAU Plant Location JOB MIX FORMULA Submitted Date 1/3/2016 H NYSDOT TYPE 7F TOP COURSE (HIGH FRICTION) 0 AGGREGATE SAMPLING FREQUENCY
Inspection and Approval of Asphalt Mix Design Laboratories
 Supplemental Technical Specification for Inspection and Approval of Asphalt Mix Design Laboratories SCDOT Designation: SC-M-405 (06/07) 1. SCOPE 1.1 This method covers the process for inspection and approval
Separating Load from Moisture Effects in Wet Hamburg Wheel-Track Test
 1 Separating Load from Moisture Effects in Wet Hamburg Wheel-Track Test Quan (Mike) Lv, Ph.D. Hussain Bahia, Ph.D. March 6, 2019 Fort Worth, Texas School of Transportation Engineering Tongji University
DETERMINING DENSITY OF COMPACTED BITUMINOUS MIXTURES
 Test Procedure for DETERMINING DENSITY OF COMPACTED Texas Department of Transportation TxDOT Designation: Tex 207 F Effective Date: May 2007 1. SCOPE 1.1 This test method determines the bulk specific gravity
Florida Method of Test for MEASUREMENT OF WATER PERMEABILITY OF COMPACTED ASPHALT PAVING MIXTURES
 Florida Method of Test for MEASUREMENT OF WATER PERMEABILITY OF COMPACTED ASPHALT PAVING MIXTURES 1. SCOPE Designation: FM 5-565 1.1 This test method covers the laboratory determination of the water conductivity
OHD L-44 METHOD OF TEST FOR MEASUREMENT OF WATER PERMEABILITY OF COMPACTED PAVING MIXTURES
 Page 1 of 6 METHOD OF TEST FOR MEASUREMENT OF WATER PERMEABILITY OF COMPACTED PAVING MIXTURES 1. SCOPE A. This test method covers the laboratory determination of the water conductivity of a compacted asphalt
Development of a Fundamental Skid Resistance Asphalt Mix Design Procedure
 Development of a Fundamental Skid Resistance Asphalt Mix Design Procedure 1 Pavement Management Service, Sydney, Australia ABSTRACT Traditionally, when designing asphalt mixtures for skid resistance, designers
Method of Test for Flat & Elongated Particles
 Method of Test for Flat & Elongated Particles 1. Scope: This test is for determining the percentage by weight of coarse aggregate that have a maximum to minimum dimension greater than the specified ratio
HCMTCB MATERIALS SAMPLING & TESTING PERFORMANCE CHECKLIST
 HCMTCB MATERIALS SAMPLING & TESTING PERFORMANCE CHECKLIST Release Date: January 7, 2014 Sampling Coarse Aggregate PERFORMANCE CHECKLIST AASHTO T-2 Sampling of Aggregates Sampling From A Stockpile 1 When
Density of Granular Material by Modified Sand-Cone Method for Thin Layers
 Density of Granular Material by Modified Sand-Cone Method for Thin Layers 1. Scope: This test is for determining in-place density of granular materials that have a total thickness of 3 or less. 2. Apparatus:
Legendre et al Appendices and Supplements, p. 1
 Legendre et al. 2010 Appendices and Supplements, p. 1 Appendices and Supplement to: Legendre, P., M. De Cáceres, and D. Borcard. 2010. Community surveys through space and time: testing the space-time interaction
Managing Density For Asphalt Pavement
 Managing Density For Asphalt Pavement 1 Density vs. Pavement Performance 2 Cost of Compaction Least expensive part of the process Compaction adds little to the cost of a ton of asphalt Importance of Compaction
OHD L-43 METHOD OF TEST FOR DETERMINING RUTTING SUSCEPTIBILITY USING THE ASPHALT PAVEMENT ANALYZER
 Page 1 of 12 METHOD OF TEST FOR DETERMINING RUTTING SUSCEPTIBILITY USING THE ASPHALT PAVEMENT ANALYZER 1. SCOPE 1.1 This method describes a procedure for testing the rutting susceptibility of asphaltaggregate
Warm Mix Asphalt in the United States: From Evolution to Revolution
 Warm Mix Asphalt in the United States: From Evolution to Revolution Matthew Corrigan, P.E. Asphalt Pavement Engineer Mobile Asphalt Testing Trailer Technical Manager U.S. DOT Federal Highway Administration
Tex-207, Determining Density of Compacted Bituminous Mixtures
 Section 1 Overview Tex-207, Determining Density of Compacted Bituminous Mixtures Texas Department of Transportation 1 TxDOT 01/05 04/07 Section 1 Overview Section 1 Overview Effective date: January 2005
Real-Time Smoothness Measurements on Concrete Pavements During Construction
 Recommended Practice for Real-Time Smoothness Measurements on Concrete Pavements During Construction XX-## (2017) 1. SCOPE 1.1. This document provides language that can be used by an Owner-Agency to develop
State of Nevada Department of Transportation Materials Division METHOD OF TEST FOR DETERMINING THE LIQUID LIMIT OF SOIL
 State of Nevada Department of Transportation Materials Division METHOD OF TEST FOR DETERMINING THE LIQUID LIMIT OF SOIL SCOPE The liquid limit of a soil is that water content, as determined in accordance
Autodesk Moldflow Communicator Process settings
 Autodesk Moldflow Communicator 212 Process settings Revision 1, 3 March 211. Contents Chapter 1 Process settings....................................... 1 Profiles.................................................
Specific Accreditation Criteria Calibration ISO IEC Annex. Mass and related quantities
 Specific Accreditation Criteria Calibration ISO IEC 17025 Annex Mass and related quantities January 2018 Copyright National Association of Testing Authorities, Australia 2014 This publication is protected
DETERMINING DENSITY OF COMPACTED BITUMINOUS MIXTURES
 Test Procedure for DETERMINING DENSITY OF COMPACTED BITUMINOUS MIXTURES TxDOT Designation: Tex-207-F Effective Dates: April 2008 July 2016. 1. SCOPE 1.1 This test method determines the bulk specific gravity
Compaction Theory and Best Practices
 Compaction Theory and Best Practices 2017 Idaho Asphalt Conference Moscow Idaho October 26, 2017 Dave Johonson, P.E. Senior Regional Engineer Asphalt Institute Understanding the Importance of Density 1
Safety Assessment of Installing Traffic Signals at High-Speed Expressway Intersections
 Safety Assessment of Installing Traffic Signals at High-Speed Expressway Intersections Todd Knox Center for Transportation Research and Education Iowa State University 2901 South Loop Drive, Suite 3100
Density of Soils and/or Granular Material In-place by the Sand-Cone Method
 Density of Soils and/or Granular Material In-place by the Sand-Cone Method 1. Scope: This test is for determining the in-place density of soils and/or granular materials. 2. Apparatus: 2.1 Density apparatus
Tex-616-J, Construction Fabrics
 Contents: Section 1 Overview... Section s...3 Section 3 Archived Versions...10 Texas Department of Transportation 1 06/00 1/07 Section 1 Overview Effective dates: June 000 December 007. Section 1 Overview
MIL-STD-883G METHOD
 STEADY-STATE LIFE 1. PURPOSE. The steady-state life test is performed for the purpose of demonstrating the quality or reliability of devices subjected to the specified conditions over an extended time
Evaluating the Design Safety of Highway Structural Supports
 Evaluating the Design Safety of Highway Structural Supports by Fouad H. Fouad and Elizabeth A. Calvert Department of Civil and Environmental Engineering The University of Alabama at Birmingham Birmingham,
Memorandum Background: Results and Discussion:
 Memorandum To: Dr. Abercromby From: Jason Rapp and Matthew Stumbo Date: January 17, 2012 Subject: Vacuum Chamber Basics Technical Memo Background: We explored several aspects of vacuum chambers, in preparation
Effects of Traffic Signal Retiming on Safety. Peter J. Yauch, P.E., PTOE Program Manager, TSM&O Albeck Gerken, Inc.
 Effects of Traffic Signal Retiming on Safety Peter J. Yauch, P.E., PTOE Program Manager, TSM&O Albeck Gerken, Inc. Introduction It has long been recognized that traffic signal timing can have an impact
Sizing Pulsation Dampeners Is Critical to Effectiveness
 Sizing Pulsation Dampeners Is Critical to Effectiveness Pressure variation is an important consideration when determining the appropriate size pulsation dampener needed for an application. by David McComb,
Evaluation of the Wisconsin DOT Walking Profiler
 Final Report Evaluation of the Wisconsin DOT Walking Profiler March 2007 U.S. Department of Transportation Federal Highway Administration Notice This document is disseminated under the sponsorship of the
Tex-416-A, Air Content of Freshly-Mixed Concrete by the Pressure Method
 by the Pressure Method Contents: Section 1 Overview...2 Section 2 Apparatus...3...5 Section 4 Calculations...12 Texas Department of Transportation 1 08/99 06/08 Section 1 Overview Effective dates: August
WP2 Fire test for toxicity of fire effluents
 Pagina 3 di 89 TRA SFEU VTT 22.6.2009 v.2 WP2 Fire test for toxicity of fire effluents Task 2.1.2 Development of small-scale test method for fire effluents Step 1: Use of modeling Plans according to DoW:
A Traffic Operations Method for Assessing Automobile and Bicycle Shared Roadways
 A Traffic Operations Method for Assessing Automobile and Bicycle Shared Roadways A Thesis Proposal By James A. Robertson Submitted to the Office of Graduate Studies Texas A&M University in partial fulfillment
Troxler Electronic Laboratories, Inc.
 TROXLER MODELS 3400 4640 BASIC GAUGE OPERATIONS Troxler Electronic Laboratories, Inc. 3008 Cornwallis Road P.O. Box 12057 Research Triangle Park, NC 27709 Phone: 1.877.TROXLER Outside the U.S.A.: +1.919.549.8661
MILITARY SPECIFICATION POWDER, BLACK
 INCH-POUND 2 October 1998 SUPERSEDING AMENDMENT 1 10 June 1997 MILITARY SPECIFICATION POWDER, BLACK This Amendment forms a part of Military Specification dated 5 February 1993, and is approved for use
Asphalt Pavement Analyzer (APA) Evaluation
 Evaluation") 2003-02 Final Report Asphalt Pavement Analyzer (APA) Evaluation Technical Report Documentation Page 1. Report No. 2. 3. Recipients Accession No. MN/RC 2003-02 4. Title and Subtitle 5. Report Date ASPHALT
2003-02 Final Report Asphalt Pavement Analyzer (APA) Evaluation Technical Report Documentation Page 1. Report No. 2. 3. Recipients Accession No. MN/RC 2003-02 4. Title and Subtitle 5. Report Date ASPHALT
STATE OF OHIO DEPARTMENT OF TRANSPORTATION SUPPLEMENT 1055 ASPHALT MAT DENSITY BY GAUGE TESTING. January 15, 2016
 STATE OF OHIO DEPARTMENT OF TRANSPORTATION SUPPLEMENT 1055 ASPHALT MAT DENSITY BY GAUGE TESTING January 15, 2016 1055.01 General 1055.02 Equipment and Operation 1055.03 Minimum Density Target Determination
Predicted Dispense Volume vs. Gravimetric Measurement for the MICROLAB 600. November 2010
 Predicted Dispense Volume vs. Gravimetric Measurement for the MICROLAB 600 November 2010 Table of Contents ``Abstract...3 ``Introduction...4 ``Methods & Results...6 ``Data Analysis...9 ``Conclusion...12
Laboratory Activity Measurement and Density. Average deviation = Sum of absolute values of all deviations Number of trials
 Laboratory Activity Measurement and Density Background: Measurements of mass and volume are very common in the chemistry laboratory. The analytical balance is used to measure mass, and the graduated cylinder,
Asphalt Pavement Analyzer Used to Assess Rutting Susceptibility of Hot-Mix Asphalt Designed for High Tire Pressure Aircraft
 Asphalt Pavement Analyzer Used to Assess Rutting Susceptibility of Hot-Mix Asphalt Designed for High Tire Pressure Aircraft John F. Rushing, Dallas N. Little, and Navneet Garg Hot-mix asphalt (HMA) laboratory
Full Depth Reclamation ALDOT FDR Requirements Lyndi D. Blackburn, PE
 Full Depth Reclamation ALDOT FDR Requirements Lyndi D. Blackburn, PE Assistant Materials and Tests Engineer Alabama Department of Transportation Bureau of Materials and Tests 110 + MILES ALDOT FDR TOTALS
extraction of EG and DEG from the matrix. However, the addition of all diluent at once resulted in poor recoveries.
 Informal Commentary Limit of Diethylene Glycol (DEG) and Ethylene Glycol (EG) in Sorbitol Solution, Sorbitol Sorbitan Solution and Noncrystallizing Sorbitol Solution December 2009 Monograph/Section(s):