December 2017 Research Report: UCPRC-RR
|
|
|
- Jean Pierce
- 5 years ago
- Views:
Transcription
: Support for Superpave Implementation PREPARED FOR: California Department of Transportation Division of Research, Innovation, and System Information Office of Materials and")
1 December 2017 Research Report: UCPRC-RR Authors: A. Mateos and D. Jones Partnered Pavement Research Center (PPRC) Contract Strategic Plan Element 3.32 (DRISI Task 2672): Support for Superpave Implementation PREPARED FOR: California Department of Transportation Division of Research, Innovation, and System Information Office of Materials and Infrastructure Roadway Research PREPARED BY: University of California Pavement Research Center UC Davis, UC Berkeley
2
3 TECHNICAL REPORT DOCUMENTATION PAGE 1. REPORT NUMBER UCPRC-RR GOVERNMENT ASSOCIATION NUMBER 3. RECIPIENT S CATALOG NUMBER 4. TITLE AND SUBTITLE Support for Superpave Implementation: Round Robin Hamburg Wheel-Track Testing 5. REPORT PUBLICATION DATE December PERFORMING ORGANIZATION CODE 7. AUTHOR(S) A. Mateos and D. Jones 9. PERFORMING ORGANIZATION NAME AND ADDRESS University of California Pavement Research Center Department of Civil and Environmental Engineering, UC Davis 1 Shields Avenue Davis, CA SPONSORING AGENCY AND ADDRESS California Department of Transportation Division of Research, Innovation, and System Information P.O. Box Sacramento, CA PERFORMING ORGANIZATION REPORT NO. UCPRC-RR WORK UNIT NUMBER 11. CONTRACT OR GRANT NUMBER 65A TYPE OF REPORT AND PERIOD COVERED Research Report April 2015 April SPONSORING AGENCY CODE 15. SUPPLEMENTAL NOTES 16. ABSTRACT A round robin testing program was undertaken between 20 participating laboratories in California to assess the reproducibility of Hamburg Wheel-Track (HWT) test results as part of a Superpave implementation initiative. Each laboratory conducted four HWT tests. Two of the tests were conducted on gyratory-compacted specimens prepared by the University of California Pavement Research Center (UCPRC), and the other two were conducted on gyratory-compacted specimens prepared by each of the participating laboratories using loose mix supplied by the UCPRC. A three-quarter inch mix with five percent PG asphalt binder content was sampled from a northern California asphalt plant for the study. Laboratories reported test results in terms of rut depth after 5,000, 10,000, 15,000, and 20,000 wheel passes; number of passes to 0.5 in. (12.5 mm) rut depth; creep slope; stripping slope; and stripping inflection point. Some laboratories also submitted raw test data for further analysis by the UCPRC. An analysis of variance was used to determine which factors had a significant influence on the test results and to determine the indices of precision of the different result variables. Indices of precision could not be determined for all variables due the relatively good performance of the mix. Single-operator variability was relatively high for all variables. Between-laboratory variability was shown to be strongly related to several measurement and result-interpretation aspects that are not fully defined in the AASHTO T 324 test method. This variability was clearly reduced when unique criteria were used in the data analysis. 17. KEY WORDS Hamburg Wheel-Track Test, Round Robin Testing, Superpave Implementation 18. DISTRIBUTION STATEMENT No restrictions. This document is available to the public through the National Technical Information Service, Springfield, VA SECURITY CLASSIFICATION (of this report) Unclassified 20. NUMBER OF PAGES 21. PRICE None Reproduction of completed page authorized UCPRC-RR i
4 UCPRC ADDITIONAL INFORMATION 1. DRAFT STAGE Final 2. VERSION NUMBER 1 3. PARTNERED PAVEMENT RESEARCH CENTER STRATEGIC PLAN ELEMENT NUMBER DRISI TASK NUMBER CALTRANS TECHNICAL LEAD AND REVIEWER(S) B. Banzon 6. FHWA NUMBER CA182672A 7. PROPOSALS FOR IMPLEMENTATION None 8. RELATED DOCUMENTS None 9. LABORATORY ACCREDITATION The UCPRC laboratory is accredited by AASHTO re:source for the tests listed in this report 10. SIGNATURES A. Mateos FIRST AUTHOR J.T. Harvey TECHNICAL REVIEW D. Spinner EDITOR J.T. Harvey PRINCIPAL INVESTIGATOR Reproduction of completed page authorized B. Banzon CALTRANS TECH. LEADS T.J. Holland CALTRANS CONTRACT MANAGER ii UCPRC-RR
5 DISCLAIMER STATEMENT This document is disseminated in the interest of information exchange. The contents of this report reflect the views of the authors who are responsible for the facts and accuracy of the data presented herein. The contents do not necessarily reflect the official views or policies of the State of California or the Federal Highway Administration. This publication does not constitute a standard, specification or regulation. This report does not constitute an endorsement by the California Department of Transportation of any product described herein. For individuals with sensory disabilities, this document is available in alternate formats. For information, call (916) , TTY 711, or write to California Department of Transportation, Division of Research, Innovation and System Information, MS-83, P.O. Box , Sacramento, CA PROJECT OBJECTIVES This project is a continuation of PPRC Project (Superpave Implementation). The objective of this project is to support the implementation of the Superpave hot mix asphalt (HMA) mix design process in California. This will be achieved through the following tasks: 1. Establishment of an annual statewide round robin study for the Hamburg Wheel-Track Test to determine precision and bias statements, and to make recommendations for incorporation of these in revised specifications. If adopted, arrangements for periodic round robin studies will be taken over by the California Department of Transportation s Materials Evaluation and Testing Services Independent Assurance Program. 2. Assess differences between laboratory and plant-produced mixes for performance related tests. 3. Review appropriateness and applicability of quality control/quality assurance (QC/QA) testing on Superpave projects and provide recommendations for revised specifications, if justified. 4. Monitor performance of Superpave projects constructed to date. This report covers the first task in the study. UCPRC-RR iii
6 Blank page iv UCPRC-RR
7 EXECUTIVE SUMMARY A round robin study in which 20 laboratories participated has been completed. Each laboratory conducted four Hamburg Wheel-Track (HWT) tests. Two of the tests were conducted on specimens compacted by the University of California Pavement Research Center (UCPRC), and the other two on specimens compacted by each of the participating laboratories using loose mix provided by the UCPRC. A single plant-produced 3/4 in. mix with 5.0 percent PG binder was evaluated. The laboratories reported test results in terms of rut depth after 5,000, 10,000, 15,000, and 20,000 wheel passes, number of passes to 12.5 mm (0.5 in.) rut depth, creep slope, stripping slope, and stripping inflection point. Fourteen laboratories submitted the raw test data (all laboratories were requested to submit this information). The main conclusions drawn from this experiment include the following: The rutting and moisture resistance of the mix were relatively good. However, a clear stripping phase was reached in approximately 25 percent of the tests conducted on the specimens compacted at the UCPRC. Specimens compacted at the participating laboratories had better performance than the specimens compacted at the UCPRC. It is not clear why this occurred, but analysis of the results indicate that specimen air-void content did not contribute to the difference in results. Between-laboratory variability related to specimen fabrication was much smaller than the variability introduced by testing and data analysis. The type of HWT test device used for testing was shown to be significant only for the rut depth after 5,000 and 10,000 passes (i.e., for results obtained in the early part of the tests). Test results from left and right wheels were independent of each other for the two HWT test results specified in Section 39 of the 2015 Caltrans Standard Specifications, namely the number of passes to the stripping inflection point and number of passes to 12.5 mm (0.5 in.). Single-operator variability was relatively high (low repeatability) for all variables. This result is believed to be related, at least in part, to the good performance of the mix used for the experiment. Between-laboratory variability was relatively high for all variables except for the rut depth after a predetermined number of wheel passes. This high variability was shown to be related to different interpretations of how the rut depth is measured and analyzed. Between-laboratory variability clearly improved when the same criteria were used to analyze the raw data provided by the participating laboratories. Comparison of results submitted by the different laboratories to results determined by the UCPRC using the same raw data shows that a high degree of subjectivity was present in the HWT test data analysis conducted by the participating laboratories. Precision indices could only be determined for one of the HWT test results specified in Section 39 of the 2015 Caltrans Standard Specifications, namely the number of passes to the stripping inflection point. For this variable, single-operator and multilaboratory coefficients of variation were, respectively, 22 percent and 33 percent. Multilaboratory coefficient of variation would improve to 22 percent if fixed criteria had been used by all laboratories in the analysis. Precision UCPRC-RR v
8 estimates of the number of passes to 12.5 mm could not be determined due to the very limited number of tests where this threshold value was reached. Additional precision statements were formulated for other HWT test results, including creep and strip slopes and rut depth after a predetermined number of wheel passes. These statements may be applicable if Caltrans specifications are revised based on one or more of these variables. The following recommendations are expected to contribute to improving HWT test single-operator and multilaboratory variability: Laboratories conducting HWT testing should receive additional instructions that supplement or clarify aspects of the AASHTO T 324 test method that can be interpreted in different ways. Items that need to be clarified, specified, defined, or expanded include the following: + The length of the wheelpath. + The locations along the wheelpath that should be used to compute rut depth. The capabilities of the different types of HWT test devices should be considered in this definition, since most of them can only record rutting at predefined locations. + The specific procedure that should be used to compute the rut depth from the different measuring locations (i.e., whether the maximum, the average, or any other representative value should be used). Detailed guidelines, with examples, should be written for defining the creep and stripping stationary phases and for determining the stripping inflection point since these definitions are currently very subjective. These guidelines should use a general purpose spreadsheet or similar analysis tool since they might not be compatible with the software installed in the different testing machines. These guidelines, along with training, and practice, may lead to more uniform results from different laboratories, thereby reducing between-laboratory variability in data analysis. Future round robin study exercises should include both good- and marginal-performing mixes, and should also include a practical exercise in which an additional three sets of raw data are sent to all the participating laboratories for analysis. The results reported by the laboratories could be used to better determine the between-laboratory variability related to data analysis and to prepare more realistic precision statements. vi UCPRC-RR
9 TABLE OF CONTENTS EXECUTIVE SUMMARY... v LIST OF TABLES...viii LIST OF FIGURES...viii LIST OF ABBREVIATIONS... x TEST METHODS CITED IN THE REPORT... x CONVERSION FACTORS... xi 1. INTRODUCTION Background to the Project Project Objectives Report Structure Measurement Units STUDY APPROACH Introduction Test Plan Considerations Mix Specimen Fabrication Distribution of Specimens Round Robin Testing Instructions Round Robin Reporting Instructions Result Reporting Data Analysis by the UCPRC Terminology Used in the Analysis DATA SUMMARY Introduction Specimen Air-Void Contents Rut Depth Measurements DATA ANALYSIS Analysis of Data Consistency Statistical Model Definition Determination of Variance Components Analysis of Raw Data by the UCPRC Determination of Variance Components for UCPRC Analysis Results Formulation of Precision Statements Precision Statements for Rut Depth after a Predetermined Number of Passes Precision Statements for Creep and Stripping Slopes Precision Statements for the Number of Passes to Stripping Inflection Point CONCLUSIONS AND RECOMMENDATIONS REFERENCES APPENDIX A: INSTRUCTION SHEET APPENDIX B: RESULT REPORTING TEMPLATE APPENDIX C: PARTICPATING LABORATORIES APPENDIX D: DATA REPORTED BY LABORATORIES APPENDIX E: ANOVA TO DETERMINE SIGNIFICANT FACTORS APPENDIX F: ANOVA TO DETERMINE VARIANCE COMPONENTS UCPRC-RR vii
10 LIST OF TABLES Table 3.1: Summary of Coefficients of Determination (R 2 ) Table 4.1: Summary Indices of Precision for HWT Test Results LIST OF FIGURES Figure 2.1: Specimen fabrication plan... 5 Figure 3.1: Specimen air-void contents Figure 3.2: Air-void content histograms Figure 3.3: Air-void content effect on rut depth Figure 3.4: Rut depths on specimens compacted by the UCPRC Figure 3.5: Rut depths on specimens compacted by participating laboratories Figure 3.6: Rut depth after 5,000 wheel passes Figure 3.7: Rut depth after 10,000 wheel passes Figure 3.8: Rut depth after 15,000 wheel passes Figure 3.9: Rut depth after 20,000 wheel passes Figure 3.10: Number of wheel passes to 12.5 mm rut depth Figure 3.11: Creep slope Figure 3.12: Stripping slope Figure 3.13: Number of passes to stripping inflection point Figure 4.1: Rut depth after 5,000 wheel passes Figure 4.2: Rut depth after 10,000 wheel passes Figure 4.3: Rut depth after 15,000 wheel passes Figure 4.4: Rut depth after 20,000 wheel passes Figure 4.5: Number of passes to 12.5 mm rut depth Figure 4.6: Creep slope Figure 4.7: Stripping slope Figure 4.8: Stripping inflection point Figure 4.9: Factors in the ANOVA analysis Figure 4.10: Factor significance level for HWT test results (SIP = stripping inflection point) Figure 4.11: Machine-type significance level in the ANOVA Figure 4.12: Machine effect on rut depth after 10,000 passes Figure 4.13: Statistical design for the round robin study analysis Figure 4.14: Single-operator standard deviation after predefined number of passes Figure 4.15: Between-laboratory standard deviation after predefined number of passes Figure 4.16: Multilaboratory standard deviation after predefined number of passes Figure 4.17: Single-operator standard deviation for creep and stripping slopes Figure 4.18: Between-laboratory standard deviation for creep and stripping slopes Figure 4.19: Multilaboratory standard deviation for creep and stripping slopes Figure 4.20: UCPRC analysis of rut depth after 20,000 passes Figure 4.21: UCPRC analysis of number of passes to 12.5 mm rut depth Figure 4.22: UCPRC analysis of creep slope Figure 4.23: UCPRC analysis of stripping slope Figure 4.24: UCPRC analysis of number of passes to stripping inflection point Figure 4.25: Single-operator coefficient of variation for test results Figure 4.26: Between-laboratory coefficient of variation for test results Figure 4.27: Indices of precision for rut depth at predetermined number of passes viii UCPRC-RR
11 Figure 4.28: Indices of precision for creep and stripping slopes Figure 4.29: Summary of indexes of precision for HWT test results UCPRC-RR ix
12 LIST OF ABBREVIATIONS AASHTO AMRL ANOVA ASTM Caltrans HMA HVS HWT IA METS MSE MST NCHRP NR PPRC QC/QA RAP RSP SIP SSD TRB TSR UCPRC American Association of State Highway and Transportation Officials AASHTO Materials Reference Laboratory (now AASHTO Accreditation Program [AAP]) Analysis of Variance American Society for Testing and Materials California Department of Transportation Hot mix asphalt Heavy Vehicle Simulator Hamburg Wheel-Track Independent Assurance Materials Engineering and Testing Services Mean square error Mean square of the random factor National Cooperative Highway Research Program Number of replicates Partnered Pavement Research Center Quality control/quality assurance Reclaimed asphalt pavement Reference Sample Program Stripping Inflection Point Saturated surface-dry Transportation Research Board Tensile strength retained University of California Pavement Research Center TEST METHODS CITED IN THE REPORT AASHTO R30 Standard Practice for Mixture Conditioning of Hot-Mix Asphalt (HMA) AASHTO T 166 Standard Method of Test for Bulk Specific Gravity (Gmb) of Compacted Hot Mix Asphalt (HMA) Using Saturated Surface-Dry Specimens AASHTO T 324 Standard Method of Test for Hamburg Wheel-Track Testing of Compacted Hot Mix Asphalt (HMA) AASHTO T 328 Standard Practice for Reducing Samples of Hot Mix Asphalt (HMA) to Testing Size AASHTO T 331 Bulk Specific Gravity (Gmb) and Density of Compacted Hot Mix Asphalt (HMA) Using Automatic Vacuum Sealing Method ASTM C670 Standard Practice for Preparing Precision and Bias Statements for Test Methods for Construction Materials ASTM C802 Standard Practice for Conducting an Interlaboratory Test Program to Determine the Precision of Test Methods for Construction Materials x UCPRC-RR
13 CONVERSION FACTORS SI* (MODERN METRIC) CONVERSION FACTORS APPROXIMATE CONVERSIONS TO SI UNITS Symbol When You Know Multiply By To Find Symbol LENGTH in inches 25.4 Millimeters mm ft feet Meters m yd yards Meters m mi miles 1.61 Kilometers Km AREA in 2 square inches Square millimeters mm 2 ft 2 square feet Square meters m 2 yd 2 square yard Square meters m 2 ac acres Hectares ha mi 2 square miles 2.59 Square kilometers km 2 VOLUME fl oz fluid ounces Milliliters ml gal gallons Liters L ft 3 cubic feet cubic meters m 3 yd 3 cubic yards cubic meters m 3 NOTE: volumes greater than 1000 L shall be shown in m 3 MASS oz ounces Grams g lb pounds Kilograms kg T short tons (2000 lb) megagrams (or "metric ton") Mg (or "t") TEMPERATURE (exact degrees) F Fahrenheit 5 (F-32)/9 Celsius C or (F-32)/1.8 ILLUMINATION fc foot-candles Lux lx fl foot-lamberts candela/m 2 cd/m 2 FORCE and PRESSURE or STRESS lbf poundforce 4.45 Newtons N lbf/in 2 poundforce per square inch 6.89 Kilopascals kpa APPROXIMATE CONVERSIONS FROM SI UNITS Symbol When You Know Multiply By To Find Symbol LENGTH mm millimeters Inches in m meters 3.28 Feet ft m meters 1.09 Yards yd km kilometers Miles mi AREA mm 2 square millimeters square inches in 2 m 2 square meters square feet ft 2 m 2 square meters square yards yd 2 ha Hectares 2.47 Acres ac km 2 square kilometers square miles mi 2 VOLUME ml Milliliters fluid ounces fl oz L liters Gallons gal m 3 cubic meters cubic feet ft 3 m 3 cubic meters cubic yards yd 3 MASS g grams Ounces oz kg kilograms Pounds lb Mg (or "t") megagrams (or "metric ton") short tons (2000 lb) T TEMPERATURE (exact degrees) C Celsius 1.8C+32 Fahrenheit F ILLUMINATION lx lux foot-candles fc cd/m 2 candela/m foot-lamberts fl FORCE and PRESSURE or STRESS N newtons Poundforce lbf kpa kilopascals poundforce per square inch lbf/in 2 *SI is the symbol for the International System of Units. Appropriate rounding should be made to comply with Section 4 of ASTM E380 (Revised March 2003) UCPRC-RR xi
14 Blank page xii UCPRC-RR
15 1. INTRODUCTION 1.1 Background to the Project The California Department of Transportation s Hveem hot mix asphalt mix design process was officially phased out in July 2015 and replaced with a customized Superpave mix design process that introduced a number of new test procedures. After implementation, a range of issues that required evaluation were identified for further evaluation, the findings from which would be used to optimize and/or refine the process and relevant specification language. These issues included testing standards, laboratory and plant mix comparisons, and quality control/quality assurance (QC/QA) procedures (1). The Hamburg Wheel-Track (HWT) test (AASHTO T 324) was adopted as a rutting performance and moisture sensitivity test (supplementing the tensile strength retained [TSR] test) as part of the new mix design and QC/QA procedures. However, at the time of initiating this study, no published precision and bias statements had been developed nationally or in California for the AASHTO T 324 test method, although a limited study by AASHTO (37 laboratories, one HWT device type) to develop precision statements was nearing completion (2). Further, prior to the current California Department of Transportation (Caltrans) and University of California Pavement Research Center (UCPRC) study detailed in this report, no statewide interlaboratory reproducibility studies had been undertaken to compare testing equipment or how laboratories interpreted the HWT test method, prepared specimens, and interpreted and reported test results. This report summarizes the development of and results from the first interlaboratory HWT round robin test program in California. Approximately 40 laboratories in California were operating HWT equipment at the time the study was undertaken. The study was planned according to ASTM C (Standard Practice for Conducting an Interlaboratory Test Program to Determine the Precision of Test Methods for Construction Materials) and ASTM C (Standard Practice for Preparing Precision and Bias Statements for Test Methods for Construction Materials). One plant-produced 3/4 in. mix was sampled for the study from a northern California asphalt plant. Each participating laboratory tested two sets of gyratory-compacted specimens; the first set of specimens was compacted by the UCPRC and the second set was compacted by each laboratory using loose mix provided by the UCPRC. Each laboratory completed four HWT tests, each of which required four specimens (two wheels, two specimens per wheel). Testing was undertaken between July and October Complete sets of results were received from 20 laboratories, including the UCPRC. UCPRC-RR
16 1.2 Project Objectives This project is a continuation of Partnered Pavement Research Center Strategic Plan Element (PPRC SPE) (Superpave Implementation). The objective of this project is to support the implementation of the Superpave hot mix asphalt (HMA) mix design process in California and will be achieved through the following tasks: 1. Establish an annual statewide round robin study for the Hamburg Wheel-Track Test to determine precision and bias statements, and to make recommendations for incorporation of these in revised specifications. If these recommendations are adopted, arrangements for periodic round robin studies will be taken over by the California Department of Transportation s Materials Evaluation and Testing Services Independent Assurance Program. 2. Review the appropriateness and applicability of quality control/quality assurance (QC/QA) testing on Superpave projects and provide recommendations for revised specifications, if justified. 3. Monitor the performance of Superpave projects constructed to date. This report covers the first task in the study. 1.3 Report Structure This research report presents an overview of the work carried out in meeting the objectives of the study, and is organized as follows: Chapter 2 details the study approach. Chapter 3 summarizes the results submitted by the participating laboratories. Chapter 4 discusses the analysis of the data and development of precision statements. Chapter 5 provides conclusions and recommendations. 1.4 Measurement Units Although Caltrans recently returned to the use of U.S. standard measurement units, metric units have always been used by the UCPRC in the design and layout of Heavy Vehicle Simulator (HVS) test tracks, and for laboratory, HVS, and field test measurements and data storage. In this report, both English and metric units (provided in parentheses after the English units) are provided in general discussion. In keeping with convention, metric units are used in laboratory data analyses and reporting. A conversion table is provided on page xi at the beginning of this report. 2 UCPRC-RR
17 2. STUDY APPROACH 2.1 Introduction According to ASTM C802, a valid and well-written test method is one of the criteria that needs to be met before undertaking an interlaboratory study. AASHTO T 324 (Standard Method of Test for Hamburg Wheel-Track Testing of Compacted Hot Mix Asphalt [HMA]) is generally considered to meet this requirement; however, a number of limitations in this test were identified in two recent National Cooperative Highway Research Program (NCHRP) studies that focused on HWT testing (2,3). Caltrans also identified a number of modifications and refinements to the test method, which are included in Section 39 of the Caltrans 2015 Standard Specifications. These Caltrans modifications to the test method include the following: Target air voids must equal 7.0 ± 1.0 percent. Specimens must be compacted in a gyratory compactor and must be 150 mm in diameter and 60 ± 1 mm high. Four test specimens are required to run two tests. The two test results must not be averaged. Test temperature must be set as follows: ± 2 F (45 C ± 1 C) for PG 58 binder ± 2 F (50 C ± 1 C) for PG 64 binder ± 2 F (55 C ± 1 C)for PG 70 binder and above Measurements of the wheel impression must be taken at every 100 passes along the entire length of the specimen. The inflection point is defined as the number of wheel passes at the intersection of the creep slope and the stripping slope at maximum rut depth. Testing shut off must be set at 25,000 passes. Submersion time for samples must not exceed four hours. Other key requirements listed in ASTM C802 that were considered relevant to this Caltrans/UCPRC study include the following: The testing apparatus must be well described in the test method. Tolerances must be defined for the most important variables influencing the test results. Technicians in participating laboratories must have sufficient experience and competency to run the test. The number of laboratories participating in the study must be relatively high. UCPRC-RR
18 2.2 Test Plan Considerations Mix Given that a primary reason for undertaking the round robin study was to assess the use of the HWT test for QC/QA purposes, loose mix sampled from an asphalt plant was considered to be the most appropriate and economical source of material for preparing specimens since multiple mixes prepared in the laboratory might not have been sufficiently consistent for the purposes of the test. One mix that met Caltrans Hveem mix design specifications (3/4 in Type-A) was therefore sampled from a northern California asphalt plant in April Aggregates used in the mix were of alluvial origin, the binder grade was PG 64-16, and the binder content was 5.0 percent by weight of the mix. The mix contained no reclaimed asphalt pavement (RAP). Although use of a single mix for the study was considered a limitation by preventing testing over a range of potentially moisture sensitive mixes this approach was adopted due to time and project funding constraints. Consideration was given to sourcing a moisture sensitive mix for the study to facilitate the analysis of rut depth, creep slope, stripping slope, and stripping inflection point results submitted by the participating laboratories. However, no asphalt plants in northern California produce mixes that would typically fail an HWT test, for obvious reasons. A special mix would therefore have needed to be prepared, but was not considered due to time and project funding constraints Specimen Fabrication Two specimen preparation approaches were evaluated in this round robin study (Figure 2.1), namely: Gyratory-compacted specimens prepared by the UCPRC Gyratory-compacted specimens prepared by each participating laboratory using loose mix supplied by the UCPRC By following this approach, any variability resulting from specimen preparation at one of the participating laboratories would only influence that laboratory s set of test results, and not the test results for the UCPRC-compacted specimens. However, single-operator compaction variability would be present in both sets of prepared specimens. During May 2015, the UCPRC prepared 360 gyratory-compacted specimens at 7.0 ± 1.0 percent air-void content. No additional aging was applied to the mix since it was sampled from an asphalt plant and AASHTO T 324 specifies short-term aging according to AASHTO R30 only for laboratory-produced mix. 4 UCPRC-RR
19 Special care was taken when reheating the loose mix before compaction, given that rutting performance of asphalt mixes is known to improve with increased binder aging. Ovens were preheated to 140 C (284 F) and checked to ensure that the set temperature was stable. Loose mix was then placed into the oven and heated for 120 minutes before being removed and compacted in a Superpave gyratory compactor. Compacted specimens were 150 mm (~ 6 in.) in diameter and 63.5 mm (2.5 in.) in height. The air-void content of each specimen was determined using the CoreLok automatic vacuum sealing method (AASHTO T 331). The air-void contents of 40 of the specimens were also determined according to the AASHTO T 166 (saturated surface-dry) method so that a reliable correlation could be established between the two air-void content determination methods for this particular mix. UCPRC Compacted Lab Compacted LW RW LW RW LW RW LW RW LW RW LW RW LW RW LW RW Set 1 Set 2 Set 1 Set 2 Set 3 Set 4 Set 3 Set 4 Lab 1 Comp. Lab 20 Comp. Lab 1 Lab 20 Lab 1 Lab 20 UCPRC Comp. 1 Mix Figure 2.1: Specimen fabrication plan Distribution of Specimens Forty packages consisting of two five-gallon buckets of loose mix and two plastic canisters each containing four gyratory-compacted specimens were delivered to Caltrans in June 2015 for distribution. Compacted specimens were randomly selected before being placed into the canisters. Caltrans then sent the specimens, an instruction sheet (see Section 2.2.4), and a reporting template (see Section 2.2.6) to each participating laboratory as part of the Caltrans Reference Sample Program (RSP) during July All communication with the participating laboratories was done by Caltrans. The UCPRC did not contact any of the laboratories directly. UCPRC-RR
20 2.2.4 Round Robin Testing Instructions An instruction sheet (see copy in Appendix A) was prepared by the UCPRC in consultation with Caltrans. This sheet covered how to prepare specimens, run the HWT test, and report the results. Each laboratory was asked to conduct four sets of HWT tests (four specimens per set), with each set including two wheels (left and right), as reflected in Figure 2.1. A total of 16 specimens were therefore tested, eight of which were prepared by the UCPRC and eight by the participating laboratory. Specific instructions for testing included the following requirements: Determining the air-void contents of the specimens compacted at the UCPRC in addition to the airvoid contents of the specimens produced by the participating laboratory Setting the HWT testing temperature to 122 F (50 C) Setting the test load to 158 lb (71.6 kg) Setting the testing rate to 52 passes per minute Setting the test termination criteria for when deformation reached a maximum of 24.0 mm (0.94 in.) Setting the maximum number of passes to 25,000 Setting the sampling interval as follows: + Every 20 passes for the first 1,000 passes + Every 50 passes for the second 4,000 passes + Every 100 passes for the remaining passes Round Robin Reporting Instructions An Excel template was also prepared for reporting the test results (see copy in Appendix B). Required results included the following: Rut depth at 5,000 passes (in mm) Rut depth at 10,000 passes (in mm) Rut depth at 15,000 passes (in mm) Rut depth at 20,000 passes (in mm) Number of passes to reach 12.5 mm (0.5 in.) rut depth Creep slope Stripping slope Stripping inflection point (pass) Visual damage (0 to 5 rating where 5 is most damaged) Laboratories were also asked to send the raw data files containing rut depth at different longitudinal positions (positions along the wheelpath) versus number of passes Result Reporting Participating laboratories submitted their results to Caltrans as part of the RSP. Results were received from 20 laboratories (see Appendix C) between July and October Of these 20 laboratories, 14 sent 6 UCPRC-RR
21 raw data files in addition to the completed Excel result sheet. All results were forwarded to the UCPRC by Caltrans Data Analysis by the UCPRC HWT test results were analyzed following the guidelines in ASTM C and ASTM C670. Several steps were followed in this analysis, including the following: 1. Analysis of Data Consistency. Data consistency was analyzed following the procedure detailed in Section 10.4 of ASTM C802. Results from the UCPRC-prepared specimens were analyzed independently of the results from the specimens prepared by the participating laboratories. Analysis was conducted independently for each test result variable (i.e., for each one of the reported variables listed in Section 2.2.5). Outliers were removed from the data for further analysis (criteria for identifying outliers are provided in Appendix D). 2. Statistical Model Definition. An analysis of variance (ANOVA) was conducted to determine which factors had the greatest influence on each one of the test result variables. The influence of laboratory, specimen set, and machine type were analyzed. A statistical model was defined using the results of this ANOVA analysis. 3. Determination of Variance Components. An ANOVA analysis was conducted using the model defined in the previous step. Variance components resulting from this analysis were used to estimate the single-operator standard deviation (the statistic underlying the single-operator indices of precision) and the between-laboratory component of the variance (this statistic, together with the single-operator standard deviation, are the statistics underlying the multilaboratory indices of precision). 4. UCPRC Analysis of Raw Data. Raw data (rut depth versus number of passes) were analyzed by the UCPRC using two different approaches. A more conservative approach that is currently used by Caltrans, where the maximum rut depth along the wheelpath was selected as the primary variable, and a less conservative approach, were deformation values at all measuring locations along the wheelpath were averaged. Results of both analyses were compared to values reported by the participating laboratories. 5. Determination of Variance Components for UCPRC Analysis Results. Step 3 was repeated for the analysis of the raw data by the UCPRC. 6. Formulation of Precision Statements. Single-operator (repeatability) and multilaboratory (reproducibility) precision statements were formulated for each HWT test result variable. 7. Formulation of Bias Statements. Bias statements could not be determined for the HWT test because the values determined (result variables) can be defined only in terms of the test method Terminology Used in the Analysis The terminology used in ASTM C and ASTM C methods was adopted in this report for the discussion of the statistical analysis of the laboratory testing results. This terminology is defined as follows: Single-operator standard deviation, σ r, (or coefficient of variation, CV r ) is the standard deviation (or coefficient of variation) of test determinations obtained on the same material by a single operator UCPRC-RR
22 using the same apparatus in the same laboratory over a relatively short period of time. The term repeatability is used in other publications instead of single-operator. Multilaboratory standard deviation, σ R, (or coeffıcient of variation, CV R ) is the standard deviation (or coefficient of variation) of test results obtained on the same material in different laboratories with different operators using different equipment. The term reproducibility is used in other publications instead of multilaboratory. Between-laboratory variance, σ L ², is the component of the multilaboratory variance, σ R ², related to interlaboratory variability. It should be noted that multilaboratory variability originates from two different sources, one related to the operator (single-operator variability) and the other related to the laboratory (between-laboratory variability). These three standard deviations are related as shown in Equation 2.1. The goal of the statistical analysis is to determine the single-operator standard deviation (σ r ) and between laboratory variance (σ L ), the results of which are used in Equation 2.1 to determine the multilaboratory standard deviation (σ R ), which in turn is used together with the single-operator standard deviation to formulate, respectively, single-operator (repeatability) and multilaboratory (reproducibility) precision statements. (2.1) Where: m = number of test determinations for determining test result (m equals 1 for HWT test following Caltrans specifications, since results of left and right wheels are not averaged) 8 UCPRC-RR
23 3. DATA SUMMARY 3.1 Introduction Twenty laboratories participated in this round robin study. All laboratories conducted the required four HWT tests (two tests on specimens compacted by the UCPRC and the other two on specimens compacted by each laboratory). All laboratories submitted the four tests results as requested in the instruction sheet, while 14 of the 20 laboratories also submitted the requested raw data files containing rut depth versus number of wheel passes. The submitted results are tabulated in Appendix D. 3.2 Specimen Air-Void Contents Specimen air-void contents are summarized in Figure 3.1 (boxes in the plot reflect first, second, and third quartiles; the ends of the whiskers represent minimum and maximum values). The average air-void contents of the specimens compacted by the UCPRC were slightly lower than those compacted by the participating laboratories. Most specimens tested were within the specified range of 7.0 ± 1.0 percent, as shown in Figure 3.2. However, five of the specimens compacted by the UCPRC had air-void contents outside this range, all of them on the low side, and six of the specimens compacted by the participating laboratories were outside this range, with one on the low side and five on the high side Air-Void Content (%) Compacted by UCPRC Compacted by Laboratories Figure 3.1: Specimen air-void contents. UCPRC-RR
24 30% 25% Specified Range: 7.0 ± 1% Probability 20% 15% 10% 5% 0% Air-Void Content (%) Compacted by UCPRC Compacted by Laboratories Figure 3.2: Air-void content histograms. The range in the air-void content of the specimens prepared by the participating laboratories was greater than those prepared by the UCPRC. This was an expected outcome since the interlaboratory component of the variance would be evident in the variability of the specimens compacted by the participating laboratories but was not in the specimens compacted by the UCPRC. In both cases, the range in variation in air-void content was considered to be relatively low. A correlation study was conducted to determine if this variation had an effect on the variability of the test results. Different test results were plotted against the mean air-void content (mean of the two specimens tested with one wheel), and the coefficient of determination (R-squared) was calculated. An example of these plots is shown in Figure 3.3, which indicates that there is no correlation between the rut depth after 20,000 passes and the air-void content of the specimens tested. The R-squared value was and for the tests conducted on the specimens compacted by the UCPRC and the participating laboratories, respectively, which implies that only about three percent of the variance of the rut depth after 20,000 passes is explained by the variability of the airvoid content. Similar correlation values were obtained for the different test result combinations evaluated, including the minimum and maximum air-void contents of the two specimens tested with one wheel, and the air-void content range (maximum minus minimum). Figure 3.3 shows the R-squared values calculated for each combination of test result and air-void contentrelated variable. Since the correlation was very poor in all cases, it was concluded that the air-void content was not a source of test variability for this round robin study. 10 UCPRC-RR
25 12 Specified Range: 7.0 ± 1% Rut Depth at 20,000 Passes (mm) R² = R² = Air-Void Content (mean of two specimens [%]) Compacted by UCPRC Compacted by Laboratories Figure 3.3: Air-void content effect on rut depth. Laboratory Specimens Compacted by UCPRC Specimens Compacted by Participating Laboratories Table 3.1: Summary of Coefficients of Determination (R 2 ) Test Result Air-Void Content Mean Minimum Maximum Range Rut Depth at 5,000 passes Rut Depth at 10,000 passes Rut Depth at 15,000 passes Rut Depth at 20,000 passes Passes at 12.5 mm rut depth Creep Slope Strip Slope Passes to Stripping Inflection Point Rut Depth at 5,000 passes Rut Depth at 10,000 passes Rut Depth at 15,000 passes Rut Depth at 20,000 passes Passes at 12.5 mm rut depth Creep Slope Strip Slope Passes to Stripping Inflection Point No data No data No data No data Rut Depth Measurements Comparative plots of the rut depth measurements submitted by the 14 laboratories that sent raw data files for the UCPRC-compacted specimens and those they compacted are shown in Figure 3.4 and Figure 3.5, respectively. Each line in the figures represents the result of one test wheel as an average for all the measuring locations along the wheelpath. A smoothing technique (moving weighted average) was applied after averaging all locations. UCPRC-RR
26 0-2 Rut Depth (mm) ,000 10,000 15,000 Number of Passes 20,000 25,000 Figure 3.4: Rut depths on specimens compacted by the UCPRC. 0-2 Rut Depth (mm) ,000 10,000 15,000 Number of Passes 20,000 25,000 Figure 3.5: Rut depths on specimens compacted by participating laboratories. The results indicate that overall performance on the specimens compacted by the UCPRC was considerably worse than that on the specimens compacted by the laboratories. Deformation after 25,000 passes on the specimens prepared by the UCPRC was between 2.5 mm and 7.5 mm in most tests, with some test results higher than 8.0 mm. Clear stripping inflection points were observed in more than 10 instances. For the specimens prepared by the participating laboratories, deformation after 25,000 passes was between 2.0 mm and 4.0 mm in most tests, and a clear stripping inflection point was only recorded in one instance. 12 UCPRC-RR
27 The differences in performance between the specimens compacted by the UCPRC and the specimens compacted by the participating laboratories were not related to compaction/air-void content, given that specimen air-void contents were lower on the UCPRC-compacted specimens, as discussed in Section 3.2. One possible explanation for the difference in performance between the two sets of specimens is differences in the degree of asphalt binder aging related to oven temperature settings and time spent in the oven during heating of the loose mix prior to specimen fabrication by the participating laboratories. It is also possible that laboratories repeated tests if unsatisfactory results were initially obtained. Each participating laboratory was provided with two five-gallon buckets of loose mix, which is sufficient material to compact multiple specimens and run multiple tests. This approach could have eliminated outliers in the tests on specimens prepared by the participating laboratories, resulting in generally lower standard deviations. Each participating laboratory received only four UCPRC-compacted samples, the exact number required to do the requested testing. Although a marginal mix with no anti-stripping agent was sought for the study, test results on both sets of compacted specimens indicate that rutting/stripping performance of the mix was relatively good. The 12.5 mm (0.5 in.) threshold value was exceeded in only one case, and the stripping phase did not initiate in most tests. No explanation for the limited number of tests that stripped was identified from the test data submitted. Summary plots of the tabulated results provided in Appendix D are shown in Figure 3.6 through Figure All the laboratories provided data for rut depth after 5,000, 10,000, 15,000, and 20,000 wheel passes, as requested. In some instances the tests appear to have been stopped before the predefined number of passes was reached. Creep slope was not reported in approximately 50 percent of the tests. Some laboratories did not report the creep and stripping slope if a stripping inflection point was not observed. There was limited variability in the rut depth measurements for both sets of compacted specimens at the defined number of wheel passes (Figure 3.6 through Figure 3.9). Larger variability was evident in the reporting of the creep and stripping slopes and the stripping inflection point (Figure 3.11 through Figure 3.13). These issues are discussed in more detail in Chapter 4. UCPRC-RR
28 Rep. 1 Rep. 2 Rep. 3 Rep Rep. 1 Rep. 2 Rep. 3 Rep Lab 1 Lab 2 Lab 3 Lab 4 Lab 5 Lab 6 Lab 7 Lab 8 Lab 9 Lab 10 Lab 11 Lab 12 Lab 13 Lab 14 Lab 15 Lab 16 Lab 17 Lab 18 Lab 19 Lab 20 Lab 1 Lab 2 Lab 3 Lab 4 Lab 5 Lab 6 Lab 7 Lab 8 Lab 9 Lab 10 Lab 11 Lab 12 Lab 13 Lab 14 Lab 15 Lab 16 Lab 17 Lab 18 Lab 19 Lab 20 Rut Depth after 5,000 Passes (mm) Rut Depth after 5,000 Passes (mm) Specimens compacted by the UCPRC Specimens compacted by participating laboratories Figure 3.6: Rut depth after 5,000 wheel passes Rep. 1 Rep. 2 Rep. 3 Rep Rep. 1 Rep. 2 Rep. 3 Rep Lab 1 Lab 2 Lab 3 Lab 4 Lab 5 Lab 6 Lab 7 Lab 8 Lab 9 Lab 10 Lab 11 Lab 12 Lab 13 Lab 14 Lab 15 Lab 16 Lab 17 Lab 18 Lab 19 Lab 20 Lab 1 Lab 2 Lab 3 Lab 4 Lab 5 Lab 6 Lab 7 Lab 8 Lab 9 Lab 10 Lab 11 Lab 12 Lab 13 Lab 14 Lab 15 Lab 16 Lab 17 Lab 18 Lab 19 Lab 20 Rut Depth after 10,000 Passes (mm) Rut Depth after 10,000 Passes (mm) 0.0 Specimens compacted by the UCPRC Specimens compacted by participating laboratories Figure 3.7: Rut depth after 10,000 wheel passes. 14 UCPRC-RR
29 Rep. 1 Rep. 2 Rep. 3 Rep Rep. 1 Rep. 2 Rep. 3 Rep Lab 1 Lab 2 Lab 3 Lab 4 Lab 5 Lab 6 Lab 7 Lab 8 Lab 9 Lab 10 Lab 11 Lab 12 Lab 13 Lab 14 Lab 15 Lab 16 Lab 17 Lab 18 Lab 19 Lab 20 Lab 1 Lab 2 Lab 3 Lab 4 Lab 5 Lab 6 Lab 7 Lab 8 Lab 9 Lab 10 Lab 11 Lab 12 Lab 13 Lab 14 Lab 15 Lab 16 Lab 17 Lab 18 Lab 19 Lab 20 Rut Depth after 15,000 Passes (mm) Rut Depth after 15,000 Passes (mm) Specimens compacted by the UCPRC Specimens compacted by participating laboratories Figure 3.8: Rut depth after 15,000 wheel passes Rep. 1 Rep. 2 Rep. 3 Rep Rep. 1 Rep. 2 Rep. 3 Rep. 4 0 Lab 1 Lab 2 Lab 3 Lab 4 Lab 5 Lab 6 Lab 7 Lab 8 Lab 9 Lab 10 Lab 11 Lab 12 Lab 13 Lab 14 Lab 15 Lab 16 Lab 17 Lab 18 Lab 19 Lab 20 Lab 1 Lab 2 Lab 3 Lab 4 Lab 5 Lab 6 Lab 7 Lab 8 Lab 9 Lab 10 Lab 11 Lab 12 Lab 13 Lab 14 Lab 15 Lab 16 Lab 17 Lab 18 Lab 19 Lab 20 Rut depth after 20,000 Passes (mm) Rut Depth after 20,000 Passes (mm) Specimens compacted by the UCPRC Specimens compacted by participating laboratories Figure 3.9: Rut depth after 20,000 wheel passes. UCPRC-RR
30 30,000 25,000 20,000 15,000 10,000 5,000 Rep. 1 Rep. 2 Rep. 3 Rep. 4 30, mm ruth depth was not reached in any test 25,000 20,000 15,000 10,000 5,000 Rep. 1 Rep. 2 Rep. 3 Rep. 4 0 Lab 1 Lab 2 Lab 3 Lab 4 Lab 5 Lab 6 Lab 7 Lab 8 Lab 9 Lab 10 Lab 11 Lab 12 Lab 13 Lab 14 Lab 15 Lab 16 Lab 17 Lab 18 Lab 19 Lab 20 Lab 1 Lab 2 Lab 3 Lab 4 Lab 5 Lab 6 Lab 7 Lab 8 Lab 9 Lab 10 Lab 11 Lab 12 Lab 13 Lab 14 Lab 15 Lab 16 Lab 17 Lab 18 Lab 19 Lab 20 Passes to 12.5 mm Rut Depth Passes to 12.5 mm Rut Depth 0 Specimens compacted by the UCPRC Specimens compacted by participating laboratories Figure 3.10: Number of wheel passes to 12.5 mm rut depth. 3.5E-04 Rep. 1 Rep. 2 Rep. 3 Rep E E-04 Rep. 1 Rep. 2 Rep. 3 Rep E E E E E E E E E E E+00 Lab 1 Lab 2 Lab 3 Lab 4 Lab 5 Lab 6 Lab 7 Lab 8 Lab 9 Lab 10 Lab 11 Lab 12 Lab 13 Lab 14 Lab 15 Lab 16 Lab 17 Lab 18 Lab 19 Lab 20 Lab 1 Lab 2 Lab 3 Lab 4 Lab 5 Lab 6 Lab 7 Lab 8 Lab 9 Lab 10 Lab 11 Lab 12 Lab 13 Lab 14 Lab 15 Lab 16 Lab 17 Lab 18 Lab 19 Lab 20 Creep Slope (mm/pass) Creep Slope (mm/pass) 5.0E E+00 Specimens compacted by the UCPRC Specimens compacted by participating laboratories Figure 3.11: Creep slope. 16 UCPRC-RR
31 1.4E-03 Rep. 1 Rep. 2 Rep. 3 Rep E E-03 Rep. 1 Rep. 2 Rep. 3 Rep E E E E E E E E E E E+00 Lab 1 Lab 2 Lab 3 Lab 4 Lab 5 Lab 6 Lab 7 Lab 8 Lab 9 Lab 10 Lab 11 Lab 12 Lab 13 Lab 14 Lab 15 Lab 16 Lab 17 Lab 18 Lab 19 Lab 20 Lab 1 Lab 2 Lab 3 Lab 4 Lab 5 Lab 6 Lab 7 Lab 8 Lab 9 Lab 10 Lab 11 Lab 12 Lab 13 Lab 14 Lab 15 Lab 16 Lab 17 Lab 18 Lab 19 Lab 20 Stripping Slope (mm/pass) Stripping Slope (mm/pass) 2.0E E+00 Specimens compacted by the UCPRC Specimens compacted by participating laboratories Figure 3.12: Stripping slope. 25,000 25,000 20,000 15,000 10,000 5,000 20,000 15,000 10,000 5,000 0 Lab 1 Lab 2 Lab 3 Lab 4 Lab 5 Lab 6 Lab 7 Lab 8 Lab 9 Lab 10 Lab 11 Lab 12 Lab 13 Lab 14 Lab 15 Lab 16 Lab 17 Lab 18 Lab 19 Lab 20 Lab 1 Lab 2 Lab 3 Lab 4 Lab 5 Lab 6 Lab 7 Lab 8 Lab 9 Lab 10 Lab 11 Lab 12 Lab 13 Lab 14 Lab 15 Lab 16 Lab 17 Lab 18 Lab 19 Lab 20 Passes to Inflection Point Passes to Inflection Point Rep. 1 Rep. 2 Rep. 3 Rep. 4 Rep. 1 Rep. 2 Rep. 3 Rep. 4 0 Specimens compacted by the UCPRC Specimens compacted by participating laboratories Figure 3.13: Number of passes to stripping inflection point. UCPRC-RR
32 Blank page 18 UCPRC-RR
33 4. DATA ANALYSIS 4.1 Analysis of Data Consistency Data consistency was evaluated following the approach described in ASTM C802 (Section 10.5). Test results from the specimens compacted by the UCPRC and specimens compacted by each participating laboratory were analyzed independently. Analysis was also conducted independently for each test result variable. Mean and standard deviation were first calculated for each laboratory using the four replicates (two HWT tests, two wheels per test). These statistics were then compared to the average from all of the laboratories. Individual results were considered as potential outliers when their mean or standard deviation differed considerably from the average of all the results from the other laboratories. This comparison was conducted using the h and k values, as defined in ASTM C802 (Equations 4.1 and 4.2). Where: h i is the h-value of the laboratory i x i is the laboratory i average (mean of four replicates) x mean is the average of all laboratories S xm is the standard deviation of laboratory averages (4.1) Where: k i is the k-value of the laboratory i Sr i is the standard deviation of laboratory i (standard deviation of four replicates) Sr pool is the pooled standard deviation (square root of the mean of the variance of all laboratories) (4.2) The h-value provides an index of how much the laboratory mean result deviates from the mean of other laboratories. Laboratories with an h-value greater than a critical value (in absolute terms) are considered as potential outliers. The critical h-value for 20 laboratories is ± 2.56 (ASTM C802, Table 4). The k-value provides an index of the single-operator variability of each laboratory compared to the other laboratories. Laboratories with a k-value greater than a critical value should be considered as potential outliers. The critical k-value for 20 laboratories and four replicates is 2.00 (ASTM C802, Table 4). Appendix D contains the HWT test results submitted by the laboratories. Two tables are included in this appendix for each set of test results (one for the specimens compacted by the UCPRC and one for the specimens compacted by each participating laboratory). Potential outliers, which are highlighted in these tables, were discarded in the analyses. The means and standard deviations for the 20 laboratories, with the outliers removed, are presented for the different sets of test results in Figure 4.1 through Figure 4.8. UCPRC-RR
34 8.0 UCPRC-Compacted Specimens Lab-Compacted Specimens UCPRC-Compacted Specimens Lab-Compacted Specimens Lab 1 Lab 2 Lab 3 Lab 4 Lab 5 Lab 6 Lab 7 Lab 8 Lab 9 Lab 10 Lab 11 Lab 12 Lab 13 Lab 14 Lab 15 Lab 16 Lab 17 Lab 18 Lab 19 Lab 20 Lab 1 Lab 2 Lab 3 Lab 4 Lab 5 Lab 6 Lab 7 Lab 8 Lab 9 Lab 10 Lab 11 Lab 12 Lab 13 Lab 14 Lab 15 Lab 16 Lab 17 Lab 18 Lab 19 Lab 20 Mean Rut Depth after 5,000 Passes (mm) Standard Deviation Laboratory mean Laboratory standard deviation Figure 4.1: Rut depth after 5,000 wheel passes. 8.0 UCPRC-Compacted Specimens Lab-Compacted Specimens UCPRC-Compacted Specimens Lab-Compacted Specimens Lab 1 Lab 2 Lab 3 Lab 4 Lab 5 Lab 6 Lab 7 Lab 8 Lab 9 Lab 10 Lab 11 Lab 12 Lab 13 Lab 14 Lab 15 Lab 16 Lab 17 Lab 18 Lab 19 Lab 20 Lab 1 Lab 2 Lab 3 Lab 4 Lab 5 Lab 6 Lab 7 Lab 8 Lab 9 Lab 10 Lab 11 Lab 12 Lab 13 Lab 14 Lab 15 Lab 16 Lab 17 Lab 18 Lab 19 Lab 20 Mean Rut Depth after 10,000 Passes (mm) Standard Deviation Laboratory mean Laboratory standard deviation Figure 4.2: Rut depth after 10,000 wheel passes. 20 UCPRC-RR
35 8.0 UCPRC-Compacted Specimens Lab-Compacted Specimens UCPRC-Compacted Specimens Lab-Compacted Specimens Lab 1 Lab 2 Lab 3 Lab 4 Lab 5 Lab 6 Lab 7 Lab 8 Lab 9 Lab 10 Lab 11 Lab 12 Lab 13 Lab 14 Lab 15 Lab 16 Lab 17 Lab 18 Lab 19 Lab 20 Lab 1 Lab 2 Lab 3 Lab 4 Lab 5 Lab 6 Lab 7 Lab 8 Lab 9 Lab 10 Lab 11 Lab 12 Lab 13 Lab 14 Lab 15 Lab 16 Lab 17 Lab 18 Lab 19 Lab 20 Mean Rut Depth after 15,000 Passes (mm) Standard Deviation Laboratory mean Laboratory standard deviation Figure 4.3: Rut depth after 15,000 wheel passes UCPRC-Compacted Specimens Lab-Compacted Specimens Lab 1 Lab 2 Lab 3 Lab 4 Lab 5 Lab 6 Lab 7 Lab 8 Lab 9 Lab 10 Lab 11 Lab 12 Lab 13 Lab 14 Lab 15 Lab 16 Lab 17 Lab 18 Lab 19 Lab 20 Lab 1 Lab 2 Lab 3 Lab 4 Lab 5 Lab 6 Lab 7 Lab 8 Lab 9 Lab 10 Lab 11 Lab 12 Lab 13 Lab 14 Lab 15 Lab 16 Lab 17 Lab 18 Lab 19 Lab 20 Mean Rut Depth after 20,000 Passes (mm) 0.0 UCPRC-Compacted Specimens Lab-Compacted Specimens Standard Deviation Laboratory mean Laboratory standard deviation Figure 4.4: Rut depth after 20,000 wheel passes. UCPRC-RR
36 30,000 UCPRC-Compacted Specimens Lab-Compacted Specimens 25,000 20,000 15,000 10,000 5, ,000 UCPRC-Compacted Specimens Lab-Compacted Specimens 4,500 4,000 3,500 3,000 2,500 2,000 1,500 1, Lab 1 Lab 2 Lab 3 Lab 4 Lab 5 Lab 6 Lab 7 Lab 8 Lab 9 Lab 10 Lab 11 Lab 12 Lab 13 Lab 14 Lab 15 Lab 16 Lab 17 Lab 18 Lab 19 Lab 20 Lab 1 Lab 2 Lab 3 Lab 4 Lab 5 Lab 6 Lab 7 Lab 8 Lab 9 Lab 10 Lab 11 Lab 12 Lab 13 Lab 14 Lab 15 Lab 16 Lab 17 Lab 18 Lab 19 Lab 20 Mean Passes to Rut Depth of 12.5 mm Standard Deviation Laboratory mean Laboratory standard deviation Figure 4.5: Number of passes to 12.5 mm rut depth. 2.5E E E E E-05 UCPRC-Compacted Specimens Lab-Compacted Specimens 1.2E E E E E E-05 UCPRC-Compacted Specimens Lab-Compacted Specimens 0.0E+00 Lab 1 Lab 2 Lab 3 Lab 4 Lab 5 Lab 6 Lab 7 Lab 8 Lab 9 Lab 10 Lab 11 Lab 12 Lab 13 Lab 14 Lab 15 Lab 16 Lab 17 Lab 18 Lab 19 Lab 20 Lab 1 Lab 2 Lab 3 Lab 4 Lab 5 Lab 6 Lab 7 Lab 8 Lab 9 Lab 10 Lab 11 Lab 12 Lab 13 Lab 14 Lab 15 Lab 16 Lab 17 Lab 18 Lab 19 Lab 20 Mean Creep Slope (mm/pass) Standard Deviation 0.0E+00 Laboratory mean Laboratory standard deviation Figure 4.6: Creep slope. 22 UCPRC-RR
37 1.2E E E E E E-04 UCPRC-Compacted Specimens Lab-Compacted Specimens 3.5E E E E E E E-05 UCPRC-Compacted Specimens Lab-Compacted Specimens 0.0E+00 Lab 1 Lab 2 Lab 3 Lab 4 Lab 5 Lab 6 Lab 7 Lab 8 Lab 9 Lab 10 Lab 11 Lab 12 Lab 13 Lab 14 Lab 15 Lab 16 Lab 17 Lab 18 Lab 19 Lab 20 Lab 1 Lab 2 Lab 3 Lab 4 Lab 5 Lab 6 Lab 7 Lab 8 Lab 9 Lab 10 Lab 11 Lab 12 Lab 13 Lab 14 Lab 15 Lab 16 Lab 17 Lab 18 Lab 19 Lab 20 Mean Stripping Slope (mm/pass) Standard Deviation 0.0E+00 Laboratory mean Laboratory standard deviation Figure 4.7: Stripping slope. 25,000 UCPRC-Compacted Specimens Lab-Compacted Specimens 20,000 15,000 10,000 5, ,000 UCPRC-Compacted Specimens Lab-Compacted Specimens 5,000 4,000 3,000 2,000 1,000 0 Lab 1 Lab 2 Lab 3 Lab 4 Lab 5 Lab 6 Lab 7 Lab 8 Lab 9 Lab 10 Lab 11 Lab 12 Lab 13 Lab 14 Lab 15 Lab 16 Lab 17 Lab 18 Lab 19 Lab 20 Lab 1 Lab 2 Lab 3 Lab 4 Lab 5 Lab 6 Lab 7 Lab 8 Lab 9 Lab 10 Lab 11 Lab 12 Lab 13 Lab 14 Lab 15 Lab 16 Lab 17 Lab 18 Lab 19 Lab 20 Mean Stripping Inflection Point (Passes) Standard Deviation Laboratory mean Laboratory standard deviation Figure 4.8: Stripping inflection point. UCPRC-RR
38 4.2 Statistical Model Definition An analysis of variance (ANOVA) was conducted to determine which factors had the greatest influence on each one of the test results. Tests conducted on specimens compacted by the UCPRC and by the individual labs were analyzed independently. The following factors were considered in the analysis, as reflected in Figure 4.9: LW RW LW RW LW RW LW RW LW RW LW RW LW RW LW RW 2 Rep. Set 1 Set 2 Set 1 Set 2 Set 3 Set 4 Set 3 Set 4 Nested Random Factor Lab 1 Comp. Lab 20 Comp. Random Factor Lab 1 Lab 20 Lab 1 Lab 20 Random Factor UCPRC Comp. 1 Mix Figure 4.9: Factors in the ANOVA analysis. Laboratory. Laboratory was regarded as a random factor. The 20 laboratories included in the analysis were each regarded as a representative sample of the population of laboratories that may conduct the modified AASHTO T 324 test for Caltrans. Compaction. Variability introduced in the compaction process influences both single-operator variability and between-laboratory variability. Between-laboratory variability specifically related to compaction could not be determined in this ANOVA since its effects were confounded by the between-laboratory variability introduced by the testing itself. Single-operator variability related to compaction had similar limitations. Although compaction was regarded as an important factor, its effects could therefore not be specifically determined in this analysis. Set (test). Each laboratory conducted two tests on the specimens compacted by the UCPRC and two tests on the specimens compacted by that laboratory. The results from each of the two wheels were regarded as two replicates within each HWT test. The Set factor was introduced to determine if there was a correlation between the results of the two wheels or, on the contrary, if the results from the two wheels were independent of each other. Set was a random factor nested in each laboratory level. The results from this ANOVA analysis in the form of the output from the SPSS statistical software package are included in Appendix E. A summary of the significance level of Lab and Set(Lab) (i.e., Set 24 UCPRC-RR
39 nested in Lab), is shown in Figure Only one case in the Set(Lab) was significant (p-value below 0.05). This case was the creep slope on the specimens prepared by the UCPRC. This outcome was related to two particular HWT tests, conducted by Laboratory #7 and Laboratory #8, where the results from both wheels on the equipment indicated poor performance. Since only one case was identified, Set was not considered to have a significant influence on HWT test results, and it was not included in subsequent ANOVAs. A similar round robin study conducted by AMRL found that single-wheel HWT test machines presented lower variability for a poor-performing mix than two-wheel machines (all machines used in the study were manufactured by Precision Machine and Welding) (3). It was hypothesized in that study that the dynamic effects of one wheel might influence the performance of the other wheel Lab for UCPRC-Comp. Lab for Lab-Comp. Set(Lab) for UCPRC-Comp. Set(Lab) for Lab-Comp. p-value Creep Strip SIP 5k Pass. 10k Pass. 15k Pass. 20k Pass. Slope Slope Figure 4.10: Factor significance level for HWT test results (SIP = stripping inflection point). The participating laboratories in this UCPRC study used HWT machines from four different manufacturers, namely: Pavement Technology Inc., Precision Machine and Welding (PMW), Pine Test Equipment LLC, and Cox and Sons Inc. (Appendix C). During the analysis it was accepted that differences between the machines could potentially influence the test results, as noted by a recent study at Louisiana State University (3) that compared different HWT machines. In that study, differences were also found in terms of how the AASHTO T 324 test method was interpreted and in the test results from the different machines. The most important parameters identified as not being specified in the test method include the following: Length of the wheelpath Spacing between the rut depth measuring points along the wheelpath + PMW machines report the rut depth at 11 locations along the wheelpath from -114 mm to +114 mm in 23 mm increments. UCPRC-RR
40 + Pavement Technology Inc. machines report the rut depth at five locations: -97 mm, 32 mm, 0, +32 mm and +99 mm. + Cox and Sons machines report rut depths at 227 locations from -113 mm to +113 mm in 1.0 mm increments. + Pine Test Equipment HWT devices report rut depth at a unique location. Locations along the wheelpath used to calculate test results. The four HWT devices used in this study therefore measure rut depths at slightly different locations along the 6 in. (150 mm) wheelpath and during test set up may require users to enter the location or locations on which to base calculations. Other software options available in individual machines include using the maximum rut, the three central locations, or the three locations around the maximum rut. Consequently, the exact same rut depth profile may be interpreted differently by the different device software programs, with some of the influence dependent on the operator s input instructions. A recent HWT round robin study conducted by AMRL (2) recommended using the average rut depth measured in all 11 locations (only PMW devices were used in that AMRL study). Another study (3), which focused on the test characteristics of the same four HWT devices used in the UCPRC study, recommended using the average of five deformation sensors located at -46 mm, -23 mm, 0, + 23 mm, and +46 mm. A second ANOVA was undertaken to evaluate any potential differences in the results from the four different HWT machines used by the participating laboratories. In this ANOVA, Machine Type was included as a fixed factor and Laboratory was included as a random factor nested in Machine Type. Machine Type had four levels, each corresponding to one of the four manufacturers of the equipment used. Results from the specimens compacted by the UCPRC and those compacted by each participating laboratory were analyzed separately. The results of this ANOVA are summarized in Figure 4.11, which clearly indicates the potentially significant influence (p-value below 0.05) that machine type can have on the early test results (rut depth at 5,000 and 10,000 passes), which can be influenced by factors such as different temperature conditioning or wheel resting locations. Pine testing machines appeared to report deeper ruts than the other three machine types, as shown in Figure Since Machine Type was found to only be important for the early test results, this factor was not included in subsequent ANOVAs. Based on these considerations, the round robin study analysis approach shown in Figure 4.13 was adopted (i.e., the Set and Machine Type factors were not included). 26 UCPRC-RR
41 UCPRC-Compacted Lab-Compacted p-value Passes to Creep Strip SIP 5k Pass. 10k Pass. 15k Pass. 20k Pass. 12.5mm Slope Slope Figure 4.11: Machine-type significance level in the ANOVA. Estimated Marginal Mean Rut Depth (mm) UCPRC Compacted Lab Compacted APA PMV Cox&Sons Pine Machine Figure 4.12: Machine effect on rut depth after 10,000 passes. Excluding specimen preparation Including specimen preparation R r 1L 1R 2L 2R 1L 1R 2L 2R UCPRC Comp. UCPRC Comp. 1L 1R 2L 2R Lab 1 Comp. 1L 1R 2L 2R Lab 20 Comp. r R Lab 1 Lab 20 Lab 1 Lab 20 1 Mix Figure 4.13: Statistical design for the round robin study analysis. UCPRC-RR
42 Variability related to specimen compaction influenced results of the tests conducted on the UCPRCcompacted specimens and the specimens compacted by the participating laboratories in different ways. In both cases, the compaction-related single-operator variability influenced the repeatability (r) of the test results. However, the compaction-related between-laboratory variability influenced the results of the tests conducted on specimens compacted by each participating laboratory, but not on those conducted on UCPRC-compacted specimens. For these reasons, similar single-operator variability (repeatability) was expected for the two sources of compacted specimens, while the multilaboratory variability (reproducibility) was expected to be better for UCPRC-compacted specimens. In both cases, the same statistical model was used, as shown in Equation 4.3. Y ij = µ + µ i + ε ij (4.3) Where: Y ij = replicate j of laboratory i (i=1, 2, 20 and j = 1, 2, 3, 4) μ = true mean of all laboratories μ i = laboratory effect, where μ i ~ N(0,σ L ) ε ij = error, where ε ij ~ N(0,σ) σ = model error σ L = between-laboratory standard deviation The following indices of precision were determined for this statistical model: Single-operator standard deviation (repeatability): σ r ² = σ² Multilaboratory standard deviation (reproducibility): σ R ² = σ L ² + σ²/m (m = 1 in this case, since Section 39 of the Caltrans Standard Specifications states that the results of the two wheels must not be averaged.) 4.3 Determination of Variance Components A third ANOVA was conducted to determine variance components. The statistical model reflected in Equation 4.3 includes a single random factor. The two sources of compacted specimens (UCPRC and participating laboratory) were analyzed independently. Machine Type and Set were discarded for the analysis, as explained above. An ANOVA table was produced for each variable, after which the mean square error (MSE) and the mean square of the random factor (MST) were used to estimate the model parameters (Equation 4.4 and Equation 4.5). σ² = MSE (4.4) σ L ² = (MST-MSE)/NR (4.5) Where: σ = model error σ L = between-laboratory standard deviation NR = number of replicates. NR is 4 when the 4 results supplied by all laboratories are used in the analysis. When there are missing data, NR is estimated following the approach detailed in ASTM C802, Appendix X3. 28 UCPRC-RR
43 Results from the ANOVA are included in Appendix F (output from the SPSS statistical software analyses). Statistics for rut depth at 5,000, 10,000, 15,000, and 20,000 wheel passes are shown in Figure 4.14 through Figure Standard deviations for single-operator and between-laboratory rut depth results increased approximately linearly, versus rut depth. As a consequence, multilaboratory standard deviation also increased with rut depth. As expected, the single-operator standard deviation followed the same pattern for specimens from both sources. Between-laboratory variability was slightly higher for the specimens compacted by the participating laboratories, also as expected, and consequently, the multilaboratory standard deviation was higher for these test results. However, these differences were relatively small, indicating that the variability associated with specimen fabrication had less influence on multilaboratory standard deviation than the variability related to testing and data analysis. Statistics for creep and stripping slopes are summarized in Figure 4.17 through Figure Standard deviations for both single-operator and between-laboratory increased in proportion to slope values, with the proportionality of the rate appearing to be similar for both creep and strip slopes. Single-operator and between-laboratory standard deviations of the two sets of compacted specimens both appeared to follow the same pattern. Between-laboratory variability related to specimen fabrication was again much smaller than the between-laboratory variability related to testing and data analysis. No attempt was made to estimate the standard deviations associated with the number of passes to 12.5 mm (0.5 in.) rut depth since this result was reported in only eight cases (all for tests on specimens compacted by the UCPRC). The same applies to the stripping inflection point of the tests conducted on specimens compacted by the laboratories, where only 11 results were reported. The single-operator standard deviation of the stripping inflection point for specimens compacted by the UCPRC was 3,212 wheel passes, and the between-laboratory standard deviation was 3,456. The mean number of wheel passes to the stripping inflection point for all tests was 14, Analysis of Raw Data by the UCPRC The AASHTO T 324 method requires reporting of several test results that can be determined on the basis of the rut depth curve versus number of passes. However, the method does not specify the length of the wheelpath, which locations or combinations of locations along the wheelpath should be used to determine the rut depth, nor whether the average or the peak value is used. A comparative analysis of the raw data submitted by the laboratories was therefore conducted to determine to what extent test results could UCPRC-RR
44 change depending on the analysis software and user interpretation. Two different approaches were used, namely: A conservative approach, were the maximum rut depth along the wheelpath was selected and no smoothing technique was used. This approach is currently used by Caltrans. A non-conservative approach, where deformation values at all measuring locations along the wheelpath were averaged, and the results smoothed using a weighted moving average. Test results calculated by the UCPRC were compared to the values submitted by the individual laboratories. These comparisons are presented in Figure 4.20 through Figure (Note that points along the abscissa axis in the plots represent cases were the UCPRC could not determine the result, while points along the ordinate axis represent cases where the participating laboratory could not determine or did not report the results. Points at the origin of the coordinates represent cases where neither the participating laboratory nor the UCPRC observed a result.) Observations from the analysis include the following: The different analysis software and how users interpreted the results from that software had a notable impact on the results even when all the requirements in the AASHTO T 324 test method were met. As expected, correlations between the results of the different approaches appeared to decrease with increased complexity of the variable being determined. For example, the correlation between results from the participating laboratories and the UCPRC s results was higher for rut depth at 20,000 passes (a relatively simple measurement to determine and report) than for the other variables analyzed. Correlation was especially poor for the stripping inflection point (Figure 4.24), which is one of the two test results that must be reported as specified in the Caltrans Standard Specifications. In this case, data points along the x-axis represent cases where the laboratory submitting the results observed a stripping inflection point, but the UCPRC analysis did not. Points along the y-axis represent cases where the opposite occurred. The high number of points along the axes and large dispersion of the data indicate a high degree of subjectivity in the calculation of this parameter. Similar results were obtained for the number of passes to 12.5 mm (0.5 in.) rut depth (Figure 4.21), which is the second parameter required by the Caltrans specifications to be reported. In some cases, different interpretations by the user made a difference in terms of whether 12.5 mm rut depth was reached or whether a stripping inflection point was observed (Figure 4.21 and Figure 4.24). For this particular mix, the Caltrans specifications require a minimum of 15,000 passes before 12.5 mm rut depth is reached, and 10,000 passes before the stripping inflection point is reached. Different user interpretations would have resulted in the mix not passing the specifications in only a few cases, which could be cause for concern if the results of a mix are close to these limits. 30 UCPRC-RR
45 Single-Operator Std.Dev (mm) UCPRC-Compacted Lab-Compacted Between-laboratory Std.Dev (mm) UCPRC-Compacted Lab-Compacted Rut Depth (mm) Rut Depth (mm) Figure 4.14: Single-operator standard deviation after predefined number of passes. Multilaboratory Std.Dev (mm) UCPRC-Compacted Lab-Compacted Rut Depth (mm) Figure 4.16: Multilaboratory standard deviation after predefined number of passes. Single-Operator Std.Dev (mm/pass) Figure 4.15: Between-laboratory standard deviation after predefined number of passes. 3.5E E E E E E E-05 UCPRC-Compacted Creep Slope Lab-Compacted Stripping Slope 0.0E E E E E E E-04 Slope (mm/pass) Figure 4.17: Single-operator standard deviation for creep and stripping slopes. UCPRC-RR
46 Between-laboratory Std.Dev (mm/pass) 3.5E-04 UCPRC-Compacted Lab-Compacted 3.0E-04 Stripping Slope 2.5E E E E-04 Creep Slope 5.0E E E E E E E E-04 Slope (mm/pass) Multilaboratory Std.Dev (mm/pass) 3.5E-04 UCPRC-Compacted Lab-Compacted 3.0E-04 Stripping Slope 2.5E E E E-04 Creep Slope 5.0E E E E E E E E-04 Slope (mm/pass) Figure 4.18: Between-laboratory standard deviation for creep and stripping slopes. Figure 4.19: Multilaboratory standard deviation for creep and stripping slopes. UCPRC Conservative Analysis (mm) UC-1 UC-2 UC-3 UC-4 Lab-1 Lab-2 Lab-3 Lab Laboratory Submitted Value (mm) UCPRC Non-Conservative Analysis (mm) UC-1 UC-2 UC-3 UC-4 Lab-1 Lab-2 Lab-3 Lab Laboratory Submitted Value (mm) Figure 4.20: UCPRC analysis of rut depth after 20,000 passes. 32 UCPRC-RR
47 UC-1 UC-2 UC-3 UC-4 Lab-1 Lab-2 Lab-3 UCPRC Non-Conservative Analysis (Passes) UCPRC Conservative Analysis (Passes) 30,000 Lab-4 25,000 20,000 15,000 10,000 5, ,000 10,000 15,000 20,000 25,000 30,000 30,000 UC-1 UC-2 UC-3 UC-4 Lab-1 Lab-2 Lab-3 Lab-4 25,000 20,000 15,000 10,000 5, ,000 10,000 15,000 20,000 25,000 Laboratory Submitted Value (Passes) Laboratory Submitted Value (Passes) 30,000 Figure 4.21: UCPRC analysis of number of passes to 12.5 mm rut depth. 5.0E-04 UC-1 UC-2 UC-3 UC-4 Lab-1 Lab-2 Lab-3 Lab-4 UCPRC Non-Conservative Analysis UCPRC Conservative Analysis 5.0E E E E E E E E E E-04 Laboratory Submitted Value 4.0E E-04 UC-1 UC-2 UC-3 UC-4 Lab-1 Lab-2 Lab-3 Lab-4 4.0E E E E E E E E E-04 Laboratory Submitted Value 4.0E E-04 Figure 4.22: UCPRC analysis of creep slope. UCPRC-RR
48 UCPRC Conservative Analysis (mm/pass) 2.0E-03 UC-1 UC-2 UC-3 UC-4 Lab-1 Lab-2 Lab-3 Lab-4 1.5E E E E E E E E E-03 Laboratory Submitted Value (mm/pass) UCPRC Non-Conservative Analysis (mm/pass) 2.0E-03 UC-1 UC-2 UC-3 UC-4 Lab-1 Lab-2 Lab-3 Lab-4 1.5E E E E E E E E E-03 Laboratory Submitted Value (mm/pass) Figure 4.23: UCPRC analysis of stripping slope. UCPRC Conservative Analysis (Passes) 30,000 25,000 20,000 15,000 10,000 5,000 0 UC-1 UC-2 UC-3 UC-4 Lab-1 Lab-2 Lab-3 Lab-4 0 5,000 10,000 15,000 20,000 25,000 30,000 Laboratory Submitted Value (Passes) UCPRC Non-Conservative Analysis (Passes) 30,000 25,000 20,000 15,000 10,000 5,000 0 UC-1 UC-2 UC-3 UC-4 Lab-1 Lab-2 Lab-3 Lab-4 0 5,000 10,000 15,000 20,000 25,000 30,000 Laboratory Submitted Value (Passes) Figure 4.24: UCPRC analysis of number of passes to stripping inflection point. 34 UCPRC-RR
49 These observations support the need for clearly stating in the AASHTO T 324 test method and the Caltrans specifications which locations should be used for determining test results and how this determination should be done. However, it should be noted that even if rut depth locations are standardized across all HWT test devices, determination of the creep slope and stripping slope stationary phases and the striping inflection point is still essentially subjective. Test results can also differ depending on whether or not a smoothing technique is used to remove noise from the rut versus passes curve. 4.5 Determination of Variance Components for UCPRC Analysis Results An ANOVA to determine variance components was repeated using the test results determined using the conservative and non-conservative approaches. Single-operator and between-laboratory coefficients of variation of the different results are shown in Figure 4.25 and Figure These figures also include the coefficients of variation obtained for the results submitted by the laboratories. As expected, the singleoperator coefficient of variation was not significantly affected by using a specific calculation approach (Figure 4.25). However, a reduction in the coefficient of variation was noted when the data was analyzed using the non-conservative approach, probably due to the use of an average from 11 locations. The main conclusion from Figure 4.26 is that between-laboratory coefficients of variation of creep slope, stripping slope, and stripping inflection point clearly improved when either of the two UCPRC approaches was used (Figure 4.26). This indicates that a significant component of between-laboratory variability was not related to the testing itself, but rather to the approach used by the different laboratories to analyze the raw data. However, little or no improvement in between-laboratory variability was observed for the rut depth results, which was unexpected. It is believed that this lack of improvement was related to the uncertainty in estimating between-laboratory standard deviation, and that this standard deviation was already relatively low for the results submitted by the laboratories. This implies that improvement in the analysis would depend on the uncertainty in the estimation. It should be noted that single-operator and betweenlaboratory variability could not be determined for all the results related to the stripping phase, given that insufficient data points were available for the estimation. 4.6 Formulation of Precision Statements The analysis of variance presented in Section 4.3 shows that single-operator and multilaboratory standard deviations of rut depth after a predefined number of passes (Figure 4.14 and Figure 4.16) are not constant, but increase with the mean measured value. The same applies to creep and stripping slopes (Figure 4.17 and Figure 4.19). It was not possible to determine how the standard deviations of number of passes to the stripping inflection point changed with the mean measured value because a single asphalt concrete mix with relatively good moisture resistance properties was used for testing. However, these single-operator UCPRC-RR
50 and multilaboratory standard deviations were also expected to increase with the measured mean value. For these reasons, the coefficient of variation, instead of the standard deviation, was used for the formulation of precision statements. 75% 70% 65% Lab Submitted UCPRC Non-Conservative UCPRC Conservative UCPRC-Compact UCPRC-Compact UCPRC-Compact Lab-Compact Lab-Compact Lab-Compact 60% Single-Operator CoV 55% 50% 45% 40% 35% 30% 25% 20% 15% 10% 5% 0% 5k 10k 15k 20k Creep Slp. Strip Slp. P to 3mm P to 6mm P to SIP Figure 4.25: Single-operator coefficient of variation for test results. 75% 70% 65% Lab Submitted UCPRC Non-Conservative UCPRC Conservative UCPRC-Compact UCPRC-Compact UCPRC-Compact Lab-Compact Lab-Compact Lab-Compact 60% Between-laboratory CoV 55% 50% 45% 40% 35% 30% 25% 20% 15% 10% 5% 0% 5k 10k 15k 20k Creep Slp. Strip Slp. P to 3mm P to 6mm P to SIP Figure 4.26: Between-laboratory coefficient of variation for test results. No distinction was made between the specimens prepared by the UCPRC and those prepared by the participating laboratories given that the single-operator standard deviation was similar for both sets of 36 UCPRC-RR
51 specimens. Slightly higher between-laboratory variability was observed for results on specimens prepared by the participating laboratories than for results on specimens prepared by the UCPRC. This was attributed to minor variations in the preparation procedures and equipment at the different laboratories. These differences were shown to be much lower than the variability introduced by testing and data analysis. Coefficients of variation for rut depth are shown in Figure 4.27 and for creep and stripping slopes in Figure In both cases, coefficients of variation increased with the mean measured value and therefore unique precision indices could not be set for these variables. Consequently, two new levels were defined for each of these variables in order to better report the precision indices. These values were selected from within the range of results obtained and were set at 3 mm and 6 mm rut depth, and 0.2 mm and 0.6 mm/1,000 passes for the creep and stripping slopes. Precision indices derived from the coefficients of variation for the creep and stripping slopes submitted by the participating laboratories and after raw data analysis using the conservative approach are also summarized in Figure The figure shows the considerable reduction in multilaboratory variability of creep and stripping slopes after unique criteria were used for data analysis. Similar improvements in multilaboratory variability would be expected if more specific instructions were available for data analysis, either in the AASHTO T 324 test method or in Section 39 of the Caltrans Standard Specifications. A clear reduction in between-laboratory variability was also observed for the number of passes to the stripping inflection point when unique criteria were used for the data analysis (Figure 4.26). Precision estimates for this variable are based on results from specimens compacted by the UCPRC only, due to the lower number of reported stripping slope test results on specimens prepared by the participating laboratories (the mix had relatively good moisture resistance and stripping was not reported in most instances). UCPRC-RR
52 40% 40% Single-Operator CoV 35% 30% 25% 20% 15% 10% Linear fit (all data) y = x Multilaboratory CoV 35% 30% 25% 20% 15% 10% Linear fit (all data) y = x % UCPRC-Compact Lab-Compact 0% Rut Depth (mm) 5% UCPRC-Compact Lab-Compact 0% Rut Depth (mm) Figure 4.27: Indices of precision for rut depth at predetermined number of passes. Single-Operator CoV 80% 70% 60% 50% 40% 30% 20% Creep slope data Linear fit (all lab-submitted data) y = x Stripping slope data Lab Submitted UCPRC-Compact Lab-Compact 10% UCPRC Non-Conservative UCPRC-Compact Lab-Compact UCPRC Conservative UCPRC-Compact Lab-Compact 0% 0.0E E E E E E E E-04 Slope (mm/pass) Multilaboratory CoV 80% 70% 60% 50% 40% 30% 20% Creep slope data Stripping slope data y = x Linear fit (all lab-submitted data) y = x Linear fit (UCPRC Cons. approach, all data) Lab Submitted UCPRC-Compact Lab-Compact 10% UCPRC Non-Conservative UCPRC-Compact Lab-Compact UCPRC Conservative UCPRC-Compact Lab-Compact 0% 0.0E E E E E E E E-04 Slope (mm/pass) Figure 4.28: Indices of precision for creep and stripping slopes. 38 UCPRC-RR
53 A summary of the coefficients of variation for the different HWT test results are presented in Table 4.1 and Figure Difference limits (d2s%) as defined in ASTM C670, are also reported in the table. This limit is the maximum acceptable difference (less than 5 percent probability of being exceeded) between two test results, expressed as a percentage of their average. In this study, test result is defined as the result of a single wheel, as specified in Section 39 of the Caltrans Standard Specifications (note that AASHTO T 324 requires the average of the results of both wheels). Table 4.1: Summary Indices of Precision for HWT Test Results Coefficient of Variation (%) Test Parameter Lab Submitted Data UCPRC Cons. Analysis Single-Op. Multilab. Single-Op. Multilab. Up to 3 mm Rut depth d2s% limit Up to 6 mm d2s% limit Creep and stripping Up to 0.2 mm/1,000 passes d2s% limit Slope Up to 0.6 mm/1,000 passes d2s% limit Number of passes to 3 mm d2s% limit Number of passes to 6 mm d2s% limit Number of passes to stripping inflection point d2s% limit % 90% Lab Submitted UCPRC Conservative Single-Operator Single-Operator Multilaboratory Multilaboratory 80% Coefficient of Variation 70% 60% 50% 40% 30% 20% 10% 0% Rut Depth (< 3 mm) Rut Depth (< 6 mm) C&S Slope (< 0.2 mm/kp) C&S Slope (< 0.6 mm/kp) P to 3 mm Rut Depth P to 6 mm Rut Depth P to SIP Figure 4.29: Summary of indexes of precision for HWT test results. The results show that the single-operator coefficient of variation of the results is relatively high (i.e., low repeatability); this was attributed in part to the mix being essentially moisture-resistant, with most UCPRC-RR
54 laboratories reporting good results, but a limited number reporting some rutting and creep and stripping slopes. Multilaboratory variability was also relatively high due to the same repeatability issues and to the large inconsistencies introduced by the different rut depth measurement approaches and interpretations in the raw data analysis, which also explains why multilaboratory coefficients of variation of creep and stripping slope and stripping inflection point were considerably higher than the corresponding singleoperator coefficients of variation. However, multilaboratory coefficients of variation were not significantly higher than single-operator values when unique criteria were used for data analysis. A similar round robin study was recently conducted by the AASHTO Materials Reference Laboratory (AMRL) (2). The indices of precision reported by the AMRL study were generally lower than the values summarized in Table 4.1. The AMRL experiment used two asphalt mixes with well-defined rutting and moisture susceptibility performance. One of the mixes was known to be moisture resistant while the other one was known to be moisture sensitive. As explained above, the mix used for this Caltrans round robin study was essentially moisture resistant and most of the test results indicated limited rutting and no stripping. However, a small number of the results submitted by participating laboratories showed relatively deep ruts and/or a stripping phase, which increased the variability of the experiment results. The main differences in the precision indices between the studies conducted by AAHSTO and the UCPRC appear to relate to interpretation of the creep slope and stripping slope, as clarified below: In the first test specified in Section 39 of the 2015 Caltrans Standard Specifications, namely the number of cycles to reach the stripping inflection point, the AMRL study reported precision indices for single-operator and multilaboratory coefficients of variation of 23.9 percent and 32.1 percent, respectively. These two values are almost the same as those obtained in this UCPRC study when the test results as submitted by the individual laboratories were used in the analysis (Table 4.1). In the second test, namely the number of passes to 12.5 mm (0.5 in.) rut depth, precision statements could not be determined due to the limited number of tests where this threshold value was reached. The AASHTO study reported 16.6 percent and 26.2 percent, respectively for single-operator and multilaboratory coefficients of variation Precision Statements for Rut Depth after a Predetermined Number of Passes The following precision statements are made with respect to the rut depth after a predetermined number of passes, with rut depth defined as the maximum deformation along the total length of the tested sample: The single-operator coefficient of variation was found to increase with increasing rut depth. The variation can be expected to be 18 percent for ruts up to 3 mm and 35 percent for ruts up to 6 mm. The results of two correctly conducted tests by the same operator on the same material are not expected to differ from each other by more than 50 percent and 99 percent of their average, for ruts up to 3 mm and 6 mm respectively. 40 UCPRC-RR
55 The multilaboratory coefficient of variation was found to increase with increasing rut depth. The variation can be expected to be 23 percent for ruts up to 3 mm and 37 percent for ruts up to 6 mm. The results of two correctly conducted tests by two different laboratories on the same material are not expected to differ from each other by more than 65 percent and 103 percent of their average, for ruts up to 3 mm and 6 mm respectively Precision Statements for Creep and Stripping Slopes The following precision statements are made with respect to the creep and stripping slopes of the curve rut depth versus number of passes, with rut depth defined as the maximum deformation along the total length of the tested sample: The single-operator coefficient of variation was found to increase with increasing creep and stripping slopes. The variation can be expected to be 39 percent for slopes up to 0.2 mm/1,000 wheel passes and 43 percent for slopes up to 0.6 mm/1,000 wheel passes. The results of two correctly conducted tests by the same operator on the same material are not expected to differ from each other by more than 109 percent and 120 percent of their average, for slopes up to 0.2 mm/1,000 wheel passes and 0.6 mm/1,000 wheel passes respectively. The multilaboratory coefficient of variation was found to increase with increasing creep and stripping slopes. The variation can be expected to be 61 percent for slopes up to 0.2 mm/1,000 wheel passes and 81 percent for slopes up to 0.6 mm/1,000 wheel passes. The results of two properly conducted tests by two different laboratories on the same material are not expected to differ from each other by more than 171 percent and 227 percent of their average, for slopes up to 0.2 mm/1,000 wheel passes and 0.6 mm/1,000 wheel passes respectively. This coefficient of variation is expected to reduce to 44 percent and 50 percent, respectively, for slopes up to 0.2 mm/1,000 wheel passes and 0.6 mm/1,000 wheel passes, if the two laboratories use the same criteria for data collection and analysis. Under these conditions, the results of two properly conducted tests by two different laboratories on the same material are not expected to differ from each other by more than 122 percent and 140 percent of their average, for slopes up to 0.2 mm/1,000 wheel passes and 0.6 mm/1,000 wheel passes respectively Precision Statements for the Number of Passes to Stripping Inflection Point The following precision statements are made with respect to number of passes to the stripping inflection point of the curve rut depth versus number of passes, with rut depth defined as the maximum deformation along the total length of the tested sample: The single-operator coefficient of variation was found to be 22 percent. The results of two correctly conducted tests by the same operator on the same material are not expected to differ from each other by more than 63 percent of their average. The multilaboratory coefficient of variation was found to be 33 percent. The results of two correctly conducted tests by two different laboratories on the same material are not expected to differ from each other by more than 92 percent of their average. This coefficient of variation is expected to reduce to 22 percent if the two laboratories use the same criteria for data collection and analysis. UCPRC-RR
56 Under these conditions, results of two correctly conducted tests by two different laboratories on the same material are not expected to differ from each other by more than 62 percent. 42 UCPRC-RR
57 5. CONCLUSIONS AND RECOMMENDATIONS A round robin study in which 20 laboratories participated has been completed. Each laboratory conducted four Hamburg Wheel-Track tests. Two of the tests were conducted on specimens compacted by the University of California Pavement Research Center (UCPRC), and the other two on specimens compacted by each of the participating laboratories using loose mix provided by the UCPRC. A single plant-produced 3/4 in. mix with 5.0 percent PG binder was evaluated. The laboratories reported test results in terms of rut depth after 5,000, 10,000, 15,000, and 20,000 wheel passes, number of passes to 12.5 mm (0.5 in.) rut depth, creep slope, stripping slope, and stripping inflection point. Fourteen laboratories submitted the raw test data (all laboratories were requested to submit this information). The main conclusions drawn from this experiment include the following: The rutting and moisture resistance of the mix were relatively good. However, a clear stripping phase was reached in approximately 25 percent of the tests conducted on the specimens compacted at the UCPRC. Specimens compacted at the participating laboratories had better performance than the specimens compacted at the UCPRC. It is not clear why this occurred, but analysis of the results indicate that specimen air-void content did not contribute to the difference in results. Between-laboratory variability related to specimen fabrication was much smaller than the variability introduced by testing and data analysis. The type of HWT test device used for testing was shown to be significant only for the rut depth after 5,000 and 10,000 passes (i.e., for results obtained in the early part of the tests). Test results from left and right wheels were independent of each other for the two HWT test results specified in Section 39 of the 2015 Caltrans Standard Specifications, namely the number of passes to the stripping inflection point and number of passes to 12.5 mm (0.5 in.). Single-operator variability was relatively high (low repeatability) for all variables. This result is believed to be related, at least in part, to the good performance of the mix used for the experiment. Between-laboratory variability was relatively high for all variables except for the rut depth after a predetermined number of wheel passes. This high variability was shown to be related to different interpretations of how the rut depth is measured and analyzed. Between-laboratory variability clearly improved when the same criteria were used to analyze the raw data provided by the participating laboratories. Comparison of results submitted by the different laboratories to results determined by the UCPRC using the same raw data shows that a high degree of subjectivity was present in the HWT test data analysis conducted by the participating laboratories. Precision indices could only be determined for one of the HWT test results specified in Section 39 of the 2015 Caltrans Standard Specifications, namely the number of passes to the stripping inflection point. For this variable, single-operator and multilaboratory coefficients of variation were, respectively, 22 percent and 33 percent. Multilaboratory coefficient of variation would improve to 22 percent if fixed criteria had been used by all laboratories in the analysis. Precision estimates of UCPRC-RR
58 the number of passes to 12.5 mm could not be determined due to the very limited number of tests where this threshold value was reached. Additional precision statements were formulated for other HWT test results, including creep and strip slopes and rut depth after a predetermined number of wheel passes. These statements may be applicable if Caltrans specifications are revised based on one or more of these variables. The following recommendations are expected to contribute to improving HWT test single-operator and multilaboratory variability: Laboratories conducting HWT testing should receive additional instructions that supplement or clarify aspects of the AASHTO T 324 test method that can be interpreted in different ways. Items that need to be clarified, specified, defined, or expanded include the following: + The length of the wheelpath. + The locations along the wheelpath that should be used to compute rut depth. The capabilities of the different types of HWT test devices should be considered in this definition, since most of them can only record rutting at predefined locations. + The specific procedure that should be used to compute the rut depth from the different measuring locations (i.e., whether the maximum, the average, or any other representative value should be used). Detailed guidelines, with examples, should be written for defining the creep and stripping stationary phases and for determining the stripping inflection point since these definitions are currently very subjective. These guidelines should use a general purpose spreadsheet or similar analysis tool since they might not be compatible with the software installed in the different testing machines. These guidelines, along with training, and practice, may lead to more uniform results from different laboratories, thereby reducing between-laboratory variability in data analysis. Future round robin study exercises should include both good- and marginal-performing mixes, and should also include a practical exercise in which an additional three sets of raw data are sent to all the participating laboratories for analysis. The results reported by the laboratories could be used to better determine the between-laboratory variability related to data analysis and to prepare more realistic precision statements. The proposed marginal-performing mix will probably need to be specially prepared given that asphalt plants in California are unlikely to produce a standard mix that fails the HWT test. 44 UCPRC-RR
59 REFERENCES 1. SIGNORE, J., Harvey, J.T., and Jones, D Performance Based Specifications: Workplan for Support for Superpave Implementation. Davis and Berkeley, CA: University of California Pavement Research Center (UCPRC-WP ). 2. AZARI, H Precision Estimates of AASHTO T 324, Hamburg Wheel-Track Testing Of Compacted Hot Mix Asphalt (HMA). Research Results Digest 390. Washington, DC: Transportation Research Board, National Cooperative Highway Research Program. 3. LOUAY, N.M., Elseifi, M.A, Raghavendra, A. and Ye, M Hamburg Wheel-Track Test Equipment Requirements and Improvements to AASHTO T 324. Washington, DC: Transportation Research Board, National Cooperative Highway Research Program (Web-Only Document 219). UCPRC-RR
60 Blank page 46 UCPRC-RR
61 APPENDIX A: INSTRUCTION SHEET Dear Participants Thank you for participating in the round robin study for determining a precision statement for the Hamburg Wheel-Track Test in California. You should have received the following items to complete the round robin study: 1. This instruction sheet. 2. An Excel data file. 3. Eight (8) specimens prepared and compacted by the UCPRC for two (2) sets of Hamburg Wheel- Track Tests. Each set has four (4) randomized specimens from the overall production run. 4. Two (2) buckets of loose HMA sufficient to prepare eight (8) specimens within 7% ± 1% air-void content measured by the SSD method (AASHTO T 166A). This round robin study requests your laboratory to conduct Hamburg Wheel-Track Testing on four (4) sets of specimens (total sixteen [16]) specimens), and return the test data to Caltrans for statistical analysis and determination of the precision statement. One Hamburg Wheel-Track Test is defined as a test performed using both the left and right wheels, assuming that your Hamburg device is configured with two wheels. Please follow this instruction sheet in addition to the respective AASHTO and Caltrans standard procedures for specimen preparation and testing. Instructions for Compacting Specimens: 1. Refer to Section 6.3: Laboratory-Produced HMA in AASHTO T for specimen preparation. 2. Combine two (2) buckets of loose HMA and use a Quartermaster or similar device to split the material into representative samples for compaction. 3. Compact the specimens with a Superpave gyratory compactor in accordance with AASHTO T 312 at a compaction temperature of 140 C (284 F). a. Pressure: 600 kpa b. Internal angle: 1.16 (external angle 1.25 ) c. Compaction mode: height control d. Specimen diameter: 150 mm e. Specimen height: 63.5 mm f. Air-void content: 7.0 percent (Approximately 2,565 grams of the loose HMA provided will yield an average air-void content of 7.0 percent.) g. Extract specimens immediately after compaction. No squaring is needed. h. Mark each specimen s gyratory ram side with an identifying mark. Instructions for Determining Bulk Specific Gravity (G mb ) of the Specimens: 1. Specimens prepared by the UCPRC were dried prior to shipping. However, if the specimens appear to have had contact with moisture, dry back to constant weight in accordance with AASHTO R47 or AASHTO T 328. The maximum drying temperature is 125 (+/-5) F 2. Measure the G mb of the specimens with the SSD method in accordance with AASHTO T 166A. UCPRC-RR
62 3. Record all G mb data in the first sheet of the Excel data file. The data sheet is formatted to print as letter size. All data from UCPRC-compacted specimens must be entered on the first sheet. All the data from specimens compacted by your laboratory must be entered on the second sheet. 4. The maximum specific gravity of this mix is Instructions for Testing the Specimens: 1. Run the Hamburg Wheel-Track Test in accordance with AASHTO T Cut the specimens to the dimensions in order to fit a pair into the molds required for performing the test. 3. Place the molds into the mounting tray and fit the specimens into the mold. Place the specimens with the gyratory ram face up. 4. Check for a tight, parallel fit at the edge of the specimens. Trim them if needed. The minimum allowable gap between the molds is 3.5 mm. The maximum allowable gap between the two molds is 7.5 mm. 5. After securing the molds and samples into the mounting tray, check if there is any gap between one side of the mold and the tray. Use plaster of paris to fill the gap. Mix the plaster with water at the recommended ratio. Pour the plaster to a height equal to the surface of the mold. If plaster flows underneath the specimen, its thickness cannot exceed 2 mm. Allow the plaster to set for one hour. 6. Fasten the mounting tray into the empty water bath. 7. Start the software supplied with the Hamburg machine, enter the required test information into the computer, and verify the test parameters. a. Date of the test. b. Set the testing temperature to 122 F (50 C). c. Set the load to 158 lb, or lower the test wheel (machine dependent). d. Set the testing rate to 52 passes per minute. e. Set the deformation stopping criteria to 24.0 mm. f. Set the maximum number of passes to 25,000. g. Set the sampling interval as follows: i. Every 20 passes for the first 1,000 passes ii. Every 50 passes for the second 4,000 passes iii. Every 100 passes for the remaining passes. 8. Fill the water bath. 9. Monitor the water temperature. Once the test temperature of 122 F (50 C) has been reached, allow an additional 30 minutes for the specimens to be saturated in the water. There may be a feature in the machine software to automatically delay testing. 10. Start the test after the specimens have been standing in the water for 30 minutes at the test temperature of 122 F (50 C). 11. The test should automatically stop when 25,000 passes have completed or when the deformation has reached 24.0 mm. 12. Fill in the required data in the Excel data sheets. All data from the UCPRC-compacted specimens must be entered on the first sheet. All the data from specimens compacted by your laboratory must be entered on the second sheet the original raw data files from each Hamburg Wheel-Track Test and the Excel data sheets filled out with test results to Caltrans. 48 UCPRC-RR
63 APPENDIX B: RESULT REPORTING TEMPLATE Data Sheet for the Caltrans Hamburg Wheel-Track Test Round Robin Laboratory Name District Number Hamburg Make & Model Date Material Received AASHTO T 166A SSD Method AASHTO T 331 CoreLok Method AASHTO T 324 Hamburg Wheel-Track Test Data Sheet for the Caltrans Hamburg Wheel-Track Test Round Robin for UCPRC-Compacted Specimens Sample ID Date Tested Mass of Dry Specimen in Air (g) Mass of the Bag (g) Mass of Sealed Specimen in Water (g) Mass of Specimen after Submersion (g) Ratio of Mass of Dry Specimen to Bag Bag Volume Correction Factor Volume Bulk Specific Gravity Sample ID Date Tested Mass of Dry Specimen in Air (g) Mass of Specimen in Water (g) Mass of Surface-Dry Specimen in Air (g) Volume Bulk Specific Gravity Sample ID Date Tested Sample Location (Left / Right Wheel) Temperature ( C) Load, N (lbf) Rut Depth at 5,000 cycles (mm) Rut Depth at 10,000 cycles (mm) Rut Depth at 15,000 cycles (mm) Rut Depth at 20,000 cycles (mm) Number of passes at 12.5 mm rut depth Creep Slope Stripping Slope Stripping Inflection Point (cycle) Visual Damage (0 to 5 rating, 5 is most damaged) UCPRC-RR
64 Data Sheet for the Caltrans Hamburg Wheel-Track Test Round Robin District Number Date Material Received Laboratory Name Hamburg Make & Model Data Sheet for the Caltrans Hamburg Wheel-Track Test Round Robin for Individual Lab-Compacted Specimens Sample ID Date Tested Mass of Dry Specimen in Air (g) Mass of the Bag (g) Mass of Sealed Specimen in Water (g) Mass of Specimen after Submersion (g) Ratio of Mass of Dry Specimen to Bag Bag Volume Correction Factor Volume Bulk Specific Gravity AASHTO T 166A SSD Method AASHTO T 331 CoreLok Method AASHTO T 324 Hamburg Wheel-Track Test Sample ID Date Tested Mass of Dry Specimen in Air (g) Mass of Specimen in Water (g) Mass of Surface-Dry Specimen in Air (g) Volume Bulk Specific Gravity Sample ID Date Tested Sample Location (Left / Right Wheel) Temperature ( C) Load, N (lbf) Rut Depth at 5,000 cycles (mm) Rut Depth at 10,000 cycles (mm) Rut Depth at 15,000 cycles (mm) Rut Depth at 20,000 cycles (mm) Number of passes at 12.5 mm rut depth Creep Slope Stripping Slope Stripping Inflection Point (cycle) Visual Damage (0 to 5 rating, 5 is most damaged) 50 UCPRC-RR
65 APPENDIX C: PARTICPATING LABORATORIES Table C.1 lists the laboratories that submitted results for the HWT round robin test program. The laboratories are listed in alphabetical order and not in the order used for presenting results in the report Table C.1: Participating Laboratories Laboratory Name (as reported by each laboratory) Hamburg Testing Device, Make and Model (as reported by each laboratory) CalPortland Construction Pavement Technologies APA Jr. CGI Technical Services Inc. Troxler PMW Two-wheel Tracker District 10 Material Laboratory PMW Wheel Tracker District 2 Materials Lab PMW Wheel Tracker District 3 Laboratory PMW Wheel Tracker 60 District 5 Material Laboratory Cox and Sons CS9000 District 6 Laboratory Not reported Earth Systems Southern California Troxler PMW Wheel Tracker Eastern Sierra Engineering Troxler PMW Gallagher & Burk Troxler Garco Testing Laboratories (Tracy, CA) Troxler PMW Two-wheel Tracker George Reed Inc. Pine Instruments AFG2AS Pavement Engineering Inc. James Cox and Sons CS RMA Group Inc. (Rancho Cucamonga, CA) Pine Instruments AFG2AS Skanska (Riverside, CA) Pavement Technologies APA Jr. Teichert Perkins Caltrans ID 32 Cox and Sons Teichert Vernalis Caltrans ID 99 Troxler PMW Twining Inc. (Sacramento, CA) PMW Wheel Tracker UCPRC PMW Wheel Tracker Vulcan Materials Co. Pavement Technologies APA Jr. UCPRC-RR
66 Blank page 52 UCPRC-RR
67 APPENDIX D: DATA REPORTED BY LABORATORIES D.1 Test Results Test results submitted by the participating laboratories are listed in Table D.1 through Table D.14. The results are tabulated as follows: Table D.1: Rut Depth after 5,000 Passes (Compacted by UCPRC) Table D.2: Rut Depth after 5,000 Passes (Compacted by Participating Laboratories) Table D.3: Rut Depth after 10,000 Passes (Compacted by UCPRC) Table D.4: Rut Depth after 10,000 Passes (Compacted by Participating Laboratories) Table D.5: Rut Depth after 15,000 Passes (Compacted by UCPRC) Table D.6: Rut Depth after 15,000 Passes (Compacted by Participating Laboratories) Table D.7: Rut Depth after 20,000 Passes (Compacted by UCPRC) Table D.8: Rut Depth after 20,000 Passes (Compacted by Participating Laboratories) Table D.9: Passes to 12.5 mm Rut Depth (Compacted by UCPRC) Table D.10: Passes to 12.5 mm Rut Depth (Compacted by Participating Laboratories) Table D.11: Creep Slope (Compacted by UCPRC) Table D.12: Creep Slope (Compacted by Participating Laboratories) Table D.13: Stripping Slope (Compacted by UCPRC) Table D.14: Stripping Slope (Compacted by Participating Laboratories) Table D.15: Stripping Inflection Point (Compacted by UCPRC) Table D.16: Stripping Inflection Point (Compacted by Participating Laboratories) D.2 Key to Terms Used in Tables x i laboratory average (average of 4 replicates for laboratory i) Sr i single-operator standard deviation of laboratory i (standard deviation of the replicates of laboratory i) h i h-value as defined in ASTM C802 (Section 10.5) h i = (x i - x mean )/S xm where: x i is the laboratory average, as defined above x mean is the average of all laboratories ( avg. value at the bottom of x i column) S xm is the standard deviation of laboratory averages (square root of the var. value at the bottom of x i column) The h-value provides an index of the deviation of the laboratory results from the rest of the laboratories. Laboratories with an h-value greater than a critical value (in absolute terms) UCPRC-RR
68 should be considered as potential outliers. The critical h-value for 20 laboratories is ± 2.56 as listed in ASTM C802, Table 4. k i k-value as defined in ASTM C802 (Section 10.5) k i = Sr i /Sr POOL where: Sr i is the single-operator standard deviation of laboratory i, as defined above Sr POOL is the pooled single-operator standard deviation (value at the bottom of the Sr i column) The k-value provides an index of the single-operator variability of the laboratory compared to the rest of the laboratories. Laboratories with a k-value greater than a critical value should be considered as potential outliers. The critical k-value for 20 laboratories and four replicates is 2.00 (ASTM C802, Table 4). Underlined values in orange-shaded cells in the tables below are considered outliers and were not included in the analyses. 54 UCPRC-RR
69 Lab Number Table D.1: Rut Depth after 5,000 Passes (Compacted by UCPRC) Rut Depth (mm) Set 1 Set 2 Left Right Left Right Rep. 1 Rep. 2 Rep. 3 Rep. 4 Analysis Variables 1 xi Sri hi ki avg var Explanation of terms is included at the beginning of this appendix. Underlined values in orange-shaded cells are considered outliers and were not included in the analyses. UCPRC-RR
70 Lab Number Table D.2: Rut Depth after 5,000 Passes (Compacted by Participating Laboratories) Rut Depth (mm) Set 1 Set 2 Left Right Left Right Rep. 1 Rep. 2 Rep. 3 Rep. 4 Analysis Variables 1 xi Sri hi ki Explanation of terms is included at the beginning of this appendix UCPRC-RR
71 Lab Number Table D.3: Rut Depth after 10,000 Passes (Compacted by UCPRC) Rut Depth (mm) Set 1 Set 2 Left Right Left Right Rep. 1 Rep. 2 Rep. 3 Rep. 4 Analysis Variables 1 xi Sri hi ki Explanation of terms is included at the beginning of this appendix. avg var UCPRC-RR
72 Lab Number Table D.4: Rut Depth after 10,000 Passes (Compacted by Participating Laboratories) Rut Depth (mm) Set 1 Set 2 Left Right Left Right Rep. 1 Rep. 2 Rep. 3 Rep. 4 Analysis Variables 1 xi Sri hi ki Explanation of terms is included at the beginning of this appendix. avg var UCPRC-RR
73 Lab Number Table D.5: Rut Depth after 15,000 Passes (Compacted by UCPRC) Rut depth (mm) Set 1 Set 2 Left Right Left Right Rep. 1 Rep. 2 Rep. 3 Rep. 4 Analysis Variables 1 xi Sri hi ki avg var Explanation of terms is included at the beginning of this appendix. Underlined values in orange-shaded cells are considered outliers and were not included in the analyses. 2 This point was regarded as an outlier since the corresponding ki increased to 2.12 (above the critical value of 2.0) when the other outliers were removed. 3 This point was regarded as an outlier since the corresponding ki increased to 2.30 (above the critical value of 2.0) when the other outliers were removed. UCPRC-RR
74 Lab Number Table D.6: Rut Depth after 15,000 Passes (Compacted by Participating Laboratories) Rut Depth (mm) Set 1 Set 2 Left Right Left Right Rep. 1 Rep. 2 Rep. 3 Rep. 4 Analysis Variables 1 xi Sri hi ki Explanation of terms is included at the beginning of this appendix. avg var UCPRC-RR
75 Lab Number Table D.7: Rut Depth after 20,000 Passes (Compacted by UCPRC) Rut Depth (mm) Set 1 Set 2 Left Right Left Right Rep. 1 Rep. 2 Rep. 3 Rep. 4 Analysis Variables 1 xi Sri hi ki avg var Explanation of terms is included at the beginning of this appendix. Underlined values in orange-shaded cells are considered outliers and were not included in the analyses. 2 This point was regarded as an outlier since the corresponding ki increased to 2.32 (above the critical value of 2.0) when the other outliers were removed. 3 This point was regarded as an outlier since the corresponding ki increased to 2.27 (above the critical value of 2.0) when the other outliers were removed. UCPRC-RR
76 Lab Number Table D.8: Rut Depth after 20,000 Passes (Compacted by Participating Laboratories) Rut Depth (mm) Set 1 Set 2 Left Right Left Right Rep. 1 Rep. 2 Rep. 3 Rep. 4 Analysis Variables 1 xi Sri hi ki avg var Explanation of terms is included at the beginning of this appendix. Underlined values in orange-shaded cells are considered outliers and were not included in the analyses. 62 UCPRC-RR
77 Lab Number Table D.9: Passes to 12.5 mm Rut Depth (Compacted by UCPRC) Passes to 12.5 mm Rut Depth Set 1 Set 2 Left Right Left Right Rep. 1 Rep. 2 Rep. 3 Rep. 4 Analysis Variables 1 xi Sri hi ki 1 18,444 24, ,513 4, , ,300 23, ,650 3, ,800-24,900 24, , avg. 22,171 3,188 var. 1 Explanation of terms is included at the beginning of this appendix. 3.75E+06 UCPRC-RR
78 Lab Number Table D.10: Passes to 12.5 mm Rut Depth (Compacted by Participating Laboratories) Passes to 12.5 mm Rut Depth Set 1 Set 2 Left Right Left Right Rep. 1 Rep. 2 Rep. 3 Rep. 4 No rut depths to 12.5 mm recorded avg. var. 1 Explanation of terms is included at the beginning of this appendix. Analysis Variables 1 xi Sri hi ki 64 UCPRC-RR
79 Lab Number Table D.11: Creep Slope (Compacted by UCPRC) Creep Slope (mm/pass) Set 1 Set 2 Left Right Left Right Rep. 1 Rep. 2 Rep. 3 Rep. 4 Analysis Variables 1 xi Sri hi ki E E E E E E E E E E E E E E E E E E E E E E E E E E E E E E E E E E E E E E E E E E E E E E E E E E E E E E E E E E E E E E E E E E E E E E E E avg. 1.55E E-04 var. 1.30E-08 1 Explanation of terms is included at the beginning of this appendix. Underlined values in orange-shaded cells are considered outliers and were not included in the analyses. UCPRC-RR
80 Lab Number Table D.12: Creep Slope (Compacted by Participating Laboratories) Creep Slope (mm/pass) Set 1 Set 2 Left Right Left Right Rep. 1 Rep. 2 Rep. 3 Rep. 4 Analysis Variables 1 xi Sri hi ki E E E E E E E E E E E E E E E E E E E E E E E E E E E E E E E E E E E E E E E E E E E E E E E E E E E E E E E E E avg. 9.21E E-05 var. 3.54E-09 1 Explanation of terms is included at the beginning of this appendix. Underlined values in orange-shaded cells are considered outliers and were not included in the analyses. 2 These two points were regarded as outliers due to their reduced value, which was essentially zero. 66 UCPRC-RR
81 Lab Number Table D.13: Stripping Slope (Compacted by UCPRC) Stripping Slope (mm/pass) Set 1 Set 2 Left Right Left Right Rep. 1 Rep. 2 Rep. 3 Rep. 4 Analysis Variables 1 xi Sri hi ki E E E E E E E E E E E E E E E E E E E E E E E E E E E E E E E E E E E E E E E E E E E E E E E E E E E E E E E E E E avg. 4.27E E-04 var. 1 Explanation of terms is included at the beginning of this appendix. 9.70E-08 UCPRC-RR
82 Lab Number Table D.14: Stripping Slope (Compacted by Participating Laboratories) Stripping Slope (mm/pass) Set 1 Set 2 Left Right Left Right Rep. 1 Rep. 2 Rep. 3 Rep. 4 Analysis Variables 1 xi Sri hi ki E E E E E E E E E E E E E E E E E E E E E E E E E E E E E E E E E E avg. 1.80E E-04 var. 1.02E-08 1 Explanation of terms is included at the beginning of this appendix. Underlined values in orange-shaded cells are considered outliers and were not included in the analyses. 68 UCPRC-RR
83 Lab Number Table D.15: Stripping Inflection Point (Compacted by UCPRC) Stripping Inflection Point (passes) Set 1 Set 2 Left Right Left Right Rep. 1 Rep. 2 Rep. 3 Rep. 4 Analysis Variables 1 xi Sri hi ki , ,625 18,088-17,054 18,589 1, ,397 17,817 21,861 21,016 18,273 4, ,776 13,683 11,625 14,614 14,425 2, ,843 5,197-21,813 11,951 8, ,026 14, ,004 4, , ,168 20, ,956 8,085 19,304 18,071 15,854 5, ,086 15,917 15, , , ,692 8,583-9,082 8, ,500 8,500 8,000-8, ,033-13,820-15,427 2, ,000 13,000-18,000 17,333 4, avg. 14,717 3,787 var. 1.50E+07 1 Explanation of terms is included at the beginning of this appendix. Underlined values in orange-shaded cells are considered outliers and were not included in the analyses. UCPRC-RR
84 Lab Number Table D.16: Stripping Inflection Point (Compacted by Participating Laboratories) Stripping Inflection Point (passes) Set 1 Set 2 Left Right Left Right Rep. 1 Rep. 2 Rep. 3 Rep. 4 Analysis Variables 1 xi Sri hi ki , , ,709 1, ,780-15,485-16,633 1, ,385-20,064-20, , , , , ,000-20,000 20,000 19, avg. 34,683 1,118 var. 9.86E+08 1 Explanation of terms is included at the beginning of this appendix. Underlined values in orange-shaded cells are considered outliers and were not included in the analyses. 2 These values were regarded as outliers since the HWT test was conducted up to 25,000 cycles, and the tripping inflection point can therefore not be higher than 25, UCPRC-RR
85 APPENDIX E: ANOVA TO DETERMINE SIGNIFICANT FACTORS UCPRC-RR
86 72 UCPRC-RR
87 UCPRC-RR
88 74 UCPRC-RR
89 UCPRC-RR

90 76 UCPRC-RR
91 UCPRC-RR
92 78 UCPRC-RR
93 UCPRC-RR
94 80 UCPRC-RR
95 UCPRC-RR

96 82 UCPRC-RR
97 UCPRC-RR

98 84 UCPRC-RR
99 UCPRC-RR

100 86 UCPRC-RR
101 UCPRC-RR
102 88 UCPRC-RR
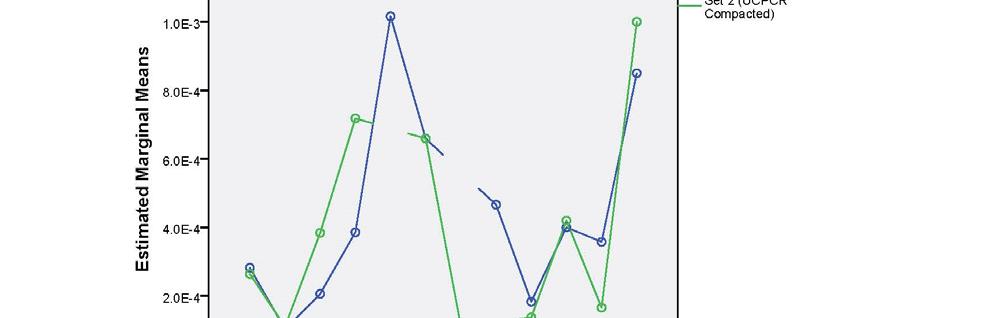
103 UCPRC-RR
104 90 UCPRC-RR
105 UCPRC-RR

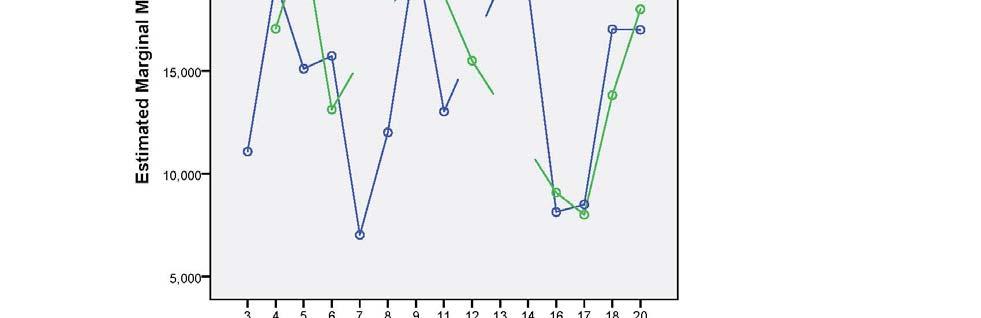
106 92 UCPRC-RR
107 UCPRC-RR
108 94 UCPRC-RR
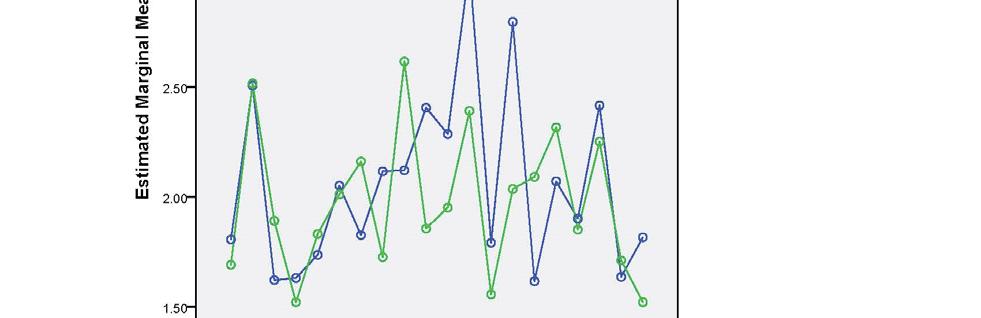
109 UCPRC-RR
110 96 UCPRC-RR
111 UCPRC-RR
112 98 UCPRC-RR
113 UCPRC-RR
114 100 UCPRC-RR
115 UCPRC-RR
116 102 UCPRC-RR
117 UCPRC-RR

118 104 UCPRC-RR
119 UCPRC-RR

120 106 UCPRC-RR
121 UCPRC-RR
122 108 UCPRC-RR
123 UCPRC-RR
124 110 UCPRC-RR
125 APPENDIX F: ANOVA TO DETERMINE VARIANCE COMPONENTS UCPRC-RR
126 112 UCPRC-RR
127 UCPRC-RR
128 114 UCPRC-RR
129 UCPRC-RR
130 116 UCPRC-RR
131 UCPRC-RR
132 118 UCPRC-RR
133 UCPRC-RR
134 120 UCPRC-RR
135 UCPRC-RR
136 122 UCPRC-RR
137 UCPRC-RR
138 124 UCPRC-RR
139 UCPRC-RR
140 126 UCPRC-RR
141 UCPRC-RR
142 128 UCPRC-RR
143 UCPRC-RR
144 130 UCPRC-RR
145 UCPRC-RR
146 132 UCPRC-RR
147 UCPRC-RR

148 134 UCPRC-RR
PRECISION ESTIMATES OF AASHTO T324, HAMBURG WHEEL-TRACK TESTING OFCOMPACTED HOT MIX ASPHALT (HMA) APPENDICES FOR FINAL REPORT
 APPENDICES FOR FINAL REPORT") Project No. 10-87-2B DRAFT 6/06/14 PRECISION ESTIMATES OF AASHTO T324, HAMBURG WHEEL-TRACK TESTING OFCOMPACTED HOT MIX ASPHALT (HMA) APPENDICES FOR FINAL REPORT Prepared for National Cooperative Highway
Project No. 10-87-2B DRAFT 6/06/14 PRECISION ESTIMATES OF AASHTO T324, HAMBURG WHEEL-TRACK TESTING OFCOMPACTED HOT MIX ASPHALT (HMA) APPENDICES FOR FINAL REPORT Prepared for National Cooperative Highway
OHD L-47. Guidelines for Resolving Differences in Test Results
 Guidelines for Resolving Differences in Test Results Page 1 of 21 1 SCOPE 1.1 The guidelines provided are as follows: 1.1.1 Standard Practice for the Evaluation of Different Superpave Gyratory Compactors
RESISTANCE OF COMPACTED ASPHALT MIXTURE TO MOISTURE INDUCED DAMAGE (Kansas Test Method KT-56)
") 5.9.56 RESISTANCE OF COMPACTED ASPHALT MIXTURE TO MOISTURE INDUCED DAMAGE (Kansas Test Method ) 1. SCOPE This test covers preparation of specimens and measurement of the change of tensile strength resulting
5.9.56 RESISTANCE OF COMPACTED ASPHALT MIXTURE TO MOISTURE INDUCED DAMAGE (Kansas Test Method ) 1. SCOPE This test covers preparation of specimens and measurement of the change of tensile strength resulting
Measuring Air Void Characteristics of Oklahoma Air- Entrained Concrete using the Air Void Analyzer (AVA) / Analyzing AVA Sources of Error
 / Analyzing AVA Sources of Error") Measuring Air Void Characteristics of Oklahoma Air- Entrained Concrete using the Air Void Analyzer (AVA) / Analyzing AVA Sources of Error FINAL REPORT - FHWA-OK-08-03 ODOT SPR ITEM NUMBER 2182 By Steve
Measuring Air Void Characteristics of Oklahoma Air- Entrained Concrete using the Air Void Analyzer (AVA) / Analyzing AVA Sources of Error FINAL REPORT - FHWA-OK-08-03 ODOT SPR ITEM NUMBER 2182 By Steve
9 QUALITY ASSURANCE PROCEDURES
 9 QUALITY ASSURANCE PROCEDURES Random Numbers Design Mix Formula Lot/Sublot -- QC/QA HMA and SMA Acceptance Samples Adjustment Period -- QC/QA HMA and SMA Mixture Acceptance QC/QA HMA HMA SMA Pay Factors
Evaluating the Design Safety of Highway Structural Supports
 Evaluating the Design Safety of Highway Structural Supports by Fouad H. Fouad and Elizabeth A. Calvert Department of Civil and Environmental Engineering The University of Alabama at Birmingham Birmingham,
CONTRACTOR MIX DESIGN GUIDELINES ASPHALT CONCRETE
 CONTRACTOR MIX DESIGN GUIDELINES For ASPHALT CONCRETE OREGON DEPARTMENT OF TRANSPORTATION CONTRACTOR MIX DESIGN GUIDELINES for ASPHALT CONCRETE These guidelines outline the procedures to be used in developing,
FINAL REPORT FOR NCHRP (375) Improvements to Dry-Back Procedure of AASHTO T 209. December 2017
 Improvements to Dry-Back Procedure of AASHTO T 209. December 2017") FINAL REPORT FOR NCHRP 20-07 (375) Improvements to Dry-Back Procedure of AASHTO T 209 December 2017 TRANSPORTATION RESEARCH BOARD NAS-NRC LIMITED USE DOCUMENT This proposal is for use of recipient in selection
FINAL REPORT FOR NCHRP 20-07 (375) Improvements to Dry-Back Procedure of AASHTO T 209 December 2017 TRANSPORTATION RESEARCH BOARD NAS-NRC LIMITED USE DOCUMENT This proposal is for use of recipient in selection
IN-PLACE DENSITY OF BITUMINOUS MIXES USING THE NUCLEAR MOISTURE-DENSITY GAUGE FOP FOR WAQTC TM 8
 OF BITUMINOUS MIXES USING THE NUCLEAR MOISTURE-DENSITY GAUGE FOP FOR WAQTC TM 8 Scope This test method describes a test procedure for determining the density of bituminous mixes by means of a nuclear gauge
Informational Report on Lighting Design for Midblock Crosswalks
 Informational Report on Lighting Design for Midblock Crosswalks Publication No. FHWA-HRT-08-053 april 2008 Research, Development, and Technology Turner-Fairbank Highway Research Center 6300 Georgetown
A.M. The time between 12:00 midnight and 12:00 noon. Houghton Mifflin Co. 1 Grade 4 Unit 5
 A.M. The time between 12:00 midnight and 12:00 noon. Houghton Mifflin Co. 1 Grade 4 Unit 5 bar graph A graph in which information is shown by means of rectangular bars. Favorite Sea Creature Sea Creature
Estimating Highway Maintenance Work 2008
 Purdue University Purdue e-pubs Indiana Local Technical Assistance Program (LTAP) Publications Indiana Local Technical Assistance Program (LTAP) 5-2008 Estimating Highway Maintenance Work 2008 Ohio Department
Field Evaluation of a Restricted Crossing U-Turn Intersection
 Field Evaluation of a Restricted Crossing U-Turn Intersection Publication No. FHWA-HRT-11-067 june 2012 Research, Development, and Technology Turner-Fairbank Highway Research Center 6300 Georgetown Pike
BULK SPECIFIC GRAVITY AND UNIT WEIGHT OF COMPACTED HOT MIX ASPHALT (HMA) (Kansas Test Method KT-15)
 (Kansas Test Method KT-15)") 5.9.15 BULK SPECIFIC GRAVITY AND UNIT WEIGHT OF COMPACTED HOT MIX ASPHALT (HMA) (Kansas Test Method ) 1. SCOPE This method of test covers the procedure for determining the bulk specific gravity of specimens
5.9.15 BULK SPECIFIC GRAVITY AND UNIT WEIGHT OF COMPACTED HOT MIX ASPHALT (HMA) (Kansas Test Method ) 1. SCOPE This method of test covers the procedure for determining the bulk specific gravity of specimens
ASPHALT PLANT LEVEL 1
 ASPHALT PLANT LEVEL 1 Module 5: Bulk Specific Gravity FM 1 T 166 FDOT Course Release: 10, Module 5 1 Specification Year: January 2015 Release 10 5-1 FM 1 T 166 Bulk specific gravity of compacted mixtures.
IMPROVED RICE METHOD FOR DETERMINING THEORETICAL MAXIMUM SPECIFIC GRAVITY OF ASPHALT PAVING MIXTURES
 NCAT Report No. 92-3 IMPROVED RICE METHOD FOR DETERMINING THEORETICAL MAXIMUM SPECIFIC GRAVITY OF ASPHALT PAVING MIXTURES by Prithvi S. Kandhal Maqbool A. Khatri May 1992 Presented at the Annual Meeting
OHD L-43 METHOD OF TEST FOR DETERMINING RUTTING SUSCEPTIBILITY USING THE ASPHALT PAVEMENT ANALYZER
 Page 1 of 12 METHOD OF TEST FOR DETERMINING RUTTING SUSCEPTIBILITY USING THE ASPHALT PAVEMENT ANALYZER 1. SCOPE 1.1 This method describes a procedure for testing the rutting susceptibility of asphaltaggregate
Chapter 37 Tex-241-F, Superpave Gyratory Compacting of Test Specimens of Bituminous Mixtures
 Chapter 37 Tex-241-F, Superpave Gyratory Compacting of Test Specimens of Bituminous Contents: Section 1 Overview... 37-2 Section 2 Apparatus... 37-3 Section 3 Calibration... 37-5 Section 4 Preparations...
Updates to Research on Recommended Minimum Levels for Pavement Marking Retroreflectivity to Meet Driver Night Visibility Needs
 Updates to Research on Recommended Minimum Levels for Pavement Marking Retroreflectivity to Meet Driver Night Visibility Needs Publication No. FHWA-HRT-07-059 october 2007 Research, Development, and Technology
COMPARATIVE ANALYSIS OF SUPERPAVE GYRATORY COMPACTED SPECIMENS WITH LINEAR KNEADING COMPACTED SLABS USING THE HAMBURG WHEEL-TRACKING DEVICE
 r COMPARATIVE ANALYSIS OF SUPERPAVE GYRATORY COMPACTED SPECIMENS WITH LINEAR KNEADING COMPACTED SLABS USING THE HAMBURG WHEEL-TRACKING DEVICE l r DHT-40 r l r DEPARTMENTAL RESEARCH TEXAS DEPARTMENT OF
Evaluation of Shared Lane Markings
 Evaluation of Shared Lane Markings PUBLICATION NO. FHWA-HRT-0-04 DECEMBER 00 Research, Development, and Technology Turner-Fairbank Highway Research Center 6300 Georgetown Pike McLean, VA 0-96 FOREWORD
Crash Analysis of I-64 Closure in St. Louis County
 Report # MATC-MST: 341 Final Report 25-1121-0001-341 Crash Analysis of I-64 Closure in St. Louis County Ghulam H. Bham, Ph.D. Professor Department of Civil, Architectural, and Environmental Engineering
Kraton Ultra-thin HMA / WMA Overlay Study
 1 I. Overview Kraton Ultra-thin HMA / WMA Overlay Study Project: Oregon Department of Transportation I-5 Rock Point Evans Creek Contractor: Knife River Materials Existing Pavement - Condition: Binder Utilized:
Hot Mix Asphalt (HMA) Quality Assurance
 Quality Assurance") Supplemental Technical Specification for March 3, 2010 Hot Mix Asphalt (HMA) Quality Assurance SCDOT Designation: SC-M-400 (05/10) 1. SCOPE Base field acceptance of hot mix asphalt (HMA) mixtures on asphalt
Supplemental Technical Specification for March 3, 2010 Hot Mix Asphalt (HMA) Quality Assurance SCDOT Designation: SC-M-400 (05/10) 1. SCOPE Base field acceptance of hot mix asphalt (HMA) mixtures on asphalt
Test Track and Driving Simulator Evaluations of Warnings to Prevent Right-Angle Crashes at Signalized Intersections
 Test Track and Driving Simulator Evaluations of Warnings to Prevent Right-Angle Crashes at Signalized Intersections Publication No. FHWA-HRT-08-070 october 2008 Research, Development, and Technology Turner-Fairbank
Separating Load from Moisture Effects in Wet Hamburg Wheel-Track Test
 1 Separating Load from Moisture Effects in Wet Hamburg Wheel-Track Test Quan (Mike) Lv, Ph.D. Hussain Bahia, Ph.D. March 6, 2019 Fort Worth, Texas School of Transportation Engineering Tongji University
Asphalt Mixture Quality Acceptance
 Supplemental Technical Specification for Asphalt Mixture Quality Acceptance SCDOT Designation: SC-M-400 (January 1, 2018) 1. SCOPE Use this specification for the acceptance of both hot mix and warm mix
Federal Highway Administration University Course on Bicycle and Pedestrian Transportation
 Federal Highway Administration University Course on Bicycle and Pedestrian Transportation Lesson 18: Bicycle and Pedestrian Connections to Transit July 2006 SI* (MODERN METRIC) CONVERSION FACTORS APPROXIMATE
PEDSAFE: Pedestrian Safety Guide and Countermeasure Selection System
 1. Report No. 2. Government Accession No. 3. Recipient's Catalog No. FHWA-SA-04-003 Technical Report Documentation Page 4. Title and Subtitle PEDSAFE: Pedestrian Safety Guide and Countermeasure Selection
Preliminary Results: Measurement of Macrotexture on Surface Treatments and Survey of Bicyclist Ride Quality on Mon-198 and SLO-1 Test Sections
 August 3 Technical Memorandum: UCPRC-TM-3-7 Preliminary Results: Measurement of Macrotexture on Surface Treatments and Survey of Bicyclist Ride Quality on Mon-98 and SLO- Test Sections Authors: Hui Li,
Texas Transportation Institute The Texas A&M University System College Station, Texas
 1. Report No. FHWA/TX-04/5-4977-01-1. Government Accession No. 3. Recipient's Catalog No. 4. Title and Subtitle VARIABILITY OF HAMBURG WHEEL TRACKING DEVICES 5. Report Date April 004 Technical Report Documentation
Federal Highway Administration University Course on Bicycle and Pedestrian Transportation
 Federal Highway Administration University Course on Bicycle and Pedestrian Transportation Lesson 15: Bicycle Lanes July 2006 SI* (MODERN METRIC) CONVERSION FACTORS APPROXIMATE CONVERSIONS TO SI UNITS Symbol
Real-Time Smoothness Measurements on Concrete Pavements During Construction
 Recommended Practice for Real-Time Smoothness Measurements on Concrete Pavements During Construction XX-## (2017) 1. SCOPE 1.1. This document provides language that can be used by an Owner-Agency to develop
Evaluation of the Wisconsin DOT Walking Profiler
 Final Report Evaluation of the Wisconsin DOT Walking Profiler March 2007 U.S. Department of Transportation Federal Highway Administration Notice This document is disseminated under the sponsorship of the
TECHNICAL REPORT STANDARD TITLE PAGE
 TECHNICAL REPORT STANDARD TITLE PAGE 1. REPORT NO. 2. GOVERNMENT ACCESSION NO. 3. RECIPIENT S CATALOG NO. 4. TITLE AND SUBTITLE AIR VOID CHARACTERISTICS OF OKLAHOMA CONCRETE / AVA SOURCES OF ERROR 7. AUTHOR(S)
SPECIFICATION FOR REPEATED LOAD TRIAXIAL (RLT) TESTING FOR PAVEMENT MATERIALS
 TESTING FOR PAVEMENT MATERIALS") SPECIFICATION FOR REPEATED LOAD TRIAXIAL (RLT) TESTING FOR PAVEMENT MATERIALS 1. SCOPE This specification details the six (6) stage permanent strain Repeated Load Triaxial (RLT) test for unbound and modified
SPECIFICATION FOR REPEATED LOAD TRIAXIAL (RLT) TESTING FOR PAVEMENT MATERIALS 1. SCOPE This specification details the six (6) stage permanent strain Repeated Load Triaxial (RLT) test for unbound and modified
Asphalt Mixture Quality Assurance
 Supplemental Technical Specification for Asphalt Mixture Quality Assurance SCDOT Designation: SC-M-400 (10/13) 1. SCOPE Base field acceptance of asphalt mixtures on asphalt binder content, air voids, voids
TRUCKS INVOLVED IN FATAL ACCIDENTS FACTBOOK 2005
 UMTRI 2008-08 TRUCKS INVOLVED IN FATAL ACCIDENTS FACTBOOK 2005 Anne Matteson Linda Jarossi John Woodrooffe February 2008 Center for National Truck and Bus Statistics The University of Michigan Transportation
Improved Rice Method for Determining Theoretical Maximum Specific Gravity of Asphalt Paving Mixtures
 TRANSPORTATION RESEARCH RECORD 1353 9 Improved Rice Method for Determining Theoretical Maximum Specific Gravity of Asphalt Paving Mixtures PRITHVI S. KANDHAL AND MAQBOOL A. KHATRI The Rice method (ASTM
Math 15 Test 3 Review Section Change 4.5 yards to inches. Round your answer to the nearest inch. (1 yd = 3 ft, 1 ft = 12 in)
") Page 1 Math 15 Section 6.3 18. Change 4.5 yards to inches. Round your answer to the nearest inch. (1 yd = 3 ft, 1 ft = 12 in) 30. Change 528 inches to feet. (1 ft = 12 in) 42. Change 3 1/16 pounds to ounces.
Page 1 Math 15 Section 6.3 18. Change 4.5 yards to inches. Round your answer to the nearest inch. (1 yd = 3 ft, 1 ft = 12 in) 30. Change 528 inches to feet. (1 ft = 12 in) 42. Change 3 1/16 pounds to ounces.
SUPERPAVE MIX DESIGN. Superpave Mix Design 1
 SUPERPAVE MIX DESIGN Superpave Mix Design 1 Superpave Gyratory Compaction and Mixture Requirements Section objectives Describe the Superpave gyratory compactor Review the Superpave mixture requirements
Hot Mix Asphalt (HMA) Quality Assurance
 Quality Assurance") Supplemental Technical Specification for May 2, 2008 Hot Mix Asphalt (HMA) Quality Assurance SCDOT Designation: SC-M-400V (06/08) 1. SCOPE Base field acceptance of hot mix asphalt (HMA) mixtures on asphalt
Supplemental Technical Specification for May 2, 2008 Hot Mix Asphalt (HMA) Quality Assurance SCDOT Designation: SC-M-400V (06/08) 1. SCOPE Base field acceptance of hot mix asphalt (HMA) mixtures on asphalt
Asphalt Pavement Analyzer (APA) Evaluation
 Evaluation") 2003-02 Final Report Asphalt Pavement Analyzer (APA) Evaluation Technical Report Documentation Page 1. Report No. 2. 3. Recipients Accession No. MN/RC 2003-02 4. Title and Subtitle 5. Report Date ASPHALT
2003-02 Final Report Asphalt Pavement Analyzer (APA) Evaluation Technical Report Documentation Page 1. Report No. 2. 3. Recipients Accession No. MN/RC 2003-02 4. Title and Subtitle 5. Report Date ASPHALT
U.S. Department Of Transportation
 U.S. Department Of Transportation Assessing Child Belt Fit, Volume II: Effect of Restraint Configuration, Booster Seat Designs, Seating Procedure, and Belt Fit on the Dynamic Response of the Hybrid III
PUBLISHED PROJECT REPORT PPR850. Optimisation of water flow depth for SCRIM. S Brittain, P Sanders and H Viner
 PUBLISHED PROJECT REPORT PPR850 Optimisation of water flow depth for SCRIM S Brittain, P Sanders and H Viner Report details Report prepared for: Project/customer reference: Copyright: Highways England,
Smart Water Application Technologies (SWAT)
") Smart Water Application Technologies (SWAT) Turf and Landscape Irrigation Equipment PRESSURE REGULATING SPRAY HEAD SPRINKLERS Equipment Functionality Test Testing Protocol Version 3.0 (May 2012) Developed
Smart Water Application Technologies (SWAT) Turf and Landscape Irrigation Equipment PRESSURE REGULATING SPRAY HEAD SPRINKLERS Equipment Functionality Test Testing Protocol Version 3.0 (May 2012) Developed
USEFUL RELATIONSHIPS
 Use the chart below for the homework problems in this section. USEFUL RELATIONSHIPS U.S. Customary 12 in. = 1 ft 3 ft = 1 yd 280 ft = 1 mi 16 oz = 1 lb 2000 lbs = 1 T 8 fl oz = 1 c 2 c = 1 pt 2 pts = 1
TRUCKS INVOLVED IN FATAL ACCIDENTS FACTBOOK 2007
 TRUCKS INVOLVED IN FATAL ACCIDENTS FACTBOOK 2007 BKGRD: PMS 4665 728 TRUCK: PMS 732 7519 Center Center for for National Truck and Bus Statistics University of of Michigan Transportation Research Institute
Missouri University of Science & Technology. MoDOT TENSILE STRENGTH RATIO (TSR) TRAINING/CERTIFICATION COURSE
 TRAINING/CERTIFICATION COURSE") Missouri University of Science & Technology Department of Civil, Architectural, and Environmental Engineering MoDOT TENSILE STRENGTH RATIO (TSR) TRAINING/CERTIFICATION COURSE 9-20-06 1-29-07 11-18-09 11-10-10
Missouri University of Science & Technology Department of Civil, Architectural, and Environmental Engineering MoDOT TENSILE STRENGTH RATIO (TSR) TRAINING/CERTIFICATION COURSE 9-20-06 1-29-07 11-18-09 11-10-10
SPECIFIC GRAVITY AND ABSORPTION OF AGGREGATE BY VOLUMETRIC IMMERSION METHOD
 Standard Method of Test for Volumetric Absorption & Specific Gravity Test Procedure SPECIFIC GRAVITY AND ABSORPTION OF AGGREGATE BY VOLUMETRIC IMMERSION METHOD AASHTO TP XXXX 1. SCOPE 1.1. This method
Jan 10, 2002 LAB MANUAL
 Jan 10, 2002 LAB MANUAL 1810.0 1810 BULK SPECIFIC GRAVITY (GMB), DENSITY AND PERCENT ABSORBED WATER OF COMPACTED BITUMINOUS SPECIMENS AASHTO Designation T 166 (MN/DOT Modified) 1810.1 SCOPE This test method
Florida Method of Test for MEASUREMENT OF WATER PERMEABILITY OF COMPACTED ASPHALT PAVING MIXTURES
 Florida Method of Test for MEASUREMENT OF WATER PERMEABILITY OF COMPACTED ASPHALT PAVING MIXTURES 1. SCOPE Designation: FM 5-565 1.1 This test method covers the laboratory determination of the water conductivity
USE OF NARROW LANES AND NARROW SHOULDERS ON FREEWAYS: A Primer on Experiences, Current Practice, and Implementation Considerations
 PRACTICAL DESIGN FOR OPERATIONS USE OF NARROW LANES AND NARROW SHOULDERS ON FREEWAYS: A Primer on Experiences, Current Practice, and Implementation Considerations Notice This document is disseminated under
OHD L-44 METHOD OF TEST FOR MEASUREMENT OF WATER PERMEABILITY OF COMPACTED PAVING MIXTURES
 Page 1 of 7 METHOD OF TEST FOR MEASUREMENT OF WATER PERMEABILITY OF COMPACTED PAVING MIXTURES 1. SCOPE A. This test method covers the laboratory determination of the water conductivity of a compacted asphalt
TRUCKS INVOLVED IN FATAL ACCIDENTS FACTBOOK 2002
 TRUCKS INVOLVED IN FATAL ACCIDENTS FACTBOOK 2002 Center for National Truck and Bus Statistics University of Michigan Transportation Research Institute 2901 Baxter Road Ann Arbor, Michigan 48109-2150 UMTRI
TRUCKS INVOLVED IN FATAL ACCIDENTS FACTBOOK 2000
 TRUCKS INVOLVED IN FATAL ACCIDENTS FACTBOOK 2000 Center for National Truck Statistics University of Michigan Transportation Research Institute 2901 Baxter Road Ann Arbor, Michigan 48109-2150 UMTRI 2003-20
SUPPORTING NOTES FOR THE EVALUATION OF UNBOUND ROAD BASE AND SUB-BASE AGGREGATES
 SUPPORTING NOTES FOR THE EVALUATION OF UNBOUND ROAD BASE AND SUB-BASE AGGREGATES (These notes are guidelines only and must not be included in the Contract Documents). 1. SCOPE These Notes are guidelines
Ti-Pure TITANIUM DIOXIDE DETERMINATION OF OIL ABSORPTION (OA) METHOD: T WP
 METHOD: T WP") Ti-Pure TITANIUM DIOXIDE DETERMINATION OF OIL ABSORPTION (OA) METHOD: T4400.010.06.WP 1 TITANIUM DIOXIDE (Ti-Pure ) Determination of Oil Absorption I. Principle The oil absorption of a sample of titanium
Ti-Pure TITANIUM DIOXIDE DETERMINATION OF OIL ABSORPTION (OA) METHOD: T4400.010.06.WP 1 TITANIUM DIOXIDE (Ti-Pure ) Determination of Oil Absorption I. Principle The oil absorption of a sample of titanium
BALANCED MIX DESIGN APPROACH. Robert Lee, P.E. Flexible Pavements Director
 BALANCED MIX DESIGN APPROACH Robert Lee, P.E. Flexible Pavements Director TxAPA Annual Meeting - 2016 Initial Thoughts Dry mixes are prevalent in our industry. Lowering N-design and raising lab molded
Inspection and Acceptance of Asphalt Mix Design Laboratories
 Supplemental Technical Specification for Inspection and Acceptance of Asphalt Mix Design Laboratories SCDOT Designation: SC-M-405 (05/1/14) 1. SCOPE 1.1 This specification covers the process for inspection
Project Update: Characterization of Alaskan Hot-Mix Asphalt containing RAP
 Project Update: Characterization of Alaskan Hot-Mix Asphalt containing RAP Jenny Liu, Sheng Zhao and Beaux Kemp 06/25/15 Outline Introduction Problem Statement Background Objectives Recycled Asphalt Pavement
Lesson 12.1 Skills Practice
 Lesson 12.1 Skills Practice Name Date Customary to Whom? Customary Measurement Vocabulary Match each definition to its corresponding term. 1. to change a measurement to an equivalent measurement in different
Examining the Speed-Flow-Delay Paradox in the Washington, DC Region:
 Examining the Speed-Flow-Delay Paradox in the Washington, DC Region: Potential Impacts of Reduced Traffic on Congestion Delay and Potential for Reductions in Discretionary Travel during Peak Periods Final
In Place Density Determination of Asphalt Concrete by the Coring Method
 In Place Density Determination of Asphalt Concrete by the Coring Method 1. Scope: This procedure is for determining the density of in place asphalt concrete pavement. 2. Apparatus: 2.1 Scale or balance
OHD L-44 METHOD OF TEST FOR MEASUREMENT OF WATER PERMEABILITY OF COMPACTED PAVING MIXTURES
 Page 1 of 6 METHOD OF TEST FOR MEASUREMENT OF WATER PERMEABILITY OF COMPACTED PAVING MIXTURES 1. SCOPE A. This test method covers the laboratory determination of the water conductivity of a compacted asphalt
Procedia Engineering Procedia Engineering 2 (2010)
") Available online at www.sciencedirect.com Procedia Engineering Procedia Engineering 2 (2010) 002681 2686 (2009) 000 000 Procedia Engineering www.elsevier.com/locate/procedia 8 th Conference of the International
Available online at www.sciencedirect.com Procedia Engineering Procedia Engineering 2 (2010) 002681 2686 (2009) 000 000 Procedia Engineering www.elsevier.com/locate/procedia 8 th Conference of the International
FINAL REPORT INVESTIGATION OF TEST METHODS, PAVEMENTS, AND LABORATORY DESIGN RELATED TO ASPHALT PERMEABILITY
 FINAL REPORT INVESTIGATION OF TEST METHODS, PAVEMENTS, AND LABORATORY DESIGN RELATED TO ASPHALT PERMEABILITY G. W. Maupin, Jr. Principal Research Scientist (The opinions, findings, and conclusions expressed
BUSES INVOLVED IN FATAL ACCIDENTS FACTBOOK 2003
 3 UMTRI 2008-2 BUSES INVOLVED IN FATAL ACCIDENTS FACTBOOK 2003 Linda Jarossi Anne Matteson John Woodrooffe January 2008 Center for National Truck and Bus Statistics The University of Michigan Transportation
ISO INTERNATIONAL STANDARD. Hydraulic fluid power Filter elements Determination of resistance to flow fatigue using high viscosity fluid
 INTERNATIONAL STANDARD ISO 23181 First edition 2007-08-15 Hydraulic fluid power Filter elements Determination of resistance to flow fatigue using high viscosity fluid Transmissions hydrauliques Éléments
Aug 17, 2001 LAB MANUAL MAXIMUM SPECIFIC GRAVITY (RICE VOIDS TEST) OF PAVING MIXTURES AASHTO Designation T 209 (Mn/DOT Modified))
 OF PAVING MIXTURES AASHTO Designation T 209 (Mn/DOT Modified))") Aug 17, 2001 LAB MANUAL 1807.0 1807 MAXIMUM SPECIFIC GRAVITY (RICE VOIDS TEST) OF PAVING MIXTURES AASHTO Designation T 209 (Mn/DOT Modified)) 1807.1 SCOPE This test method covers the determination of the
Aug 17, 2001 LAB MANUAL 1807.0 1807 MAXIMUM SPECIFIC GRAVITY (RICE VOIDS TEST) OF PAVING MIXTURES AASHTO Designation T 209 (Mn/DOT Modified)) 1807.1 SCOPE This test method covers the determination of the
SIZING THE EXTROL DIAPHRAGM-TYPE HYDRO-PNEUMATIC TANK
 SIZING THE EXTROL DIAPHRAGM-TYPE HYDRO-PNEUMATIC TANK 1400 Division Road, West Warwick, RI 02893 T: 401.884.6300 F: 401.885.2567 www.amtrol.com Sizing the ExTrol Diaphragm-Type Hydro-Pneumatic Tank For
Tex-207-F, Determining Density of Compacted Bituminous Mixtures
 Overview Effective date: August 1999 to October 2004. Use this method to determine the bulk specific gravity of specimens of compacted bituminous mixtures. Use the bulk specific gravity of the compacted
IDAHO TRANSPORTATION DEPARTMENT
 RESEARCH REPORT IDAHO TRANSPORTATION DEPARTMENT RP 242 Measures to Alleviate Congestion at Rural Intersections Case Study: Intersection of State Highway 55, Banks-Lowman Road, and Banks-Grade Way By Michael
Safety Assessment of Installing Traffic Signals at High-Speed Expressway Intersections
 Safety Assessment of Installing Traffic Signals at High-Speed Expressway Intersections Todd Knox Center for Transportation Research and Education Iowa State University 2901 South Loop Drive, Suite 3100
c) How much will Carrie pay for flooring her room that is 16ft by 20ft if flooring costs $12.95 / square yd? Area of room: 16 20
 How much will Carrie pay for flooring her room that is 16ft by 20ft if flooring costs $12.95 / square yd? Area of room: 16 20") Course: MFM2P Gr. 10 Applied Lesson: 1-2 Unit: Measurement Systems and Similar Triangles Topic: Measure homework check: Lesson 1-1 note: Measure The metric system is Canada s official measurement system
Course: MFM2P Gr. 10 Applied Lesson: 1-2 Unit: Measurement Systems and Similar Triangles Topic: Measure homework check: Lesson 1-1 note: Measure The metric system is Canada s official measurement system
Apr 16, 2010 LAB MANUAL 1810
 Apr 16, 2010 LAB MANUAL 1810 1810 BULK SPECIFIC GRAVITY (GMB), DENSITY AND PERCENT ABSORBED WATER OF COMPACTED BITUMINOUS SPECIMENS AASHTO Designation T 166 (MN/DOT Modified) 1810.1 SCOPE This test method
TXDOT DESIGNATION: TEX-922-K
 Test Procedure for CALIBRATING ASPHALT DISTRIBUTION EQUIPMENT Texas Department of Transportation TxDOT Designation: Tex-922-K Effective Date: May 2009 1. SCOPE 1.1 This three-part procedure is a method
UNIT PLAN. Grade Level: 3 Unit #: 4-2 Measurement: Length, Volume, Mass, & Equivalencies
 UNIT PLAN Grade Level: 3 Unit #: 4-2 Unit Name Measurement: Length, Volume, Mass, & Equivalencies Big Idea/Theme: Measurement is used to effectively communicate a common language of numerical information.
Tex-616-J, Construction Fabrics
 Contents: Section 1 Overview... Section s...3 Section 3 Archived Versions...10 Texas Department of Transportation 1 06/00 1/07 Section 1 Overview Effective dates: June 000 December 007. Section 1 Overview
Specific Accreditation Criteria Calibration ISO IEC Annex. Mass and related quantities
 Specific Accreditation Criteria Calibration ISO IEC 17025 Annex Mass and related quantities January 2018 Copyright National Association of Testing Authorities, Australia 2014 This publication is protected
BUSES INVOLVED IN FATAL ACCIDENTS FACTBOOK
 BUSES INVOLVED IN FATAL ACCIDENTS FACTBOOK 2001 2007 PMS 279 BUS PMS 5445 BKGRND Center for National Truck and Bus Statistics University of Michigan Transportation Research Institute 2901 Baxter Road Ann
INTERNATIONAL SLURRY SURFACING ASSOCIATION TECHNICAL BULLETIN. 800 Roosevelt Road, Building C-312, Glen Ellyn, IL 60137
 INTERNATIONAL SLURRY SURFACING ASSOCIATION TECHNICAL BULLETIN 800 Roosevelt Road, Building C-312, Glen Ellyn, IL 60137 No. 144 Revised 2013 Test Method for Classification of Slurry Surfacing Materials
SECTION 48 - TRAFFIC STRIPES AND PAVEMENT MARKINGS TABLE OF CONTENTS
 SECTION 48 - TRAFFIC STRIPES AND PAVEMENT MARKINGS TABLE OF CONTENTS Section Page 48-1 GENERAL...48.1 48-2 THERMOPLASTIC TRAFFIC STRIPES AND PAVEMENT MARKINGS...48.1 48-3 PAINTED TRAFFIC STRIPES AND PAVEMENT
HCMTCB ASPHALT CERTIFICATION KEY ELEMENTS LIST
 HCMTCB ASPHALT CERTIFICATION KEY ELEMENTS LIST Release Date: November 6, 2014 AASHTO T-168 Sampling of Bituminous Material Funnel Device 1 Select units to be sampled by what method? 2 Relative size and
Method of Test for Determining the Cutout Correction and In Place Density of Asphalt Concrete by the Nuclear Gauge Method
 Method of Test for Determining the Cutout Correction and In Place Density of Asphalt Concrete by the Nuclear Gauge Method 1. Scope: This test is for determining the in place density of asphalt concrete
Performance of Ultra-Thin Bounded Wearing Course (UTBWC) Surface Treatment on US-169 Princeton, Minnesota. Transportation Research
 Surface Treatment on US-169 Princeton, Minnesota. Transportation Research") 2007-18 Performance of Ultra-Thin Bounded Wearing Course (UTBWC) Surface Treatment on US-169 Princeton, Minnesota Take the steps... Research...Knowledge...Innovative Solutions! Transportation Research
2007-18 Performance of Ultra-Thin Bounded Wearing Course (UTBWC) Surface Treatment on US-169 Princeton, Minnesota Take the steps... Research...Knowledge...Innovative Solutions! Transportation Research
AMAP 15 th Annual Meeting February 18-20, Mike O Leary MWV RMAUPG
 AMAP 15 th Annual Meeting February 18-20, 2014 Mike O Leary MWV RMAUPG MSCR Progress and Direction from the Western US Rocky Mountain Asphalt UPG PG+ and MSCR History at RMAUPG Collaboration with UW-Madison,
Calibration and Validation of the Shell Fatigue Model Using AC10 and AC14 Dense Graded Hot Mix Asphalt Fatigue Laboratory Data
 Article Calibration and Validation of the Shell Fatigue Model Using AC10 and AC14 Dense Graded Hot Mix Asphalt Fatigue Laboratory Data Mofreh Saleh University of Canterbury, Private Bag 4800, Christchurch,
Standard Test Method for Elastic Properties of Elastomeric Yarns (CRE Type Tensile Testing Machines) 1
 1") Designation: D 2731 01 Standard Test Method for Elastic Properties of Elastomeric Yarns (CRE Type Tensile Testing Machines) 1 This standard is issued under the fixed designation D 2731; the number immediately
Designation: D 2731 01 Standard Test Method for Elastic Properties of Elastomeric Yarns (CRE Type Tensile Testing Machines) 1 This standard is issued under the fixed designation D 2731; the number immediately
ENHANCED PARKWAY STUDY: PHASE 2 CONTINUOUS FLOW INTERSECTIONS. Final Report
 Preparedby: ENHANCED PARKWAY STUDY: PHASE 2 CONTINUOUS FLOW INTERSECTIONS Final Report Prepared for Maricopa County Department of Transportation Prepared by TABLE OF CONTENTS Page EXECUTIVE SUMMARY ES-1
ASPHALT PLANT LEVEL 1
 ASPHALT PLANT LEVEL 1 Module 6: Maximum Specific Gravity FM 1 T 209 FDOT Course Release: 10, Module 6 1 Specification Year: January 2015 The terms Gmm or Maximum Specific Gravity or Rice gravity are often
Jenny Castillo Tammy Muller Brandi Stemple. Intro to Physical Science Fall 2010 Dianne Phillips
 Jenny Castillo Tammy Muller Brandi Stemple Intro to Physical Science Fall 2010 Dianne Phillips History of the English System The measurement system commonly used in the United States today is nearly the
Standard Test Methods for Water Permeability of Geotextiles by Permittivity 1
 Designation: D 4491 99a Standard Test Methods for Water Permeability of Geotextiles by Permittivity 1 This standard is issued under the fixed designation D 4491; the number immediately following the designation
County of Sacramento Standard Construction Specifications January 1, 2008 TECHNICAL PROVISIONS
 County of Sacramento Standard Construction Specifications January 1, 2008 TECHNICAL PROVISIONS SECTION 48 TRAFFIC STRIPES AND PAVEMENT MARKINGS 48-1 GENERAL Traffic stripes and pavement markings shall
IAPMO IS PUBLIC REVIEW DRAFT Thrust Blocking for Rubber Gasketed and Solvent Cement Joints
 IAPMO IS 33-2019 PUBLIC REVIEW DRAFT Thrust Blocking for Rubber Gasketed and Solvent Cement Joints IAPMO Standard IAPMO IS 33 2019 Published: Month Year Published by International Association of Plumbing
Standard Test Methods for Density of Soil and Soil-Aggregate in Place by Nuclear Methods (Shallow Depth) 1
 1") This document is not an ASTM standard and is intended only to provide the user of an ASTM standard an indication of what changes have been made to the previous version. Because it may not be technically
This document is not an ASTM standard and is intended only to provide the user of an ASTM standard an indication of what changes have been made to the previous version. Because it may not be technically
TRAFFIC STUDY GUIDELINES Clarksville Street Department
 TRAFFIC STUDY GUIDELINES Clarksville Street Department 9/1/2009 Introduction Traffic studies are used to help the city determine potential impacts to the operation of the surrounding roadway network. Two
Predicted Dispense Volume vs. Gravimetric Measurement for the MICROLAB 600. November 2010
 Predicted Dispense Volume vs. Gravimetric Measurement for the MICROLAB 600 November 2010 Table of Contents ``Abstract...3 ``Introduction...4 ``Methods & Results...6 ``Data Analysis...9 ``Conclusion...12
TEST FOR STABILOMETER VALUE OF BITUMINOUS MIXTURES
 Test Procedure for TEST FOR STABILOMETER VALUE OF BITUMINOUS MIXTURES TxDOT Designation: Tex-208-F Effective Date: February 2005 1. SCOPE 1.1 Use this test method to determine the Hveem stability value
INTEGRITY MANAGEMENT OF STRESS CORROSION CRACKING IN GAS PIPELINE HIGH CONSEQUENCE AREAS
 Designator: Meta Bold 24/26 Revision Note: Meta Black 14/16 INTEGRITY MANAGEMENT OF STRESS CORROSION CRACKING IN GAS PIPELINE HIGH CONSEQUENCE AREAS Date of Issuance: October 31, 2008 This report was prepared