Falmouth Bay to St Austell Bay pspa... 4 Ecology of the species of interest... 5 Bycatch monitoring... 5
|
|
|
- Millicent Bates
- 5 years ago
- Views:
Transcription


1

2
3 This report analyses three years monitoring data of fishing in the Falmouth to St Austell pspa, with monitoring data collected by boat-based transects by the Cornwall Inshore Fisheries and Conservation Authority (CIFCA). We examine the net haul data for incidents of birds being caught as bycatch, in particular the interest features of the pspa: Great Northern Diver Gavia immer, Black-throated Diver Gavia arctica and Slavonian Grebe Podiceps auritus. We use the monitoring data to determine whether bycatch incidence relates to particular fishing practices, geographic factors or weather conditions. Eleven incidents of bycatch were recorded, involving 22 individual birds. Some 12% of the net hauls observed had some bycatch. A number of different species of bird were caught and included one of the species associated with the pspa (Great Northern Divers). Relatively few incidents however did involve Great Northern Divers: four net hauls (involving five individuals birds), therefore the potential for detailed analysis of factors that might influence bycatch incidence is limited. The Great Northern Divers were all caught in a limited geographic area and in a single year, within a short time window. Although the analysis has limitations, the results suggest the following factors as potentially significant predictors of bycatch incidence (for Great Northern Divers): Distance to coast (netting incidents closer to the coast e.g. <260 metres from shore) Mesh size of nets used (in particular and mm nets) Water depth (shallow water depths, e.g. <12 metres deep) Degree of enclosure by land (locations with land around e.g. bays) Many of these factors are interlinked, for example water depth and distance to coast. However, the potential for multivariate analysis was limited by the sample size and large number of possible factors. Other factors which appear to be potentially important, but for which we have limited confidence included: poor weather conditions (particularly air visibility), target fish species, and tidal current energy. With further data on incidents these factors might be tested with more confidence. A number of other species were also recorded as bycatch. These species were Guillemot, Shag and Cormorant. These species have different ecologies from each other and particularly from Great Northern Divers and therefore factors influencing bycatch of birds more generally were less apparent. The incidence of any bird bycatch seemed to be particularly associated with target fish species (coarse groupings) and the area of the pspa (particularly Falmouth Bay). Given the small sample size of bycatch incidents, only limited analysis is possible and caution is necessary with the interpretation of these tests and their results. We have applied conservative tests where possible and discussed some of the robustness of statistical tests. We also discuss the limitations of the overall conclusions.
4 Falmouth Bay to St Austell Bay pspa... 4 Ecology of the species of interest... 5 Bycatch monitoring... 5 Vessel observations and net haul observations... 7 Additional metrics... 8 Weather per transect Temporal variation Net characteristics: Mesh size Net characteristics: Target fish species Net characteristics: Soak times Geographical metrics Meta-analysis... 35
5 This report was commissioned by Natural England and we are grateful to Carolyn Waddell (Natural England) for overseeing the work and Colin Trundle (Cornwall Inshore Fisheries & Conservation Authority) for assistance with the provided data and GIS. Cover image of Great Northern Diver by Mike Baird sourced via Wikimedia Commons.
6 A recent vulnerability assessment conducted by Natural England has identified concerns for Falmouth Bay to St Austell Bay potential SPA (pspa), where birds are accidentally killed as bycatch during standard fishing operations. Concerns relate to the important populations of particular divers and grebes which spend the winter within the pspa. Direct mortality of divers and grebes can result from entanglement in deployed fishing equipment, and monitoring has therefore been established. Surveys have been conducted to enable a better understanding of netting activity within the pspa through the observation of net hauls, recording incidents of bycatch and other metrics. Data has been collated as a partnership between Natural England and Cornwall Inshore Fisheries and Conservation Authority (CIFCA). This report provides a presentation and analysis of these data to determine the factors affecting incidents of bird bycatch. Results of analysis will be used by Natural England and partners to inform management of fisheries, ensuring impacts on important bird populations are kept to a minimum. Falmouth Bay to St Austell Bay pspa The Falmouth Bay to St Austell Bay pspa is located off the Cornwall coast and covers the area below mean high water extending out to sea approximately to the 49 metre seabed depth contour (up to a maximum of 13 km from land). The coastline included extends between Nare Point and east of Gribbin Head, a total just under 30,000 hectares. The pspa covers marine and estuarine habitat including several individual bays and estuaries. The area is a key wintering area in England for Great Northern Divers Gavia immer, Black-throated Divers Gavia arctica and Slavonian Grebes Podiceps auritus, with these three species the qualifying species of the pspa. Bird surveys have highlighted the importance of the area for grebes and divers and provide detail on the behavioural ecology and distribution of the species within the local context (Liley et al. 2014). Black-
7 throated Divers are of particular importance, with an estimated 115 individuals, which account for 20.5% of the population in Great Britain 1. Ecology of the species of interest The three species of interest all feed in coastal waters and dive for food but they do vary in choice of habitat and prey. The smallest species, the Slavonian Grebe, tends to feed on smaller prey (small fish, and invertebrates, crustaceans, molluscs, worms) particularly in more sheltered bays and estuaries (Evans 2000). Great Northern and Black-throated divers take some larger prey and are more likely to occur some distance off shore. There can be tendencies for aggregations in shallow water (< 30 m, see Skov et al. 1995) and shore-based observations of the species in the pspa suggested sheltered bays with very shallow water were important (<15 m (Liley et al. 2014)). However, the larger divers can occur some distance from shore in deep water beyond the bounds of the pspa (> 60 m water depth, see JNCC aerial surveys shown in Appendices, Map 8). Liley et al. recorded maximum counts (across multiple vantage points within the pspa combined) in a single survey visit of 82 Black-throated Divers, 63 Great Northern Divers and 10 Slavonian Grebes. Great Northern Divers tended to be scattered and relatively evenly distributed favouring relatively sheltered areas. They were mostly recorded as lone individuals and tended to be closer inshore than Black-throated Divers. Models suggested a change in distribution around high tide. Black-throated Divers by contrast were concentrated in particular areas, all sheltered bays with a south-easterly aspect. Many sightings involved small flocks. Black-throated Divers tended to feed slightly further out than Great Northern Divers, and observations suggested Great Northern Divers were feeding on the seabed and prey included crabs, while Black-throated Divers were thought to be primarily pursuit fishing. Bycatch monitoring Bird mortality in fishing gear is a global conservation issue and it is recognised that bycatch in industrial longline, trawl fisheries and gillnets poses a threat for several seabird species (Lewison et al. 2004; Davies et al. 2009; Zydelis et al. 2009). Bycatch is usually defined as the incidental take of undesirable size or age classes of the target species (e.g. juveniles or large females), or the incidental take of other non-target species (Lewison et al. 2004). In terms of seabirds in UK waters bycatch simply refers 1 Natural England Falmouth Bay to St Austell Bay pspa Citation.
8 to any individuals which are caught, and almost always killed, in fishing gear of any description. Monitoring of bird bycatch in the Falmouth-St. Austell pspa was established in 2013, with boat transects undertaken by CIFCA staff and net hauls observed. A report considered the first year s results (Cruickshanks & Liley 2014), however the small number of observations meant that there were limited conclusions. Of the 20 net observations considered in that report, four involved bycatch of birds. None of these were of species which were interest features of the pspa. There were no significant relationships observed between bird bycatch incidents and factors collected on net types, distance from shore, water depth etc. Recommendations for the continued monitoring methodology were made and for there to be future analysis when a greater number of observations had been made. Monitoring then continued and this report considers the results collected after three years of monitoring.
9 Data from boat transects was provided from NE and Cornwall IFCA staff. Between 2013 and 2016 a total of 28 survey transects were conducted (see Appendix 1 for a list of dates and years). Boat transects involved searching from a survey vessel to observe vessels within the pspa and document net hauls. The pspa was split into five areas as shown in Map 1. Each survey transect was recorded using a GPS. Weather conditions on the day for each survey were recorded, although the exact information differed between years, such as the inclusion of tides states or temperature. Anecdotally, most gill net hauls are conducted at first light and therefore surveys were mostly started around this time of day to increase the chance of observing net hauls. Generally, the survey vessel followed close to the shore during the outbound track and a more offshore route on the return leg. This was because gill nets are mostly set in the inshore area, and as mentioned above these are generally hauled at first light, therefore the inshore area was surveyed first. When a fishing vessel was observed during the surveying the track was deviated so that the vessel could be identified, its activity noted and a GPS position for the vessel calculated and logged. Vessels were recorded if they were conducting any kind of fishing activity and whether travelling or stationary. If the observed vessel was netting, the survey vessel remained alongside to observe the haul and note details of the catch. When bycatch included any mortalities of pspa species the individuals were retained by IFCA officers for a post-mortem. For full methodology of the boat transects see the annual reports (Street & Trundle 2014, 2015), and the marine atlas (Pikesley et al. 2016). Basic information was recorded about all vessels sighted, and more detailed information on those observed to be hauling nets. Additionally a range of metrics were supplemented afterwards (e.g. GIS and weather). Vessel observations and net haul observations For every vessel observed, the following basic information was recorded: Vessel name and registration; Time of observation; Activity; and Position (co-ordinates to allow location to be plotted in GIS).
10 For those observed to be netting, and therefore with potential for there to be a bird bycatch, more detailed information was obtained from closer observation and communication with the vessel. In these cases, records detailed a number of factors, although it is important to note that some data gaps occur where could not be obtained (e.g. target species, soak time). The recorded information is as follows: Whether the whole net haul or just part of the net haul was observed; Start time; Start position and end position of the net haul; Target fish species; Mesh size of nets; Soak time of nets; Overall net length; Water depth; Estimated weight of target species; Number of nets hauled/to be hauled that day; and the Presence of any bird species caught in nets, number of individuals and species. Additional metrics Throughout analysis we refer to each of these observed vessels which were hauling nets as a net haul. However, it should be noted that these can consist of a fleet of nets, with the number of nets varying and the overall length of nets varying depending on how the nets are strung. As such a net haul is not a standardised unit. Some of these raw measurements were reclassified for easier analysis. Individual mesh size measurements for nets were categorised according to EU standard classes (10-30 mm, mm, mm, mm, mm, 220 mm). The soak times (length of time nets had been in the water) were also grouped into categories, as the raw data was variable with either an exact duration in hours given or broad times (e.g. overnight ) given. Information on the weather for the survey day was recorded, however this was incomplete for some years. We therefore supplemented weather data with further information obtained from a weather station at Culdrose, the nearest airport weather station 2. This provided temperature, precipitation, visibility, wind speed and wind direction. This was sourced for the survey day and also for the day prior to survey; 2
11 therefore covering conditions when nets were set out if they were known to have been left from the previous day. Additional metrics in GIS were calculated for all vessel observations. Some utilised existing geographical information provided by NE and IFCA, from the pspa Marine Atlas (Pikesley et al. 2016). These included information such as wave energy, depth, temperature and substrate. See appendix for full list of the metrics sourced from this database. Other metrics were calculated using basic GIS data. These included distances from the vessel coordinates to the shore and we also attempted to express how sheltered or enclosed the given coordinates were. The degree of enclosure we calculated in two different ways. One approach calculated the length of shoreline within a set radius (500 m and 1 km). The second approach summed the number of compass points (N, NE, E, SE, S, SW, W, and NW) at set distances (1 and 2 km) which were located on land. A full list of metrics is provided in Appendix 2. We examined individual factors using two main methods. Firstly we considered the proportion of bycatch incidents in the net hauls per survey transect and secondly the presence/absence of bycatch in individual net hauls. Weather has been analysed on the basis of the proportion of bycatch for each survey transect and all other metrics on the basis of individual net hauls. Analysis has only examined those observations where net the haul was recorded (91 net hauls). Analysis often considers all bird species to provide more data than would otherwise be available if considering only the bycatch of pspa species. These other non pspa species can be quite different in their ecology. However including all bird species in analysis can help to provide an indication of the important factors influencing bird bycatch generally. It should be noted we have referred to incidents as a net haul of one or more bird caught. Net hauls with birds of any species caught are referenced to as bird incidents, and we have separately referred to catches of pspa target species (of which have only been Great Northern Divers) as diver incidents.

12
13 Data were provided separately for each year and pooled into a single database for analysis. Survey vessel routes are summarised in Table 1, and show survey effort has not been even between years, with greater surveying in the winter of 2014/15. Across the three years survey effort was focussed in the period January to March. The earliest surveys were started was the 24 th November (year 3) and the latest was the 14 th March (year 1). The temporal spread of surveys was often influenced by the need for favourable weather conditions. Table 2 also summarises the routes and the areas of the pspa surveyed. The areas further to the north-east were surveyed less, with approximately half the number of boat transects directly passing through St Austell Bay compared to Falmouth Bay. The distribution of the surveying effort is also expressed in Map 2. This buffers survey transects by 1 km, the approximate distance at which a vessel can be identified, and maps the density of the buffered survey transects. This also shows the greater survey effort in Carrick Roads and around the mouth of the Fal estuary (e.g. Pendennis Point, Zone Point). The spatial spread is attributed to the nature of the surveying which involves actively targeting vessels. Both the spatial and temporal issues have been accepted throughout the process, and it is given that a degree of targeting occurs to areas where incidents are likely to occur. Table 1: Summary table of the temporal range of surveys in each year. 1 ( ) 2 ( ) 3 ( ) Total
14 Table 2: Summary details for the 28 transects completed in the three years of survey. 1 ( ) 2 ( ) 3 ( ) , Total 28 2,

15
16 In total, from the three years of data there were 306 vessel observations. These were plotted within the GIS and visually checked - any which were on land or clearly outside the area were examined further. These were judged to be simple miscalculations and adjusted to be in the correct area. This allowed all observations to be correctly georeferenced and plotted for analysis. The distribution of all vessels is shown in Map 3. Table 3 shows the range and number of activities observed and the number of net hauls recorded for each activity. Overall, 91 net hauls were observed. It is worth noting each net haul observed could consist of a number of nets, and the total length of net in each net haul could differ. As such the net hauls examined are not strictly a standardised unit (in total 44,564 m of nets were observed, with an average of 524 m of nets in each net haul ). An average of 3.25 net hauls per survey transect was recorded (maximum of nine net hauls in a single transect). 23 of the 28 transects included observations of one or more net hauls. Net hauls observed are shown in Maps 3 and 4. Table 3: The fishing activities of the 306 vessels observed, shown separately for those which were only observed and those for which net hauls were recorded. Angling Diving 3 3 Hand lining Netting Oyster dredging 2 2 Potting Ring netter 1 1 Scalloping Trawling 6 6 Wrasse Potting 3 3 Stationary 4 4 Steaming Unknown 2 2 Total
17 Overall bycatch of birds was recorded in 11 incidents (individual net hauls), amounting to a total of 22 individuals. This amounts to 12% of net hauls observed recording bycatch of one or more bird species. Bycatch of non pspa designated species included: year 1, seven Guillemots and two Cormorants; year 2, one Guillemot; and year 3, two Shag, two Guillemot, two Cormorants and one Cormorant/Shag. Bycatch of the pspa species was only recorded in year 3; with four incidents involving five individuals. All individuals were Great Northern Divers, with no bycatch incidents of Slavonian Grebe or Black-throated divers. Considering all 91 net hauls observed, 4% of net hauls included bycatch of Great Northern Divers. The distribution of incidents of bycatch in relation to all net hauls is shown in Map 4. Map 5 shows the same information, but shows only the dense cluster of observations around Falmouth.
18


19

20
21 In this section, we present more detailed analysis of the results, which are split into two sets of analyses; first we consider data per survey transect. In this case each transect is treated a unique observation, and each transect involved multiple net haul observations. Weather conditions, date and a range of other factors make sense looked at in this way, i.e. comparing between transects. Secondly we consider each net haul, each of which can vary in terms of specific location, mesh size etc. The incidence of bycatch was expressed as the proportion of net hauls observed with bycatch incidents. As such from the 28 transects, 23 observed at least one net haul and therefore a proportion could be calculated. For seven of the 23 transects the proportion was greater than zero, i.e. there was bycatch. Weather per transect The weather on the day of the survey was examined, using a number of recorded metrics. Wind direction was considered to be an important consideration. Figure 1a shows the number of transects conducted under the different wind directions. Surveys encompassed most wind directions. For comparison, the figure is repeated alongside with average proportions of bird bycatch incidents (Figure 1b). This shows that wind directions with higher proportions of bird bycatch incidents were particularly the north and the south west. In order to test for any significant association of bycatch incidents with wind direction we grouped wind direction according to the four main compass directions and used a chi squared goodness of fit test. This simplistic testing observed no significant difference between the proportions of net hauls and proportion of incidents (df=3, χ² = 7.433, p=0.059), suggesting that there were no significant differences based on four categories of wind direction, and therefore that no particular wind direction was influencing the bycatch. This is considered a rudimentary test of the data and the logistic regressions (Table 4) are considered more reliable. An alternative approach examined the raw wind direction in degrees. Directional statistics were used to account for the nature of circular measurements. A circularlinear regression was conducted to examine the relationship between angle of wind direction and proportion of bycatch incidents in each transect. This also showed no significant relationship between these variables (B= , SE=0.588, p=0.262).
 recorded for each wind direction (11 separate incidents).")

22 a b Figure 1: a) The number of survey transects in each wind direction (28 transects in total), plotted beside b) the average proportion of bird bycatch incidents in the net hauls observed (error bars show SE) recorded for each wind direction (11 separate incidents). Weather data also provided some categorical information on the events of the day s weather, for example whether there was any rain, fog, snow or hail. Figure 2a shows that many survey transects were conducted in conditions of rain or generally fine/cloudy conditions. However, the averaged proportions of bycatch events in these conditions was relatively low, compared to conditions such as fog (Figure 2b). Grouping weather conditions into fine days (no events), fog or fog and rain and rain or snow/hail provided a simplification for basic analysis. A chi-squared test goodness of fit conducted on the relative proportion of bird incidents in each of these three weather groups compared to the proportion of net hauls in each group was conducted. This suggested a significant difference, with a high level of confidence (>99%) between the proportion of net hauls and the proportion of bird bycatch incidents in the different weather conditions (df=2, χ² = , p<0.001). This was driven by a greater proportion of bird bycatch incidents in fog conditions. Again, the goodness of fit test are a simple way of testing the data presented in Figure 2; and the logistic regressions (Table 4) provide a more reliable test.
.")
.")
23 a b Figure 2: a) The number of survey transects in each weather event (28 transects in total), plotted beside b) the averaged proportion of bycatch incidents (1 or more birds present in a net haul) in the net hauls relative to the number of net hauls recorded for each weather event (11 separate incidents). The weather station data also provides visibility (air), measured as a distance in kilometres. These data show a slightly higher proportion of bycatch incidents in net hauls when visibility was low (Figure 3). However this relationship was not significant (logistic regression with binomial errors; z=-1.373, p=0.170). The sample size is however small when considering the data by transect (n=23), and in addition only 7 values are greater than 0 and the pseudo R² indicates a poor model fit (also shown by 95% confidence region, Figure 3). Furthermore this is likely to be heavily influenced by the two transects where visibility was poor, which had a reasonably high proportion of bycatch incidents.

24 Figure 3: The proportion of net hauls on each transect with bird bycatch incidents, plotted against the mean visibility recorded on the day of survey. Blue line indicates regression line, with grey shaded 95% confidence region. The weather metrics were tested individually as single factors in several binomial logistic regressions. These examined the relationship between the predictor variable and the presence of bycatch in each transect. The results of these tests are summarised in Table 4, which shows the pseudo R² (McFadden), AIC (Akaike Information Criterion) and p value. Comparison of the AIC is used to compare the quality of individual models and suggests mean visibility is the best variable in explaining the relationship. The p values indicate the relationship is significant, however the R² suggests relatively poor fit between visibility and bird bycatch. Multiple tests are potentially spurious, due to the effect of repeated statistical testing. As such we conducted a test of multiple comparisons (Benjamini Hochberg and Bonferroni procedures) to provide adjusted p values. All resulting p values were not significant, suggesting little confidence in the observed regressions in Table 4 and therefore no detectable effect of weather on bycatch incidence by transect.
25 Table 4: The results of a series of simple logistic regressions conducted on the presence of birds in bycatch for each weather factor. The pseudo R² (McFadden), AIC (Akaike Information Criterion) and p value for each model is given to provide information on the goodness of fit, relative quality of models and significant of the variable in each single variable model. The list of models is sorted by the AIC. Mean Visibility (km) Continuous Precipitation (mm) Continuous Wind Direction (degrees) Continuous Mean Wind Speed (km/h) Continuous Mean Temperature (C) Continuous Wind Direction Categorical (8 directions) Weather Events Categorical (6 groups) Poor weather conditions can cause nets to be left out for longer periods than they would otherwise have been in good weather. Therefore some net hauls observed have long soak times, and had been set out the day before or earlier still. As such we examined the weather conditions on the day before as an explanatory factor for incident of bycatch. For all weather metrics, models which used the previous day s weather metric were less reliable than those based on the current day s weather. Temporal variation Most incidents of bird bycatch were in January (7 incidents, 64%), furthermore all incidents of diver bycatch were recorded in January. However most net hauls were also recorded in this month (35 net hauls, 38%). A simplistic comparison between January and all other months combined on the number of diver bycatch incidents compared to the number of net hauls concluded this was not significant (Barnard s test, Wald=2.448, p=0.058).
 or diver bycatch (right) were present in net hauls.")


.")


26 Figure 4: The number of net hauls per month, with net hauls categorised by whether incidents of all bird bycatch (left) or diver bycatch (right) were present in net hauls. Net characteristics: Mesh size A range of factors relating to the vessel s fishing practice were tested as predictors of bycatch. The number of incidents of bycatch for grouped mesh sizes are shown in Table 5 and graphically in Figure 5. Of the eleven incidents of bird bycatch approximately half were in the mm range (six out of eleven incidents). Of the four diver bycatch incidents, two were observed in mm nets and two in mm nets. No incidents of bycatch were recorded in the small net sizes (<70mm), despite a reasonable number of net hauls observed. Table 5: The number of incidents of diver species and other bird species bycatch, along with the number of net hauls for each mesh size observed. Note mesh sizes are banned/prohibited > N/A* Total *Single observation with net size not given.
 versus large ( 90mm) mesh for all bird incidents shows a clear difference, with no incidents of bycatch in the smaller mesh sizes.")
27 Figure 5: The number of net hauls for different mesh size classes observed. Statistical tests (e.g. chi-squared) could not be undertaken on the classes in Figure 5 due to the sample sizes involved. However simple comparison of small ( 70 mm) versus large ( 90mm) mesh for all bird incidents shows a clear difference, with no incidents of bycatch in the smaller mesh sizes. Statistical analysis suggested this difference is significant (df=1, χ²=6.38, p=0.012). Net characteristics: Target fish species To date, all observations of diver bycatch, where a target species was given, were targeting Bass. One of the four bycatch incidents did not give a target fish species. The ability to conduct any kind of statistical test is limited and caution is necessary before drawing firm conclusions given the limited sample size. Nonetheless, we used a simple 2x2 table of the number of net hauls targeting Bass versus other species and number of diver incidents in Bass versus other species for testing. This simplistic test on the net hauls and the presence of diver bycatch suggests a significant effect with a reasonable level of confidence (at 95% level) for those targeting Bass compared to other fish (Barnard s test, p=0.034). Considering all bird species, six of the observed net hauls were of those targeting Bass (54%), the remaining were those targeting Pollock (4 net hauls), Sole/spider crabs (2) and a single incident in which a target species was unknown. For all the net hauls observed those targeting Bass accounted for 21% (19) of the 91 net hauls. Again, any statistical tests on this are limited, however the simplistic tests suggest this was not significant (Barnard s test, p=0.058). Mesh size and choice of target species are likely to be strongly related, as suggested in Table 6.
28 Table 6: Summary of the number of net hauls observed for the difference mesh sizes, by target catch species. Note mesh sizes are banned/prohibited > N/A 1 1 Total Net characteristics: Soak times Soak time was also an important consideration, although this is again interrelated with factors of mesh size and target species (e.g. larger mesh nets generally left out longer). All four incidents of diver bycatch were observed when nets had been set the day/evening before and left overnight. This was estimated to be a soak time of around 15 hours (Table 7). Table 7 shows the soak times categorised by their estimated duration in hours. From this, it would appear the hour soak times are the most important, with all incidents of diver bycatch and eight of the eleven bird incidents. From Table 7, net hauls which had been soaking for over 15 hours appear to be likely to include bycatch of diver species and birds more generally. Simplistic analysis of net hauls after grouping into two classes, more than or less than 15 hours, showed no difference in number of net hauls compared to number of bird bycatch incidents in each class (Barnard s test, p=0.117) or diver bycatch (p=0.054) Table 7: Net hauls and bycatch incidents categorised by the estimated soak time, shown in hours > Unknown Total
29 Soak times were also categorised by the amount of the preceding days or nights the nets had been in the water for, rather than simply the number of hours. From the haul times and soak hours we could examine the length of days and nights nets had been left out. Table 8 categorises the net hauls by soak time, with nets categorised as to the length of day or night. From Table 8 all diver bycatch incidents involved nets which had set out in the night before, and therefore we would assume all bycatch was in the daylight of the early hours of the morning, before the net was hauled. Incidents of all bird bycatch fall into a slightly wider range of categories, however most still occurred when nets were set the night before. This practice of setting nets the previous night was also the most common category. Considering nets which had been left to soak for multiple days and nights, 2 of the 5 hauls had bird bycatch. This is slightly under half (40%), compared roughly to a fifth of those set in the night before (19%). Table 8: Net hauls and bycatch incidents categorised by the estimated soak time, grouped based on the periods of the day in which nets were set. Set earlier that morning Set in the night before (e.g. in dark) Set the previous day (e.g. in the daylight) Set overnight Set many days and nights before Unknown Total It was also noted that there is usually a relationship between soak time and the mesh size of nets (see Table 9). Larger nets gear can be left out for several nights, whereas smaller mesh sizes are often left for only a single night. Ideally analysis would consider these interactions within a model, however this was not conducted due to the limited number of incidents recorded. Table 9: Cross tabulation of the net haul mesh sizes (mm) against soak time (hours) observed > Unknown Total
30 Geographical metrics All observed incidents of diver bycatch were observed in the Falmouth Bay area, and seven of the 11 incidents of all bird species bycatch were recorded in this area (64%). St Austell Bay was the only area with no incidents of bird bycatch recorded. We can account for survey effort by dividing the number of incidents by the number of net hauls observed. In the Falmouth Bay area, 24% of net hauls included bycatch (7 incidents out of 29 net hauls, see Table 10); this was a similar level to in the Veryan Bay area, 25% (but this was only 1 incident out of 4 net hauls). Table 10: Summary of the geographic areas of vessels and net hauls observed and bird bycatch incidents. All vessels observed Net hauls observed Bird bycatch incidents All incidents of diver bycatch occurred within 260 metres of the coastline, whereas only 18% of all net hauls (16 hauls) were within this distance of the coast. Using the continuous variable of distance we were able to examine differences in average distances. The range of these distances are shown as boxplots in Figure 6. Mann Whitney U tests show significant differences between the distances for net hauls with and without divers present (w= 579.5, p=0.004), indicating that bycatch of divers is more likely closer to shore. However, this was not the case with all bird bycatch (w= 579.5, p=0.095). Incidents of bird bycatch were still recorded up to 5.9 km off shore, the second greatest distance of all net hauls observed.


31 Figure 6: Boxplot of the range of distances from the coast net hauls were observed and whether bird species were present or absent and whether diver bird species were present or absent. Unsurprisingly, a related pattern was observed for the metrics which aimed to examine how enclosed the locations were. The metric which summed the number of compass points on land around each net haul at a 2km radius indicated that all incidents of diver bycatch were all within well enclosed areas with four to five of the eight compass points on land. Observations of other bird bycatch included many similar enclosed areas, but also areas some distance offshore (0 compass points on land). Table 11: The total number of compass points on land around each net haul, those with incidents of diver or bird bycatch are examined separately. The compass points of N, NE, E, SE, S, SW, W, W, NW were used, and as such values are out of eight Total The length of shore in a 1km radius was also used to derive a metric for how enclosed/sheltered each net haul location was (included 0 values for those not within 1 km). Differences in the length of coastline within 1 km between those with and without
32 diver bycatch were tested. There was a statistically significant difference in the amount of coastline surrounding net hauls between those with and without divers present in bycatch (Mann Whitney U, W =53, p=0.012). However, there was no significant difference between net hauls with and without any bird species bycatch (W =312.5, p=0.099). This variable was also tested after removing those net hauls which were not within 1 km (n=45), to examine only those net hauls which were enclosed for a relationship on the degree of enclosure. These tests on both all bird species bycatch and only diver bycatch were not significant. Chartered water depth of observed net hauls was examined using a GIS layer for the area and ranged from -1 to -56 metres, see Map 6. While net hauls with any bird species of bycatch were slightly shallower (Figure 7) than the non-bycatch hauls, the differences were not significant (Mann Whitney U, W =317.5, p=0.137). Figure 7 also shows the range of depths of net hauls which recorded incidents of diver bycatch. As shown, these depths were clearly significantly shallower compared to those net hauls without diver bycatch (W =32.5, p=0.006). The deepest net haul with a diver bycatch was 6.9 metres. Water depth was also recorded from the survey vessel for net hauls. These measures were likely to be more reliable for the water depth at the time of hauling and the chartered water depth is a much coarser GIS dataset. However due to data gaps this was not used for the detailed analysis. These water depths indicated a maximum depth of 11.7 metres for an incident of diver bycatch. Figure 7: Boxplots to show the range of depths net hauls were recorded at, separately for all bird species bycatch (left) and diver bird species bycatch (right).

33 Tidal current energy (J) and overall wave energy (J) values were examined at the point locations for each net haul observed. Figure 8 shows range of tidal current energy values recorded for all net hauls and for the incidents of bird bycatch. This showed a broadly similar range of values, and therefore no significant difference (W =418.5, p=0.765, note some net hauls were without energy values, n=89). Energy values for diver bycatch however show much more marked differences (Figure 8, right) and as such a significant difference between values with and without diver bycatch was observed (W =293, p=0.015). Diver bycatch was recorded in an extremely small range of low tidal energy values, compared to all net hauls and all bird bycatch incidents which cover a much wider range of energy values. The tidal current energy values along with the distribution of net hauls and incidents are shown in Map 7. The effects of wave energy were not significant. Figure 8: Boxplots to show the range of tidal current energy values recorded for each net haul, with and without bycatch, shown for all bird species (left) and for only diver species (right). Data on the mean water temperature in winter and autumn across the area was also examined for each observation. The relationship between winter mean water temperature suggests bycatch was associated with warmer winter water, with the relationship bird bycatch being significant (W = 175, p = 0.005), but not significant for diver bycatch (W = 116.5, p = 0.321). Mean temperatures for autumn were examined and suggested bycatch was associated with colder autumn water temperatures. Relationships were significant for incidents of bird bycatch (W =534, p = 0.048), and comparatively more significant in the relationship with diver bycatch (W = 299.5, p = 0.007). However, these differences are suggested to be a result of the very slight differences in temperatures being examined. The winter values for net hauls ranged from
34 C, and autumn values range from C. As such the relationships reported, although significant, are not considered to be of importance. Other variables examined included seabed substrate and slope. All diver incidents of bycatch were recorded over the broad sand substrates types, rather than rock/biogenic reef types, however only four of the 91 net hauls were over rock/biogenic reef habitats. There were no indications of an effect of seabed slope for either all bird species bycatch (w=522.5, p=0.318) or for diver bycatch (w=238.5, p=0.215).
35

36
37 Meta-analysis Drawing on the results above, metrics that appeared to be potentially important were examined further. These were tested with binomial logistic regressions using the data for individual net hauls. Variables were tested as single factors in each run of a binomial logistic regression, testing the relationship between the variable and bird bycatch incidence (1 or 0). Results are summarised in Table 12. Each row summarises the model fit for the variable tested. Some variables (e.g. target species, soak time) were not recorded for all observations (see column n) and therefore these models are not strictly comparable. The AIC (Akaike Information Criterion) can be used to compare the relative quality of individual models. Significance of individual metrics in explaining presence or absence have been provided as both raw P values, and adjusted p values. Adjusted p values are derived from Bonferroni and Benjamini and Hochberg procedures and produced based on the full set of p values reported in each table to account for the many multiple comparisons. The Benjamini and Hochberg adjustment is considered more conservative and p values for the adjusted values generally show less significant interactions. From Table 12 we would conclude that the relationship between the presence of bird bycatch and area of the pspa is significant (64% of bycatch incidents in Falmouth Bay). This is the relationship we have most confidence in. The target species was also considered to be marginally significant, influenced by the net hauls which were targeting Bass and to a less degree other larger fish. For a similar reason the mesh sizes were all ranked highly in the list of metrics, however after adjustment of p values this was no longer considered significant.
38 Table 12: Model results of individual binomial logistic regressions testing different variables as predictors of all bird bycatch incidents (presence/absence in individual net hauls). Table sorted by AIC. Significant p values highlighted (*** <=0.001, **<=0.01, *<=0.05). Target species grouped pspa area Grouped mesh sizes Categorical (3 classes; large fish, Bass, small fish) Categorical (6 classes) Categorical (5 classes) ** 0.016* 0.033* <0.001*** 0.003** 0.003** * Length of shore in 1 km radius Soak time (daylight categories) Soak time (hours) Number of compass points on land in 2 km radius Continuous Categorical (5 classes) Categorical (5 classes) Categorical (6 classes) Water depth Continuous Tidal current energy Continuous Distance to coast Continuous Table 13 presents the same variables, which have been examined for their relationship with the presence/absence of diver species, rather than all bycatch. In these results it can be seen that incidence of diver bycatch was significantly more likely for net hauls that were close to the coast, in shallow water and in relatively enclosed and therefore likely sheltered locations. Mesh size and the closely-linked target fish species were also significant factors.
39 Table 13: Model results of individual binomial logistic regressions of each metric compared to diver bycatch incidents (presence/absence in individual net hauls). Table sorted by AIC. Significant p values highlighted (*** <=0.001, **<=0.01, *<=0.05). Target species grouped Categorical (3 classes; large fish, Bass, small fish) * 0.024* Distance to coast Continuous <0.001*** 0.006** 0.006** Grouped mesh sizes Categorical (5 classes) ** 0.010** 0.030* Water depth Continuous ** 0.008** 0.015* Number of compass points on land in 2 km radius Length of shore in 1 km radius Tidal current energy Soak time (daylight categories) pspa area Soak time (hours) Categorical (6 classes) ** 0.010** 0.039* Continuous ** 0.018* Continuous * 0.018* Categorical (5 classes) Categorical (6 classes) Categorical (5 classes)
40 Results of the post mortems from the five Great Northern Divers are summarised here in order that the report provides a complete record of the findings and data collected. The post mortems provide additional information on the bycatch incidence and were conducted by Vic Simpson (The Wildlife Veterinary Investigation Centre, Chacewater, Cornwall) on behalf of Natural England. All individual divers examined appeared in good health and were concluded to have died from drowning. Table 14: Summary of the post mortems for the five Great Northern Divers caught in bycatch. 6/1/ /1/ /1/ /1/ /1/ immature female (2.9 kg) adult male (5.2 kg). adult male (4.9 kg). [caught in same net as above individual] adult female (3.9 kg). Adult female (3.0 kg) Gizzard empty apart from small number of pieces of grit One partly digested fish [possibly juvenile grey or golden mullet] with very clear scale pattern in proventriculus and gizzard Partly digested fish in proventriculus possibly mullet (large scales) [tentatively identified as grey or golden mullet]. Gizzard full of small stones/fragments of shell, (possibly crab) and scales Upper oesophagus contained a few large fish spines. A single, partially digested, large fish [unidentified] plus small amount of grit and crab claws in were present in the oesophagus, proventriculus and gizzard Proventriculus and gizzard almost empty apart from very small crab claws and few stones.
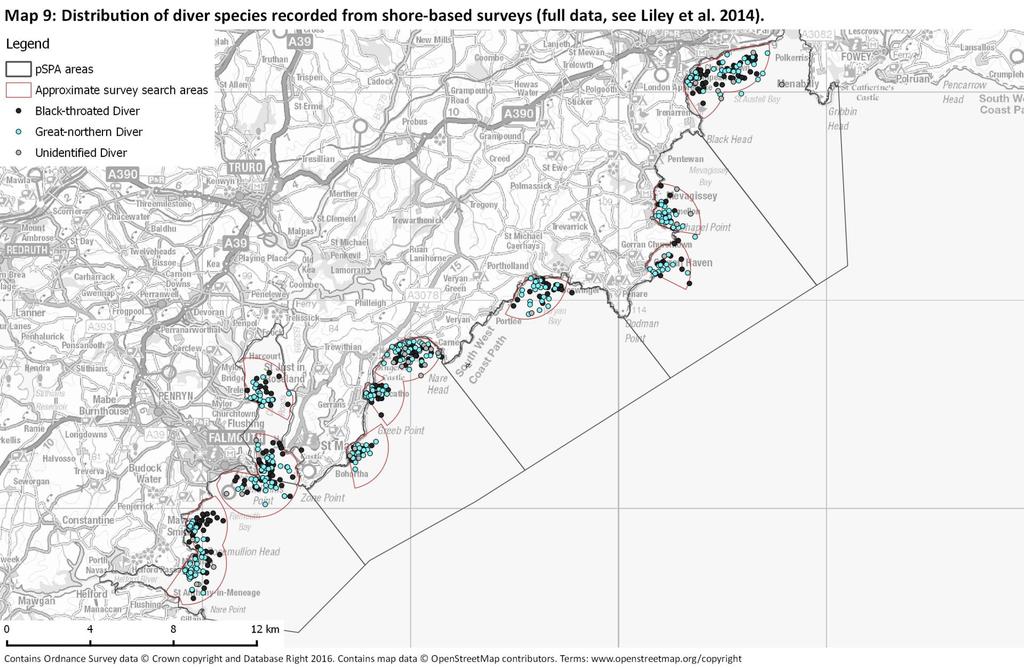
41 Overall, individuals recorded in bycatch were: ten Guillemots, four Cormorants, two Shag, one Cormorant/Shag and five Great Northern Divers. There were no incidents observed involving Black-throated Divers or Slavonian Grebes. It is suggested that 12% of netting incidents at this time of year are likely to result in bird bycatch and that 4% are involving Great Northern Divers. The results therefore confirm that at least one of the species for which the site qualifies as an SPA is potentially at risk from bycatch. The bycatch involving Great Northern Divers was recorded from a very limited area and limited time period. All incidents were recorded off Pennance point to Rosemullion Head. This area was not noted for either Great Northern or Black-throated Divers present in the JNCC aerial surveys (2007 and 2009), and was only noted for Great Northern Divers in the JNCC shore-based surveys (winter 2009/10 and 2010/1). Liley et al. (2014) however recorded large aggregations of birds in this area involving all three species of SPA interest: One of the particularly interesting findings is the occurrence of Black-throated Divers in large flocks. While these were not always feeding, some observations would suggest that the birds are flocking in response to their prey (rather than for example birds aggregating to roost) and also that Black-throated Divers are aggregating with other species. For example on the 11th February the surveyor (JW) noticed a gathering of birds between vantage point 2 (near Mawnan Smith) and vantage point 3 (Pendennis Point), and drove to a better vantage point to count the birds involved. There were over 300 birds, many intensively feeding in a mixed flock close inshore, between Gyllygvase Beach and the base of Pendennis Point (observed from SW819321). The flock included some 289 Shags, 1 Slavonian Grebe, 18 Black-throated Divers and 2 Great Northern Divers. Counts of up to 36 Black-throated Divers were reported by local bird watchers in the survey area during the survey period. Many of the observations of large groups of Black-throated Divers feeding appeared to involve birds diving and surfacing together, suggesting that the birds were feeding as a group. Maps 8 and 9 in Appendix 3 show the distribution of the diver species recorded during JNCC aerial surveys and shore-based surveys by Liley et al. (2014). The occurrence of these birds in tight feeding flocks means that birds are highly aggregated in space, meaning that bycatch is less likely to occur, but the risks of marked mortality when it does occur are greater. With Black-throated Divers occurring particularly in groups, it is possible that bycatch is rarer for this species (compared to Great Northern Divers which have a more scattered distribution), but the risks of impact are potentially greater. All the diver bycatch incidents were in January which also coincided with the month with the most transects. Any temporal effect may relate to a change in behaviour by the birds or may coincide with peak numbers of birds present. Great Northern and
42 Black-throated Divers are broadly present from October through to April, with April counts (for example of Great Northern Divers) potentially involving passage birds (Wernham et al. 2002). Liley et al (2014) only conducted surveys for the period February-March so it is difficult to determine when peak numbers of birds may be present. Comparing between dates, Liley et al (2014) recorded their highest counts of Black-throated Divers in early January while the peak for Great Northern Divers was in early March. A particular challenge with analysis of events that are relatively rare is that small sample sizes make robust analysis difficult. With a limited number of events observed, single incidents can have a strong influence on the results. Analysis is further complicated by variables that are not necessarily independent, for example more enclosed areas of water will be closer to the shore and hold shallower water; events that are targeting a fish species are likely to involve similar net sizes, soak times and be aggregated in time and space. Analysis which includes these interactions between multiple factors, could be conducted to account for these intercorrelated factors. However, these were not conducted due to the limitations of the small sample sizes. Table 15 summarises the significant relationships reported from statistical testing in this report. Weather was analysed for each survey undertaken, with the bycatch incidents expressed as a proportion of all net hauls observed in each survey. The only significant relationships were between visibility (air) and weather events. These both were suggesting on days with reduced visibility and on days categorised as foggy, that proportion of bird bycatch was greater. The mechanism by which this occurs is not obvious and the relationship could be spurious. Also it was noted that while the weather station used (at Culdrose) could record fog, the conditions could well be fair in the pspa. Analysis of the relationship was highly significant compared to other factors examined and it was thought to be an important area requiring more thought or analysis in the future. All other analysis was conducted on the basis of individual net hauls. From this we observed a number of significant relationships. The area of the pspa, mesh size and the target fish species all showed significant relationships with overall bird bycatch. Tests upon the incidents of pspa (great norther divers), showed some similar relationships. Individual tests showed the net hauls more likely to have diver bycatch were those where target fish species were Bass, there was a large amount of shoreline in a 1 km radius (therefore close to shore and often enclosed by land), and associated with locations with low tidal current energy. Other factors were significant from multiple single factor logistic regressions (including after adjusting for multiple comparisons). These were grouped mesh sizes, the number of compass points on land in 2 km radius, the distance to coast and chartered water
43 depth (with both distance to coast and depth, significant in individual tests and the logistic regressions). This shows the diver bycatch was more likely in locations close to shore, which are shallow and enclosed (e.g. bays) and when certain mesh sizes (often mm) are used. Overall, the relatively low incidence of bycatch of divers means firm conclusions are difficult. However, the bycatch of divers occurred in a limited geographic area and most if not all incidents were targeting Bass. Divers were caught as bycatch in nets set in relatively shallow water in enclosed areas and close to the shore. There was some indication of an effect of weather, with foggy/poor visibility associated with bycatch incidents. There are a range of other factors which we have not considered that may be relevant. The extent to which boats linger near any nets set may influence the birds, for example potentially deterring them from coming too close. There may be complex interactions between variables too, for example fishing practices may change in particular weather conditions, influencing the probability of bycatch. Analysis of water depth may be coarse and extent to which all nets sink to the seabed, and affect pursuit divers in deep waters where nets were not set that deep is questionable. Finally, the abundance of pspa species and how this differs temporally through the season could be a factor.
44 Table 15: Summary table of significant relationships tests in analysis. Tests sorted by p value (bold values less than <0.005). Individual tests have used different categorical groupings and it is suggested to refer to the individual tests for exact details on the factors used. Blank cells indicate tests where tests were not conducted, either as not appropriate or to avoid data dredging. Weather per transect Mean Visibility (km) Continuous n.s Reduced air visibility = more likely bird bycatch present Weather events Categorical < n.s. - Fog days = more likely bird bycatch present Wind direction Categorical n.s. - n.s. - - Wind direction (degrees) Continuous n.s. - n.s. - - Precipitation (mm) Continuous - - n.s. - - Mean Wind Speed (km/h) Continuous - - n.s. - - Mean Temperature (C) Continuous - - n.s. - - Individual net haul analysis pspa area Categorical n.s. Distance to coast (m) Continuous n.s n.s Chartered water depth (m) Continuous n.s n.s Grouped mesh sizes Categorical n.s Target fish species grouped Number of compass points on land in 2 km radius Categorical n.s n.s. Categorical - - n.s Falmouth Bay = more likely bird bycatch present Closer to shore = more likely diver bycatch present Shallower water = more likely diver bycatch present Medium/large mesh sizes = more likely bird and diver bycatch present Bass (and other large fish) target species = more likely bird and diver bycatch present Areas more enclosed by land = more likely diver bycatch present
45 Length of coastline in 1km radius (m) Continuous n.s n.s. n.s. Tidal current energy (J) Continuous n.s n.s. n.s. More enclosed by coastline = more likely diver bycatch present Lower tidal energy = more likely diver bycatch present Soak time (hours) Categorical n.s. n.s. n.s. n.s. - Soak time (daylight categories) Categorical - - n.s. n.s. - Month Categorical - n.s P values from multiple comparisons in tests on a range of p values (see Table 12 and Table 13). The largest (most conservative) p value from Bonferonni or Benjamini and Hochberg adjustments used.
46 While issues with the uneven nature of survey effort, both temporally and spatially have been highlighted, we do not consider these a fundamental problem for analysis. These are known issues and are balanced against being able to survey in the right weather conditions, and surveying areas which have potential overlaps between fishing and bird distributions to allow recording of bycatch incidents. The key limitation is the small sample size which provides limited options for statistical testing. Tests employed have aimed to be conservative with the limited data, and we have refrained from any multivariate analysis due to the limited sample size and potentially inter-related variables. Nevertheless caution is necessary when drawing any conclusions given the small number of incidents. In order to boost the sample size, in some analyses we have considered the incidence of all bird bycatch rather than just the species for which the pspa qualifies. It is important to note that these other species may forage differently and target different prey species, and this can clearly be observed with some factors. As such conclusions from the wider analysis involving all bird species are not necessarily relevant for Great Northern Divers, Black-throated Divers or Slavonian Grebes. Overall, the current methodology is considered sound, and is not a limiting factor in analysis. Future recommendations are the recording of: Data from existing buoy weather stations Secchi depth as a measure of water turbidity for each net haul observed An approximate measure of the degree of shelter for each net haul observed. Weather data used in this report comes from a land weather station some distance from the survey area. Buoy weather stations may be a source of more accurate data, however historical data is not available from the suggested source of this information 3. It is therefore suggested that the live information available on the day be obtained and archived for any future analysis. In the last year of data collated (winter 2015/16) some Secchi depth measures had been taken during the surveys. It is suggested that a Secchi disk could be deployed for every net haul observed to measure water turbidity for the point location. The water 3
47 turbidity is likely to affect bird species in regards to how visible nets are. One limitation noted with this technique will be the variation in light levels across the surveying (e.g. early mornings with little daylight), however this may be sufficient to provide an indication of the conditions. Finally, it is suggested that a measure of how sheltered the area is should be taken when each net haul is observed. This would resolve the current challenge in analysis in regards to measuring how sheltered/enclosed a location was. In this analysis we calculated the degree of enclosure from surrounding land for each net haul observed. However, this measure is not the same as how sheltered an area is, as this will depend on a wide range of factors including; wind direction and strength, the distance to land, degree of land enclosing the area and height of this land. While an in-field measure will be subjective, we believe this would be more accurate than a data/gis analysis approach. It is suggested that a categorical scale would be most appropriate to measure this in the field. Clearly bycatch can occur, but is a relatively rare event for the pspa interest features. When it does occur the risks are high, and while the data analysed here only relate to Great Northern Divers, were bycatch to involve one of the flocks of Black-throated Divers, a high proportion of the wintering population could be affected. We therefore suggest that monitoring should continue, with another three years potentially adding useful data. Critical to our understanding of the risks of bycatch is also better understanding of the wintering bird interest. We have relatively little understanding of how variable the distribution of birds is, how frequently the large flocks of Divers are recorded (see Liley et al. 2014), and how much variation there is between different winters. We understand bird monitoring is undertaken currently through WeBS and careful consideration is warranted as to how these data are collected and might be combined with bycatch recording. Ideally analysis would look to test whether bycatch incidence was take into account bird density and distribution as well as factors relating to fishing practice, weather etc.
48 Davies, R.W.D., Cripps, S.J., Nickson, A. & Porter, G. (2009) Defining and estimating global marine fisheries bycatch. Marine Policy, 33, Evans, R.J. (2000) Wintering Slavonian grebes in coastal waters of Britain and Ireland. British Birds, 93, Lewison, R.L., Crowder, L.B., Read, A.J. & Freeman, S.A. (2004) Understanding impacts of fisheries bycatch on marine megafauna. Trends in Ecology & Evolution, 19, Liley, D., Fearnley, H., Waldon, J. & Jackson, D. (2014) Distribution and Ecology of Wintering Grebes and Divers in the Falmouth-St. Austell pspa. Footprint Ecology Unpublished Report, Natural England. Pikesley, S.K., Cooke, R., Godley, B.J., Trundle, C., Votier, S.C. & Witt, M.J. (2016) Falmouth Bay to St. Austell Bay pspa Marine Atlas. Unpublished report for Natural England. Skov, H., Durinck, J., Mardik Leopold & Tasker, M.L. (1995) Important Bird Areas for Seabirds in the North Sea Including the Channel and the Kattegat. Street, K. & Trundle, C. (2014) Survey Report Winter 2013/14: pspa Incidental by-catch and Netting Intensity Study. Cornwall Inshore Fisheries and Conservation Authority. Street, K. & Trundle, C. (2015) Survey Report pspa Netting Observation Survey Winter 2014/15. Cornwall Inshore Fisheries and Conservation Authority. Wernham, C.V., Toms, M.P., Marchant, J.H., Clark, J.A., Siriwardena, G.M. & Baillie, S.R. (2002) The Migration Atlas: Movements of the Birds of Britain and Ireland. T. & A. D. Poyser, London. Zydelis, R., Bellebaum, J., Österblom, H., Vetemaa, M., Schirmeister, B., Stipniece, A., Dagys, M., van Eerden, M. & Garthe, S. (2009) Bycatch in gillnet fisheries - An overlooked threat to waterbird populations. Biological Conservation, 142,
49 Table 16: Dates of the 28 boat transects (note year 1, track 5 was started, but aborted before any data was collected). 1 26/11/ /12/ /11/ /11/ /12/ /01/ /01/ /12/ /01/ /01/ /12/ /01/ /02/ /01/ /02/ /02/ /01/ /02/ /03/ /01/ /03/ /03/ /02/ /03/ /03/ /02/ /02/ /03/ /03/2015
50 Table 17: Full list of metrics used. On board observations Month Fishing activity Target fishing species Grouped target fishing species Net mesh size (mm) Net mesh size classes Net mesh size classes (large vs small) Estimated soak time (hours) Estimated soak time (hours - categorised) Estimated soak time (days - categorised) Number of birds caught Number of divers caught Presence of birds in bycatch Presence of divers in bycatch GIS derived metrics pspa area Number of compass points occurring on land at 2 km radius (out of eight directions) Length of coastline within 1 km (m) Distance to coastline (m) GIS metrics from Marine Atlas Broad Substrate type Seabed Slope (%) Mean winter water temperature Mean autumn water temperature Tidal Current Energy (J) Wave Energy (J) Depth (m) Weather Mean Air Temperature C Mean Visibility (km) Mean Wind Speed (Km/h) Max Gust Speed (Km/h) Precipitation (mm) Cloud Cover (8ths) Wind Direction (degrees) Events Preceding days Mean Air Temperature C Preceding days Mean Visibility (km) Categorical Categorical Categorical Categorical Continuous Categorical Categorical Continuous Categorical Categorical Categorical Categorical Continuous Continuous Categorical Categorical Continuous Continuous Categorical Continuous Continuous Continuous Continuous Continuous Continuous Continuous Continuous Continuous Continuous Continuous Categorical Continuous Categorical Continuous Continuous
51 Preceding days Mean Wind Speed (Km/h) Preceding days Max Gust Speed (Km/h) Preceding days Precipitation (mm) Preceding days Cloud Cover (8ths) Preceding days Events Preceding days Mean Air Temperature C Continuous Continuous Continuous Categorical Categorical Categorical
52 Maps 8 and 9 follow showing the distribution of diver species recorded from shore-based and aerial surveys in and around the pspa.

53
54
Falmouth and St.Austell pspa bird bycatch analysis report year
 Natural England Commissioned Report NECR231 Falmouth and St.Austell pspa bird bycatch analysis report year 1-2014 First published 20 April 2017 www.gov.uk/natural-england Foreword Natural England commission
FishRamp Irish Sea VMS
 2015 FishRamp Irish Sea VMS Laurence Rooney AFBI 24/02/2015 Contents Summary Page 2 Data and Method details Page 4 Overview of competing interests Page 6 GB designated Wind-farms in the Irish Sea Page
Appendix 21 Sea angling from the shore
 Appendix 21 Sea angling from the shore LUC SMRTS2015 Final Report 342 March 2016 Appendix 21 Sea angling from the shore Table A21.1: Summary of sample confidence levels Responses Spatial data Questionnaire
Characterising the status of the Western Port recreational fishery in relation to biodiversity values: Phase 1 Greg Jenkins and Simon Conron
 Characterising the status of the Western Port recreational fishery in relation to biodiversity values: Phase 1 Greg Jenkins and Simon Conron November 2015 1 Contents Executive Summary... 7 Introduction...
White-clawed crayfish survey for Ensor s Pool SSSI/SAC (Warwickshire)
") Improvement Programme for England s Natura 2000 Sites (IPENS) Planning for the Future IPENS065 White-clawed crayfish survey for Ensor s Pool SSSI/SAC (Warwickshire) Ensor s Pool Special Area of Conservation
Improvement Programme for England s Natura 2000 Sites (IPENS) Planning for the Future IPENS065 White-clawed crayfish survey for Ensor s Pool SSSI/SAC (Warwickshire) Ensor s Pool Special Area of Conservation
Best Practice Guidance for Assessing the Financial Performance of Fishing Gear: Industry-led gear trials
 Best Practice Guidance for Assessing the Financial Performance of Fishing Gear: Industry-led gear trials Prepared for The UK Fisheries Economic Network (UKFEN) by Seafish Introduction and Background Reducing
Appendix 9 SCUBA diving in the sea
 Appendix 9 SCUBA diving in the sea Firth of Clyde Forum SMRTS2015 Final Report 195 March 2016 Appendix 9 SCUBA diving in the sea Table A9.1: Summary of sample confidence levels Responses Spatial data Questionnaire
INTER-AMERICAN TROPICAL TUNA COMMISSION SCIENTIFIC ADVISORY COMMITTEE FOURTH MEETING. La Jolla, California (USA) 29 April - 3 May 2013
 29 April - 3 May 2013") INTER-AMERICAN TROPICAL TUNA COMMISSION SCIENTIFIC ADVISORY COMMITTEE FOURTH MEETING La Jolla, California (USA) 29 April - 3 May 2013 DOCUMENT SAC-04-04c INDICES OF RELATIVE ABUNDANCE OF YELLOWFIN TUNA
INTER-AMERICAN TROPICAL TUNA COMMISSION SCIENTIFIC ADVISORY COMMITTEE FOURTH MEETING La Jolla, California (USA) 29 April - 3 May 2013 DOCUMENT SAC-04-04c INDICES OF RELATIVE ABUNDANCE OF YELLOWFIN TUNA
Analyzing Human- Environment Interactions using GIS. Cape Breton Highlands Education Centre/Academy
 Analyzing Human- Environment Interactions using GIS Cape Breton Highlands Education Centre/Academy Global Geography 12 The Right Whale Project Why are Right Whales Dying in the Gulf of St. Lawrence?
Conservation Limits and Management Targets
 Conservation Limits and Management Targets Setting conservation limits The use of conservation limits (CLs) in England and Wales (E&W) has developed in line with the requirement of ICES and NASCO to set
A Combined Recruitment Index for Demersal Juvenile Cod in NAFO Divisions 3K and 3L
 NAFO Sci. Coun. Studies, 29: 23 29 A Combined Recruitment Index for Demersal Juvenile Cod in NAFO Divisions 3K and 3L David C. Schneider Ocean Sciences Centre, Memorial University St. John's, Newfoundland,
Marine Renewables Industry Association. Marine Renewables Industry: Requirements for Oceanographic Measurements, Data Processing and Modelling
 Marine Renewables Industry Association Marine Renewables Industry: Requirements for Oceanographic Measurements, Data Processing and Modelling October 2009 Table of Contents 1. Introduction... 1 2. Measurements
SEDIMENT BUDGET OF LIDO OF PELLESTRINA (VENICE) Written by Marcello Di Risio Under the supervision of Giorgio Bellotti and Leopoldo Franco
 Written by Marcello Di Risio Under the supervision of Giorgio Bellotti and Leopoldo Franco") SEDIMENT BUDGET OF LIDO OF PELLESTRINA (VENICE) Written by Marcello Di Risio Under the supervision of Giorgio Bellotti and Leopoldo Franco Table of contents: 1. Introduction...3 2. Protection structures
SEDIMENT BUDGET OF LIDO OF PELLESTRINA (VENICE) Written by Marcello Di Risio Under the supervision of Giorgio Bellotti and Leopoldo Franco Table of contents: 1. Introduction...3 2. Protection structures
PROJECT Nº 96/005: SIZE SELECTIVITY AND RELATIVE FISHING POWER OF BALTIC COD GILL-NETS
 PROJECT Nº 96/005: SIZE SELECTIVITY AND RELATIVE FISHING POWER OF BALTIC COD GILL-NETS KEY WORDS Selectivity, fishing power, Baltic Sea, statistical model, fisheries management, cod (Gadus morhua). AUTHORS
CPUE standardization of black marlin (Makaira indica) caught by Taiwanese large scale longline fishery in the Indian Ocean
 caught by Taiwanese large scale longline fishery in the Indian Ocean") CPUE standardization of black marlin (Makaira indica) caught by Taiwanese large scale longline fishery in the Indian Ocean Sheng-Ping Wang Department of Environmental Biology and Fisheries Science, National
CPUE standardization of black marlin (Makaira indica) caught by Taiwanese large scale longline fishery in the Indian Ocean Sheng-Ping Wang Department of Environmental Biology and Fisheries Science, National
FIELDTRIP REPORT. The Selati River flowing. 5 th January to 7 th March st WET SEASON. Report by:
 The Selati River flowing FIELDTRIP REPORT 5 th January to 7 th March 2017 1 st WET SEASON Report by: Jessica Comley, Rhodes University, Grahamstown INTRODUCTION My second field trip to Selati Game Reserve
ANALYSIS OF SCIENTIFIC INFORMATION ON HECTOR S DOLPHIN
 The following has been complied by Mr J Crossland a marine scientist from Christchurch and although the data presented is centered on the Canterbury area the conclusions pertain to all the so called Dolphin
SEAFISH ECONOMIC ANALYSIS
 SEAFISH ECONOMIC ANALYSIS UK 15m & over Scallop Fleet Area VII Economic analysis of the UK 15m and over scallop fishing fleet in ICES Area VII March 2016 AUTHORS: Arina Motova (Seafish) Hazel Curtis (Seafish)
2016 ANNUAL FISH TRAWL SURVEY REPORT
 216 ANNUAL FISH TRAWL SURVEY REPORT The University of Rhode Island Graduate School of Oceanography The Graduate School of Oceanography (GSO) Fish trawl survey began weekly sampling two stations in Narragansett
Hakes Assessment SARC 51. Whiting NEFMC PDT Meeting February 14, 2011 Milford, MA
 Hakes Assessment SARC 51 Whiting NEFMC PDT Meeting February 14, 2011 Milford, MA Revisions and Updates to Assessment Summary Document Silver hake Revised assessment document Silver hake assessment summary
Legendre et al Appendices and Supplements, p. 1
 Legendre et al. 2010 Appendices and Supplements, p. 1 Appendices and Supplement to: Legendre, P., M. De Cáceres, and D. Borcard. 2010. Community surveys through space and time: testing the space-time interaction
MOANA NEW ZEALAND & SANFORD MĀUI DOLPHIN PROTECTION PLAN
 MOANA NEW ZEALAND & SANFORD MĀUI DOLPHIN PROTECTION PLAN The Māui dolphin or popoto (Cephalorhynchus hectori maui) is the world's rarest and smallest marine dolphin. They are only found off the west coast
An update of longline Catch Per-Unit-Effort indices for snapper in SNA 1 New Zealand Fisheries Assessment Report 2016/59
 An update of longline Catch Per-Unit-Effort indices for snapper in SNA 1 New Zealand Fisheries Assessment Report 2016/59 A.D. Langley ISSN 1179-5352 (online) ISBN 978-1-77665-412-3 (online) October 2016
NEAFC request to evaluate the use and quality of VMS data
 9.3.2.4 NEAFC request to evaluate the use and quality of VMS data Request Regarding deepsea fisheries, NEAFC requests ICES to evaluate the use and quality of VMS data and records of catch and effort to
Data Set 7: Bioerosion by Parrotfish Background volume of bites The question:
 Data Set 7: Bioerosion by Parrotfish Background Bioerosion of coral reefs results from animals taking bites out of the calcium-carbonate skeleton of the reef. Parrotfishes are major bioerosion agents,
Sourced from:
 Catch Comparison trials using a 400mm Square Mesh Panel Louise Jones SFF Data Analyst Sourced from: http://www.worldfishingtoday.com/newbuildings/default.asp?nyid=621277 Summary: The 400mm SMP alone is
United States Commercial Vertical Line Vessel Standardized Catch Rates of Red Grouper in the US South Atlantic,
 SEDAR19-DW-14 United States Commercial Vertical Line Vessel Standardized Catch Rates of Red Grouper in the US South Atlantic, 1993-2008 Kevin McCarthy and Neil Baertlein National Marine Fisheries Service,
Standardized catch rates of yellowtail snapper ( Ocyurus chrysurus
 Standardized catch rates of yellowtail snapper (Ocyurus chrysurus) from the Marine Recreational Fisheries Statistics Survey in south Florida, 1981-2010 Introduction Yellowtail snapper are caught by recreational
SMOOTH HAMMERHEAD SHARK (HHS)
") SMOOTH HAMMERHEAD SHARK (HHS) (Sphyrna zygaena) HHS1 1. FISHERY SUMMARY Smooth hammerhead sharks (Sphyrna zygaena) are not currently managed under the QMS. No assigned fishing allowances exist. However,
SMOOTH HAMMERHEAD SHARK (HHS) (Sphyrna zygaena) HHS1 1. FISHERY SUMMARY Smooth hammerhead sharks (Sphyrna zygaena) are not currently managed under the QMS. No assigned fishing allowances exist. However,
Divers and wind farms. Review of available information and perspectives for German marine areas
 Divers and wind farms. Review of available information and perspectives for German marine areas Ben Dean Volker Dierschke 1. Wind farm effects on divers 2. Impact of wind farms on divers in German Bight
Addendum to SEDAR16-DW-22
 Addendum to SEDAR16-DW-22 Introduction Six king mackerel indices of abundance, two for each region Gulf of Mexico, South Atlantic, and Mixing Zone, were constructed for the SEDAR16 data workshop using
PUBLISHED PROJECT REPORT PPR850. Optimisation of water flow depth for SCRIM. S Brittain, P Sanders and H Viner
 PUBLISHED PROJECT REPORT PPR850 Optimisation of water flow depth for SCRIM S Brittain, P Sanders and H Viner Report details Report prepared for: Project/customer reference: Copyright: Highways England,
Two types of physical and biological standards are used to judge the performance of the Wheeler North Reef 1) Absolute standards are measured against
 Absolute standards are measured against") 1 Two types of physical and biological standards are used to judge the performance of the Wheeler North Reef 1) Absolute standards are measured against fixed value at Wheeler North Reef only 2) Relative
1 Two types of physical and biological standards are used to judge the performance of the Wheeler North Reef 1) Absolute standards are measured against fixed value at Wheeler North Reef only 2) Relative
USING DELTA-GAMMA GENERALIZED LINEAR MODELS TO STANDARDIZE CATCH RATES OF YELLOWFIN TUNA CAUGHT BY BRAZILIAN BAIT-BOATS
 SCRS/2008/166 USING DELTA-GAMMA GENERALIZED LINEAR MODELS TO STANDARDIZE CATCH RATES OF YELLOWFIN TUNA CAUGHT BY BRAZILIAN BAIT-BOATS Humber A. Andrade 1 SUMMARY In order to standardize catch per unit
Orange County MPA Watch A n n u a l R e p o r t
 Orange County MPA Watch 2 0 1 5 A n n u a l R e p o r t WHAT IS AN MPA? Marine Protected Areas (MPAs) are discrete geographic marine or estuarine areas designed to protect or conserve marine life and habitat.
7TH ANNUAL MEETING OF THE COMMISSION
 7TH ANNUAL MEETING OF THE COMMISSION 23-27 January 2019, The Hague, The Netherlands COMM7-Prop15.1 Background document: A Proposal for a research fishing Conservation and Management Measure for SPRFMO
Surf Survey Summary Report
 Port Otago Limited 15 Beach Street Port Chalmers Surf Survey Summary Report August 13-September 1 Leigh McKenzie Summary of Surf Locations of Interest Port Otago Ltd is undertaking monitoring of changes
Trawl fishery management of Eastern Arabian Sea
 Trawl fishery management of Eastern Arabian Sea Dr. A.P.Dineshbabu, Central Marine Fisheries Research Institute, India Existing management practices Seasonal closure of fishery: The regulations for closed
Case Study 3. Case Study 3: Cebu Island, Philippines MPA Network 10
 Case studies of mpa networks Case Study 3: Cebu Island, Philippines MPA Network 10 Location and background Cebu Island in the Philippines lies in the center of the Visayan Islands, known as an area high
Exemplar for Internal Assessment Resource Geography Level 3. Resource title: The Coastal Environment Kaikoura
 Exemplar for internal assessment resource Geography 3.5A for Achievement Standard 91430 Exemplar for Internal Assessment Resource Geography Level 3 Resource title: The Coastal Environment Kaikoura This
Collection of Fisheries Information and Fishing Data by the IFG Network
 Collection of Fisheries Information and Fishing Data by the IFG Network Discussion Paper for IFG Meetings 1. Introduction 1.1 The need to collect basic fishing data to inform management considerations
Aim. Survey Methodology
 The fish that smells of cucumber: conservation of smelt Osmerus eperlanus in the Thames Estuary Interim Report on results of 2015 survey work Joanna Barker Project Manager, Europe Conservation Programme
Descriptive analysis of the fishery for hake ( Merluccius australis
 Descriptive analysis of the fishery for hake (Merluccius australis) in HAK 1, 4 and 7 from 1989 9 to 11, and a catch-per-unit-effort (CPUE) analysis for Chatham Rise and WCSI hake New Zealand Fisheries
Tracking Juvenile Summer Flounder
 Tracking Juvenile Summer Flounder East Coast MARE Materials For the leader: Whiteboard Markers (different colors) For each group: Copies of student group packets Copies of student worksheet Overview Scientists
Available from Deakin Research Online:
 This is the published version: Hirst, Alastair J., Heislers, Simon, Parry, Gregory D., Werner, Guy F., White, Camille A. and Spooner, Daniel, Port Phillip Bay annual trawl sub program : progress report
Inshore wrasse pot fishery What are the issues?
 Our Position - Summary Devon Wildlife Trust is calling for the immediate ban on live capture of all wrasse species in the South West from within Marine Protected Areas. Wrasse are being captured live from
Volume and Shoreline Changes along Pinellas County Beaches during Tropical Storm Debby
 Volume and Shoreline Changes along Pinellas County Beaches during Tropical Storm Debby Ping Wang and Tiffany M. Roberts Coastal Research Laboratory University of South Florida July 24, 2012 Introduction
Appendix 22 Sea angling from a private or chartered boat
 Appendix 22 Sea angling from a private or chartered boat LUC SMRTS2015 Final Report 359 March 2016 Appendix 22 Sea angling from a private or chartered boat Table A22.1: Summary of sample confidence levels
Marine Mammal Acoustic and Visual Surveys - Analysis of Neart Na Gaoithe data Table of Contents
 Marine Mammal Acoustic and Visual Surveys - Analysis of Neart Na Gaoithe data Table of Contents 1. Methods... 2 1.1 Estimating Absolute Abundance... 3 2. Results... 5 2.1 Factors affecting detection probability...
Monitoring the length structure of commercial landings of albacore tuna during the fishing year
 SCTB15 Working Paper ALB-5 Monitoring the length structure of commercial landings of albacore tuna during the 2001 2002 fishing year Linda Griggs National Institute of Water and Atmospheric Research Ltd.
Life Transitions and Travel Behaviour Study. Job changes and home moves disrupt established commuting patterns
 Life Transitions and Travel Behaviour Study Evidence Summary 2 Drivers of change to commuting mode Job changes and home moves disrupt established commuting patterns This leaflet summarises new analysis
Biogeographic Assessment of Florida Keys National Marine Sanctuary
 Biogeographic Assessment of Florida Keys National Marine Sanctuary NOAA National Centers for Coastal Ocean Science NOAA Florida Keys National Marine Sanctuary Florida Fish and Wildlife Commission Photos
Keywords: marine habitat recovery, derelict fishing gear
 Marine habitat recovery after derelict fishing net removal. Jeff June*, Kyle Antonelis, Natural Resources Consultants, Inc. Seattle, WA. *Corresponding author: jjune@nrccorp.com Keywords: marine habitat
> >Welcome to the second issue of Fish Briefs! > > > >Articles in Issue Two: > > > >Robert S. Gregory, John T. Anderson. "Substrate selection and use
 Welcome to the second issue of Fish Briefs! Articles in Issue Two: Robert S. Gregory, John T. Anderson. "Substrate selection and use of protective cover by juvenile Atlantic cod Gadus morhua in inshore
European Fisheries Fund Project. Sustainable Use of Fisheries Resources in Welsh Waters
 European Fisheries Fund Project Sustainable Use of Fisheries Resources in Welsh Waters Welsh Waters Scallop Strategy Industry working group meeting 1 st February 2013 Sustainable Use of Fisheries Resources
A guide to fisheries regulations ENVIRONMENT CORNWALL SEA FISHERIES COMMITTEE. WaW AGENCY
 A guide to fisheries regulations CORNWALL SEA FISHERIES COMMITTEE ENVIRONMENT WaW AGENCY The Fal Estuary and Coastal Area BASS FACTS Bass grow and mature slowly and may not breed until they are 7 years
THE BIOLOGY OF THE PRAWN, PALAEMON
 J. mar. bio!. Ass. U.K. (1959) 38 621-627 Printed in Great Britain 621 THE BOLOGY OF THE PRAWN PALAEMON (=LEANDER) SERRA TU S (PENNANT) BY G. R. FORSTER The Plymouth Laboratory n a recent paper Cole (1958)
and found that there exist a significant overlap between the billfish resources and the exploitation activities targeting tunas and mahi mahi.
 Executive Summary Report 2016 Billfish Research in the Eastern Pacific Ocean Rosenstiel School of Marine and Atmospheric Science University of Miami January 2017 During 2016, the Eastern Pacific Ocean
Orange County MPA Watch A n n u a l R e p o r t
 Orange County MPA Watch 2 0 1 4 A n n u a l R e p o r t WHAT IS AN MPA? Marine Protected Areas (MPAs) are discrete geographic marine or estuarine areas designed to protect or conserve marine life and habitat.
Application of a New Method for Monitoring Lake Trout Abundance in Yukon: Summer Profundal Index Netting (SPIN)
") Application of a New Method for Monitoring Lake Trout Abundance in Yukon: Summer Profundal Index Netting (SPIN) Prepared by: Lars Jessup Nathan Millar November 2011 Application of a New Method for Monitoring
Application of a New Method for Monitoring Lake Trout Abundance in Yukon: Summer Profundal Index Netting (SPIN) Prepared by: Lars Jessup Nathan Millar November 2011 Application of a New Method for Monitoring
Fishery Resource Grant Program Final Report 2010
 Fishery Resource Grant Program Final Report 2010 Project title: Improving Gill net Selectivity by Altering Mesh Characteristics 2010 Name of PI: Robert Weagley Telephone: (804) 855-4112 Address: 10201
Devon & Severn Inshore Fisheries & Conservation Authority. Sarah Clark Principal Environment Officer
 Devon & Severn Inshore Fisheries & Conservation Authority Sarah Clark Principal Environment Officer Mission Inshore Fisheries and Conservation Authorities will lead, champion and manage a sustainable marine
Spatial Methods for Road Course Measurement
 Page 1 of 10 CurtinSearch Curtin Site Index Contact Details Links LASCAN Spatial Sciences WA Centre for Geodesy COURSE MEASUREMENT This page is a summary of results of some of the research we have recently
Technical Brief - Wave Uprush Analysis Island Harbour Club, Gananoque, Ontario
 Technical Brief - Wave Uprush Analysis RIGGS ENGINEERING LTD. 1240 Commissioners Road West Suite 205 London, Ontario N6K 1C7 October 31, 2014 Table of Contents Section Page Table of Contents... i List
Watersports and Leisure Participation Survey 2006 BMF, MCA, RNLI and RYA, sponsored by Sunsail
 Watersports and Leisure Participation Survey 2006 Page 1 of 37 Watersports and Leisure Participation Survey 2006 BMF, MCA, RNLI and RYA, sponsored by Sunsail The Old Coach House Wharf Road Guildford Surrey
Summary of Research within Lamlash Bay No-Take Zone - Science report for COAST July
 Summary of Research within Lamlash Bay No-Take Zone - Science report for COAST July 2013 - *Picture of a spider crab (Macropodia spp) inside a plumose anemone. Taken within Lamlash Bay No-Take Zone by
ASMFC Stock Assessment Overview: Red Drum
 Purpose The purpose of this document is to improve the understanding and transparency of the Commission s stock assessment process and results. It is the first of several that will be developed throughout
APPENDIX 3E HYDROACOUSTIC ANALYSIS OF FISH POPULATIONS IN COPCO AND IRON GATE RESERVOIRS, CALIFORNIA NOVEMBER
 APPENDIX 3E HYDROACOUSTIC ANALYSIS OF FISH POPULATIONS IN COPCO AND IRON GATE RESERVOIRS, CALIFORNIA NOVEMBER 23 February 24 PacifiCorp Fish Resources FTR Appendix 3E.doc Hydroacoustic Analysis of Fish
Spatial/Seasonal overlap between the midwater trawl herring fishery and predator focused user groups
 Spatial/Seasonal overlap between the midwater trawl herring fishery and predator focused user groups A working paper submitted to the Herring PDT Micah Dean July 26, 2017 Introduction A goal of Amendment
SCIENTIFIC COMMITTEE SEVENTH REGULAR SESSION August 2011 Pohnpei, Federated States of Micronesia
 SCIENTIFIC COMMITTEE SEVENTH REGULAR SESSION 9-17 August 2011 Pohnpei, Federated States of Micronesia CPUE of skipjack for the Japanese offshore pole and line using GPS and catch data WCPFC-SC7-2011/SA-WP-09
Fisheries Resource Access Mapping Project (FishRAMP):
:") Fisheries Resource Access Mapping Project (FishRAMP): The Co. Down Wind Resource Zone Contributors: Matthew Service and Laurence Rooney (AFBI); Rod Cappell (Poseidon); Lynn Gilmore (Seafish) and the NI
Fisheries Resource Access Mapping Project (FishRAMP): The Co. Down Wind Resource Zone Contributors: Matthew Service and Laurence Rooney (AFBI); Rod Cappell (Poseidon); Lynn Gilmore (Seafish) and the NI
Coastal and marine recreation in New England is ingrained in the region s economic and
 RECREATION Coastal and marine recreation in New England is ingrained in the region s economic and social fabric. Recreation on the ocean and coast includes many of New Englanders most time-honored and
For the purposes of any clarification and legal interpretation the original byelaw should referred to.
 Sussex Inshore Fisheries and Conservation Authority Byelaw guidance for marine fisheries and conservation management Marine Protected Areas Byelaw 2015 Schedule 1: Kingmere Marine Conservation Zone Introduction
Year Avg. TAC Can Others Totals
 SKATE IN DIVISIONS 3L, 3N, 3O AND SUBDIVISION 3Ps Background There are 8 to 1 species of skate in the waters around Newfoundland. Of these, thorny skate (Raja radiata) is by far the most common, comprising
12. School travel Introduction. Part III Chapter 12. School travel
 12. School travel 12.1 Introduction This chapter presents the evidence on changes in travel patterns for the journey to school in the three towns over the period of the Sustainable Travel Town project.
Three Rivers Cockle Abundance Survey Report April 2016
 Three Rivers Cockle Abundance Survey Report April 16 May 16 Crown Copyright WG 2884 ISBN digital 978-1-4734-669-6 1. Introduction The annual Three Rivers Estuaries cockle abundance survey was conducted
BASELINE SURVEY, VISUAL - SITE SPECIFIC
 BASELINE SURVEY, VISUAL - SITE SPECIFIC Introduction As stated in SEPA s policy and in the Fish Farm Manual (1998), scientific data are required by SEPA in order to assess the existing condition on the
7 GULF OF ALASKA POLLOCK
 7 GULF OF ALASKA POLLOCK 7.1 Introduction For the Gulf of Alaska (GOA) pollock fishery, the Principle 1 and 2 PIs were mapped against the following indicators within the stated reports: FAM PI: Assessment
GUIDE TO SPOTTING DOLPHINS ALONG DORSET'S JURASSIC COAST
 GUIDE TO SPOTTING DOLPHINS ALONG DORSET'S JURASSIC COAST INTRODUCTION I think most people carry in their heads, the stereo typical image of dolphins swimming along side a boat in the Mediterranean Sea.
Fishery Report 2017: Champsocephalus gunnari South Georgia (Subarea 48.3)
") Fishery Report 2017: Champsocephalus gunnari South Georgia (Subarea 48.3) FISHERY REPORT The map above shows the management areas within the CAMLR Convention Area, the specific region related to this report
Fishery Report 2017: Champsocephalus gunnari South Georgia (Subarea 48.3) FISHERY REPORT The map above shows the management areas within the CAMLR Convention Area, the specific region related to this report
Orange County MPA Watch 2016 A n n u a l R e p o r t
 Orange County MPA Watch 2016 A n n u a l R e p o r t WHAT IS AN MPA? Marine Protected Areas (MPAs) are discrete geographic marine or estuarine areas designed to protect or conserve marine life and habitat.
SCDNR Charterboat Logbook Program Data, Mike Errigo, Eric Hiltz, and Amy Dukes SEDAR32-DW-08
 SCDNR Charterboat Logbook Program Data, 1993-2011 Mike Errigo, Eric Hiltz, and Amy Dukes SEDAR32-DW-08 Submitted: 5 February 2013 Addendum: 5 March 2013* *Addendum added to reflect changes made during
Atlantic cod, Norwegian Coastal cod, Gillnet
 Atlantic cod, Norwegian Coastal cod, Gillnet Content last updated 1st Aug 2017 Stock: Norwegian Coastal cod Management: Norway Atlantic cod, Norwegian Coastal cod, Gillnet Overview Atlantic cod, Gadus
UK Coastal Atlas of Recreational Boating 2.0: User Guide
 UK Coastal Atlas of Recreational Boating 2.0: User Guide Royal Yachting Association September 2016 RYA UK Coastal Atlas of Recreational Boating 2.0 Contents 1. Overview... 2 1.1. What is it?... 2 1.2.
from ocean to cloud HEAVY DUTY PLOUGH PERFORMANCE IN VERY SOFT COHESIVE SEDIMENTS
 HEAVY DUTY PLOUGH PERFORMANCE IN VERY SOFT COHESIVE SEDIMENTS Geoff Holland, Sarah Dzinbal (Alcatel-Lucent Submarine Networks) Email: geoff.holland@alcatel-lucent.com Alcatel-Lucent Submarine Networks
ASMFC Stock Assessment Overview: Atlantic Menhaden
 Introduction This document presents a summary of the 217 Stock Assessment Update for Atlantic menhaden. The assessment is an update to the 215 Benchmark Stock Assessment that was peer reviewed by an independent
Reef Check Australia. Magnetic Island Season Report 2016
 Reef Check Australia Season Report 16 Reef Check Foundation Ltd. (Australia) www.reefcheckaustralia.org PO Box 134 George St Brisbane QLD 43 This report should be cited as: M. Welch, J. Salmond and J.
Proportion (%) of Total UK Adult Population (16+)s. Participating in any Watersports Activity
 of Total UK Adult Population (16+)s. Participating in any Watersports Activity") Proportion (%) of Total UK Adult Population (16+)s Participating in any Watersports Activity Headlines Participation in any activities up 2.1% point 14.3m UK adults participating Highest volume recorded
Proportion (%) of Total UK Adult Population (16+)s Participating in any Watersports Activity Headlines Participation in any activities up 2.1% point 14.3m UK adults participating Highest volume recorded
Map Showing NAFO Management Units
 Map Showing NAFO Management Units Biology Are 6 species of seals in Atlantic Canadian waters, all of which occur in Newfoundland Two Arctic Species (Ringed, Bearded) Two temperate (Grey, Harbour) Two migratory
STANDARDIZED CATCH RATE OF SAILFISH (Istiophorus platypterus) CAUGHT BY BRAZILIAN LONGLINERS IN THE ATLANTIC OCEAN ( )
 CAUGHT BY BRAZILIAN LONGLINERS IN THE ATLANTIC OCEAN ( )") SCRS/2008/079 STANDARDIZED CATCH RATE OF SAILFISH (Istiophorus platypterus) CAUGHT BY BRAZILIAN LONGLINERS IN THE ATLANTIC OCEAN (1986-2006) Catarina Wor 12 ; Bruno L. Mourato 1,3 ; Humberto G. Hazin 1
SCRS/2008/079 STANDARDIZED CATCH RATE OF SAILFISH (Istiophorus platypterus) CAUGHT BY BRAZILIAN LONGLINERS IN THE ATLANTIC OCEAN (1986-2006) Catarina Wor 12 ; Bruno L. Mourato 1,3 ; Humberto G. Hazin 1
Appendix 16 Yacht racing at sea
 Appendix 16 Yacht racing at sea Sarah Brown SMRTS2015 Final Report 292 March 2016 Appendix 16 Yacht racing at sea Table A16.1: Summary of sample confidence levels Responses Spatial data Questionnaire data
Monitoring Rusty Crayfish in Southern Ontario Streams and Rivers
 Monitoring Rusty Crayfish in Southern Ontario Streams and Rivers Scott Reid, Tom Brooke, Jane Devlin, Joe Nocera Applied Research and Development Branch Background rusty crayfish first reported in 1960s:
North East Atlantic Fisheries Baltic Sprat Whitepaper March 2011
 North East Atlantic Fisheries Baltic Sprat Whitepaper March 2011 1. Introduction Sprat is a clupeid fish found widely in the North East Atlantic area. Sprat is a relatively short-lived species. The stock
Fisheries (Codes and Instructions) Circular. Fisheries (Codes and Information) Circular 2017
 Circular. Fisheries (Codes and Information) Circular 2017") Fisheries (Codes and Information) Circular 01 Draft 1 July 01 Issuing Authority This circular is issued under regulation of the Fisheries (Reporting) Regulations 01 by xyz, acting under delegation from
Fisheries (Codes and Information) Circular 01 Draft 1 July 01 Issuing Authority This circular is issued under regulation of the Fisheries (Reporting) Regulations 01 by xyz, acting under delegation from
ATLANTIC STATES MARINE FISHERIES COMMISSION. Winter Flounder Abundance and Biomass Indices from State Fishery-Independent Surveys
 ATLANTIC STATES MARINE FISHERIES COMMISSION Winter Flounder Abundance and Biomass Indices from State Fishery-Independent Surveys Technical Committee Report to the Winter Flounder Management Board February
April 7, Prepared for: The Caribbean Disaster Emergency Response Agency Prepared by: CEAC Solutions Co. Ltd.
 April 7, 2006 Prepared for: The Caribbean Disaster Emergency Response Agency Prepared by: Introduction CEAC Solutions Co. Ltd was commissioned in May 2005 to prepare coastal beach erosion hazard maps for
Hook Selectivity in Gulf of Mexico Gray Triggerfish when using circle or J Hooks
 Hook Selectivity in Gulf of Mexico Gray Triggerfish when using circle or J Hooks Alisha M. Gray and Beverly Sauls SEDAR43- WP- 09 25 March 2015 This information is distributed solely for the purpose of
Stillwater Status Report: Lough Muck, County Tyrone
 LOUGHS AGENCY OF THE FOYLE CARLINGFORD AND IRISH LIGHTS COMMISSION Stillwater Status Report: Lough Muck, County Tyrone Stillwater Fish Stock Survey Loughs Agency of the Foyle Carlingford and Irish Lights
Monitoring of sea trout post-smolts, 2012
 Monitoring of sea trout post-smolts, 2012 A report to the West Sutherland Fisheries Trust, Report No. WSFT2/13 January 2013 Shona Marshall Fisheries Biologist West Sutherland Fisheries Trust Gardeners
Introduction. Biological Profile
 Introduction Porcupine Crab (Neolithodes grimaldii) inhabits the sea bed off the Coast of Newfoundland and Labrador in depths beyond 500 fathoms (fm). This large crab is often caught as a by-catch in the