International Comparison CCQM-K76: Sulfur Dioxide in Nitrogen
|
|
|
- Theodore Hall
- 6 years ago
- Views:
Transcription
1 International Comparison CCQM-K76: Sulfur Dioxide in Nitrogen Franklin R. Guenther 1, Michael E. Kelley 1, Gerald D. Mitchell 1, Manuel de Jesús Avila Salas 2, Jorge Koelliker Delgado 2, Francisco Rangel Murillo 2, Victor M. Serrano Caballero 2, Alejandro Pérez Castorena 2, Uehara Shinji 3, Dariusz Ciecior 4, Valnei Smarçaro da Cunha 5, Cristiane Rodrigues Augusto 5, Claudia Cipriano Ribeiro 5, Andreia de Lima Fioravante 5, Florbela Dias 6, Oh Sang-Hyub 7, Tatiana Macé 8, Christophe Sutour 8, Tamás Büki 9, Han Qiao 10, Angelique Botha 11, David M. Mogale 11, James Tshilongo 11, Napo Ntsasa 11, Tshepiso Mphamo 11, Ian Uprichard 12, Martin Milton 12, Gergely Vargha 12, Chris Brookes 12, Prabha Johri 13, Ing. Miroslava Valkova 14, Leonid Konopelko 15, Yury Kustikov 15, V.V. Pankratov 15, D.V. Rumyantsev 15, M.V. Pavlov 15, E.V. Gromova 15,Adriaan van der Veen 16, Peter van Otterloo 16, Rob. M. Wessel 16 1 National Institute of Standards and Technology (NIST), 100 Bureau Drive, Gaithersburg, MD , USA 2 Centro Nacional De Metrologíe (CENAM), km 4.5 carretera a Los Cués, Municipio El Marqués, Querétaro CP, México. Apdo. Postal Centro 3 Chemicals Evaluation and Research Institute (CERI), Japan, 1600 Shimotakano,Sugito-machi, Kitakatsushikagun,Saitama, , Japan. 4 Central Office of Measures (Glowny Urzad Miar, GUM), Elektorlna Warsaw Poland 5 Instituto Nacional de Metrologia, Normalização e Qualidade Industrial INMETRO 6 Instituto Português da Qualidade (IPQ), Rua António Gião, 2, Caparica, Portugal 7 Korea Research Institute of Standards and Science (KRISS),1 Doryong-Dong, Yuseong-Gu, Daejeon , Korea 8 Laboratoire National de métrologie et d Essais (LNE), 1, rue Gaston Boissier, Paris Cedex 15 9 Hungarian Trade Licensing Office (MKEH), H-1124 Budapest, Németvölgyi út 37-39, Hungary 10 National Institute of Metrology (NIM), China, No.18, Bei-San-Huan Dong Str., Beijing , China. 11 National Metrology Institute of South Africa (NMISA), CSIR, Building 4 West, Meiring Naude Road Brummeria, 0184, Pretoria, South Africa 12 National Physical Laboratory (NPL), Module 8 - L10, Hampton Road, Teddington, Middlesex United Kingdom TW11 0LW 13 National Physical Laboratory India (NPLI), Dr. K.S. Krishnan Road, New Delhi , India 14 Slovak Institute of Metrology (SMU), Karloveská 63, SK Bratislava, Slovak Republic 15 D.I.Mendeleyev Institute for Metrology (VNIIM), 19 Moskovsky pr., St. Petersburg, Russia 16 VSL, Thijsseweg JA Delft The Netherlands Coordinating Laboratory: National Institute of Standards and Technology (NIST) Study Coordinators: Michael E. Kelley and Franklin R. Guenther Field: Amount of Substance Subject: Sulfur Dioxide in Nitrogen at 100 µ. Organizing Body: CCQM Schedule of comparison: 1) Preparation of cylinders: July ) Initial verification study: October ) Cylinders shipped to participants: December ) s received from the participants: May through August ) Cylinders received: May through September ) Final verification study: October
2 Introduction This Key Comparison is designed to test the capabilities of the participants to measure and certify sulfur dioxide in nitrogen, and will provide supporting evidence for the CMCs of institutes for sulfur dioxide. Also, as sulfur dioxide is designated a core compound, and the 100 µ concentration is within the designated core compound concentration range, this comparison is also designed to demonstrate core capabilities of institutes which qualify under the rules of the Gas Analysis Working Group. Supported Claims This Key Comparison provides evidence in support of CMCs for sulfur dioxide in the range of 50 µ to 1 %, in a balance of nitrogen or air. In addition this comparison provides evidence in support of CMC claims extending to all core compounds and concentrations as defined by the Gas Analysis Working Group (GAWG). Institutes which may claim core competences under the rules of the GAWG may use the results of this comparison to support core competency claims. In order to justify CMCs at amount fractions lower than 50 µ using this comparison as supporting evidence, it will be necessary for the NMI to provide evidence that they have sufficient capability to analyze the level of impurity of the minor component in the balance gas at less than half their stated uncertainty claim. They must also have analytical methods with sufficient stability and reproducibility to measure changes in concentration of less than their uncertainty over time. In addition, to justify CMCs for CRMs at lower amount fractions it will be necessary to provide evidence of stability trials on cylinders. This comparison shall not be used as evidence for claims below 1 µ. Participants Table 1: List of Participating Laboratories Acronym Country Institute CENAM MX Centro Nacional De Metrologíe CERI JP Chemicals Evaluation and Research Institute GUM PL Central Office of Measures (Glowny Urzad Miar) INMETRO BR National Institute of Metrology, Standardization and Industrial Quality IPQ PT Instituto Português da Qualidade KRISS KR Korea Research Institute of Standards and Science LNE FR Laboratoire National de métrologie et d Essais MKEH HU Hungarian Trade Licensing Office NIM CN National Institute of Metrology NIST US National Institute of Standards and Technology NMISA ZA National Metrology Institute of South Africa NPL GB National Physical Laboratory NPLI IN National Physical Laboratory India SMU SK Slovak Institute of Metrology VNIIM RU D.I.Mendeleyev Institute for Metrology VSL NL VSL 2
3 Preparation of Parent mix cylinder One aluminum compressed gas cylinder (Cylinder # CC63757) with an internal volume of approximately 30 L was prepared to serve as the parent mixture containing nominal 1500 µ sulfur dioxide in nitrogen. It was filled in a manner that meets or exceeds the guidelines outlined in ISO This candidate parent cylinder was connected to a fill manifold along with premix Cylinder # ALM ( ± % SO 2 /N 2 ) and two cylinders of ultra-pure Nitrogen. The contents of the cylinder were vented, purged (138 kpa of ultra-pure Nitrogen) and evacuated a minimum of four times to less than 1.3 Pa. The final evacuation reduced the cylinder pressure to approximately 0.2 Pa. The cylinder was then placed near the double pan balance overnight to allow for the temperature of the cylinder to equilibrate to room temperature. The balance has a capacity of 50.0 kg and a resolution of g. The reproducibility is typically ± g. Three replicate of the mass of the evacuated cylinder were made. Each measurement was bracketed by a mass measurement of the control cylinder and a zero mass reading. The evacuated cylinder was then reattached to the manifold and the manifold was purged, vented and evacuated at least four times with ultra-pure Nitrogen and then with the SO 2 /N 2 parent mix. The candidate parent cylinder was pressurized to 0.9 kpa with its ( ± ) % SO 2 premix. It was then allowed to equilibrate for one hour to achieve room temperature. The manifold was then repressurized with the parent mix and the candidate parent cylinder was adjusted to the final fill pressure. The cylinder valve was closed and the cylinder was again placed near the double pan balance overnight to equilibrate the cylinder temperature before weighing. The cylinder was then weighed as before. The cylinder was reattached to the manifold and the manifold was purged, vented and evacuated at least four times with ultra-pure Nitrogen. The candidate cylinder was filled to 12.5 MPa utilizing two cylinders of ultra-pure Nitrogen. The candidate parent cylinder was allowed to rest for three hours after ultra-pure Nitrogen addition to achieve temperature equilibration with the room. The manifold was then repressurized with ultra-pure Nitrogen and the cylinder was adjusted to the final fill pressure of 12.5 MPa. After filling, the cylinder valve was closed and the cylinder was again placed near the double pan balance overnight to equilibrate the cylinder temperature before weighing. The cylinder was then weighed as before. When weighing was completed, the contents of the cylinder were mixed by rolling for 4 hours on a cylinder roller. The concentration was then calculated from the masses of the added gases and the measured purity of the gases. Preparation of comparison cylinders Thirty aluminum compressed gas cylinders with internal volumes of approximately 6 L were purchased from a specialty gas company. and were used to prepare the sample mixtures. They were filled in a manner that meets or exceeds the guidelines outlined in ISO The cylinders were connected in groups of five to a five-station fill manifold along with the 1500 µ parent mix (Cylinder # CC63757) and a cylinder of ultra-pure Nitrogen. The cylinders had been filled by the cylinder provider to 13.8 MPa with a mixture of 100 µ sulfur dioxide in nitrogen to passivate the cylinder wall. The contents of the five candidate cylinders were vented, purged (138 kpa of ultra-pure Nitrogen) and evacuated a minimum of four times to less than 1.3 Pa. The final evacuation reduced the cylinder pressure to approximately 0.2 Pa. The five cylinders were then placed near the single pan balance overnight to allow for the temperature of the cylinders to equilibrate to room temperature. The single pan balance has a capacity of 10.0 kg and a resolution of 0.01 g. The reproducibility is typically ± 0.02 g. 3
4 Four replicate of the mass of each evacuated cylinder were made. Each measurement was bracketed by a mass measurement of the control cylinder and a zero mass reading. The evacuated cylinders were then reattached to the manifold and the manifold was purged, vented and evacuated at least four times with ultra-pure Nitrogen and then with the SO 2 /N 2 parent mix. The five candidate cylinders were simultaneously opened and filled with SO 2 parent mix to a predetermined pressure. They were then allowed to equilibrate for one hour to achieve room temperature. The manifold was then repressurized with the parent mix and the cylinders were adjusted to the final fill pressure. The cylinder valves were closed and the cylinders were again placed near the balance overnight to equilibrate the cylinder temperature before weighing. Each cylinder in the group was then weighed as before. The cylinders were then reattached to the manifold and the manifold was purged, vented and evacuated at least four times with ultra-pure Nitrogen. Each candidate cylinder was consecutively opened and filled with ultrapure Nitrogen to the final predetermined topping pressure. Each group of five candidate samples utilized two cylinders of ultra-pure Nitrogen to fill them to 12.5 MPa. The candidate cylinders were allowed to rest for three hours after ultra-pure Nitrogen addition to achieve temperature equilibration with the room. The manifold was then repressurized with ultra-pure Nitrogen and each cylinder was adjusted to the final fill pressure of 12.5 MPa. After filling, the cylinder valve was closed and the cylinders were again placed near the balance overnight to equilibrate the cylinder temperature before weighing. The cylinders were then weighed as before. When weighing was completed, the contents of the cylinders were mixed by rolling for 2 hours on a cylinder roller. The concentrations were then calculated from the masses of the added gases. Verification of Parent Cylinder The SO 2 content of the parent cylinder was verified using a pulsed fluorescence process analyzer (NIST # ). Sample selection was achieved using Computer Operated Gas Analysis System (COGAS # 7). Sample flow of 1 liter/minute was controlled by a mass flow controller. The parent gas cylinder, CC63757, served as the control cylinder. Fifteen ratios of each of five PSMs to the control cylinder were obtained over a three-day period giving a total of seventy five data points: PSM cylinder # FF18162 ( ± 1.3) µ SO 2 /N 2 PSM cylinder # CAL365 ( ± 1.3) µ SO 2 /N 2 PSM cylinder # FF38016 ( ± 1.0) µ SO 2 /N 2 PSM cylinder # FF19629 ( ± 1.0) µ SO 2 /N 2 PSM cylinder # FF16954 ( ± 0.62) µ SO 2 /N 2 An ISO 6143 data analysis procedure was used to evaluate the data. A linear calibration function was found to give excellent results, the predicted line crossing all calibration points within the assigned uncertainty. The predicted value of cylinder CC63757 using five NIST PSMs was ( ± 1.54) µ sulfur dioxide. The gravimetric value assignment was ( ± 0.54) µ sulfur dioxide. The parent cylinder passed this verification step. 4
5 Verification of Candidate Comparison Cylinders The SO 2 content of each comparison cylinder was verified prior to shipment to the participants using a pulsed fluorescence process analyzer (NIST # ). Sample selection was achieved using Computer Operated Gas Analysis System (COGAS # 7). Sample flow of 1 liter/minute was controlled by a mass flow controller. LS 95-JL-03 served as the control cylinder. Eight ratios of each comparison cylinder to the control cylinder were obtained over a two-day period. The pulsed fluorescence detector response was 1 st order and gave excellent results. The ISO 6143 data analysis procedure was used to evaluate the data. The control cylinder contained a gravimetric value assignment of ( ± 0.008) µ SO 2. The highly collinear response curve demonstrates that the preparation of the gravimetric suite was quite accurate. All comparison cylinder gravimetric values were well within the analytical uncertainty of our. The comparison cylinders passed the verification step and were sent to the participants. Verification of Returned Comparison Cylinders The participants we asked to return the comparison cylinders to NIST after their analyses were completed. All participants except for NPLI returned their cylinder, and these cylinders were reanalyzed in September and October of A control cylinder was analyzed along with the returned cylinders according to normal NIST procedures. The control cylinder was then reanalyzed against sulfur dioxide gravimetrically prepared gas standards. The data are presented in Figure 1. No visible trend in the data is apparent, the average of the data indicated a µ bias which was well within the analytical uncertainty of 0.27 µ. The difference between the NIST gravimetric value and the NIST verification data completed in October of 2010 was added into the overall uncertainty by assuming a rectangular distribution and dividing the difference by the square root of 3. Cylinder SG080114A, which was sent to NPLI was never returned to NIST, as the cylinder was deemed to hazardous to travel by air freight. It is assumed in this report that this cylinder s stability is in line with the rest of the cylinder population. After preliminary results were displayed at the CCQM Gas Analysis Working Group meeting in November of 2010, IPQ asked that NIST complete another analysis of their cylinder as the verification demonstrated a possible bias in the positive direction. NIST repeated the verification of this cylinder and obtained a value of µ, which agrees with the previous verification values. Key Comparison Reference Value All of the comparison cylinders passed the verification performed in October of 2010 after return from the participants. Therefore, the NIST gravimetrically calculated value and uncertianty is used within this report as the Key Comparison Reference Value (KCRV). Participant s The participants reports are appended to this report. The reported intrumental method and calibration standards used are summarized in Table 1. Four participants reported using primary standards obtained from another NMI (VSL and NMIJ). All other participants reported using primarys standards prepared at their facility from pure sulfur dioxide. A total of eight participants used a pulsed fluorescence instrument, one used a UV absorption, and the remaining seven participants used NDIR. There was no correlation between the degrees of equivalence and the method used, or the source of the primary standards. The 5
6 analytical results reported by each participant is listed in Table 2, and presented in graphical form in Figure 2. Table 3 presents the results in tabular form. The gravimetric value and uncertainty was calculated according to ISO 6142 and is the KCRV. The verification results were otained from the analyses conducted on the returned cylinders in October of The verification uncertainty is a combination of the analytical uncertainty and the primary standard suite uncertainty calculated according to ISO An additional uncertainty component was included in the verification uncertainty, calculated from the diference between the gravimetric value and the verification value. This uncertainty was considered to have a rectangular distribution. The difference was divided by the square root of 3 and added in quadrature to the verification uncertainty. Finally, the degrees of equivalence are calculated in the prescribed manner, and presented for each participant in Table 3. The degrees of equivalence are displayed graphically in Figure 3. Finally, results of this comparison are presented intables 4 and 5, formatted for submission to the Key Comparison Database. Conclusion The results of all participants in this key comparison, except for three, are consistent with their KCRV. The three participants which are outside the KCRV interval are NIM, SMU, and NPLI. This compariosn may be used to demonstrate core analytical capabilities in accordance with the rules and procedures of the CCQM Gas Analysis Working group. 6
7 Figure 1: Verification of comparison cylinders in September 2009 and October Cylinder Verification Analyses Difference from Gravimetric Value (µ) Oct 2010 Sept A 80104A 80110A 80102A 80095A 80101A 80093A 80097A 80125A 80122A 80113A 80114A 80085A 80117A 80119A 80123A Cylinder Number 7
8 Table 1: Methods used by participating laboratories Participant Standards Instrumentation s CENAM 4 Primary Gas Standards prepared ISO 6142, measurement protocol ISO 6143 Pulsed Fluorescence, Thermo Environmental 3 s each with 3 sub Instruments Model 43C CERI 4 Primary Gas Standards, NMIJ provided pure SO2. NDIR, Shimadzu URA s, each with 3 sub GUM 7 Gas Standards, 4 certified by VSL, 3 from a producer, measurement protocol ISO Gas Standards provided by VSL via ISO 6142, measurement protocol ISO Gas Standards provided by VSL via ISO 6142, measurement protocol ISO 6143 Pulsed Fluorescence, Thermo Environmental Instruments Model 43C Infrared Analyzer Horiba VIA-510 NDIR URAS 14 3 s each with 10 sub INMETRO 6 s each with 8 sub IPQ 3 s each with 3 sub KRISS 4 Primary Gas Standards NDIR Siemens Ultramat 6 3 s each with 4 to 6 sub LNE Dynamic dilution using permeation at 350 n in air. Comparison Cylinder diluted to 350 n with air. Pulsed Fluorescence, Thermo Environmental Instruments 43-CTL 3 s each with 3 sub MKEH 4 Primary Gas Standards NDIR Maihak AG S s, each with 3 to 6 sub NIM NIST 4 Primary Gas Standards prepare ISO 6142, single point calibration (A-B-A-B-A sampling protocol) 5 Primary Gas Standards, measurement protocol ISO 6143 Pulsed Fluorescence, Thermo Environmental Instruments Model 43C Pulsed Fluorescence, Thermo Environmental Instruments Model 40B 6 s each with 4 to 7 sub 4 s, each with 4 sub NMISA 6 Primary Gas Standards prepared ISO 6142, measurement protocol ISO 6143 Fischer-Rosemount NGA 2000 UV Fluorescence 3 s each with 3 sub NPL NPLI SMU VNIIM VSL 2 Primary Gas Standards, measurement protocol direct comparison 1 Primary Gas Standard (8.15 µ), single point calibration 8 Primary Gas Standards prepared ISO 6142, measurement protocol ISO Primary Gas Standards prepared ISO 6142, measurement protocol ISO Primary Gas Standards prepared ISO 6142, measurement protocol ISO 6143 NDIR Horiba VIA-510 Fluorescent Analyzer, Teledyne 100A Pulsed Fluorescence, Thermo Environmental Instruments Model 43C UV adsorption, Perkin Elmer Lambda 900 NDIR, ABB URAS-14 8 against each primary standard (2) 4 s, each with 4 sub 3 s each with 20 sub 4 s each with4 sub 3 s each with 3 sub 8
9 Table 2: Values reported by participating laboratories Participant Comparison cylinder Reported Value (µ) Reported Uncertainty (µ) CENAM SG080089A CERI SG080104A GUM SG080110A INMETRO SG080102A IPQ SG080095A KRISS SG080101A LNE SG080093A MKEH SG080097A NIM SG080125A NIST SG080122A NMISA SG080113A NPL SG080114A NPLI SG080085A SMU SG080117A VNIIM SG080119A VSL SG080123A
10 Figure 2: s submitted by participants, k= % Submitted s (k=1) 3.00% %Relative Difference from KCRV 2.50% 2.00% 1.50% 1.00% 0.50% 0.00% -0.50% -1.00% -1.50% CENAM CERI GUM INMETRO IPQ KRISS LNE MKEH NIM NIST NMISA NPL NPLI SMU VNIIM VSL Participant 10
11 Figure 3: Calculated Degrees of Equivalence 4.00 Degrees of Equivalence Di (µ) CENAM CERI GUM INMETRO IPQ KRISS LNE MKEH NIM NIST NMISA NPL NPLI SMU VNIIM VSL Participant 11
12 Table 3: Comparison results table with Degrees of Equivalence Cylinder# Participant Grav uncert Ver uver u i ref Lab uncert D i u i ref U i ref % rel x i grav u i grav x i ver u i ver [u 2 i grav +u 2 i ver ] 1/2 x i u i res (x i - x i grav) [u 2 i ref +u 2 i res ] 1/2 2*u i ref (x i - x i grav) /x i grav x i grav u i grav SG080089A CENAM ± % SG080104A CERI ± % SG080110A GUM ± % SG080102A INMETRO ± % SG080095A IPQ ± % SG080101A KRISS ± % SG080093A LNE ± % SG080097A MKEH ± % SG080125A NIM ± % SG080122A NIST ± % SG080113A NMISA ± % SG080114A NPL ± % SG080085A NPLI ± % SG080117A SMU ± % SG080119A VNIIM ± % SG080123A VSL ± % 12
13 Table 4: Key comparison CCQM-K76 MEASURAND : Amount-of-substance fraction of Sulfur Dioxide in nitrogen NOMINAL VALUE : 100 µ x Labi result of measurement carried out by laboratory i u Labi combined standard uncertainty of x Labi x i ref reference value for the cylinder sent to laboratory i (see page 6 of the Final Report) u i ref combined standard uncertainty of x i ref Lab i Cylinder number x Labi / (µ) u Labi / (µ) x i ref / (µ) u i ref / (µ) CENAM SG080089A CERI SG080104A GUM SG080110A INMETRO SG080102A IPQ SG080095A KRISS SG080101A LNE SG080093A MKEH SG080097A NIM SG080125A NIST SG080122A NMISA SG080113A NPL SG080114A NPLI SG080085A SMU SG080117A VNIIM SG080119A VSL SG080123A CENAM SG080089A
14 Table 5: Key comparison CCQM-K76 MEASURAND : Amount-of-substance fraction of Sulfur Dioxide in nitrogen NOMINAL VALUE : 100 µ Key comparison reference value: there is no single reference value for this comparison, the value x i ref is taken as the reference value for laboratory i. The degree of equivalence of each laboratory i with respect to the reference value is given by a pair of terms: D i = (x Labi - x i ref), and its associated expanded uncertainty (k = 2) U i, both expressed in µ. No pair-wise degrees of equivalence are computed for this key comparison. Lab i D i U i / (µ) CENAM CERI GUM INMETRO IPQ KRISS LNE MKEH NIM NIST NMISA NPL NPLI SMU VNIIM VSL
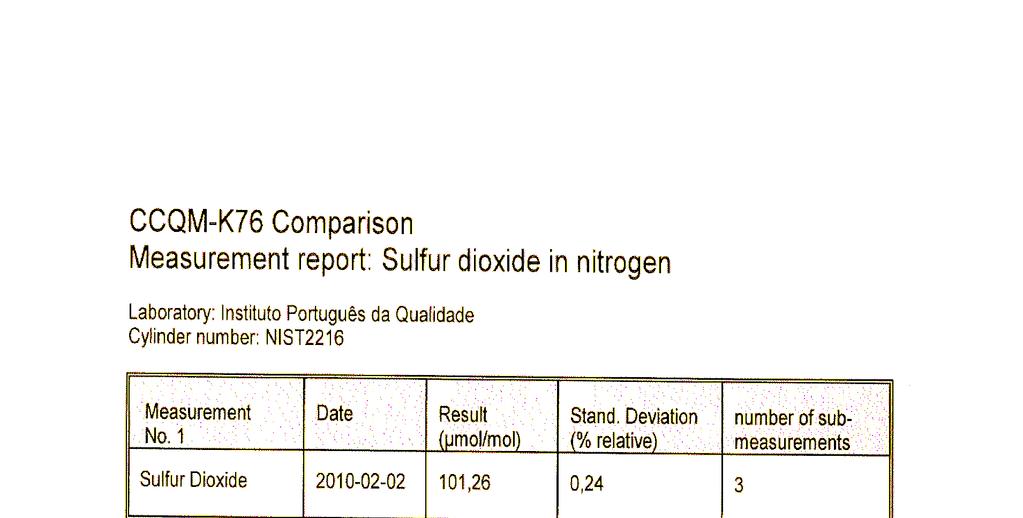
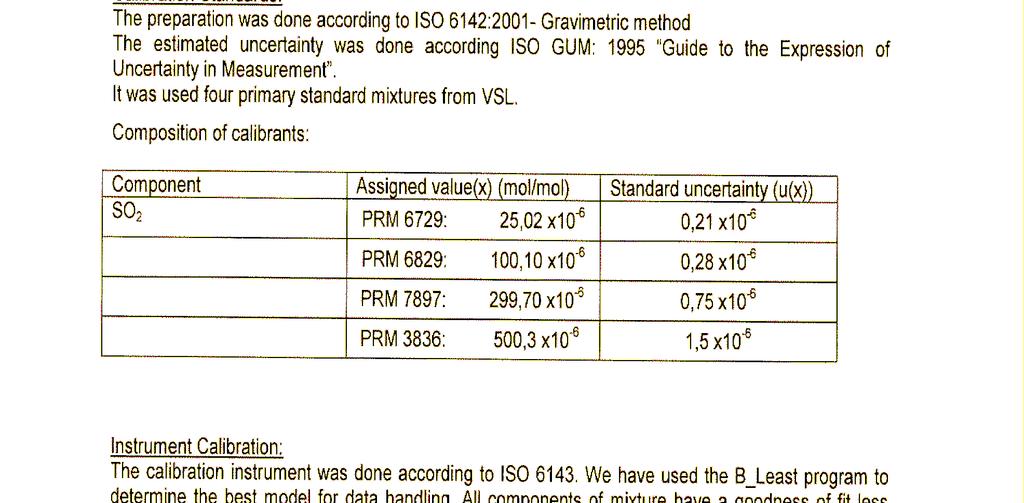
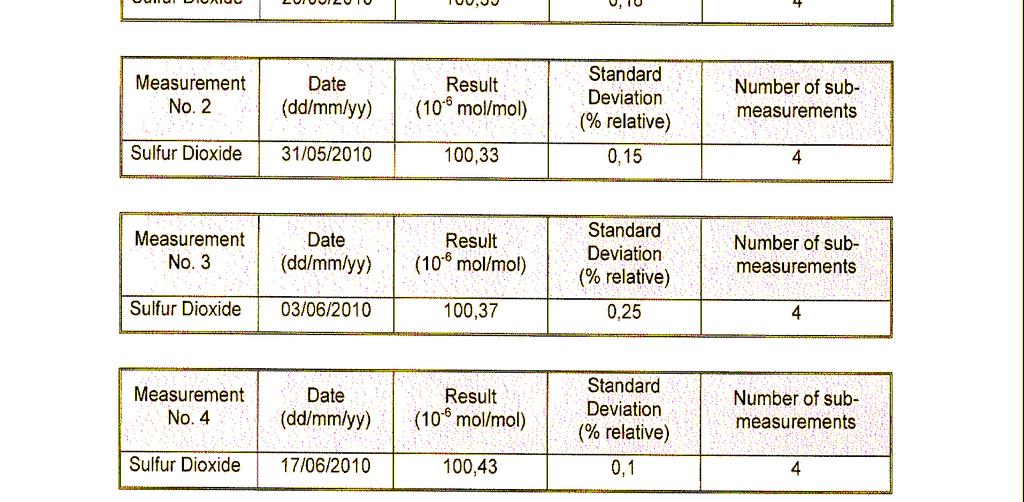
15 CCQM-K76 Comparison report: Sulfur dioxide in nitrogen Laboratory: CENAM Cylinder number: SG A No. 1 (% ) Stand. Deviation (% relative) Sulfur Dioxide 2010/05/ E E-01 3 No. 2 (% ) Stand. Deviation (% relative) Sulfur Dioxide 2010/05/ E E-02 3 No. 3 (% ) Stand. Deviation (% relative) Sulfur Dioxide 2010/05/ E E
16 Summary s: result Assigned expanded Gas mixture (assigned value) Coverage factor uncertainty (*) (% ) (% ) Sulfur Dioxide E E-05 Reference Method: The SO 2 content of sample CCQM-K76 was analyzed using a pulsed fluorescence analyzer Thermo Environmental Instruments Inc. model 43 C High level. The sample was compared to four primary standards mixtures prepared gravimetrically using the guide ISO It was used a Hewlett Packard model 34401A analog multimeter to collect the responses of the analyzer. Calibration Standards: The calibration standards used to calibrate the pulsed fluorescence analyzer model 43C were four primary standards mixtures (PSMs) of SO 2 in N 2. They were prepared according International Standard ISO 6142:2000 by CENAM. DMR-454Ia Component Assigned Value Expanded uncertainty Sulfur dioxide E E-07 DMR-454IIa (Control sample) Component Assigned Value Expanded uncertainty Sulfur dioxide E E-07 16
17 DMR-434b Component Assigned Value Expanded uncertainty Sulfur dioxide E E-07 DMR-454IIIa Component Assigned Value Expanded uncertainty Sulfur dioxide E E-07 DMR-454IVa Component Assigned Value Expanded uncertainty Sulfur dioxide E E-07 Instrument Calibration: The calibration instrument was done according to ISO We have used the B_Least program to determine the best model for data handling. To SO 2 have a goodness of fit less than 2 using a linear function. We have used a set of four concentration levels and one control sample in the following sequence: CStd 1 CStd 2 CMCStd 3 CCont.CStd 5 C... At least three repeated analyses were performed in three independent days. Sample Handling: After the cylinder arrives to laboratory it was stabilized at room temperature, the cylinder was rolled to homogenize the mixture. Before sample and standards cylinders were equipped with a two stage regulator and flushed by at least five times. To transfer the sample and standard gas to the analyzer was used SS tubing of 1/4. The flow rate of sample and standard gas was controlled by low pressure regulator. Uncertainty: The main sources of uncertainty considered to estimate the combined standard uncertainty are derived from the: Model used for evaluating measurement uncertainty: 17
18 C = µ + δ + δ + δ T s m The combined uncertainty has three contributions: a) Reproducibility and Repeatability. The combined effect (δ T ) of the reproducibility and repeatability was evaluated by the statistical method of analysis of variance. b) Mathematical model effect (δ m ). This component corresponds to the estimated uncertainty which come from the B_Least program software for multipoint Calibration. c) Performance instrument (δ s ) Variability observed using a Primary Standard Mixture as a sample control. Coverage factor: k=2 Expanded uncertainty: It was obtained by the product of the combined standard uncertainty and a factor of 2 and it was calculated according to the Guide to the Expression of Uncertainty in, BIPM, IEC, IFCC, ISO, IUPAC, IUPAP, OIML (1995) a) Uncertainty table: Uncertainty source Estimate Assumed distribution Standard uncertainty Sensitivity coefficient Contribution to standard uncertainty X I x I u(x i ) c I u I (y) Repeatibility and Reproducibility Normal Model Normal Performance Instrument Rectangular In addition, we measured the sample by FT-IR. Even agreement between UV-PF and FT-IR was found, a slight difference of the mean value of both methods remains, we do not include in this report the results of the FT-IR measurement because its susceptibility to isotopomeric variation, which was until now not corrected in the results. The FT-IR results could be available if required during the analysis of comparison results. CENAM Participants List: Alejandro Pérez Castorena, Manuel de Jesús Avila Salas, Jorge Koelliker Delgado, Francisco Rangel Murillo and Victor M. Serrano Caballero. 18
19 CCQM-K76 Comparison report: Sulfur dioxide in nitrogen Laboratory: Chemicals Evaluation and Research Institute, Japan (CERI) Cylinder number: SG080104A Stand. Deviation No. 1 (μ ) (% relative) Sulfur Dioxide 15/03/ Stand. deviation No. 2 (μ) (% relative) Sulfur Dioxide 16/03/ Stand. deviation No. 3 (μ) (% relative) Sulfur Dioxide 17/03/ Stand. deviation No. 4 (μ) (% relative) Sulfur Dioxide 25/03/
20 Summary s: Gas mixture (assigned value) Coverage factor Assigned expanded uncertainty Sulfur Dioxide μ μ Reference Method: Principle: NDIR Make: SHIMADZU CORPORATION Type: URA-107 Calibration Standards: Preparation method: Gravimetric Purity analyses SO 2 : NMIJ-CRM N2: The purity is calculated as below. And impurities in N 2 are determined by analysis. N x pure = 1 x i i= 1 where, x i =mole fraction of impurity i N=number of impurities x pure =mole fraction purity of pure gas (SO 2 ) 20
21 21 Instrument Calibration: Describe your Calibration procedure (mathematical model/calibration curve, number and concentrations of standards, measurement sequence, temperature/pressure correction etc.): Calibration Curve, Quadratic regression was used for calibration curve. Its formula is as follow. y = a x 2 + b x + c Where, y: Sample concentration n : Standard material quantity x: Output value of K76 gas mixture xi : Output value of gas standard i yi : Concentration of gas standard i { } ) ( ) ( ) ( ) ( ) ( ) ( ) ( xx S x x S xx S xx S xy S xx S y x S a = { } ) ( ) ( ) ( ) ( ) ( ) ( ) ( xx S x x S xx S xx S y x S x x S xy S b = n x a n x b n y c i i i = 2 ( ) ( ) = n x x xx S i i 2 2, ( ) = n y x y x xy S i i i i ( ) = n x x x xx S i i i 2 3 2, ( ) = n y x y x y x S i i i i ( ) ( ) = n x x x x S i i
22 Standards, 4 PRMs were used for this key comparison. Its concentration is as below table. 22
23 Table Concentration of PRMs Concentration μ R R R R sequence, R 1 R 2 K76 gas mixture R 3 R 4 Sample Handling: Cylinder Regulator with needle valve (outlet pressure : 0.05MPa) Crossover 4-way valve NDIR Digital flow mater (DFM) NDIR DFM Vent Zero gas Uncertainty: There are potential sources that influence the uncertainty of the final measurement result. Depending on the equipment, the applied analytical method and the target uncertainty of the final result, they have to be taken into account or can be neglected. 23
24 Describe in detail how estimates of the uncertainty components were obtained and how they were combined to calculate the overall uncertainty: b) Uncertainty table: Uncertainty source Estimate Assumed distribution Standard uncertainty Sensitivity coefficient Contribution to standard uncertainty u(x i ) c I u I (y) X I x I Gravimetric preparation of standard (100.96µ) µ normal µ µ Verification µ normal µ µ Stability µ rectangular µ µ Repeatability of measurement µ normal µ µ Combined uncertainty: μ Coverage factor: 2 Expanded uncertainty: 0.60μ 24
25 CCQM-K76 Comparison report: Sulfur dioxide in nitrogen Laboratory: Central Office of Measures (GUM) Cylinder number: SG A Stand. Deviation No. 1 (% ) (% relative) Sulfur Dioxide , ,35 10 Stand. deviation No. 2 (% ) (% relative) Sulfur Dioxide , ,33 10 Stand. deviation No. 3 (% ) (% relative) Sulfur Dioxide , ,34 10 Note: Please copy this table as many times as needed for reporting additional 25
26 Summary s: Gas mixture result Coverage factor Assigned expanded (assigned value) uncertainty (*) (% ) (% ) Sulfur Dioxide 0, ,00010 Reference Method: Describe your instrument(s) (principles, make, type, configuration, data collection etc.): The were repeated 10 times for the standards and sample by pulsed fluorescence SO 2 analyzer, made by Thermo, model 43C. Calibration Standards: Describe your Calibration Standards for the (preparation method, purity analyses, estimated uncertainty etc.): Three standards (No. 1, 3, 6) were prepared by gravimetric method according to ISO 6142 from separate premixtures. The cylinders were evacuated on turbo molecular pump, filled up an weighted on the verification balance. The standards were prepared in aluminum (with coated layers) cylinders. The purity of pure gases used for preparation was taken from the certificates of producer (purity of SO 2-3.8; purity of N 2-6.0). Four standards (No. 2, 4, 5, 7) were calibrated by VSL. The standards were (and still are) under metrological control since Composition of calibration standards: No. Cylinder number Component Assigned value (x) [] Expanded uncertainty (u(x)) [] (k=2) 1 D SO 2 9, , D SO 2 19, , D SO 2 34, , D SO 2 50, , D SO 2 63, , D SO 2 79, ,
27 7 D SO 2 99, , Instrument Calibration: Describe your Calibration procedure (mathematical model/calibration curve, number and concentrations of standards, measurement sequence, temperature/pressure correction etc.): Calibration method according to ISO The calibration curve was calculated from ratios by the software B_leats.exe (linear case). sequence: zero gas, standards (for calculation of calibration curve) and sample. Sample Handling: How were the cylinders treated after arrival (stabilized) and how were samples transferred to the instrument? (Automatic, high pressure, mass-flow controller, dilution etc).: The cylinders (standards and sample) were in the same room for the whole time also during the (temperature stabilization) and the mixtures were mixed up before the. Samples were transferred to the instrument by the manifold. Uncertainty: There are potential sources that influence the uncertainty of the final measurement result. Depending on the equipment, the applied analytical method and the target uncertainty of the final result, they have to be taken into account or can be neglected. The final uncertainty was calculated according to ISO 6143 and consists of the following components: - the uncertainty of the standards - the standard deviation of the measurement - resolution of the analyzer. Describe in detail how estimates of the uncertainty components were obtained and how they were combined to calculate the overall uncertainty: c) Uncertainty table: 27
28 Uncertainty source X I cylinder no. D cylinder no. D cylinder no. D cylinder no. D cylinder no. D cylinder no. D cylinder no. D resolution of the analyzer standard deviation for cylinder no. D standard deviation for cylinder no. D standard deviation for cylinder no. D standard deviation for cylinder no. D standard deviation for cylinder no. D standard deviation for cylinder no. D standard deviation for cylinder no. D Estimate x I 9, , , , , , , , , , , , , , , Assumed distribution normal normal normal normal normal normal normal square normal normal normal normal normal normal normal Standard uncertaint u(x i ) 0, , , , , , , , , , , , , , , Sensitivity coefficient c I Contribution to standard uncertainty u I (y) 0, , , , , , , , , , , , , , , Standard deviation for cylinder no. SG A 98, normal 0, , Coverage factor: 2 28
29 Expanded uncertainty: 1, Laboratory: INMETRO/LABAG Cylinder number: 05A08 CCQM-K76 Comparison report: Sulfur dioxide in nitrogen Stand. Deviation No. 1 (µ ) (% relative) Sulfur Dioxide 03/03/ Stand. deviation No. 2 (% ) (% relative) Sulfur Dioxide 04/03/ Stand. deviation No. 3 (% ) (% relative) Sulfur Dioxide 10/03/ Stand. deviation No. 4 (% ) (% relative) Sulfur Dioxide 11/03/
30 30
31 Stand. deviation No. 5 (% ) (% relative) Sulfur Dioxide 12/03/ Stand. deviation No. 6 (% ) (% relative) Sulfur Dioxide 16/03/ Note: Please copy this table as many times as needed for reporting additional Summary s: Gas mixture result Coverage factor Assigned (assigned value) expanded uncertainty (*) Sulfur Dioxide Reference Method: Describe your instrument(s) (principles, make, type, configuration, data collection etc.): To analyse the component SO 2, the infrared analyser (HORIBA - model VIA-510) was used. 31
32 Measuring range to analyse SO 2 : 0-200/1000/1500/2500 ppm. In this case, range was utilized. Analysers out put: 0 10 V Calibration Standards: Describe your Calibration Standards for the (preparation method, purity analyses, estimated uncertainty etc.): Four standards were used to calibrate the infrared analyser model VIA-510 to analyse SO 2. They were prepared according International Standard ISO 6142:2001 by VSL. PRM SG Component Assigned value( x) 10-6 Standard uncertainty (u(x)) 10-6 Sulfur dioxide PRM D Component Assigned value( x) 10-6 Standard uncertainty (u(x)) 10-6 Sulfur dioxide PRM D Component Assigned value( x) 10-6 Standard uncertainty (u(x)) 10-6 Sulfur dioxide PRM D Component Assigned value( x) 10-6 Standard uncertainty (u(x)) 10-6 Sulfur dioxide 250,6 0,5 32
33 PRM D Component Assigned value( x) 10-6 Standard uncertainty (u(x)) 10-6 Sulfur dioxide 400,1 0,8 Instrument Calibration: Describe your Calibration procedure (mathematical model/calibration curve, number and concentrations of standards, measurement sequence, temperature/pressure correction etc.): The standards used are listed above. The injection was done manually. The order of the injections was: first injection the standards and then injection the sample. They were injected eight times. And the calibration was done according ISO 6143, the best model was determined using the software B_Least, and in this case quadratic model was utilized. Sample Handling: How were the cylinders treated after arrival (stabilized) and how were samples transferred to the instrument? (Automatic, high pressure, mass-flow controller, dilution etc).: After arrival in the laboratory, the cylinder was stabilised at room temperature (21ºC and humidity of 55%) before. The standards and sample were transferred directly to the infrared analyser using a system composed of pressure regulator, flow meter and control valves. Uncertainty: There are potential sources that influence the uncertainty of the final measurement result. Depending on the equipment, the applied analytical method and the target uncertainty of the final result, they have to be taken into account or can be neglected. The uncertainty of the unknown sample was calculated according to ISO 6143, using the software B_least. The combined uncertainty was multiplied by a coverage factor of 2 with a confidence interval of 95%. Three sources of uncertainty were considered: Uncertainty of the standards (certificate type B) Uncertainty of the area (analysis type A) Calibration curve (type A) Describe in detail how estimates of the uncertainty components were obtained and how they were combined to calculate the overall uncertainty: 33
34 d) Uncertainty table: Uncertainty source Estimate Assumed distribution Standard uncertainty Sensitivity coefficient Contribution to standard uncertainty u(x i ) c I u I (y) X I x I Coverage factor: Expanded uncertainty: 34
35 CCQM-K76 Comparison report: Sulfur dioxide in nitrogen Laboratory: KRISS Cylinder number: NISD100U-A3N No. 1 (μ) Stand. Deviation (% relative) Sulfur Dioxide No. 2 (μ) Stand. deviation (% relative) Sulfur Dioxide No. 3 (μ) Stand. deviation (% relative) Sulfur Dioxide Summary s: Gas mixture result (assigned value) Coverage factor Assigned expanded uncertainty (*) Sulfur Dioxide μ μ Reference Method: Describe your instrument(s) (principles, make, type, configuration, data collection etc.): The SO 2 was analyzed using a NDIR analyzer (Ultramat 6, Siemens). 4 PRMs ranging from 90 to 120 μ and K76 cylinder were connected to a computer operated gas sampling system. data was collected and plotted by this system. 35
36 36
37 Calibration Standards: Describe your Calibration Standards for the (preparation method, purity analyses, estimated uncertainty etc.): All PRMs used for the measurement were prepared gravimetrically form the serial dilution of high purity SO 2 gas. Assigned value (μ) Standard uncertainty (μ) Instrument Calibration: Describe your Calibration procedure (mathematical model/calibration curve, number and concentrations of standards, measurement sequence, temperature/pressure correction etc.): NDIR analyzer was calibrated with 4 PRMs ranging from 90 to 120 μ and calibration curve was linear. sequence was as follows : PRM 100 PRM 90 K76 PRM 110 PRM 120 PRM 100 Sample Handling: How were the cylinders treated after arrival (stabilized) and how were samples transferred to the instrument? (Automatic, high pressure, mass-flow controller, dilution etc): K76 cylinder and PRMs were allowed in the laboratory more than 3 days before testing began. 4 PRMs and K76 cylinder were connected to a gas sampling system. Sampling sequences and flow rate (300 ml/min) were controlled by a gas sampling system, and measurement data was collected and plotted in real time. Uncertainty: There are potential sources that influence the uncertainty of the final measurement result. Depending on the equipment, the applied analytical method and the target uncertainty of the final result, they have to be taken into account or can be neglected. Describe in detail how estimates of the uncertainty components were obtained and how they were combined to calculate the overall uncertainty: 37
38 e) Uncertainty table: Analyte Relative standard uncertainties (%) Gravimetry Analysis Stability Expanded Uncertainty (μ) Coverage factor SO Coverage factor: 2 Expanded uncertainty:
39 CCQM-K76 Comparison report: Sulfur dioxide in nitrogen Laboratory: Laboratoire National de métrologie et d Essais (LNE) Cylinder number: SG080093A Stand. Deviation No. 1 (µ) (% relative) Sulfur Dioxide 2010/02/ Stand. deviation No. 2 (µ) (% relative) Sulfur Dioxide 2010/03/ Stand. deviation No. 3 (µ) (% relative) Sulfur Dioxide 2010/03/ Note: Please copy this table as many times as needed for reporting additional Summary s: Gas mixture result Coverage factor Assigned (assigned value) expanded uncertainty (*) 39
40 Sulfur Dioxide Reference Method: Describe your instrument(s) (principles, make, type, configuration, data collection etc.): A 43-CTL (TEI) analyser based on the principle of UV fluorescence is used to measure the SO 2 concentrations. Calibration Standards: Describe your Calibration Standards for the (preparation method, purity analyses, estimated uncertainty etc.): Reference dynamic gas mixtures of SO 2 in air (at about 350 n) are generated by the LNE reference method which is the permeation method. Instrument Calibration: Describe your Calibration procedure (mathematical model/calibration curve, number and concentrations of standards, measurement sequence, temperature/pressure correction etc.): A reference gas mixture is generated by permeation at a concentration slightly upper to the concentration of the unknown gas mixture (about 350 n) and injected inside the analyser : the analyser is calibrated with this dynamic reference gas mixture. The unknown gas mixture at about 100 µ is diluted at about 350 n with zero air : this diluted unknown gas mixture is then injected inside the analyser and the response is equal to the concentration of the diluted unknown gas mixture (C ). The SO 2 concentration of the unknown gas mixture C is given by the following formula: With : C D 1 D 2 C' ( D C = D 1 + D2 ) the concentration of the diluted unknown gas mixture the flowrate of the SO 2 unknown gas mixture (SO 2 cylinder) the flowrate of the dilution gas (air) This procedure is carried out 3 times on 3 different days. 1 The SO 2 concentration is the mean of the 9 obtained values. Sample Handling: How were the cylinders treated after arrival (stabilized) and how were samples transferred to the instrument? (Automatic, high pressure, mass-flow controller, dilution etc).: Cylinders were maintained inside a laboratory at a nominal temperature of (21±2) C for all the period. Samples were introduced into the analyser via a normal gas regulator and an overflow valve. 40
41 Uncertainty: There are potential sources that influence the uncertainty of the final measurement result. Depending on the equipment, the applied analytical method and the target uncertainty of the final result, they have to be taken into account or can be neglected. Describe in detail how estimates of the uncertainty components were obtained and how they were combined to calculate the overall uncertainty: 1) Uncertainty on each concentration of the diluted unknown gas mixture The first step consists in the estimation of the standard uncertainty on each diluted value. The SO 2 concentration of the diluted unknown gas mixture C is given by : DT L 9 C ' = 10 M DT DDil L + M V sample With : D T the rate of the SO 2 permeation tube M the SO 2 molar mass D Dil the flowrate of the dilution gas (air) V the SO 2 molar volume L sample the reading for the diluted unknown gas mixture L réf the reading for the reference gas mixture generated by permeation réf An example of an uncertainty budget on one of the 9 obtained diluted values is given in the following table. Uncertainty source x I Assumed distribution Standard uncertainty u(x i ) (n) Sensitivity coefficient c I Contribution to standard uncertainty u I (y) Rate of the SO 2 permeation tube (D T ) SO 2 molar mass (M) Flowrate of the dilution gas (D Dil ) SO 2 molar volume (V) Reading for the reference gas mixture generated by permeation (L réf ) 355 rectangular Reading for the 344 rectangular
42 diluted unknown gas mixture (L sample ) Concentration of the diluted unknown gas mixture (C ) n Expanded uncertainty n 2) Uncertainty on each concentration of the unknown gas mixture Then, the standard uncertainty is calculated for each concentration of the unknown gas mixture C as described in the following example. Uncertainty source x I Assumed distribution Standard uncertainty u(x i ) Sensitivity coefficient c I Contribution to standard uncertainty u I (y) Concentration of the diluted unknown gas mixture (C ) Flowrate of the SO 2 unknown gas mixture (SO 2 cylinder) (D 1 ) Flowrate of the dilution gas (air) (D 2 ) Concentration of the unknown gas mixture (C) µ Expanded uncertainty µ 3) Uncertainty on the mean concentration of the unknown gas mixture The standard uncertainties obtained for the 9 values are sum up in the following table. 42
43 Concentrations of the unknown gas mixture (C) (µ) U(C) (µ) 2010/02/ /02/ /02/ /03/ /03/ /03/ /03/ /03/ /03/ The first step consists in calculating the mean standard uncertainty as following: 2 u ( C) u mean = = µmol / mol n The second step consists in the calculation of the standard deviation on the mean of the 9 obtained values. σ = µmol / mol The third step consists in the calculation of the expanded uncertainty on the mean concentration of the unknown gas mixture as following: U ( C) = 2 umean + σ = 2 (0.452) + (0.119) = 0.94 µmol / mol 43
44 CCQM-K76 Comparison report: Sulfur dioxide in nitrogen Laboratory: Hungarian Trade Licensing Office (MKEH) Cylinder number: SG080097A Stand. Deviation No. 1 (% ) (% relative) Sulfur Dioxide Stand. deviation No. 2 (% ) (% relative) Sulfur Dioxide Stand. deviation No. 3 (% ) (% relative) Sulfur Dioxide Stand. deviation No. 4 (% ) (% relative) Sulfur Dioxide Note: Please copy this table as many times as needed for reporting additional 44
45 Summary s: Gas mixture result Coverage factor Assigned (assigned value) expanded uncertainty (*) Sulfur Dioxide %() %() Reference Method: Describe your instrument(s) (principles, make, type, configuration, data collection etc.): NDIR sulfur dioxide analyzer (S 715, Maihak AG) in combination with a multimeter (model 2000, Keithley) was used to analyze SO 2 gas. The flow rate of the gases was controlled by EPC. The measurement method was direct comparison with a standard which has the same nominal concentration as the sample. Calibration Standards: Describe your Calibration Standards for the (preparation method, purity analyses, estimated uncertainty etc.): 4.67 L aluminum cylinders (Luxfer) with brass valves, high purity SO 2 (99.99%, Matheson) and N 2 (99.999%, Messer, Hungary) gases were used for the preparation of the primary standard gases. The mass of the gases were carried out by a high precision mechanic balance (HCE 25, Voland Corporation, USA) with repeatability of 2.8 mg and capacity of 25 kg. Instrument Calibration: Describe your Calibration procedure (mathematical model/calibration curve, number and concentrations of standards, measurement sequence, temperature/pressure correction etc.): MKEH primary standards: OMH272/ OMH264/ OMH209/ NG230/ SO 2 : ppm ± 0.80 ppm() SO 2 : ppm ± 0.80 ppm() SO 2 : ppm ± 0.80 ppm() SO 2 : ppm ± 0.80 ppm() The measurement with a MKEH primary standard with 100 ppm SO 2 nominal concentration. The standard gas and the sample gas were changed automatically in every 10. minute. 45
46 The temperature and pressure correction were not done. Sample Handling: How were the cylinders treated after arrival (stabilized) and how were samples transferred to the instrument? (Automatic, high pressure, mass-flow controller, dilution etc).: We used sulfinert gas regulator for the cylinders and 70 psi was set up on EPC, so the flow was stable. Uncertainty: There are potential sources that influence the uncertainty of the final measurement result. Depending on the equipment, the applied analytical method and the target uncertainty of the final result, they have to be taken into account or can be neglected. The potential sources of the uncertainty: Uncertainty of the primary reference material, it was taken into account not only the uncertainty of the preparation but the estimation of the absorption Uncertainty of the instrument Standard deviation of the 4 measurement series Describe in detail how estimates of the uncertainty components were obtained and how they were combined to calculate the overall uncertainty: f) Uncertainty table: Uncertainty source X I Estimate x I Assumed distribution Standard uncertainty u(x i ) Sensitivity coefficient c I Contribution to standard uncertainty u I (y) Standard reference material Sulfur dioxide analyzer Standard deviation of the 4 measurement series %() %() %() Normal Normal Normal Variancia
47 Coverage factor: 2 Expanded uncertainty: %() 47
48 CCQM-K76 Comparison report: Sulfur dioxide in nitrogen Laboratory: National Institute of Metrology (NIM), China Cylinder number: SG080125A Stand. deviation No. 1 (u) (% relative) Sulfur Dioxide Stand. deviation No. 2 (u) (% relative) Sulfur Dioxide Stand. deviation No. 3 (u) (% relative) Sulfur Dioxide Stand. deviation No. 4 (u) (% relative) Sulfur Dioxide
49 Stand. deviation No. 5 (u) (% relative) Sulfur Dioxide Stand. deviation No. 6 (u) (% relative) Sulfur Dioxide Note: Please copy this table as many times as needed for reporting additional Summary s: Gas mixture result (u) Coverage factor Assigned (assigned value) expanded uncertainty (u) Sulfur Dioxide Reference Method: Describe your instrument(s) (principles, make, type, configuration, data collection etc.): An UV SO2 Analyzer (43C, ThermoElectron, USA) was used to analyze the gas mixtures which the mearsuement range is 0~100µ. The gas flow was introduced into the analyzer at about 1L/min. In this case, the single point calibration was used to measure the CCQM comparison cylinder. Calibration Standards: Describe your Calibration Standards for the (preparation method, purity analyses, estimated uncertainty etc.): All of the references we used were prepared by the gravimetric method according to ISO in our lab. 49
50 50 The pure gases were checked before using to make sure that their purities were good enough and the impurities had no effect on the quality of reference gas mixtures. The pure gases included N 2 and SO2. The parent gases were filled into a 4-liter aluminum cylinder, which has been passed the special treatment. More than 10g parent gas was filled into the cylinder at least. The cylinder was weighed before and after the filling using a balance with a sensitivity of 1 mg. The concentration of reference gas was calculated according to the following equation. The uncertainty of reference gas included the contributions from gravimetric method The uncertainty from gravimetric method was calculated according to the following equation. ( ) ( ) ( ) s r s i q r q r s r i r q r r i i y y u f f f f y u f f x u, = = + = = Mass of parent gas filled, molecular weight and mole fraction of compound were the main sources of the uncertainty of gravimetric method. The reference gases used were listed in the following table: Cylinder Number Component and assigned value(x) u Relative standard uncertainty (u(x)) % % % % = = = = = P A n i i A i A P A n i i A i A A i i M x m M x m x x 1 1, 1 1,,
51 Instrument Calibration: Describe your Calibration procedure (mathematical model/calibration curve, number and concentrations of standards, measurement sequence, temperature/pressure correction etc.): Model equation for the measurement of comparison cylinder c CCQM H = H CCQM REF c REF. f int ro f int er c CCQM : Concentration of the SO2 in the comparison cylinder, in unit of µ; H CCQM : Signal reading of the comparison gas on SO2 analyzer, in unitofµ; H REF : Signal reading of the REF gas on SO2 analyzer, in unit of µ; c REF : Concentration of the SO2 in REF cylinder, in unit of µ; f int ro : repeatability in one day or one group f int er: reproducibility in different days or groups When testing sample, A-B-A-B-A type calibration procedure were used, That means the sample gas and reference gases were measured in the order of Reference Sample Reference Sample Reference. Single point calibration was used to calculate the concentration of target compound in sample cylinder. Sample Handling: How were the cylinders treated after arrival (stabilized) and how were samples transferred to the instrument? (Automatic, high pressure, mass-flow controller, dilution etc).: When package box including comparison cylinder arrived at the lab, it was in good state. Then the box was unpacked and the comparison cylinder was stored at room temperature. A SS regulator was connected to the cylinder. When testing SO 2 with 43C SO2 Analyzer, the reference and sample gases were directly introduced into the analyzer through a T type tube by the pump inside the instrument used. The flow rate was about 1L/min controlled by a flow controller. Another outlet of the T tube was vented to the atmosphere. There was a pressure regulator between the cylinder and the inlet of the T tube to control the total gas flow rate and make sure that about 100mL/min vent to the atmosphere. The venting flow rate was read from a flow meter. 51
52 Uncertainty: There are potential sources that influence the uncertainty of the final measurement result. Depending on the equipment, the applied analytical method and the target uncertainty of the final result, they have to be taken into account or can be neglected. The contributions of measurement uncertainty were from reference gas signal readings of the sample gas and reference gas repeatability in one day or one group and reproducibility in different days or groups u ( cccqm ) = u ( cref ) + u ( H CCQM ) + u ( H REF ) + u ( f int ra ) + u ( f int er ) Here, u means relative standard uncertainty. u ( c CCQM ) : uncertainty of concentration of the target component in the comparison sample gas cylinder. u ( H ) CCQM : Uncertainty of signal reading of the sample gas from 43C SO2 Analyzer. u ( H REF For the ) : Uncertainty of signal reading of the reference gas from 43C SO2Analyzer. H CCQM and H REF, the relative standard uncertainty could be calculated from the relative standard deviation (RSD) of the signal reading. The relative standard uncertainty is RSD/sqrt(n), where n is the number of signal reading. u ( c REF ) : Uncertainty of concentration of the reference gas, which was combined by the uncertainty from gravimetric u ( f int ra ) : Uncertainty of repeatability in one day or one group. The relative standard uncertainty of f int ra was calculated from the rela method according to ISO and the uncertainty from the stability of the reference gas.tive standard deviation (RSD) of repeating test in one day or one group. The relative standard uncertainty is RSD/sqrt(n), where n is the number of the repeating test. u ( f int er ) : Uncertainty of reproducibility in different days or groups. The relative standard uncertainty f int er was calculated from the relative standard deviation (RSD) of repeating test in different days or groups. The relative standard uncertainty is RSD/sqrt(n), where n is the number of the repeating test. 52
53 Describe in detail how estimates of the uncertainty components were obtained and how they were combined to calculate the overall uncertainty: g) Uncertainty table: The uncertainty table was calculated based on one measurement when the cylinder No.is Uncertainty source Estimate u Assumed distribution standard uncertainty u Sensitivity coefficient Contribution to standard uncertainty u X I x I u(x i ) c I u I (y) H CCQM normal H REF normal cref normal f int ro normal fint er normal : Quantity: c CCQM Value: 99.44µ Expanded uncertainty:u=0.51u Coverage factor:k=2 53
54 CCQM-K76 Comparison report: Sulfur dioxide in nitrogen Laboratory: National Institute of Standards and Technology Cylinder number: SG080122A Stand. deviation No. 1 (µ) (µ) Sulfur Dioxide 3/19/ Stand. deviation No. 2 (µ) (µ) Sulfur Dioxide 3/22/ Stand. deviation No. 3 (µ) (µ) Sulfur Dioxide 3/23/
55 Stand. deviation No. 4 (µ) (µ) Sulfur Dioxide 3/24/ Note: Please copy this table as many times as needed for reporting additional Summary s: Gas mixture result (assigned value) Coverage factor Assigned expanded (µ) Uncertainty (%) Sulfur Dioxide ± ± 0.24 Reference Method: The sulfur dioxide was analyzed using a ThermoFisher Model 40B Pulsed Fluorescence analyzer (NIST # ). A computer-operated gas sampling system (COGAS # 7) was used to deliver the sample stream to the analyzer. Prior to beginning, each analysis the sample line and regulator of each cylinder was purged five (5) times. The analyzer was user to measure the response ratio of each PRM cylinder to that of control cylinder (SG080122A). During each analytical run, the sample has a purge time of 3 minutes before data collection. The analyzer s internal pump would draw the sample into the unit from a 1 L/min slipstream. Each PRM was measured against the control four times during four different analytical periods. Calibration Standards: 55
56 Five NIST gravimetrically prepared primary reference materials ranging in concentration from 120 µ to 80 µ were used in this analysis. The PRMs are listed below: Cylinder Number Concentration (µ) Uncertainty (µ) FF CAL FF FF CAL These standards were prepared from different parent mixtures but all with the same source of balance gas (nitrogen). The table below gives an assay if the nitrogen used to prepare these standards. Mole fraction Uncertainty Component µ µ Sulfur Dioxide Argon Moisture Carbon Dioxide Nitrogen (Difference) Instrument Calibration: The instrument used in this study is a Pulsed Florescence analyzer. The instrument was calibrated using the five gravimetrically prepared PRMs ranging in concentration from 120 µ to 80 µ. The CCQM sample (SG080122A) was used as a control and compared to each PRMs a minimum of four times during each analytical periods. The analytical scheme used was, Control PRM Standard (1) Control PRM Standard (2) Control etc. The procedure called for each cylinder to have a three minutes of equilibration and one minute data collection period. A calibration curve with four replicate were run on each of four different days. Each curves were linear. Sample Handling: This analysis consist is for a single cylinder identified by CCQM-K76 SG080122A. The sample was fitted with acga-660 regulator and measured automatically using NIST data system (#601405) and a computer operated gas analysis system (COGAS #7). Prior to each run the regulator was flushed five times. Each run started and ended with a measurement of the zero gas, house nitrogen. The output pressure of each regulator was set to KPa. Cylinder flow was controlled using a mass flow 56
57 controller. The analyzer has an internal pump that draws in the sample at approximately 800 sccm though a bypass connection. The mass flow is set to provide sample flow in excess of what is needed by the analyzer. The excess sample flow is safely vented. Uncertainty: The identified sources of error are measure error; errors associated with the PRMs; within day variability (repeatability); and between day variability (reproducibility). The TYPE A measurement errors are determined from linear calibration data. The Type B errors are associated with the uncertainty of the PRMs. The combined uncertainty is calculated as the square root of the sum of the squares of the standard uncertainties for the within day, between day and PRM uncertainties. The following equations give the algorithm used to calculate the components of the combined uncertainty. Within Day Standard Uncertainty = 0.25*sqrt (sumsq (A1: Ax)) (1) Between Day Standard Uncertainty = ABS (MAX (A 1 : AX)-MIN (A 1 : AX)) / SQRT (12) (2) Uncertainty of the PRMs = 0.1% (Nominal Reference) (3) The coverage factor for the expanded uncertainty is 2. Uncertainty Table: Uncertainty source Estimate Assumed distribution Standard Uncertainty (%) Relative), u(x i ) Sensitivit y coefficie nt Contribution to standard uncertainty u I (y) X I x I c I 0.06% Between Day % Gaussian -.06 to a Gaussian to a 2? Gravimetric Standards 0.1% Uniform 0.13 to 0.15 a 3 (nominal ref) 1 57
58 Coverage factor: 2 Expanded uncertainty: ± 0.24 (%) CCQM-K76 Comparison report: Sulfur dioxide in nitrogen Laboratory: National Metrology Institution of South Africa Cylinder number: 3AL2216 Stand. Deviation No. 1 (% ) (% relative) Sulfur Dioxide 24/03/ ,37 0,10 3 Stand. deviation No. 2 (% ) (% relative) Sulfur Dioxide 26/03/ ,47 0,01 3 Stand. deviation No. 3 (% ) (% relative) Sulfur Dioxide 01/04/ ,60 0,
59 Note: Please copy this table as many times as needed for reporting additional 59
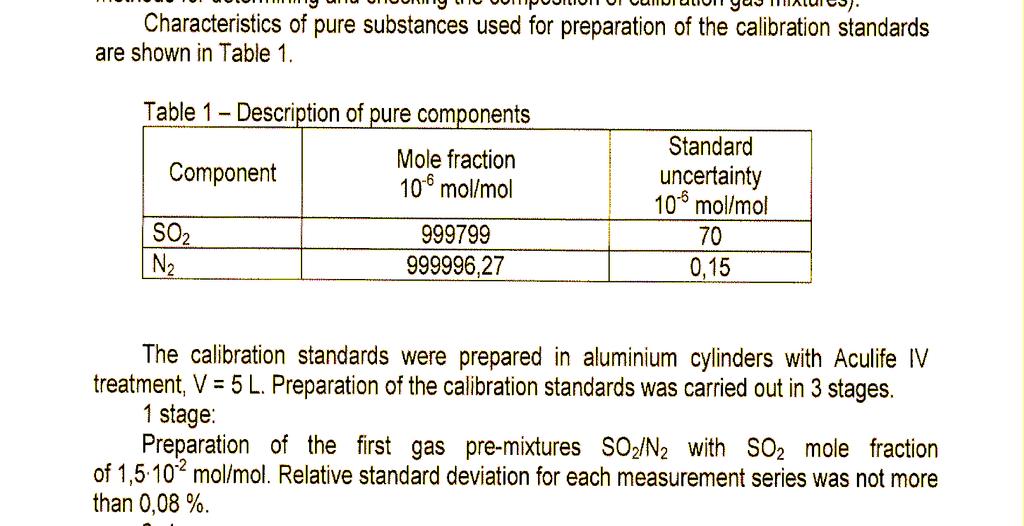
60 Summary s: Gas mixture result Coverage factor Assigned (assigned value) expanded uncertainty (*) Sulfur Dioxide 100,48 2 0,56 Reference Method: Describe your instrument(s) (principles, make, type, configuration, data collection etc.): The value(s) assigned to the key comparison mixture were obtained by comparing it for sulfur dioxide against NMISA s own primary standard gas mixtures (PSMs). The comparison method conforms to ISO 6143 and generalized least squares regression was used for processing the data. A set of two of six PSMs was used and a quadratic calibration model was chosen to fit the data. Calibration Standards: Describe your Calibration Standards for the (preparation method, purity analyses, estimated uncertainty etc.): The PSM s used in calibration are prepared from pre-mixtures in accordance with ISO 6142:2001 (Gas analysis - Preparation of calibration gas mixtures - Gravimetric method). After preparation, the composition was verified using the method described in ISO 6143:2001. Instrument Calibration: Describe your Calibration procedure (mathematical model/calibration curve, number and concentrations of standards, measurement sequence, temperature/pressure correction etc.): The SO 2 content of sample 3AL2216 was analysed using a UV fluorescence analyser with two sets of 6 gravimetrically prepared binary primary standards mixtures of sulfur dioxide in nitrogen using ISO Sample Handling: How were the cylinders treated after arrival (stabilized) and how were samples transferred to the instrument? (Automatic, high pressure, mass-flow controller, dilution etc).: After receipt of sample cylinder 3AL2216 in the laboratory, the cylinder was stabilised at room temperature (22 ºC ± 2 ºC) and humidity of (50 % ± 10%) before checking the pressure and doing. The standards and sample were transferred directly to the UV fluorescence analyser using a system composed of a pressure regulator, mass flow controller and control valves. 60
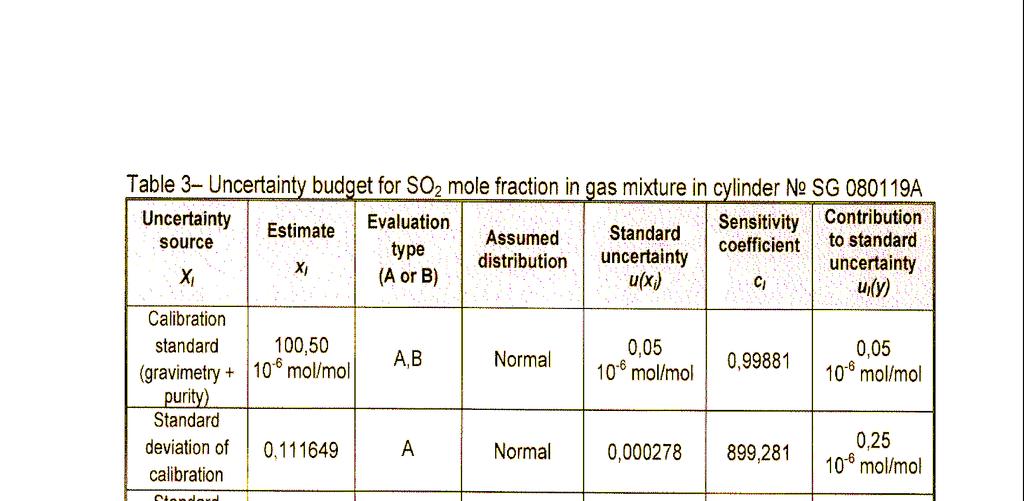
61 Pressure before measurement: 118 bar. Pressure after measurement: 100 bar. Uncertainty: There are potential sources that influence the uncertainty of the final measurement result. Depending on the equipment, the applied analytical method and the target uncertainty of the final result, they have to be taken into account or can be neglected. The budget of the standard uncertainties for the comparison sample is: Parameter Gravimetric uncertainty Verification uncertainty - Weighing uncertainty - Purity analysis Standard uncertainty 0,03 % rel. 0,37 % rel. Stability uncertainty 0,08 % rel. Regression uncertainty 0,06 % rel. Coverage factor: 2 Expanded uncertainty: 0,56 Optional You may provide additional data like the raw measurement data, information on your measurement procedure etc: 61
62 CCQM K76 (100 µ Sulphur Dioxide in nitrogen) Report of of NIST gas mixture by NPL Cylinder Identification TC-3ALM153 Overview The of sulphur dioxide in nitrogen received from the coordinator (NIST) were made during February 2010 by direct comparison with two NPL Primary Standard Mixtures (PSM) of 100 µ Sulphur Dioxide in nitrogen. Analytical methods Horiba VIA-510 NDIR used on 0 to 200 scale. NPL Primary Standard Mixtures Two hierarchies of PSMs created at NPL from pure ( %) in 2004 and 2008 were used for the analysis Nominal amount fraction Hierarchy #1 Hierarchy #2 10 m S172 S µ S186 S µ S187 S152 All standard mixtures were in BOC 10 litre cylinders with Spectraseal passivation. The detailed composition of S187 is shown in this report. Analytical results 04/02/ /02/2010 Analysis against PSM S187 S152 Amount fraction of unknown [µ] Standard deviation of 8 [µ]
63 Std dev [Relative to value] 0.05% 0.04% 63
64 Uncertainty Calculation Sulphur dioxide Uncertainty [µ] Uncertainty [%] Repeatability of analysis 0.04 Gravimetric uncertainty of standard 0.07 Combined uncertainty Expanded uncertainty (k=2) The final result was determined as the mean of the results form analysis against the two hierarchies. Sulphur dioxide amount fraction in cylinder TC-3ALM153 = µ +/ µ (k=2) Gravimetric Uncertainty for one of the NPL PSM used in the Analysis Component µ uncertainty % u/c N SO Ar O NO CO H2O CxHy methane H CO
65 INPUTS ====== File Mass (g) u/c (g) s186.txt BIPLUSN2.txt INPUT DATA FILES ================ s186.txt Component uncertainty N SO Ar CO O NO H2O CxHy methane H CO
66 BIPLUSN2.txt Component uncertainty Ar CO O CxHy H2O N NO SO methane H
67 CCQM-K76 Comparison report: Sulfur dioxide in nitrogen Laboratory: National Physical Laboratory New Delhi India Cylinder number: SG A Stand. Deviation No. 1 (µ) (% relative) Sulfur Dioxide 21/06/ Stand. deviation No. 2 (µ) (% relative) Sulfur Dioxide 21/06/ Stand. deviation No. 3 (µ) (% relative) Sulfur Dioxide 23/06/ Stand. deviation No. 4 (µ) (% relative) Sulfur Dioxide 23/06/ Note: Please copy this table as many times as needed for reporting additional 67
68 Summary s: Gas mixture result Coverage factor Assigned (assigned value) expanded (µ) uncertainty (*) (µ) Sulfur Dioxide Reference Method: Describe your instrument(s) (principles, make, type, configuration, data collection etc.): SO 2 Fluorescent Analyzer Model 100A, nominal working range (0.05 to 20 µ) Make: Teledyne Instruments, Advanced Pollution Instrumentation Division (T-API),6565 Nancy Ridge Drive San Diego, CA Data was collected in computer through RS232 port. Calibration Standards: Describe your Calibration Standards for the (preparation method, purity analyses, estimated uncertainty etc.): The calibration standards were prepared gravimetrically using pure SO 2 gas and high purity nitrogen gas according to the ISO The purity of SO 2 was 99.98%. The first SO 2 gas mixture of concentration (µ) was prepared in an aluminum cylinder of 10 litre capacity. This gas mixture was subsequently diluted to the concentration of 8.15 ± µmol/ mol SO 2 in nitrogen. This standard was used for the calibration of SO2 Fluorescent Analyzer. Instrument Calibration: Describe your Calibration procedure (mathematical model/calibration curve, number and concentrations of standards, measurement sequence, temperature/pressure correction etc.): Calibration of the instrument was carried out by single point calibration method using gravimetrically prepared SO 2 gas standard at NPL India, having concentration 8.15 ± µ in nitrogen. Sample Handling: How were the cylinders treated after arrival (stabilized) and how were samples transferred to the instrument? (Automatic, high pressure, mass-flow controller, dilution etc).: Cylinders were maintained inside a laboratory at a nominal temperature for 30±3 o C for all the period. 68
69 The CCQM K-76 inter-comparison cylinder, gas sample was gravimetrically diluted with nitrogen gas in an evacuated 10 liter aluminum cylinder. The dilution factor by weight is The pressure of the diluted prepared gas cylinder is 140 Bar. The diluted sample was analyzed using SO2 fluorescent analyzer. Uncertainty: There are potential sources that influence the uncertainty of the final measurement result. Depending on the equipment, the applied analytical method and the target uncertainty of the final result, they have to be taken into account or can be neglected. Describe in detail how estimates of the uncertainty components were obtained and how they were combined to calculate the overall uncertainty: a) Uncertainty table: Uncertainty source X I Estimate x I Assumed distribution Standard uncertainty u(x i ) Sensitivity coefficient c I Contribution to standard uncertainty u I (y) Reproducibility µ Normal µ Standard SO 2 Gas mixture 8.15 µ Normal µ Dilution Factor due to Balance Normal 2x10⁻⁹ 2x10⁻⁹ Value = µ Combined Uncertainty = ± 0.40 µ Coverage factor: 2 Expanded uncertainty = ± 0.80 µ Percentage Contribution = 0.39 % 69
70 CCQM-K76 Comparison report: Sulphur dioxide in nitrogen Laboratory: VSL Cylinder number: SG080123A Stand. Deviation No. 1 (µ) (% relative) Sulphur Dioxide Stand. deviation No. 2 (µ) (% relative) Sulphur Dioxide Stand. deviation No. 3 (µ) (% relative) Sulphur Dioxide Note: Please copy this table as many times as needed for reporting additional 70
71 Summary s: Gas mixture result Coverage factor Assigned (assigned value) expanded uncertainty (*) Sulphur Dioxide Reference Method: The analysis were performed conform the standard procedures within the VSL s quality system. For the analysis of 100 µmol mol -1 SO 2, an analyser with a NDIR detector was used. Calibration Standards: Calibration is performed using the Dutch Primary Standard gas Mixtures (PSMs). A total of 11 PSMs, all prepared by the gravimetric method according to ISO 6142:2001, have been used in this exercise. These PSMs were prepared during normal maintenance work over the past years. Instrument Calibration: Analyser : ABB URAS 14 with NDIR detector. A cubic calibration curve was made between 10 and 100 µ by measuring PSMs with a molar fraction of 10(3), 20(3), 30, 40, 60, 80 and 100 µ SO 2 in nitrogen. Sample Handling: All cylinders were stored between 15 C and 25 C at VSL for at least 24 hours before analysis. Each cylinder was equipped with a stainless steel pressure regulator that was adequately purged. The flow rate was set at approx. 350 ml/min. Before taking the readings, the measurement cell was flushed for 3 minutes with the mixture to be measured. Uncertainty: 71
72 The uncertainty used for the calibration mixtures contains all sources of gravimetric preparation. The major source of the uncertainty in the measurement is the determination of the respons of the analyser and this uncertainty on the response was used to determine the molar fraction of the unknown by comparison with the calibration mixtures according to ISO The reported uncertainty is the combined uncertainty of the 3 analyses (as calculated via ISO 6143) and multiplied by the coverage factor k=2. Describe in detail how estimates of the uncertainty components were obtained and how they were combined to calculate the overall uncertainty: The standard uncertainty associated with the amount of substance fractions of the PSMs is estimated to be µmol mol 1 ; this value exceeds the uncertainty estimate obtained from the weighing process and the purity analysis and accounts for small but not negligible stability effects. The uncertainty associated with the response is 0.02 a.u., which accounts for gas handling effects (reducers, tubing etc.). The model reads as 2 3 = + + (1) y a + 0 a1x a2x a3x The coefficients and their uncertainties of all are given below. Table 1: Regression coefficients and associated uncertainties of the 1 st measurement Coefficient value standard uncertainty a a a a Table 2: Covariance matrix associated with regression coefficients of the 1 st measurement Coefficient a 0 a 1 a 2 a 3 a a a a Table 3: Regression coefficients and associated uncertainties of the 2 nd measurement Coefficient value standard uncertainty a a a
73 a
74 Table 4: Covariance matrix associated with regression coefficients of the 2 nd measurement Coefficient a 0 a 1 a 2 a 3 a a a a Table 5: Regression coefficients and associated uncertainties of the 3 rd measurement Coefficient value standard uncertainty a a a a Table 6: Covariance matrix associated with regression coefficients of the 3 rd measurement Coefficient a 0 a 1 a 2 a 3 a a a a The value for the amount of substance fraction SO 2 in the key comparison mixture is obtained by reverse use of the calibration curve. The associated uncertainty is obtained using the law of propagation of uncertainty. Using the above data, the following results were obtained: Table 7: Assigned value first measurement Mixture y u(y) x u(x) a.u. a.u. µmol mol 1 µmol mol 1 NI Table 8: Assigned value second measurement Mixture y u(y) x u(x) a.u. a.u. µmol mol 1 µmol mol 1 NI
75 The assigned value for the key comparison mixture NI0123 from the first measurement is given in table 9. Table 9: Assigned value third measurement Mixture y u(y) x u(x) a.u. a.u. µmol mol 1 µmol mol 1 NI The final result is obtained by averaging the assigned values from the three and by pooling the associated uncertainties. The overall uncertainty budget appreciates that 1. the same suite of PSMs has been used for all 2. the uncertainty associated with the composition of the PSMs is dominating the uncertainty budget of the 3. by implication, the results are not independent Table 10: Final result Measureme nt x µmol mol 1 u(x) µmol mol 1 # # # Overall The expanded uncertainty is 0.12 µmol mol 1, using k = 2. The relative expanded uncertainty is 0.12%. Coverage factor: 2 Expanded uncertainty: 0.12 µmol mol 1. 75

76 76
77 77
78 78
79 79
80 80
81 81
82 82
83 83
84 84
85 85
Final Report of APMP.QM-K46 Ammonia in Nitrogen at 30 µmol/mol Level
 Final Report of APMP.QM-K46 Ammonia in Nitrogen at 30 µmol/mol Level Shinji Uehara 1), HAN Qiao 2), Takuya Shimosaka 3)* 1) Chemicals Evaluation and Research Institute, Japan (CERI) 2) National Institute
Sangil LEE, Mi Eon KIM, Sang Hyub OH, Jin Seog KIM. Center for Gas Analysis Korea Research Institute of Standards and Science (KRISS) Daejeon, Korea
 Daejeon, Korea") Determination of physical adsorption loss of primary reference gas mixtures in cylinders using cylinder-to-cylinder division Lee et al., 2017 Metrologia 54 L26) Sangil LEE, Mi Eon KIM, Sang Hyub OH, Jin
Determination of physical adsorption loss of primary reference gas mixtures in cylinders using cylinder-to-cylinder division Lee et al., 2017 Metrologia 54 L26) Sangil LEE, Mi Eon KIM, Sang Hyub OH, Jin
Comparison APMP.QM-S2.1 Oxygen in nitrogen at atmospheric level
 APMP.QM-S2.1 report Comparison APMP.QM-S2.1 Oxygen in nitrogen at atmospheric level Final Report ByungMoon Kim 1, Kwangsub Kim 1, Jinsang Jung 1,*, Sanghyub Oh 1, Liu Hui 2, Hou Li 2, Teo Beng Keat 2,
COOMET TECHNICAL COMMITTEE 1.8 PHYSICAL CHEMISTRY
 COOMET TECHNICAL COMMITTEE 1.8 PHYSICAL CHEMISTRY CООМЕТ PROJECT 664/RU/14 SUPPLEMENTARY COMPARISON OF STANDARD GAS MIXTURES: «Atmospheric air pollutants: CO in Nitrogen, 5 µmol/mol - Technical Protocol,
COOMET TECHNICAL COMMITTEE 1.8 PHYSICAL CHEMISTRY. CООМЕТ project 576/RU/12
 COOMET TECHNICAL COMMITTEE 1.8 PHYSICAL CHEMISTRY CООМЕТ project 576/RU/12 SUPPLEMENTARY COMPARISON STANDARDS IN THE FIELD OF ANALYSIS OF GAS MIXTURES CONTAINING СО 2, СО, С 3 Н 8 IN NITROGEN ( AUTOMOTIVE
Version /12/11. Final Report. Federal Institute for Materials Research and Testing (BAM), Germany.
, Germany.") International comparison CCQM-K74: Nitrogen dioxide, 10 μmol/mol Final Report Edgar Flores *1, Faraz Idrees 1, Philippe Moussay 1, Joële Viallon 1, Robert Wielgosz 1, Teresa Fernández, Sergio Ramírez,
International comparison CCQM-K74: Nitrogen dioxide, 10 μmol/mol Final Report Edgar Flores *1, Faraz Idrees 1, Philippe Moussay 1, Joële Viallon 1, Robert Wielgosz 1, Teresa Fernández, Sergio Ramírez,
International Comparison CCQM-K111.1 Propane in nitrogen
 International Comparison CCQM-K111.1 Propane in nitrogen Adriaan M.H. van der Veen 1, J. Wouter van der Hout 1, Paul R. Ziel 1, Mudalo Jozela, James Tshilongo, Napo G. Ntsasa, Angelique Botha 1 Van Swinden
International comparison CCQM-K82: Methane in Air at Ambient level ( ) nmol/mol. (Final report)
 nmol/mol. (Final report)") Version 1 7 November 2014 International comparison CCQM-K82: Methane in Air at Ambient level (1800-2200) nmol/mol (Final report) Edgar Flores *1, Joële Viallon 1, Tiphaine Choteau 1, Philippe Moussay 1,
Version 1 7 November 2014 International comparison CCQM-K82: Methane in Air at Ambient level (1800-2200) nmol/mol (Final report) Edgar Flores *1, Joële Viallon 1, Tiphaine Choteau 1, Philippe Moussay 1,
METROLOGICAL ASSURENCE OF O3, CO2, CH4 AND CO CONTROL IN ATMOSPHERE
 METROLOGICAL ASSURENCE OF O3, CO2, CH4 AND CO CONTROL IN ATMOSPHERE Leonid A. Konopelko Yuri A. Kustikov Vitaly V. Beloborodov Dmitry N. Selukov D.I.Mendeleyev Institute for Metrology (VNIIM), 19 Moskovsky
Euramet comparison for Ethanol in Nitrogen EURAMET.QM-K4.1
 Blad 1 van 28 Euramet comparison for Ethanol in Nitrogen EURAMET.QM-K4.1 Page 2 of 28 VSL Thijsseweg 11 2629 JA Delft Postbus 654 2600 AR Delft Nederland T +31 15 269 15 00 F +31 15 261 29 71 E info@vsl.nl
International Comparison CCQM K23b Natural gas type II
 International Comparison CCQM K23b Natural gas type II Adriaan M.H. van der Veen 1, Hima Chander 1,Paul R. Ziel 1, Ed W.B. de Leer 1, Damian Smeulders 2, Laurie Besley 2, Valnei Smarçao da Cunha 3, Zei
International comparison Refinery gas (CCQM-K77) Final Report
 Final Report") Blad 1 van 71 International comparison Refinery gas (CCQM-K77) Final Report Page 2 of 71 VSL Thijsseweg 11 2629 JA Delft Postbus 654 2600 AR Delft Nederland T +31 15 269 15 00 F +31 15 261 29 71 E info@vsl.nl
Blad 1 van 71 International comparison Refinery gas (CCQM-K77) Final Report Page 2 of 71 VSL Thijsseweg 11 2629 JA Delft Postbus 654 2600 AR Delft Nederland T +31 15 269 15 00 F +31 15 261 29 71 E info@vsl.nl
International Comparison CCQM K53 Oxygen in Nitrogen
 CCQM-K53 Final Report International Comparison CCQM K53 Oxygen in Nitrogen Jeongsoon Lee 1, Jin Bok Lee 1, Dong Min Moon 1, Jin Seog Kim 1*, Adriaan M.H. van der Veen 2, Laurie Besley 3, Hans-Joachim Heine
A comparison of nitrogen dioxide (NO 2 ) in nitrogen standards at 10 μmol/mol by Fourier Transform Infrared Spectroscopy (FT-IR)
 in nitrogen standards at 10 μmol/mol by Fourier Transform Infrared Spectroscopy (FT-IR)") A comparison of nitrogen dioxide (NO 2 ) in nitrogen standards at 10 μmol/mol by Fourier Transform Infrared Spectroscopy (FT-IR) (Final report of the pilot study CCQM-P110-B1) Edgar Flores *1, Faraz Idrees
A comparison of nitrogen dioxide (NO 2 ) in nitrogen standards at 10 μmol/mol by Fourier Transform Infrared Spectroscopy (FT-IR) (Final report of the pilot study CCQM-P110-B1) Edgar Flores *1, Faraz Idrees
International Comparison CCQM-K111 Propane in nitrogen
 International Comparison CCQM-K111 Propane in nitrogen Adriaan M.H. van der Veen 1, J. Wouter van der Hout 1, Paul R. Ziel 1, Rutger J. Oudwater, Andreia L. Fioravante, Cristiane R. Augusto, Mariana Coutinho
ENVIRONMENTAL AND POLLUTANTS GAS ANALYZERS
 XIX IMEKO World Congress Fundamental and Applied Metrology September 6, 9, Lisbon, Portugal ENVIRONMENTAL AND POLLUTANTS GAS ANALYZERS Ana Madeira, Florbela A. Dias and Eduarda Filipe 3 Instituto Português
CCQM-K90, Formaldehyde in nitrogen, 2 μmol mol -1 Final report
 CCQM-K90, Formaldehyde in nitrogen, 2 μmol mol -1 Final report J. Viallon 1, E. Flores 1, F. Idrees 1, P. Moussay 1, R. I. Wielgosz 1, D. Kim 2, Y. D. Kim 2, S. Lee 2, S. Persijn 3, L.A. Konopelko 4, Y.A.
International Key Comparison CCQM-K26b and Pilot Study CCQM P50b (SO 2 )
") International Key Comparison CCQM-K6b and Pilot Study CCQM P50b (SO ) Field - Gas standards Subject - Comparison of primary standards of sulphur dioxide (SO ) in synthetic air. Participants (in CCQM K6b)
International Key Comparison CCQM-K6b and Pilot Study CCQM P50b (SO ) Field - Gas standards Subject - Comparison of primary standards of sulphur dioxide (SO ) in synthetic air. Participants (in CCQM K6b)
Development of DMS and Acetonitrile, and Formaldehyde gas standards. Gwi Suk Heo, Yong Doo Kim, Mi-Eon Kim, and Hyunjin Jin
 Development of DMS and Acetonitrile, and Formaldehyde gas standards Gwi Suk Heo, Yong Doo Kim, Mi-Eon Kim, and Hyunjin Jin The amount of chemical substances in cylinder container Purity uncertainty Gravimetry
Pressure Metrology in Mexico
 Pressure Metrology in Mexico Jorge C. TORRES G., Benjamin SORIANO C. and Victor ARANDA C. Centro Nacional de Metrologia-CENAM km 4,5 Carretera a Los Cues, El Marques, Queretaro, MEXICO e-mail: jorge.torres@cenam.mx
Subject - Comparison of primary standards of nitrogen monoxide (NO) in nitrogen
 in nitrogen") International Key Comparison CCQM-K26a and Pilot Study CCQM-P50a (NO) Final Report Field - Gas standards Subject - Comparison of primary standards of nitrogen monoxide (NO) in nitrogen Participants (in
International Key Comparison CCQM-K26a and Pilot Study CCQM-P50a (NO) Final Report Field - Gas standards Subject - Comparison of primary standards of nitrogen monoxide (NO) in nitrogen Participants (in
Date of Shipment: Xxxxx 00, 20xx 3402c National Institute of Advanced Industrial Science and Technology National Metrology Institute of
 Date of Shipment: Xxxxx 00, 20xx 3402c01151112-170831 National Metrology Institute of Japan Reference Material Certificate NMIJ CRM 3402-c01 Sulfur Dioxide This certified reference material (CRM) was produced
Version /02/2013. (Pilot Study CCQM-P110 Nitrogen dioxide in Nitrogen 10 μmol/mol_protocol B2) Final Report
 Final Report") Study on the accuracy and uncertainty of FT-IR methods calibrated with synthetic spectra for NO 2 concentration measurements (Pilot Study CCQM-P110 Nitrogen dioxide in Nitrogen 10 μmol/mol_protocol B2)
Study on the accuracy and uncertainty of FT-IR methods calibrated with synthetic spectra for NO 2 concentration measurements (Pilot Study CCQM-P110 Nitrogen dioxide in Nitrogen 10 μmol/mol_protocol B2)
Final Report. International Key Comparison CCQM-K94
 Final Report International Key Comparison CCQM-K94 (10 mol/mol Dimethyl sulfide in nitrogen) Sangil Lee 1*, Gwi Suk Heo 1, Yongdoo Kim 1, Sanghyub Oh 1, Qiao Han 2, Hai Wu 2, L.A. Konopelko 3, Y.A. Kustikov
International Comparison CCQM-K119 Liquefied Petroleum Gas
 International Comparison CCQM-K119 Liquefied Petroleum Gas M L Downey 1, P J Brewer 1, E Atkins 1, R J C Brown 1, A S Brown 1, E T Zalewska 2, A M H van der Veen 2, D E Smeulders 3, J B McCallum 3, R T
International Comparison CCQM-K41. Final Report. Page 1 of 55
 International Comparison CCQM-K41 Final Report Franklin R Guenther 1, Walter R Miller 1, David L. Duewer 1, Gwi Suk Heo 2, Yong-Doo Kim 2, Adriaan M.H. van der Veen 3, Leonid Konopelko 4, Yury Kustikov
The analysis of complex multicomponent
 The analysis of complex multicomponent gas mixtures for emission monitoring 31 July 2017 Test and Measurement Prelly Marebane Fit-for-purpose reference materials for air pollution monitoring in SA and
International comparison CCQM-K84. Carbon monoxide in Synthetic air at ambient level
 CCQM-K Final Report International comparison CCQM-K Carbon monoxide in Synthetic air at ambient level 1 1 1 1 1 1 1 1 0 1 0 Jeongsoon Lee 1, Dongmin Moon 1, Jinbok Lee 1, Jeongsik Lim 1, Brad Hall, Paul
Supersedes: The copy of this document located on Measurement Canada s website is considered to be the controlled copy.
 Bulletin Category: GAS Bulletin: G-23 Page: 1 of 7 The copy of this document located on Measurement Canada s website is considered to be the controlled copy. Recognition of data from specialty gas suppliers
Gravimetric preparation of NO 2 primary reference gas mixtures at the NMISA. Tshepiso Mphamo 03 September 2012
 Gravimetric preparation of NO 2 primary reference gas mixtures at the NMISA Tshepiso Mphamo 03 September 2012 NMISA 2012 Contents Introduction Experimental Verification Uncertainty CCQM- Pilot study results
Force Standards Comparison between Mexico and Brazil. Jorge C. Torres Guzmán*, Daniel Ramírez Ahedo*, Jorge P. Cruz**, Jorge M. E.
 Force Standards Comparison between Mexico and Brazil Jorge C. Torres Guzmán*, Daniel Ramírez Ahedo*, Jorge P. Cruz**, Jorge M. E. Saffar*** * Centro Nacional de Metrología (),Queretaro, Mexico ** Instituto
Report on Co-production of CH 4 /air within ACRM framework
 Report on Co-production of CH 4 /air within ACRM framework 8 th APMP/TCQM Gas CRM workshop NMIJ/AIST, Tsukuba, 9~11 June 2010 By Hai Wu, NIM 1 Brief Introduction to ACRM ACRM Concept Asian Collaboration
Gas mixtures. Individual solutions specifically for your application
 Gas mixtures Individual solutions specifically for your application For many applications besides pure gases also defined gas mixtures are required. For many routine applications, from operating gases
Traceability and Evidential Breath Analyser
 Traceability and Evidential Breath Analyser M. MONTAMAT Laboratoire National d Essais, Centre de Métrologie et Instrumentation Chef de la Division Métrologie Chimique. Since many years, we are using hydroalcoholic
(NIST Special Publication )
") (NIST Special Publication 260-126) THE NIST TRACEABLE REFERENCE MATERIAL PROGRAM FOR GAS STANDARDS by Franklin R. Guenther, William D. Dorko, Walter R. Miller and George C. Rhoderick Analytical Chemistry
(NIST Special Publication 260-126) THE NIST TRACEABLE REFERENCE MATERIAL PROGRAM FOR GAS STANDARDS by Franklin R. Guenther, William D. Dorko, Walter R. Miller and George C. Rhoderick Analytical Chemistry
Improved Reliability in Natural Gas Energy Measurement with the Revised ISO Standard. Gerard Nieuwenkamp - VSL
 Improved Reliability in Natural Gas Energy Measurement with the Revised ISO 10723 Standard Gerard Nieuwenkamp - VSL Improved reliability in natural gas energy measurement with the revised ISO 10723 standard
Gas flow calibrations performed at the National Metrology Institute of South Africa (NMISA)
") Int. J. Metrol. Qual. Eng. 5, 303 (2014) c EDP Sciences 2014 DOI: 10.1051/ijmqe/2014012 Gas flow calibrations performed at the National Metrology Institute of South Africa (NMISA) D. Jonker and E.P. Tarnow
Int. J. Metrol. Qual. Eng. 5, 303 (2014) c EDP Sciences 2014 DOI: 10.1051/ijmqe/2014012 Gas flow calibrations performed at the National Metrology Institute of South Africa (NMISA) D. Jonker and E.P. Tarnow
Maximum precision for quantifiable success.
 Accredited calibration gas mixtures Maximum precision for quantifiable success. Reference materials and other accredited calibration gas mixtures. 02 Accredited calibration gas mixtures It s now official:
John Wright NIST Fluid Metrology Group February 21, 2013
 John Wright NIST Fluid Metrology Group February 21, 2013 WGFF Meetings 2010 at FLOMEKO in Taipei, 28 attendees 2011 at BIPM, France, 11 attendees 2012 at International Symposium on Fluid Flow Measurement,
This test shall be carried out on all vehicles equipped with open type traction batteries.
 5.4. Determination of hydrogen emissions page 1 RESS-6-15 5.4.1. This test shall be carried out on all vehicles equipped with open type traction batteries. 5.4.2. The test shall be conducted following
CHAPTER 16 %UHDWKLQJ*DV0L[LQJ3URFHGXUHV
 CHAPTER 16 %UHDWKLQJ*DV0L[LQJ3URFHGXUHV 16-1 INTRODUCTION 16-1.1 Purpose. The purpose of this chapter is to familiarize divers with the techniques used to mix divers breathing gas. 16-1.2 Scope. This chapter
Bi-lateral Comparison (APMP.L-K ) Calibration of Step Gauge
 Calibration of Step Gauge") APMP ASIA PACIFIC METROLOGY PROGRAMME Asia-Pacific Metrology Programme Bi-lateral Comparison (APMP.L-K5.2006.1) Calibration of Step Gauge Final Report NMIJ, January 2017 Contents 1 Document control 2 Introduction
APMP ASIA PACIFIC METROLOGY PROGRAMME Asia-Pacific Metrology Programme Bi-lateral Comparison (APMP.L-K5.2006.1) Calibration of Step Gauge Final Report NMIJ, January 2017 Contents 1 Document control 2 Introduction
Chairman s Annual Report (2004/2005)
") EUROMET TC Length Chairman s Annual Report (2004/2005) EUROMET General Assembly Varna, Bulgaria, 25-27 May 2005 Andrew Lewis, NPL Outline Project statistics (numbers, participation, coordination) Status
EUROMET TC Length Chairman s Annual Report (2004/2005) EUROMET General Assembly Varna, Bulgaria, 25-27 May 2005 Andrew Lewis, NPL Outline Project statistics (numbers, participation, coordination) Status
Title: Standard Operating Procedure for R&R Environmental Devices Model MFC201 Gas Dilution Calibrator
 Procedure No: SOP-029 Revision No: 1.1 (December 29, 2010) Page No.: 1 of 7 1. INTRODUCTION AND SCOPE To obtain timely data for the purpose of air quality assessment, air quality trend reporting, air quality
Determination of Air Density with Buoyancy Artefacts
 IMEKO 20 th TC3, 3 rd TC16 and 1 st TC22 International Conference Cultivating metrological knowledge 27 th to 30 th November, 2007. Merida, Mexico. Determination of Air Density with Buoyancy Artefacts
NMISA New Gas Flow Calibration Facility
 NMISA New Gas Flow Calibration Facility Speaker / Author: D. Jonker Co-author: E.P. Tarnow National Metrology Institute of South Africa (NMISA) Private Bag X34, Lynnwood Ridge, Pretoria, 0040, South Africa
Gases&Technology. Measurement of Impurities in Helium Using the Dielectric Barrier Discharge Helium Ionization Detector. FEATURE.
 Gases&Technology FEATURE Measurement of Impurities in Helium Using the Dielectric Barrier Discharge Helium Ionization Detector. B Y M A T T H E W M O N A G L E Abstract Bulk gases are often delivered to
NMISA NEW GAS FLOW CALIBRATION FACILITY. Deona Jonker 7 October 2013
 NMISA NEW GAS FLOW CALIBRATION FACILITY Deona Jonker 7 October 2013 Introduction Flow the total volume of a fluid that flows past a fixed point in a given time Flow measurements used in industry as a means
Protocol Gas Verification Program (PGVP)
") Protocol Gas Verification Program (PGVP) Michael Hayes ICAC/ MARAMA Workshop Advances in Control Technologies July 9-10, 2008 Exton, PA PGVP Protocol Gases from an historic perspective Historical Audit
Protocol Gas Verification Program (PGVP) Michael Hayes ICAC/ MARAMA Workshop Advances in Control Technologies July 9-10, 2008 Exton, PA PGVP Protocol Gases from an historic perspective Historical Audit
Specific Accreditation Criteria Calibration ISO IEC Annex. Mass and related quantities
 Specific Accreditation Criteria Calibration ISO IEC 17025 Annex Mass and related quantities January 2018 Copyright National Association of Testing Authorities, Australia 2014 This publication is protected
AIR PRESSURE CONTROLLED MASS MEASUREMENT SYSTEM
 Measurement of Mass, Force and Torque (APMF 2013) International Journal of Modern Physics: Conference Series Vol. 24 (2013) 1360002 (6 pages) The Authors DOI: 10.1142/S2010194513600021 AIR PRESSURE CONTROLLED
Application Note AN-107
 SPEC Sensor TM Characterization & Calibration Considerations Scope This document is provided to describe the considerations needed to characterize, calibrate, verify and validate the measurement performance
EN ISO/IEC Technical Requirements
 EN ISO/IEC 17025 - Technical Requirements Wolfgang Garche Environmental Protection Agency Department Air Quality Monitoring, Information, Assessment 1 What means accreditation in accordance to EN ISO/IEC
Organisation Internationale de Métrologie Légale
 Organisation Internationale de Métrologie Légale OIML INTERNATIONAL RECOMMENDATION Pressure balances Manomètres à piston OIML R 110 Edition 1994 (E) CONTENTS Foreword... 3 1 Scope... 4 2 Terminology...
Research and Development. Money in the Pipeline
 On-line gas chromatography Gerard Nieuwenkamp Research and Development Money in the Pipeline Delft, 2 November 2010 Natural gas metering 2" 2" 65 m3/h usm 6" 400 m3/h M etering runs 2500 m3/h Gas Oil Piston
Laboratory Hardware. Custom Gas Chromatography Solutions WASSON - ECE INSTRUMENTATION. Custom solutions for your analytical needs.
 Laboratory Hardware Custom Gas Chromatography Solutions Custom solutions for your analytical needs. Laboratory Hardware Wasson-ECE Instrumentation offers hardware-only solutions for advanced chromatography
Protocol Gas Verification For Compressed Gas Cylinders Containing Either SO 2, NO or CO. Quality Assurance Plan/Standard Operating Procedure
 Page 1 of 4 Protocol Gas Verification For Compressed Gas Cylinders Containing Either SO 2, NO or CO Quality Assurance Plan/Standard Operating Procedure Page 2 of 4 Table of Contents 2.3.6 Protocol Gas
International Comparison COOMET.QM-K111 Propane in nitrogen
 International Comparison COOMET.QM-K111 Propane in nitrogen Final Report L.A. Konopelko 1, Y.A. Kustikov 1, A.V. Kolobova 1,V.V. Pankratov 1, A.A. Pankov 1, O.V. Efremova 1, M.S. Rozhnov 2, D.M. Melnyk
Title: Standard Operating Procedure for Dasibi Model 5008 Gas Dilution Calibrator
 Procedure No: SOP-034 Revision No: 1.0 Revised Dec. 29, 2010 Page No.: 1 of 10 1. INTRODUCTION AND SCOPE This procedure is intended to describe the operations of the Dasibi model 5008 calibrator. The Dasibi
Title: Standard Operating Procedure for Measurement of Ethylene (C 2 H 4 ) in Ambient Air by Reduced Gas Detection (RGD)
 in Ambient Air by Reduced Gas Detection (RGD)") Procedure No: SOP-026 Revision No: 1.0 January 24, 2011 Page No.: 1 of 10 1. INTRODUCTION AND SCOPE To obtain timely data for the purpose of air quality assessment, air quality trend reporting and to meet
Procedure No: SOP-026 Revision No: 1.0 January 24, 2011 Page No.: 1 of 10 1. INTRODUCTION AND SCOPE To obtain timely data for the purpose of air quality assessment, air quality trend reporting and to meet
LINEAR TRANSFORMATION APPLIED TO THE CALIBRATION OF ANALYTES IN VARIOUS MATRICES USING A TOTAL HYDROCARBON (THC) ANALYZER
 ANALYZER") LINEAR TRANSFORMATION APPLIED TO THE CALIBRATION OF ANALYTES IN VARIOUS MATRICES USING A TOTAL HYDROCARBON (THC) ANALYZER Michael T Tang, Ph.D. Grace Feng Greg Merideth Rui Huang Matheson Gas Applied Lab
LINEAR TRANSFORMATION APPLIED TO THE CALIBRATION OF ANALYTES IN VARIOUS MATRICES USING A TOTAL HYDROCARBON (THC) ANALYZER Michael T Tang, Ph.D. Grace Feng Greg Merideth Rui Huang Matheson Gas Applied Lab
Central scientific research automobile and automotive engine institute
 Central scientific research automobile and automotive engine institute The next mandatory requirements for gas analytical equipment act both in Russian Federation and countries of Customs Union (Belarus,
Thermo Scientific Model 146i Principle of Operation
 Thermo Scientific Model 146i Principle of Operation The Model 146i Multi-gas Calibrator dilutes calibration gases to precise concentrations. The diluted gases are used to perform zero, precision and Level
11/22/ (4) Harmonization: <846> SPECIFIC SURFACE AREA
 Harmonization: <846> SPECIFIC SURFACE AREA") BRIEFING 846 Specific Surface Area, USP 27 page 2385. The European Pharmacopoeia is the coordinating pharmacopeia for the international harmonization of the Specific Surface Area General Chapter, as part
BRIEFING 846 Specific Surface Area, USP 27 page 2385. The European Pharmacopoeia is the coordinating pharmacopeia for the international harmonization of the Specific Surface Area General Chapter, as part
EURAMET P1061 COMPARISON OF AIR TEMPERATURE CALIBRATIONS
 EURAMET P1061 COMPARISON OF AIR TEMPERATURE CALIBRATIONS Instructions for the part 1 version 1 Martti Heinonen Espoo 2009 Contents 1 Background 4 2 Organization 4 2.1 Method 4 2.2 Participants 5 2.3 Scheme
Air Monitoring Directive Chapter 7: Calibration
 Air Monitoring Directive Chapter 7: Calibration Version Dec 16, 2016 Amends the original Air Monitoring Directive published June, 1989 Title: Air Monitoring Directive Chapter 7: Calibration Number: Program
at NIST: ultra-low outgassing rates
 Traceable outgassing measurements at NIST: ultra-low outgassing rates and new materials James Fedchak Thermodynamic Metrology Group Sensor Science Division Physical Measurement Laboratory Vacuum Project:
CALCULATING THE SPEED OF SOUND IN NATURAL GAS USING AGA REPORT NO Walnut Lake Rd th Street Houston TX Garner, IA 50438
 CALCULATING THE SPEED OF SOUND IN NATURAL GAS USING AGA REPORT NO. 10 Jerry Paul Smith Joel Clancy JPS Measurement Consultants, Inc Colorado Engineering Experiment Station, Inc (CEESI) 13002 Walnut Lake
Generating Calibration Gas Standards
 Technical Note 1001 Metronics Inc. Generating Calibration Gas Standards with Dynacal Permeation Devices Permeation devices provide an excellent method of producing known gas concentrations in the PPM and
INFLUENCE OF MEASURING PROCESS AUTOMATION ON UNCERTAINTY OF MASS STANDARD AND WEIGHTS CALIBRATION.
 Andrzej Hantz RADWAG BALANCES AND SCALES INFLUENCE OF MEASURING PROCESS AUTOMATION ON UNCERTAINTY OF MASS STANDARD AND WEIGHTS CALIBRATION. The article presents the influence of comparison process automatization
Laboratory Hardware. Custom Gas Chromatography Solutions WASSON - ECE INSTRUMENTATION. Engineered Solutions, Guaranteed Results.
 Laboratory Hardware Custom Gas Chromatography Solutions Engineered Solutions, Guaranteed Results. WASSON - ECE INSTRUMENTATION Laboratory Hardware Wasson-ECE Instrumentation offers hardware-only solutions
STD-3-V1M4_1.7.1_AND_ /15/2015 page 1 of 6. TNI Standard. EL-V1M4 Sections and September 2015
 page 1 of 6 TNI Standard EL-V1M4 Sections 1.7.1 and 1.7.2 September 2015 Description This TNI Standard has been taken through all of the voting stages and has received consensus approval by the TNI membership.
Gas Mixture Two Components. Gas Mixtures Two Components
 Gas Mixture Two Components Two Components Contents Two-Component Mixtures Ammonia...M4 Argon...M5 Benzene...M6 n-butane...m7 Carbon Dioxide...M8 Carbon Monoxide...M10 Chlorine...M12 Ethane...M13 Ethylene
Sartorius CCL kg Prototype Mass Comparator
 Sartorius CCL1007 1 kg Prototype Mass Comparator For Dissemination of the Mass Scale and Calibration of Weights Sartorius has developed a unique mass comparator with the Bureau International des Poids
EPA Traceability Protocol for Assay and Certification of Gaseous Calibration Standards
 EPA 600/R-12/531 May 2012 www.epa.gov/ord EPA Traceability Protocol for Assay and Certification of Gaseous Calibration Standards Office of Research and Development National Risk Management Research Laboratory
Title: Standard Operating Procedure for Sabio 2010 and 4010 Dilution Calibrator
 Procedure No: SOP-012 Revision No: 1.2, January 27, 2011 Page No.: 1 of 7 1. INTRODUCTION AND SCOPE This procedure is intended to describe the operations of the Sabio model 2010 and 4010 dilution calibrators.
Beamex. Calibration White Paper. Weighing scale calibration - How to calibrate weighing instruments
 Beamex Calibration White Paper info@beamex.com Weighing scale calibration - How to calibrate weighing instruments Weighing scale calibration - How to calibrate weighing instruments Weighing scales, weighing
International Comparison CCQM-K116: 10 µmol mol -1 water vapour in nitrogen
 International Comparison CCQM-K116: 10 µmol mol -1 water vapour in nitrogen P J Brewer 1, B Gieseking 1, V F Ferracci 1, M Ward 1, J van Wijk 2, A M H van der Veen 2, A A Lima 3, C R Augusto 3, S H Oh
OMCL Network of the Council of Europe QUALITY ASSURANCE DOCUMENT
 OMCL Network of the Council of Europe QUALITY ASSURANCE DOCUMENT PA/PH/OMCL (16) 17 R QUALIFICATION OF EQUIPMENT ANNEX 2: QUALIFICATION OF GC EQUIPMENT Full document title and reference Document type Legislative
All-Russia D.I.Mendeleyev Scientific and Research Institute for Metrology (VNIIM)
") All-Russia D.I.Mendeleyev Scientific and Research Institute for Metrology (VNIIM) APMP 2015 TCFF Meeting 2 Nov. 2015 Beijing, China Konstantin Popov k.v.popov@vniim.ru Contents Participating in second
All-Russia D.I.Mendeleyev Scientific and Research Institute for Metrology (VNIIM) APMP 2015 TCFF Meeting 2 Nov. 2015 Beijing, China Konstantin Popov k.v.popov@vniim.ru Contents Participating in second
International comparison protocol for the key comparison of 1 kg stainless steel standards.
 CCM.M-K4 06/10/ International comparison protocol for the key comparison of 1 kg stainless steel standards. Organized by the Working Group on Mass Standards of the Consultative Committee for Mass and related
Paper 2.2. Operation of Ultrasonic Flow Meters at Conditions Different Than Their Calibration
 Paper 2.2 Operation of Ultrasonic Flow Meters at Conditions Different Than Their Calibration Mr William Freund, Daniel Measurement and Control Mr Klaus Zanker, Daniel Measurement and Control Mr Dale Goodson,
PG7000 high line differential mode for defining differential pressure at line pressures above atmospheric pressure (PG7000 V2.
 PG7000 high line differential mode for defining differential pressure at line pressures above atmospheric pressure (PG7000 V2.03 and higher) Technical Note Pressure measuring devices intended to measure
SIM MWG7 Mass and Related Quantities. Report to CCM
 SIM MWG7 Mass and Related Quantities Report to CCM SIM Sistema Interamericano de Metrología A very extended RMO Distance NRC (Ottawa) LATU (Montevideo) > 9100 km Some conparisons have to be organized by
APPLICATION NOTE. GC Integrated Permeation Device
 GC Integrated Permeation Device GC-integrated Design PPB to PPM Level Calibration No Cylinders or Regulators Required Option for Dual Ovens Cost Effective, Safe, Clean, Flexible, NIST Traceable Keywords:
Interlaboratory comparison in the pressure range from 0 to 2 MPa for accredited calibration laboratories
 Int. J. Metrol. Qual. Eng. 6, 307 (2015) c EDP Sciences 2015 DOI: 10.1051/ijmqe/2015021 Interlaboratory comparison in the pressure range from 0 to 2 MPa for accredited calibration laboratories Lovorka
General Accreditation Guidance. User checks and maintenance of laboratory balances
 General Accreditation Guidance User checks and maintenance of laboratory balances January 2018 Copyright National Association of Testing Authorities, Australia 2010 All intellectual property rights in
Gas Metrology. SI-traceable: Primary Reference Materials Certified Reference Materials Calibrated Gas Mixtures Interlaboratory Comparisons
 Gas Metrology SI-traceable: Primary Reference Materials Certified Reference Materials Calibrated Gas Mixtures Interlaboratory Comparisons T +31 15 2691500 E vsl@vsl.nl www.vsl.nl 1 This guide provides
APPENDIX C. 40 CFR PART 60 App. B SPEC. 1-4, 6
 APPENDIX C 40 CFR PART 60 App. B SPEC. 1-4, 6 Part 60, Appendix B - Performance Specification 2 Specifications and Test Procedures for SO2 and NOx Continuous Emission Monitoring Systems in Stationary Sources
Validation of Custody Transfer Metering Skid at Site After Laboratory Proving
 flotek.g 2017- Innovative Solutions in Flow Measurement and Control - Oil, Water and Gas August 28-30, 2017, FCRI, Palakkad, Kerala, India Validation of Custody Transfer Metering Skid at Site After Laboratory
Predicted Dispense Volume vs. Gravimetric Measurement for the MICROLAB 600. November 2010
 Predicted Dispense Volume vs. Gravimetric Measurement for the MICROLAB 600 November 2010 Table of Contents ``Abstract...3 ``Introduction...4 ``Methods & Results...6 ``Data Analysis...9 ``Conclusion...12
The Gold Standard in Calibration Mixtures
 The Gold Standard in Calibration Mixtures Calibration standards are used in a wide variety of industries. The need for accurate and precise standards has become increasingly important because of the consequences
Basic Nitriding Sampling System Hydrogen Analyzer with Calculated % DA, % NH 3, and K N Values. Operations Manual
 Basic Nitriding Sampling System Hydrogen Analyzer with Calculated % DA, % NH 3, and K N Values Operations Manual Please read, understand, and follow these instructions before operating this equipment.
THE USE OF Z FACTORS IN GRAVIMETRIC VOLUME MEASUREMENTS
 THE USE OF Z FACTORS IN GRAVIMETRIC VOLUME MEASUREMENTS Author: T. Mautjana NMISA Private Bag X 34 Lynwood Ridge; 0040 Email: tmautjana@nmisa.org Phone: 012 841 4798; Fax: 012 841 2131 Abstract Using gravimetric
29th Monitoring Research Review: Ground-Based Nuclear Explosion Monitoring Technologies
 IMPROVED CALIBRATION AND OPERATION OF A STABLE-GAS QUANTIFICATION MANIFOLD AS PART OF A RADIOXENON COLLECTION SYSTEM ABSTRACT Richard M. Williams, James C. Hayes, and Randy R. Kirkham Pacific Northwest
CORESTA RECOMMENDED METHOD N 6
 CORESTA RECOMMENDED METHOD N 6 DETERMINATION OF VENTILATION DEFINITIONS AND MEASUREMENT PRINCIPLES (2015 Revision September 2016) 1. SCOPE This CORESTA Recommended Method specifies a method for the determination
SCOPE OF ACCREDITATION TO ISO/IEC 17025:2005 & ANSI/NCSL Z
 SCOPE OF ACCREDITATION TO ISO/IEC 17025:2005 & ANSI/NCSL Z540-1-1994 FLUKE CALIBRATION, PHOENIX PRIMARY PRESSURE AND FLOW LABORATORY 4765 East Beautiful Lane Phoenix, AZ 85044 Mike DiGioia Phone: 602 773
Buoyancy Does it Matter?
 Buoyancy Does it Matter? Speaker / Author: N.J. Tayler SANAS Private Bag X23, Sunnyside, 0132, South Africa e-mail : nevillet@sanas.co.za Phone: 012 394 3782 Fax: 012 394 4782 Abstract There is often the
Laboratory Activity Measurement and Density. Average deviation = Sum of absolute values of all deviations Number of trials
 Laboratory Activity Measurement and Density Background: Measurements of mass and volume are very common in the chemistry laboratory. The analytical balance is used to measure mass, and the graduated cylinder,
METHOD 3C - DETERMINATION OF CARBON DIOXIDE, METHANE, NITROGEN, AND OXYGEN FROM STATIONARY SOURCES
 METHOD 3C - DETERMINATION OF CARBON DIOXIDE, METHANE, NITROGEN, AND OXYGEN FROM STATIONARY SOURCES 1. Applicability and Principle 1.1 Applicability. This method applies to the analysis of carbon dioxide