FROG-4000 TM Chemical Analysis System
|
|
|
- Calvin Lee
- 5 years ago
- Views:
Transcription
1 FROG-4000 TM Chemical Analysis System User s Manual Defiant Technologies, Inc Vol.5
2 This page is intentionally left blank.
3 FROG-4000 TM Chemical Analysis System User s Manual Defiant Technologies, Inc Vol.5

4 Sparge Bottle 4

5 HANDLING INSTRUCTIONS PRECAUTIONS FROG-4000 TM User s Manual FROG-4000 TM is a robust, portable instrument, which can be operated in a lab setting or out in the field. The internal components of this instrument can be damaged if the unit is abused. The following precautions are given to ensure correct handling of the instrument. DO NOT invert with water in the sparge bottle. System can NOT analyze a water or soil sample when inverted! Permanent damage to instrument is possible! (If this does occur, the system may require maintenance. Refer to Section 8, Trouble Shooting) DO NOT handle or carry system when sample is being analyzed. For the best results, limit movement to before or after sample analysis. DO NOT transport or store the instrument with liquid in the sparge bottle. Do NOT invert 90 Angle Do NOT invert 180 Angle 5
6 This page is intentionally left blank. 6
7 TABLE OF CONTENTS FROG-4000 TM User s Manual Handling Instructions... 5 Commonly Used Acronyms... 9 Section 1: Getting to Know the FROG-4000 TM Manual Overview Operations Overview Section 2: Components and Systems Instrument Components Purge and Trap System Load/Analyze Valve Sparge Bottle Positions Gas Phase Analysis System Gas Sample Analysis Flow Diagrams Sample Loading Sparge and Collection Release, Separation and Analysis Gas Sampling Analysis Flow Diagrams Air Sampler Sample Collection Release, Separation and Analysis...31 Section 3: Overview of Ellvin Chromatography Software Section 4: Field and Lab Analysis Procedures Powering On/Charging the Battery Connecting to Computer/Ellvin Instrument Settings Instrument Preparation Rinsing the Instrument Creating a Clean Baseline Connecting the Air Sample Adaptor Loading a Sample Running a Sample Importing Data to Ellvin
8 TABLE OF CONTENTS CONTINUED FROG-4000 TM User s Manual Section 5: Ellvin Chromatography Software Features of Ellvin Applying Ellvin Features OPEN Button Magnifying Glass Integrator Section 6: Calibration Calibration Standards Standards for Liquid or Soil Samples Standards for Air Samples Ellvin Calibration Window Features List of Analytes Correlation Chart and Equations Calibration Procedure Section 7: Maintenance Routine Cleaning Annual Cleaning Cleaning the Scrubber Section 8: Trouble Shooting Inverting the FROG with Water in the Sparge Bottle Degrading Chromatograph: Scrubber is NOT secured properly Cannot Achieve a Clean Baseline Black Instrument Screen Appendix I: Accessories/Spare Parts Appendix II: Detectable Chemicals

9 COMMONLY USED ACRONYMS FROG-4000 TM User s Manual PC: Preconcentrator PID: Photo Ionization Detector GC: Gas Chromatograph VOCs: Volatile Organic Compounds BTEX: Benzene, Toluene, Ethylbenzene, Xylenes Ellvin: Defiant s Chromatography Software FROG-4000 TM 9
10 This page is intentionally left blank. 10
11 SECTION 1: GETTING TO KNOW THE FROG-4000 TM 1.1 MANUAL OVERVIEW The FROG-4000 TM uses a practical approach to instrument set-up and operations. This manual includes the following: An overview of the FROG-4000 TM operational systems, components, and features. Diagrams illustrating the flow of a sample during loading, sparge, collection and analysis. Instructions for using the chromatography software (Ellvin). Detailed procedures for using the FROG-4000 TM. Instructions for calibrating the instrument. Routine maintenance information. Troubleshooting information. 11
12 1.2 OPERATIONS OVERVIEW FROG-4000 TM User s Manual The FROG-4000 TM instrument analyzes air, water or soil to identify volatile organic chemicals (VOCs) present in a sample and determines their concentrations. The instrument is designed to operate either in the field or in a laboratory, and either connected or not connected to a computer running the Ellvin Software. Data is stored on the user s hard drive when the FROG is attached to a computer. Data is also stored on the FROG s internal memory card and can be imported to a computer later. The FROG-4000 TM has a 5 ml sample sparger that can be used for water or solid samples. It is good practice to keep the total volume in the sparger at a constant 5 ml. For instance, if the user wishes to dilute a water sample 10 to 1, a sample volume of 0.5 ml would be diluted with 4.5 ml of clean water, resulting in total volume of 5 ml. If analyzing soil samples, the user must add water to the sparger to ensure that the sample is appropriately agitated. The basic steps for operating the system are: 1. Adjust/apply the settings as needed. 2. Ensure that the instrument displays a clean baseline. 3. Load a 5 ml sample. 4. Run an analysis, either connected or not connected to Ellvin. 5. If not connected to Ellvin during the analysis cycle, read analysis data using Ellvin at a later time. NOTE: A working knowledge of Ellvin is necessary to correctly operate the instrument. Users should be familiar with the software before attempting analyses. 12


13 The FROG-4000 TM is designed for use in the field. The FROG-4000 TM is designed for use in the laboratory. Connect to Ellvin Software for more detailed analysis results. 13
14 This page is intentionally left blank. 14
15 SECTION 2: COMPENENTS AND SYSTEMS The FROG-4000 TM instrument has two main operational systems: The Purge System This system manages the loading of a sample, sparging the sample, if liquid, to release VOCs, and the introduction of gas phase compounds to the Gas Phase Analysis System. All components of the Purge System are visible on the instrument exterior. The Gas Phase Analysis System The Gas Phase Analysis System receives the VOCs from the Purge System and carries them through all stages of sample analysis, Collection Injection Separation Detection The instrument s components are briefly described on the following pages. 15
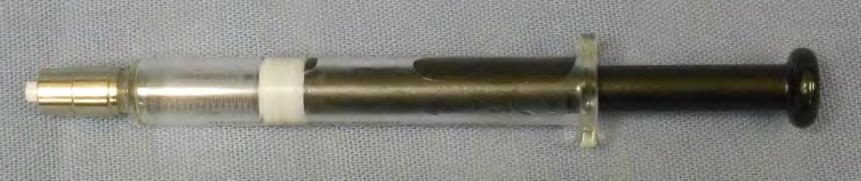
16 Section 2: Components and Systems Continued FROG-4000 TM User s Manual 2.1. INSTRUMENT COMPONENTS Components Reference for FROG-4000 TM : A. Scrubber B. Load/Analyze Valve C. Display Screen D. Sparge-Air Line E. Sparge-Valve F. Flow Selection-Valve G. Sparge Manifold H. Pump Vent Orifice I. Pump Air Supply Line J. Sample Inlet K. Sparge Bottle with PEEK Tube L. Sparge Bottle Nut M. 5 ml Syringe to load sample 16

17 C B A H D I G F E L J K M 17
18 2.1. Instrument Components Continued FROG-4000 TM User s Manual N. USB Port for stored chromatograms O. Power Switch P. Port for Serial Data Plug Q. Port for 9V Power Plug R. Port for Battery Charge Plug S. Port for Air Sampler Plug T. Battery U. Start Button V. Pump Inlet for Carrier/Sparge Gas W. Exhaust from Gas Analysis Module 18

19 N T O P Q R S W U U V W V 19
20 Section 2: Systems and Components Continued 2.2. PURGE SYSTEM FROG-4000 TM User s Manual Purge System Components and their Functions Figures and A) Scrubber: Activated Carbon and Molecular Sieves Function: Cleans the ambient air to prevent external VOCs from interfering in analyses. *See NOTE on following pages for replacement supplies. B) Load/Analyze Valve: Function: Opens and closes the sample inlet for sample loading. The valve has two positions, LOAD and ANALYZE. (See Section for operating instructions) E) Sparge-Valve: Function: Prevents liquid from entering air scrubber system. G) Sparge Manifold: Function: Routes gas to the proper ports for sparging and analysis functions. J) Sample Inlet: Function: Attachment for syringe to load a sample. K) Sparge Bottle with PEEK Tube: Needle type sparge bottle, 0.5 x 5mL. Function: Holds sample to purge VOCs. The Sparge bottle has two positions, UP and DOWN. (See Section for operating instructions) L) Sparge Bottle Nut: Function: Holds Sparge bottle in place and provides gas tight seal. M) Syringe: 5mL, with Luer Lock. Function: Loads a fixed sample volume to the sparger. Attaches to sample inlet (J). 20

21 Figure 2.2-1: Purge and Trap System B A J G E E L K Figure 2.2-2: Purge System J M 21


22 2.2 Purge and Trap System Continued FROG-4000 TM User s Manual LOAD/ANALYZE VALVE Turn the load/analyze valve to the LOAD position to load a sample. LOAD LOAD POSITION After loading a sample, turn the handle counter clockwise to the ANALYZE position before starting an analysis cycle. ANALYZE Analyze Position 22

23 SPARGE BOTTLE POSITIONS The sparge bottle moves UP and DOWN and is secured with a sparge bottle nut. The bottle must be in the DOWN position to rinse the instrument or to remove the sparge bottle. The bottle must be in the UP position to analyze a sample. The bottle may be in the UP or DOWN position for sample loading. We will present the DOWN position for consistency in this manual. Sparge bottle in the DOWN position. Sparge bottle in the UP position. NOTE: When the sparge bottle is fully UP, the sparge tube is near the bottom of the sparge bottle. A partially lowered sparge bottle will cause analyte peaks to shift right. 23
24 Section 2: Components and Systems Continued 2.3. GAS PHASE ANALYSIS SYSTEM FROG-4000 TM User s Manual Gas Phase Analysis System Components and their Functions Figures and 2.3-2: A-Internal) Pump: Diaphragm pump Function: Circulates carrier gas through system. B-Internal) Preconcentrator (PC): Function: Collects and injects VOCs into GC column. C-Internal) Micro Gas Chromatography Column: (GC) Function: Separates VOCs. D-Internal) Photo Ionization Detector (PID): 10.6eV lamp Function: Detects VOCs. E) Sparge-Valve: Function: Directs pump flow into sparge bottle to purge VOCs from sample. F) Flow Selection Valve: Function: Determines where the flow will be directed during Sparge or Analysis Mode. G-Internal) Bypass-Valve: Function: Allows the VOCs to pass over the PC and bypass the GC and PID. H) Pump Vent Orifice: Function: Provides a small leak in pump flow for improved flow control. X-Internal) Injection Split: Function: Provides a small leak to prevent rebound injection. 24

25 E Load Sample Sample Sparger Sparge-Valve X Activated Charcoal Molecular Sieves Flow Selection Valve Preconcentrator Bypass-Valve Bypass Line PID B H F A VOCs D C Micro-GC Figure Gas Phase Analysis System components. Preconcentrator PID Bypass-Valve micro GC Column Figure Gas Phase Analysis System internal components. 25
26 2.3. Gas Phase Analysis System Continued FROG-4000 TM User s Manual Gas Phase Analysis System Components and their Functions Figure C) Display Screen: Function: Shows the user which stage of analysis is being performed and displays an estimate of analysis results. U) Start Button: Function: Initiates the analysis cycle (can also be initiated through Ellvin). V) Pump Inlet: Function: Carrier gas intake for pump. W) Exhaust: Function: System flow exits. C U W V Figure Gas Phase Analysis System external components 26
27 Section 2: Systems and Components Continued 2.4. GAS FLOW DIAGRAMS This section describes and illustrates the flow of a sample from loading through the components of the Gas Phase Analysis System (Section 2.2) SAMPLE LOADING (Diagram 2.4-1) The sparge bottle is in the DOWN position for loading a liquid sample. The load/analyze valve is in the LOAD position. A sample is loaded into the sample inlet with a 5mL syringe. Activated Charcoal Sparge-Valve Molecular Sieves Flow Selection Valve Load Sample Preconcentrator Bypass-Valve Bypass Line Sparge Bottle PID Sample Micro-GC Diagram 2.4-1: Sample Loading 27
28 2.4. Gas Flow Diagram Continued FROG-4000 TM User s Manual SPARGE AND COLLECTION (Diagram 2.4-2) After the sample has been loaded, the load/ analyze-valve is placed in the ANALYZE position and the sparge bottle is moved into the UP position The start button is pressed and the pump flow starts. The carrier gas moves through: 1) the flow selection valve 2) activated charcoal, and 3) the spargevalve. Air sparges the liquid (if a liquid sample) to release the VOCs into the headspace of the sparge bottle and onto the preconcentrator (PC). Activated Charcoal Sparge-Valve Molecular Sieves Flow Selection Valve Load Sample Preconcentrator Bypass-Valve Bypass Line Sparge Bottle PID VOCs Carrier Gas Micro-GC VOCs Diagram 2.3-2: Sparge and Collection 28
29 INJECTION (RELEASE), SEPARATION, AND ANALYSIS (Diagram 2.4-3) Once the VOCs are collected onto the PC, the PC is heated to release the VOCs and inject them into the Micro-Gas Chromatograph Column (GC). The VOCs separate through the column and then continue to the Photo Ionization Detector (PID). The PID signal is analyzed and displayed through the software. The sample then exits through the exhaust. Activated Charcoal Sparge-Valve Molecular Sieves Flow Selection Valve Load Sample Preconcentrator Bypass-Valve Sparge Bottle Bypass Line PID VOCs Micro-GC Carrier Gas Carrier Gas VOCs VOCs Diagram 2.4-3: Injection, Separation and Analysis 29

30 Section 2: Systems and Components Continued FROG-4000 TM User s Manual 2.5. GAS FLOW DIAGRAMS THROUGH AIR SAMPLER This section describes and illustrates the flow of a sample from loading through the components of the Gas Phase Analysis System through the air sampler (Section 2.2) SAMPLE COLLECTION (Diagram 2.5-1) The air sampler is connected to the Frog The start button is pressed and the sample collection starts. The sample gas moves through: 1) an inert valve in the air sampler 2) over the preconcentrator, and 3) out of the gas module. A pump in the air sample adapter provides vacuum for pulling the air sample over the preconcentrator. Diagram 2.5-1: Sample Collection 30
 Once the VOCs are collected onto the PC, the PC is heated to release the VOCs and inject them into the Micro -Gas Chromatograph Column (GC).")
31 2.5. Gas Flow Diagram Continued INJECTION (RELEASE), SEPARATION, AND ANALYSIS (Diagram 2.5-2) Once the VOCs are collected onto the PC, the PC is heated to release the VOCs and inject them into the Micro -Gas Chromatograph Column (GC). The VOCs separate through the column and then continue to the Photo Ionization Detector (PID). The PID signal is measured and displayed through the software. The sample exits through the exhaust. Diagram 2.5-2: Injection, Separation and Analysis 31
32 SECTION 3: OVERVIEW OF ELLVIN SOFTWARE The Ellvin Software has four windows that are accessed with tabs when the software is open. Window Tabs in Ellvin Live Data Window: This is the default window for Ellvin. In Live Data Window, Ellvin creates a chromatogram from sample analysis data. The data source may be: a. From a sample loaded and simultaneously analyzed by Ellvin. b. From sample data previously recorded on the instrument s SD card, then imported to Ellvin. Analyze Window: As in Live Data Window, Ellvin creates a chromatogram from sample analysis data. In this window, Ellvin retrieves analysis data that was previously stored on a computer. In Analyze Window the user can examine chromatograms closely, integrate chromatogram peaks, and export data to Excel. Calibration Window: In this window, Ellvin uses analysis data from chemical standards to calibrate the FROG. Settings Window: In this window, Ellvin manages the settings for operation of the FROG. The settings define temperature and duration parameters for various phases of the instrument s collection and analysis cycle. There are several general features of Ellvin as well as a few features specific to Analyze Window that are described in Section 5. The user should be familiar with all the features before starting a sample analysis. 32


33 SECTION 4: FIELD AND LAB ANALYSIS PROCEDURES The simplest way to use the FROG is to load samples and run analyses while the instrument is connected to a computer and Ellvin. The software analyzes sample data and displays a live chromatogram during analyses. The cycle takes about five minutes. Data is stored both on the FROG s internal SD card and on the computer. The FROG can also analyze samples when not connected to Ellvin. An analysis cycle takes the same amount of time (five minutes) and an estimate of the results are displayed on the instrument s screen. Data is stored on the FROG s internal SD card and can be imported to Ellvin and analyzed at a later time if desired. Section 4.7. gives instructions for importing data from the FROG. Instrument Display 33 Continued next page.
34 Section 4: Field and Lab Analysis Procedures Continued This section provides detailed instruction for various procedures that are essential to operating the FROG-4000 TM. Procedures include: 4.1: Powering On/Charging Battery Description of components and connections. 4.2: Connecting to Computer/Ellvin Instructions/description for components and connections. 4.3: Instrument Settings Set parameters to optimize instrument function. 4.4: Instrument Preparation Remove interfering contaminants/ensure a clean instrument. 4.5: Loading a Sample Air, liquid, and soil sample preparation and loading instructions. 4.6: Running A Sample Instructions/description for an analysis cycle. 4.7: Importing Data to Ellvin Import stored data from FROG to Ellvin for analysis. 34
35 Complete the following procedures to run an analysis. NOTE: The user should be familiar with Ellvin before loading and running a sample : Powering On/Charging Battery : Instrument Preparation : Loading a Sample : Running A Sample If not connected to Ellvin, : Importing Data to Ellvin 6. Clean the instrument when all samples have been completed by repeating Step : Instrument Preparation Exception: Samples of the same, known analyte may be run consecutively from low concentration to high without rinsing the instrument and creating a clean baseline. 35
36 This page is intentionally left blank. 36
 9V POWER, or use battery power. (Figure 4.")

37 Section 4: Field and Lab Analysis Procedures Continued 4.1: Powering On/Charging Battery Powering On Connect power cable to power port (R) 9V POWER, or use battery power. (Figure 4.1-1) Turn power switch (O) to ON (fully up) position. The instrument display screen will be visible. O O To R, 9V POWER R, 9V POWER R, 9V Power To Outlet Figure 4.1-1: Power port, power cable and power switch. When the FROG-4000 TM display screen shows READY, the instrument is ready to load a sample. VOC ANALYZER GC TEMP:37C READY LOG_016 BTEX V
38 4.1. Powering On/Charging Battery Continued Charging the Battery FROG-4000 TM User s Manual 1. Plug battery charger into Battery charge port (S) and outlet source. 2. Place battery charger switch to 1.8A. 3. While the battery is charging, the light on the charger switch will appear red. 4. When the battery is completely charged, the light on the charger switch will appear green. 5. It is highly recommended that the battery be fully charged before the instrument is used in a remote setting. 38


39 S, Battery Charge To S, Battery Charge To Outlet 39
40 This page is intentionally left blank. 40
41 Section 4: Field and Lab Analysis Procedures Continued 4.2: Connecting to Computer/Ellvin There are two possible connections between the FROG and a computer. To receive live data and communicate with the FROG using Ellvin, connect a computer to the serial data port (Q) on the FROG with the USB to Serial Data-Cable. To import data from the instrument s internal SD card to Ellvin, connect a computer to Port N on the FROG with the USB-Cable. NOTE: Detailed instructions for exporting data with the USB cable are given in Section 4.7. N Q To Laptop USB To Laptop USB To Q for Serial Data USB to Serial Data-Cable To N USB-Cable 41
 to the ON position. 3. If necessary, install Ellvin onto laptop or PC. 4. Open Ellvin by double clicking on the Ellvin icon.")
42 4.2. Connecting to Computer/Ellvin Continued FROG-4000 TM User s Manual Serial data-cable Connection 1. Connect the serial data-cable from the FROG s serial data port (Q) to a USB port on a computer. 2. Set the instrument power switch (O) to the ON position. 3. If necessary, install Ellvin onto laptop or PC. 4. Open Ellvin by double clicking on the Ellvin icon. O Q USB To Laptop USB 42 Serial Data-Cable To Q
43 After Ellvin has opened, the default screen that appears is the chromatogram display screen in Live Data Window. (Figure 4.2-1) Figure shows details of the display screen Figure 4.2-1: Ellvin default screen. Software Features Software Features Tabs Tabs Figure 3.2-2: Ellvin default screen details. Figure 4.2-2: Ellvin default screen details. 43
44 4.2. Connecting to Computer/Ellvin Continued FROG-4000 TM User s Manual 5. Click Port on the display screen, then select a COM#. 6. The connection status indicator in the lower left corner should now read CONNECTED indicating that the FROG and Ellvin are connected. The user may now manage settings and run analyses from Ellvin. 44

45 Section 4: Field and Lab Analysis Procedures Continued 4.3: Instrument Settings The FROG-4000 TM comes with general default setting for VOCs, which are shown in Figure on the following page. The settings determine the duration of different analysis phases, as well as the desired temperature of the GC column. The settings are defined and loaded to the instrument using Ellvin. Table on the following page describes the various settings. The FROG-4000 TM default settings are best for the analysis of Benzene, Toluene, Ethylbenzene and Xylenes (BTEX), but the settings can be altered for analyzing a wide variety of compounds and concentrations. (See Appendix I for a list of detectable chemicals). The current operational settings are stored in the FROG-4000 TM memory and do not revert to the default settings when the instrument is disconnected from the software or power. They are retrieved and displayed under the Settings Window when the instrument is connected to a computer through Ellvin. Instructions for adjusting the settings begin on the following pages. Connect to Ellvin to manage the settings. 45
46 4.3. Instrument Settings Continued FROG-4000 TM User s Manual Table Description of Settings Settings T a Description Hold time at lower GC temperature (seconds) T b Ramp time from GC cold to GC hot temperature ( o C) T c Hold time at hot GC temperature ( o C) C t Initial cold GC temperature ( o C) NOTE: If used outdoors, the user must consider ambient conditions. H t Final hot GC temperature ( o C) COLLECT CLEAN PRESETTLE SETTLE FIRE Collection time of VOCs onto PC (seconds) This corresponds to the sparge time. Time cleaning PC by heating (seconds) Time PC cools after cleaning (seconds) Time allowed for pressure to stabilize before PC FIRE (seconds) for GC analysis Time PC is Heated to Release VOCs (seconds) Figure 4.3-1: Description of GC Temperature Settings. 46
47 Defining and applying the settings. 1. Connect to Ellvin. Refer to: 4.2: Connecting to Computer/Ellvin 2. Click on the Ellvin Settings Tab. 3. Type in a non-zero integer then click SET to apply the settings to the instrument. Changes to the settings are stored on the instrument. Settings DO NOT revert to the default parameters when power is removed or computer is disconnected. The minimum and maximum values are listed next to the Figure Settings Min Max Ta Tb Tc Ct Ht Collect Clean 2 20 Presettle 4 20 Settle 2 20 Fire 4 20 Figure 4.3-2: Setting Window showing Default Settings 47

48 Section 4: Field and Lab Analysis Procedures Continued Figure Rinsing the Instrument Steps
 LOAD 2. Place sparge bottle in the DOWN Position. (See Section 2.2.2) 3.")
49 4.4: Instrument Preparation FROG-4000 TM User s Manual Before running analyses, the instrument should be rinsed and display a clean baseline RINSING THE INSTRUMENT 1. Place the load/analyze valve in the LOAD position. (See Section 2.2.1) LOAD 2. Place sparge bottle in the DOWN Position. (See Section 2.2.2) 3. Attach syringe with 5 ml deionized water to FROG-4000 TM. (Figure 4.4-1, opposite page) Figure 4.4-2: Load/ Analyze Valve 4. Load deionized water into FROG-4000 TM. 5. Remove sparge bottle and empty the water into waste container. 6. Repeat steps 3-5 twice, for a total of three rinses. 7. Remove and rinse sparge bottle with deionized water. 8. Replace the sparge bottle in the DOWN position. Proceed to demonstrate a clean baseline (following pages). 49
50 4.4. Instrument Preparation Continued FROG-4000 TM User s Manual CREATING A CLEAN BASELINE A Clean Baseline should be achieved before analyzing a sample. This procedure ensures that there are no contaminants in the instrument that could effect the analysis results. If the instrument is connected to a computer and Ellvin, the start button and display screen are in the software. If the instrument is not connected to Ellvin, the start button and display screen are on the instrument. Rinse the instrument as described in Section before attempting to achieve a clean baseline Procedure: 1. Place load/analyze valve in the LOAD position. (See Section 2.2.1) 2. Place rinsed sparge bottle in the DOWN position. (See Section 2.2.2) 3. Attach syringe with 5 ml deionized water to FROG-4000 TM. 4. Load deionized water into FROG-4000 TM 5. Remove the empty syringe 6. Place the load/analyze valve in the ANALYZE position. 7. Move the sparge bottle to the fully UP position and tighten the sparge nut in the clockwise direction until lightly snug. Continued following pages. 50


51 LOAD POSITION
52 CREATING A CLEAN BASELINE CONTINUED 7. Begin an analysis cycle using deionized water. If connected to Ellvin, click the start button in the software. If not connected to Ellvin, press the yellow start button on the instrument. Start Button Start Button in Ellvin When the analysis is finished, a clean baseline should appear. A clean baseline is basically smooth with no significant peaks. A small peak at the beginning of the chromatogram and small waves in the clean baseline are acceptable. Clean Baseline on Ellvin Screen A small peak at the beginning of the chromatogram is normal. If Peaks do appear, repeat the instrument preparation procedures (4.4.1, Rinsing the Instrument and 4.4.2, Creating a Clean Baseline) until a clean baseline is achieved. 52


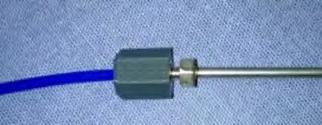
53 4.4. Instrument Preparation Continued FROG-4000 TM User s Manual CONNECTING THE AIR SAMPLE ADAPTOR If analyzing air sample, the user must first connect the air sample adaptor to the FROG. Valve Control Exhaust Port Sparge Needle Port Wand Connection The air sample kit includes a sample wand and an air sample bag adapter. The air sample bag adapter enables direct connection to an air sample bag. 53


54 CONNECTING THE AIR SAMPLE ADAPTOR CONTINUED FROG-4000 TM User s Manual 1. Attach the air sampler to the FROG sparge needle. Be sure the valve is pointed to the right. 2. Connect the air sampler s valve connector to the FROG valve connection. This connection supplies power to the air sampler. 3. Attach the exhaust connector to the FROG exhaust with a twisting motion. 54


55 6. Connect the air sample wand to the air sampler. 55
56 This page is intentionally left blank. 56
57 4.5: Loading a Sample FROG-4000 TM User s Manual Section 4: Field and Lab Analysis Procedures Continued NOTE: The instrument should have a clean baseline to begin sample loading and analysis. Refer to: 4.4: Instrument Preparation To ensure optimal sample analysis, adhere to the following sampling and cleaning procedures : Liquid Sample: a. Pull 5mL of the sample liquid into a syringe. b. Transfer sample liquid to the sparge bottle. c. Rinse sparge bottle and syringe between test runs. Soil Sample: a. Remove the sparge bottle from the instrument. b. Add 1 g of soil to the sparge bottle with then add 5 ml of clean water. (See our website for an application note on methanol extraction.) c. Rinse the sparge bottle thoroughly between samples. Air Sample: Connect the air sampler adaptor and wand to the FROG (Section 4.4.3). When running an analysis (Section 4.6), hold the wand in the area desired for sample collection. If heavy concentrations are detected, run a sample of clean air to clear the system. Detailed instruction begin on the following page. 57
. (See Section 2.2.1) LOAD 2.")
58 4.5. Loading a Sample Continued If concentrations are known, during calibration for example, a series of samples of the same analyte may be run consecutively without rinsing the instrument. They must be run in order from low to high concentrations to prevent cross contamination. Procedure: 1. Place load/analyze valve in the LOAD position (open). (See Section 2.2.1) LOAD 2. Load sample into sparge bottle Liquid Samples: Place sparge bottle in DOWN position. Load 5 ml of sample through Sample Inlet Silty Liquid Samples: Load 5 ml of sample directly into the top of the sparge bottle. Place sparge bottle in DOWN position. Soil: Load 1 g sample directly into the top of the sparge bottle. Fill 5mL syringe with deionized water. Transfer the 5mL of deionized water into the sparge bottle while rinsing soil to the bottom. Place sparge bottle in DOWN position DOWN


59 3. Immediately place the load/analyze-valve in the ANALYZE position (closed). The syringe may now be removed. ANALYZE Position 4. Return sparge bottle to the UP position. Rotate the sparge bottle nut counter clockwise until finger tight to secure the sparge bottle. The sparge bottle should not spin in the sparge bottle nut. NOTE: When the sparge bottle is fully UP, the sparge tube is near the bottom of the sparge bottle. A partially lowered sparge bottle will cause analyte peaks to shift right. UP Sparge bottle in the UP position. 59
60 4.5. Loading a Sample Continued FROG-4000 TM User s Manual The instrument display screen shows READY throughout Steps 1-4 of Loading a Sample. The Log # is automatically generated and assigned to the data file produced by the current analysis cycle. VOC ANALYZER GC TEMP:37C READY LOG_016 BTEX V
61 4.6: Running A Sample FROG-4000 TM User s Manual Section 4: Field and Lab Analysis Procedures Continued This section describes the procedure for running an analysis and the instrument s stages during an analysis cycle. Procedure: Record notes for future reference: If not connected to Ellvin, the user should record the LOG#s and other relevant information for future reference. The instrument records this number in the file name on the internal SD card. If connected to Ellvin, the user can record relevant information for sample identification in Ellvin s Notes window. Ellvin automatically stores the analysis data file in a folder labeled with the date. The file itself is labeled with the time it was created. After the sample loading is complete (Section 4.5), the user may begin sample analysis by pressing the start button. If connected to Ellvin, click the start button in the software. If not connected to Ellvin, press the yellow start button on the instrument. Start Button on the Frog Start Button in Ellvin Continued next page. 61
62 4.6. Running a Sample Continued During an analysis cycle, the FROG screen displays the analysis steps in sequence as illustrated below and on the following pages. This information is only visible on the instrument screen (not the Ellvin screen). Each sequence has a clock counting down the duration of the current analysis step. The duration of the analysis step is determined by the instrument settings. (See Section 4.3) The GC TEMP may vary slightly from the set point. Analysis Sequence 1. Cleaning Prior to Sparging: The PC is heated to drive off contaminants (analytes from previous runs). CLEANING 4 2. Settle: The PC cools before sparge begins. SETTLE 4 3. Sparge and Collect: VOCs are sparged and collected on the PC. COLLECT 30 SPARGE ON Continued next page. 62
 into the GC column and continue through to the PID. RELEASE AND ANALYZE SPARGE OFF PC 6 6.")
63 4. Release and Analyze, Settle: The sample flow is switched to the analysis channel. The pressure is allowed to stabilize before the PC fires. RELEASE AND ANALYZE SETTLE 2 5. PC Fire: The PC is heated and analytes are injected (released) into the GC column and continue through to the PID. RELEASE AND ANALYZE SPARGE OFF PC 6 6. Analyzing: The PID measures analytes as they emerge sequentially from the GC. RELEASE AND ANALYZE SPARGE OFF ANALYZING Chromatogram: The analysis concludes with a chromatogram of the analytes detected. NOTE: the chromatogram does not appear on the display if the FROG run is initiated through Ellvin. Continued next page. 63
64 4.6. Running a Sample Continued Analysis Sequence Continued 8. Instrument Estimation: When the instrument is not connected to Ellvin, it makes an estimate of the analytes concentrations based on calibration data. Click the yellow start button to scroll through analytes. The two estimates shown in this example are 33ppb Benzene and 63ppb Toluene. The GC retention time for Benzene is displayed as seconds. BENZE 33PPB 48.33S Estimate #1 Click the Start Button to see the next analyte estimate. TOL U 63PPB 68.72S Estimate #2 NOTE: The instrument estimates are only available immediately after the corresponding analysis. They are NOT stored on the instrument s SD card. Complete analysis chromatogram data are stored on the SD card and can be imported to Ellvin for further analysis. 9. Log File/WAIT: The screen returns to the original display and shows the Log File # for the NEXT analysis. WAIT indicates that the GC temperature is above the lower GC set point. VOC ANALYZER GC TEMP:37C WAIT LOG_017 BTEX V
65 The FROG is ready for another sample loading and analysis once the GC Temperature indicator appears green and READY is displayed on the FROG screen. VOC ANALYZER GC TEMP:37C READY LOG_017 BTEX V Samples of the same analyte may be run consecutively from low concentration to high without rinsing the instrument and creating a clean baseline. NOTE: If the user has run a high-concentration sample, it is advisable to complete the following procedures: Liquid or Air Sample, perform: 4.4: Instrument Preparation Soil Sample: Remove sparge bottle from instrument and fill it with deionized water. Rinse it thoroughly to remove all dirt from bottle. Then, perform: 4.4: Instrument Preparation Continued next page. 65
66 Final Step: If desired, use Ellvin for detailed results analysis after completing the analysis run. If the sample was run while connected to Ellvin, open the data file in Analyze Window and use Integrator 2. (See Sections and 5.2.3) If the sample was not run while connected to Ellvin, import the data to Ellvin (Section 4.7), then open the file in Analyze Window and use Integrator 2. 66

67 Section 4: Field and Lab Analysis Procedures Continued 4.7. Importing Data to Ellvin Ellvin allows the user to view live results, change operating parameters, re-plot stored data and overlay data for comparison. It also has tools for integrating peak areas, measuring retention times, and calibrating the instrument. The FROG-4000 TM stores data from every analysis on an internal SD card. The following steps describe the process for extracting data from FROG-4000 TM for analysis with Ellvin. 1. Connect Port N on the FROG-4000 TM to a computer using the USB-Cable. To Computer USB To N USB-Cable N O 2. Turn the instrument on. (O) Continued next page. 67
68 4.7. Importing Data Continued 3. The computer screen will display an option to Open folder and view files. Open the folder. 4. The computer screen now displays a list of sequential files named LOG_XXX. The file names are created and assigned by the instrument. They appear on the instrument screen at the beginning of each analysis cycle as shown in Figure VOC ANALYZER GC TEMP: 40C READY LOG_016 BTEX V Figure 4.7-1: FROG-4000 TM display screen at the beginning of a sample run. NOTE: If the instrument is NOT connected to Ellvin when running analyses, the user must record the LOG file numbers of sample runs intended for future analysis. The LOG file numbers, as well as the instrument estimates, are only available on the instrument s screen at the time the sample is run. 5. Select the LOG file of interest and drag/copy it to the computer desktop or other location of user s choice. 6. Open Ellvin. 7. Open Live Data Window. 8. Click on the OPEN button. 68

.")
69 9. Browse to the location where the LOG file of interest was dragged/copied. 10. At the bottom of the Select Data File window, change Files of Type to LOG Files. 11. Select the LOG file of interest and open it. 12. The computer screen now displays a chromatogram of the file data as it is imported into Ellvin. At this time, Ellvin also converts the data to an XML format and stores it. The location path of the stored data is displayed at the top of the chromatogram in the Live Data Window (Figure 4.7-2). The data can now be opened in the Analyze Window. Data Location Path Figure 4.7-2: Live Data Window with chromatogram and data location path. 69
70 4.7. Exporting Data Continued 12. Click on the OPEN icon. 13. Follow the location path displayed in the Live Data Window to the folder that contains the data file of indicated. 14. Location Path Example: C\Users\...\...\ \1716_LOG_xxx.xml The highlighted numbers correspond to the date the storage folder and data file were created by Ellvin. In this example, September 30, The folder contains a list of files. The file names are derived from the time Ellvin converted the data. In the example in Figure 4.7-3, the file named 1716 was converted at 5:16 PM on 9/30/ Open the folder with the location path date. 16. The Select the file of interest. Folder name is the Date File name is the Time Figure 4.7-3: Data files named and stored by Ellvin. 70
71 Figure 4.7-4: File Selection Screen 17. A preview chromatogram of the selected file appears to the right of the file list (Figure 4.7-4). 18. Click Select to open the file of interest. Ellvin will automatically transfer to the Analyze tab and display the data. Proceed to analyze the data with Ellvin Integrator 1 or 2. (See Section 5.2.3) 71
72 This page is intentionally left blank. 72

73 SECTION 5: ELLVIN SOFTWARE FROG-4000 TM User s Manual The chromatogram software, Ellvin TM, is primarily used to perform detailed analyses of sample data. Ellvin uses calibration data to: Assign analytes to chromatogram peaks based on GC retention times. Report the analytes concentrations based on peak heights and integrated peak areas. Ellvin also manages the instrument settings and loads calibrations to the instrument. Several general features of Ellvin, as well as a few features specific to Analyze Window, are described in the following pages. The user should be familiar with all the features before starting a sample analysis. Software Features Figure 5-1: Ellvin default screen details. Tabs To start using Ellvin, refer to: 4.2: Connecting to Computer/Ellvin Continued next page. 73
74 Section 5. Ellvin Software Continued 5.1. FEATURES OF ELLVIN FROG-4000 TM User s Manual WINDOWS The Ellvin Software has four windows that are accessed with tabs when the software is open. Window Tabs in Ellvin Live Data Window: This is the default window for Ellvin. In Live Data Window, Ellvin creates a chromatogram from sample analysis data. The data source may be: a. From a sample run on the FROG while connected to Ellvin and simultaneously imported to Ellvin. b. From sample data previously recorded on the instruments SD card, then imported to Ellvin. Analyze Window: As in Live Data Window, Ellvin creates a chromatogram from sample analysis data. In this window, Ellvin retrieves analysis data that was previously stored on a computer. In Analyze Window the user can examine chromatograms closely, integrate chromatogram peaks, and export data to Excel. Calibration Window: In this window, Ellvin uses analysis data from chemical standards to calibrate the FROG. Settings Window: In this window, Ellvin manages the settings for the FROG. The settings define temperature and duration parameters for various phases of the instrument s analysis cycle. Refer to: 4.3: Instrument Settings 74
75 PORT Use this feature to select the correct data port connection from the FROG-4000 TM. The user selects a COM# to connect to the FROG. Connection Port Based on the selection of COM, the Connection Port will notify the user if the FROG is CONNECTED or DISCONNECTED, and if the parameters have been updated. (Bottom left corner of the software display screen). GC Column Temperature Indicator This feature monitors and displays the GC temperature. The icon is GREEN when instrument is ready for Loading. It turns RED during sample analysis. 75
76 5.1. Features of Ellvin Continued Start/Stop Button Clicking on this button causes the FROG-4000 TM to start an analysis cycle. Once the analysis has begun, clicking the button will stop the analysis, but will NOT save the chromatogram. OPEN Button Click on this button to open saved files. The files can be from data stored on a computer or on the instrument s internal SD card. EXPORT Export only works when Ellvin is in Analyze Window. The user can export an opened file into Microsoft Excel program for further analysis. 76
. The peaks correspond to separated analytes.")
77 Chromatogram Display Screen The software display screen shows sample analysis data. The X-axis is time in seconds. The Y-axis shows the instrument s PID response and GC temperature ( o C). The peaks correspond to separated analytes. J Instrument PID Response GC Temperature (C) Time (seconds) Key The Key explains colored lines that are shown on display screen. 77
78 5.1. Features of Ellvin Continued Notes This tool allows the user to records notes about samples while in Live Data or Analyze Window. The notes are saved when the sample analysis is completed. It is important to record the date and time that data files are created in order to locate and retrieve them for further analysis. Magnifying Glass Use this tool to zoom into a chromatogram while data is being collected in Live Data Window, or while in Analyze Window to help with integration. Detailed instructions for using Magnifying Glass follow in Section MOVE Use this tool to move the chromatogram up and down the Y-axis. 78
79 Integrator 1 This feature only operates while in Analyze Window. The user creates a baseline and integrates peaks, then calculates the peak height and area. The baseline integration limits are set by clicking the left mouse button. Integrator 2 This feature only operates while in Analyze Window. Ellvin creates a baseline by snapping vertically from the left mouse click position to the data line. Ellvin then calculates the peak height and area. Integrator 2 is recommended for the most consistent analysis results. Detailed instructions for using Integrator 2 follow in Section Data Grid Use with Integrator 1 and 2. The Data Grid shows: Analyte (Toluene) Based on calibration retention times. Peak Reference Number (1) Retention Time ( ) Peak Height (40291) Peak Area (430363) Calculated concentration (87.31) Based on calibration concentrations. 79
80 Section 5: Ellvin Software Continued 5.2. APPLYING ELLVIN FEATURES FROG-4000 TM User s Manual OPEN BUTTON To open stored files in Analyze Window: Click on the Analyze Tab. Click the OPEN button. A file selection screen appears. (Figures and ) NOTE: Ellvin automatically labels folders and files as they are created. Folders of data files are labeled by the DATE they were created. Data files are labeled by the TIME they were created and the LOG number. In the example shown in Figure , the data file was created at 5:16 PM on September 30, To locate the data file of interest, browse to the folder labeled with the date the sample was run, or the date the data file was imported from the FROG to Ellvin. Double click to open the folder. Click on a data file of interest. A preview of the data chromatogram appears to the right of the list. Click Select to open the file for analysis with Integrator 2. 80


81 Folder name is the Date File name is the Time Figure Data files Figure : File Selection Screen 81
82 5.2. Applying Ellvin Features Continued FROG-4000 TM User s Manual MAGNIFYING GLASS The Magnifying Class can be used in Live Data Window during data import, or while in Analyze Window. Click on the magnifying glass icon to start. To Magnify: Left click and hold Drag mouse over desired magnified area. (Figure ) Release the mouse button. The area being magnified is highlighted light blue. The display screen then readjusts to show the magnified area. (Figure ). To De-Magnify: Click the circle on the scroll bars. OR double click the magnifying glass icon. 82

83 Figure : Desired Magnified Area Figure : Magnified Area 83
84 5.2. Applying Ellvin Features Continued FROG-4000 TM User s Manual INTEGRATOR 2 Integrator 2 can be used only in Analyze Window. This tool calculates the area under a peak and the peak height. The area or peak height helps determine the concentration of the analyte. Click on the Integrator 2 button to start. Technique to Integrate: (Refer to Diagrams and ) Begin at the lowest point, Valley 1. Drag the mouse to draw an integration line, past the peak, to the second lowest point, Valley 2. The integration line should NOT cross the data line. Avoiding this ensures the correct calculation for the peak area. (Figure ). 84
85 Peak Integration Line Valley 1 Valley 2 Diagram : Valleys and Peaks Peak Valley 1 Integration Line Valley 2 Diagram : Crossing Data Line 85
86 Integrator 2 Continued Integrating a Single Peak Using the correct technique illustrated on the previous page, select the desired peak for integration. Select Integrator 2. Left click the mouse and hold at Valley 1. Drag to Valley 2 and release. The Integrator 2 tool uses the software to select the baseline on which the integration line is drawn. The gray shadowed area in Ellvin will show which area is being integrated. (Figure ) The integration is complete when a solid black line appears. The Data Grid shows the data that corresponds to the related peak. The user can continue integrating peaks. 86
87 Figure : Desired Peak Integrated Area 1 Figure : Integration Line Data Grid 87
88 Integrator 2 Continued Integrating Multiple Peaks To integrate multiple peaks, follow the same procedures for integrating a single peak using Integrator 2. Click on the Integrator 2 button to start. Right click and hold the mouse at Valley 1. Drag to Valley 3 and release. The integrator uses Ellvin to select the baseline on which the integration line is drawn. The integration is complete when a solid black line appears. The result shows the integration line and the splits placed between joined peaks. (Figure ) To integrate the remaining peak (in Figure , Peak 3). Click and hold at Valley 3 and drag to Valley 4. The Data Grid shows the data that corresponds to the related peak. The user can continue integrating peaks. Valley 2 Valley 3 Valley 4 3 Valley Figure : Integration of multiple peaks complete. Data Grid 88
89 When integrating multiple peaks it is necessary to follow the baseline as closely as possible. It is recommended that each peak be carefully assessed before integration. It is usually best to integrate each peak separately unless the valley between the peaks does not reach the baseline as in the case of peaks 3 and 4 in the figures below (Figure and Figure ). Figure : Improper Integration of Multiple Peaks Figure : Improper integration of Multiple Peaks Figure : Proper integration of Multiple Peaks 89
90 This page is intentionally left blank. 90
91 SECTION 6: CALIBRATION This section provides detailed instructions for calibrating the instrument. The system is calibrated by testing a series of analytes at varying, known concentrations. As with all GC work, these analytes are selected from an established list of chemicals that are of foremost interest in the environment under investigation. Before beginning a calibration, it is recommended that the user become familiar with Ellvin. Refer to Section 5. The user should also be familiar with analytical techniques for GC calibration. The preparation and use of standards for calibrating the instrument differs for air, liquid, and soil samples. Section 6.1 introduces the procedure for preparing standards. Section 6.2 provides detailed instruction for using the features found in Calibration Window. Section 6.3 provides detailed instructions for calibrating the instrument. 91
92 Section 6: Calibration Continued 6.1. CALIBRATION STANDARDS NOTE: The instruction in Sections and correspond to Step B-3 in Section STANDARDS FOR LIQUID OR SOIL SAMPLES Run at least four calibration samples from low to high concentrations. Preparation: 1. Calculate the dilutions for the intended calibration samples. Traditionally, a ppb concentrations of analytes in water are expressed in micrograms of analyte per liter of water (1 Kg water). Standards typically come pre-diluted in methanol, which cannot be ionized (and therefore not detected) by the instrument s PID. The following page provides examples for calculating dilutions. µg/ml =mg/l =ppm (mass) µg /L = ppb (mass) BTEX = Benzene, Toluene, Ethylbenzene, p/m-xylene, o-xylene MEOH = methanol (GC/MS grade) 92
93 Diluting from a Standard Let C A = original concentration of an analyte in a solvent, and F = desired dilution factor so C B = C A / F. Find S = volume of mix C A that must be added to a solvent volume D to achieve concentration C B. The mass of analyte in volume S is M A = S * C A C B = C A / F = M A / ( D + S * (1-C A )) = S * C A / (D + S) (approx. for small C A ) Solving for S yields S =D / (F-1) Example: Using C A = 2000 µg/ml BTEX in MEOH standard to make a C B = 200 µg/ml BTEX in MEOH standard (that is F = 10), you must add 500 µl of C A mix to 4.5 ml MEOH. Diluting 5mL Water with Standard Convert ml to µl. 5mL water filled syringe into 5000µL Spiking the 5000µL water filled syringe You have a 200ppm BTEX standard. What is the resulting concentration from injecting 2µL of the 200ppm BTEX standard into the 5000µL water filled syringe? 93
94 Standards for Liquid and Soil Samples Continued Preparation Continued: 2. Fill a syringe with 5mL deionized water. 3. Load a known volume, as calculated on the previous pages, of a liquid standard into the syringe. 4. Connect to Ellvin and follow the sample loading instructions in Section : Loading a Sample STANDARDS FOR AIR SAMPLES Gas calibration standards are available from several sources and we recommend searching the internet with the term Calibration Gas Standards. The standard typically comes in a pressurized cylinder with a mixture of analytes in nitrogen to achieve the proper dilution. A typical mix for calibration would be 100 ppbv BTEX in N2. Concentrations are typically in parts per billion by volume. A regulator on the bottle controls the flow and pressure at the exhaust. Because sample will be collected directly from the atmosphere, we suggest connecting the FROG s sample tube to the bottle with a Tee. One port on the tube should vent to the atmosphere and flow of the sample gas should exceed the collection flowrate of the Frog (~60 ml/min). The FROG permits the creation of a single point calibration, and this is adequate for many applications. Results will be good near the calibration gas concentration, but less reliable further from that concentration. Multiple point calibrations are preferred. 94

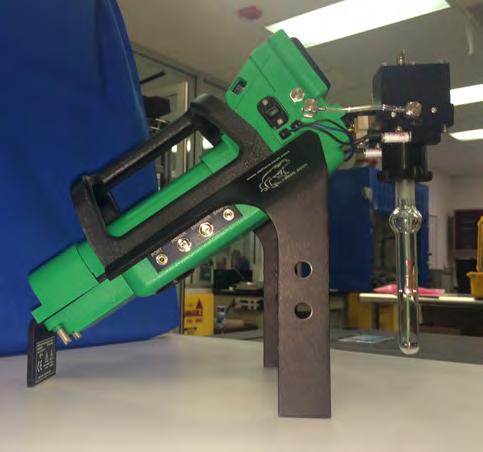
95 STANDARDS FOR AIR SAMPLES (CONTINUED) Run at least four calibration standards from low to high concentrations. Defiant Technologies sells a portable gas diluter accessory to be used with the FROG for air calibrations. Tools Needed: Portable Gas Diluter Calibration Gas Air Sampler Gas Diluter attached to Calibration gas and FROG Instrument Preparation: Connect Air Sampler to instrument and then connect air sampler to the gas diluter. Place load/analyze-valve in the load position (open). (See Section Connecting the Air Sample Adapter). Connect the calibration gas to the gas diluter. Continued next page. 95
96 Standards for Air Samples Continued. Standard Preparation and Loading: 4.6: Running A Sample FROG-4000 TM User s Manual 1. Use the spreadsheet provided with the Gas Diluter. This will allow for the calculation of sample concentration using the starting concentration of the calibration gas. 2. Adjust the flow rates on the gas diluter until stable at the desired rates. 3. Press the start button and run sample. Refer to: 4. Repeat for other sample concentrations. For more detail on the air calibration procedure using the Gas Diluter please refer to the Gas Diluter User s Manual. Another method to perform multiple point calibrations is to buy multiple compressed standards or, alternatively, to prepare multiple concentrations in Tedlar gas sample bags. We will not go into details on these procedures. We will point out, however, that it can be difficult to achieve accurate concentrations much below 20 ppbv. Low concentration samples tend to degrade in compressed cylinders, and sample bags often have contaminants that appear as large peaks in the chromatography. It is still possible to achieve reasonable results and a Frog user is welcome to call Defiant Technologies for further discussions. 96

97 Section 6: Calibration Continued 6.2. ELLVIN CALIBRATION WINDOW FEATURES To start using Calibration Window, open Ellvin and click on the Calibration Tab LIST OF ANALYTES This feature allows the user to create a List of Analytes that may be used to calibrate the instrument. The analyte names in the List of Analytes will later be associated with analyte peaks from calibration standard runs. (See Figure 6.2.1) The Retention Time, Peak Height, and Peak Area in Figure are generated from previous analyses of standard solutions with known concentrations. Figure 6.2.1: List of Analytes 97
98 Create the List of Analytes Enter the name of the desired calibration analyte in the Analyte Name window. Create and enter an abbreviated name for the analyte in the Analyte Alias (maximum of 5 Characters). The Analyte Alias will be displayed on instrument screen. To make an addition to the List of Analytes, click the ADD button. To delete an analyte from the list, click on the analyte in the List of Analytes. The desired analyte will be highlighted blue when selected. Click Delete on keyboard to delete the analytes from the list. 98
99 6.2. Calibration Window Features Continued CORRELATION CHART AND EQUATIONS This feature in the Calibration Window displays the degree of correlation between analyte standards of varying concentrations and the instrument s response to them. (See Figure 6.2.2) The correlation is calculated as both a linear equation and a 2nd order quadratic equation. The user may choose to view the equations and a chart for either Peak Area correlation or for Peak Height correlation. This correlation is important because Ellvin uses these parameters to calculate concentrations for future samples. Figure 6.2.2: Correlation Equations and Chart 99
100 Section 6: Calibration Continued 6.3. CALIBRATION PROCEDURE The Calibration Procedure consists of running a series of analysis cycles with standards of varying concentrations for a given analyte. Ellvin then uses the analysis data for the standard solutions to calibrate the instrument. Before beginning a calibration, the user should be familiar with: 4.3: Instrument Settings 4.4: Instrument Preparation 4.5: Loading a Sample 4.6: Running A Sample And, Using Ellvin. (Section 5) 100
101 It is recommended to run a minimum of four standards, from low to high concentration, to create data points for calibrating the instrument. The concentration range for calibration standards depends on the analyte and its unique retention time. Example standard concentrations for a calibration: 2, 10, 50, 100ppb. Calibration Procedure Steps A. Add the Calibration Analytes to the List of Analytes. (See Section 6.2.1) The steps in this section prepare the software to calibrate using selected analytes. A-1 Open the Calibration Window. A-2 Begin by adding each of the analytes chosen for calibration, one at a time, to the Analyte List. (See Section 6.2.1) No data will be displayed and the chart display area will be blank. Disregard any equations displayed. Continued next page. 101
102 6.3. Calibration Procedure Continued FROG-4000 TM User s Manual B. Run the Calibration Standards In this section the calibration samples are loaded and instrument response data is stored. Open the Live Data Window B-1. Create a clean baseline before running any calibration samples. Refer to: 4.4: Instrument Preparation B-2. To begin the calibration, load and run a sample containing only deionized water. Refer to: 4.5: Loading a Sample 4.6: Running A Sample B-3. Load and run a minimum of four calibration standards of the selected analytes. The samples should be of varying concentrations and should be run in order from low to high concentrations. See Section 6.1 for sample preparation. B-4. For each of the calibration standards, record the concentrations in the Notes window. This will help identify the files during analysis and calibration. 102

103 After the instrument has completed running the four (or more) calibration standards, go to the Analyze Window in Ellvin to analyze the instrument response data. C. Analyze the Data In this window Ellvin analyzes the stored instrument response data to create the information needed for calibration. Open the Analyze Window C-1. Click on the OPEN button to access a list of previously run sample files. (Figure 6.3-1) (See Section for details) C-2. Select the calibration sample file desired for data analysis. The files are labeled by the time they were created and the LOG number. Figure 6.3-1: Open Sample Files 103

104 6.3. Calibration Procedure Continued C-3. In the Analyze Window, click on the Integrator 2 button to integrate the sample peaks in the chromatogram. (Refer to Section for detailed instructions on using the Integrator 2) The results of the data analysis are displayed on the chromatogram and in the Data Grid. (Figure 6.3-2) The example shown in Figure is for a sample of BTEX. Analytes may be run one at a time to determine or confirm retention times. Figure 6.3-2: Analysis Chromatogram and Data Grid 104

105 D. Calibrate the Instrument In this section, the data analyzed in Section C is transferred to the Calibration Window. Ellvin uses the data to calibrate the instrument for each analyte. D-1. To transfer data to the Calibration Window: Right click the Data Grid. The List of Analytes previously recorded in the Section A of the Calibration Procedures appears. D-2. Use the Analyte drop down list to select the analyte that corresponds to each peak based on retention time. Match all the peaks with an analyte. In the example shown in Figures and 6.3-4, benzene is selected for Peak #1 because in previous single-analyte tests, benzene had a retention time of 52 seconds. NOTE: Retention times are dependent on instrument and temperature profile, and will vary from instrument to instrument. Benzene Figure 6.3-3: Assigning Analytes to Chromatogram Peaks 1 Figure 6.3-4: Benzene is Selected for Peak #1. 105

106 6.3. Calibration Procedure Continued D-3. To view the imported data, open the Calibration Window, click on List of Analytes, and select the desired analyte. The imported data for this analyte will be displayed In the example in Figure 6.3-5, Benzene has been selected. Figure 6.3-5: Select the Desired Analyte from the List of Analytes D-4. In the Calibration Window, enter in the corresponding concentration for the calibration standard in the column titled Concentration. Standard concentrations were recorded in the Notes window in Section B of the Calibration Procedures. (See B-4) 106
107 Repeat Steps C-1 through D-4 of the Calibration Procedures to import and enter all the standard data to the Calibration Window. The Correlation Chart and Equations (Section 6.2.2) will appear after the first point is imported into the Calibration Window. The single linear point fit will be automatically forced through zero. As data points are added, correlation equations are generated by the Ellvin. A graph of the data points and the curve fit will be displayed in the calibration window, the user can now inspect the fit equation. Downloading the Calibration to the Instrument Connect the instrument to Ellvin with the USB cable. Refer to: 4.2: Connecting to Computer/Ellvin 1. All analytes listed in the calibration should show a R 2 correlation close to 1.0. The closer the R 2 value is to 1.0, then the better the software can calculate the concentration of an unknown sample. 2. Open the Settings Window. Continued next page. 107

108 6.3. Calibration Procedure Continued 3. Click on Download Calibration to Device FROG-4000 TM User s Manual 4. This will allow the instrument to estimate the concentration of analytes uploaded into the calibration using the peak height linear function. NOTE: The Ellvin software can compute concentrations using either peak height or area under the peak. However, when the instrument is running independently, its processing power is more limited, so peak height and a linear data fit are used in calculating concentrations. 108
109 SECTION 7: MAINTENANCE 7.1. ROUTINE CLEANING FROG-4000 TM User s Manual It is important to clean the FROG-4000 TM after analyzing samples in order to prevent cross-sample contamination. The FROG-4000 TM does need to be cleaned if: More than one type of analyte is being tested. The user must clean the instrument between sets of the different analytes. A high concentration is introduced. If the user observes large peaks in the chromatogram, the instrument should be cleaned prior to analyzing a sample. The FROG-4000 TM does NOT need to be cleaned immediately if: Same analyte is being tested. The user can run a set of samples of the same analyte from a LOW concentration to a HIGH concentration consecutively. The user cleans the instrument at the end of the set. Rinsing the sparge bottle and syringe between uses is always recommended. The baseline is clear. If no peaks are observed in the chromatogram, no cleaning is necessary. To clean the instrument, perform the following procedures: 4.4: Instrument Preparation The instrument is clean when a clean baseline has been achieved. 109

110 Section 7: Maintenance Continued 7.2. ANNUAL CLEANING FROG-4000 TM User s Manual It is recommended to have the FROG-4000 TM cleaned yearly by an authorized representative. Please contact Defiant Technologies for support. info@defiant-tech.com Phone: CLEANING THE SCRUBBER It is recommended to clean the carrier gas scrubber every three months, or as needed to create a clean baseline. Tools needed to clean the scrubber include: 1. *Clean Molecular Sieves 2. *Clean Activated Carbon 3. 3/32 allen wrench 2 1 Figure 7.3-1: Tools needed. *NOTE: Replacement activated carbon and molecular sieves may be purchased, premeasured and cleaned, through Defiant Technologies, Inc. Activated Carbon, Part # DT-FG4K-AC-1 Molecular Sieves, Part # DT-FG4K-MS-1 110


111 1. Remove the four corner 4-40 screws with the 3/32 allen wrench. 2. Lightly pull scrubber off FROG; place any O-rings back in place if they come out. Figure 7.3-2: Four corner screws removed and scrubber removed from FROG 3. Turn the scrubber block upside down. Position 1 has widely spaced ports. This chamber holds the molecular sieves. Position 2 has narrowly spaced ports. This chamber holds the activated carbon. Position 1 Position 1 Position2 Position 2 Figure 7.3-3: Upside down scrubber with ports visible. 111


112 7.3. Cleaning the Scrubber Continued FROG-4000 TM User s Manual 4. Turn the scrubber right-side up and remove the two, center position, 4-40 screws with the 3/32 allen wrench. 5. Remove the scrubber lid; put any O-rings back in place if they come out. Figure 7.3-4: Two Center Screws. Position 1 Position 2 Figure Open scrubber 112
113 6. Dispose of dirty activated carbon and molecular sieves. 7. Use a paper funnel to put new activated carbon into Position Use a paper funnel to put new molecular sieves into Position Replace the lid. 10. Tightly replace the two, center position, 4-40 screws with the 3/32 allen wrench. 11. Place the scrubber back onto FROG (make sure Position 1 is in correct spot). 12. Snuggly replace the four corner 4-40 screws with the 3/32 allen wrench. 13. There should be NO space in between the scrubber holder on the instrument body and the scrubber block! (Figures and 7.3-7) 14. To fix space in between, remove the block and make sure O-rings are in the proper position. No Space Space Figure 7.3-6: Correct scrubber position. Figure 7.3-7: Incorrect scrubber position. 113
114 This page is intentionally left blank. 114

115 SECTION 8: TROUBLE SHOOTING FROG-4000 TM User s Manual 8.1. INVERTING THE FROG WITH WATER IN THE SPARGE BOTTLE If the FROG has been inverted with water in the sparge bottle, it is likely that water will enter the sparge manifold. Scrubber Sparge Manifold The steps on the following pages can be used to remove the water. 115


116 8.1. Inverting the FROG Continued 1. Remove the scrubber. Look for liquid in Position 1 or Position 2 on the sparge manifold. Sparge Manifold Figure 8.1-2: Look for liquid. 2. Turn the load/analyze valve to the ANALYZE position. ANALYZE 3. With the scrubber removed, install an empty sparge bottle. Figure 8.1-3: Close the valve to the ANALYZE position 116
117 4. Press the start button on the FROG and allow the system to run through the sparge stage of the analysis cycle (a sparge cycle). Turn the FROG off when the screen displays SPARGE OFF. COLLECT 30 SPARGE ON RELEASE AND ANALYZE SPARGE OFF PC 6 Refer to: 4.6: Running A Sample 5. After the sparge cycle, power the unit down and look for water where the scrubber mounts on the sparge manifold (Figure 8.1-2, Positions 1 and 2). Repeat Steps 2 through 5 until water no longer emerges from the sparge manifold. 117
 and run a third Sparge Cycle. Look for bubbles in the sparge bottle. If bubbles appear, the liquid was successfully removed from the sparge manifold.")
118 8.1. Inverting the FROG Continued FROG-4000 TM User s Manual 6. Replace the activated carbon and molecular sieves in the scrubber, then reinstall the scrubber block. (See Section 8.1.3, Cleaning the Scrubber for procedure details) 7. Load a blank sample (deionized water) and run a third Sparge Cycle. Look for bubbles in the sparge bottle. If bubbles appear, the liquid was successfully removed from the sparge manifold. If bubbles do not appear, then contact Defiant Technologies for consultation. info@defiant-tech.com Phone: Figure 8.1-4: Look for Bubbles in the sparge bottle. 118

119 Section 8: Troubleshooting Continued FROG-4000 TM User s Manual 8.2. DEGRADING CHROMATOGRAPHY : SCRUBBER IS NOT SECURED PROPERLY If the Chromatography is degrading over time: Check the scrubber block. The scrubber block may NOT be sealed correctly. There should be no space in between the scrubber block and the scrubber holder. (Figures and 8.2-2) (Refer to Section 8.1.3, Cleaning the Scrubber) No Space No Space Space Figure 8.2-1: Correct scrubber position. Figure 8.2-2: Incorrect scrubber position. Performance can also be affected by high concentrations of analytes, or high background concentrations in the surrounding environment (See next section). 119
120 Section 8: Troubleshooting Continued FROG-4000 TM User s Manual 8.3. CANNOT ACHIEVE A CLEAN BASELINE If a clean baseline cannot be achieved after repeatedly following the procedures in Sections and (Rinsing the Instrument and Creating a Clean Baseline), contamination problems may stem from having loaded a sample with a high concentration of analyte, or from the presence of airborne contaminants. NOTE: A small peak at the beginning of the chromatogram is normal for a clean baseline. Complete the following procedures to eliminate contamination interfering with a clean baseline. Perform procedure 4.4 while connected to Ellvin and using warm deionized water. Refer to: 4.4: Instrument Preparation Repeat this procedure up to three times if necessary to achieve a clean baseline. Airborne Contaminants If it is still NOT possible to achieve a clean baseline, there may be airborne contaminants present in the ambient air. airborne contaminant can enter the sparge bottle when it is lowered. This volume of air cannot be scrubbed and will be collected by the PC. Airborne contaminants can also enter through the pump with the sparge and carrier gas though these are largely removed by the scrubbers. An 120
 If, a clean baseline is still not achievable, 3.")
121 Solutions: 1. Either circulate air in the testing environment, or move to a new location, then perform: 4.4: Instrument Preparation If, a clean baseline is still not achievable, 2. Clean the scrubber. (See Section 7.3) If, a clean baseline is still not achievable, 3. Provide an activated charcoal trap at the pump inlet (V). V 121
122 Section 8: Troubleshooting Continued 8.4. BLACK INSTRUMENT SCREEN FROG-4000 TM User s Manual Periodically, the instrument display screen will appear black. However, it should reset to appear normal at the end of an analysis run. If the display screen on the FROG remains black, it can be a sign that the instrument is overheating. Take the following steps to cool the FROG: Place instrument in the shade or indoors to help cool the GC Temp to READY status. 2. Increase the initial cold GC temperature, Ct, to a maximum of 50 o C. a. Go to Settings Window. Refer to: 4.3: Instrument Settings b. Change GC initial cold temperature (C t ) to the following range: minimum of 40 o C maximum of 50 o C (Figure 8.3-1) c. Click SET to save changes. 122
123 Figure 8.3-1: Change the GC Settings. NOTE: Increasing GC Temp will affect retention times. The instrument will operate within temperature and relative humidity conditions of 0-55 o C and 0 to 90% respectively; however, an environment comfortable for human habitation (reasonable constant temperature and humidity conditions) is recommended for optimum performance. 123
124 This page is intentionally left blank. O 124

125 APPENDIX I: AVAILABLE ACCESSORIES/SPARE PARTS Item Defiant Part # Description FROG-4000 Warranty and Service Contract DT-FG4K-SERV-1 One year service contract / maintenance program. Activated Carbon Molecular Sieves DT-FG4K-AC-1 DT-FG4K-MS-1 Replacement Activated Carbon for FROG 4000 air scrubber. Pre-measured and pre-cleaned. Replacement Molecular Sieves for FROG 4000 air scrubber. Pre-measured and pre-cleaned. Sparge Bottle DT-FG4K-SBGN-1 Sparge Bottle with globe neck. Sparge Bottle Nut DT-FG4K-SBN-1 Nut to connect Sparge Bottle to instrument. 5 ml Glass Syringe DT-FG4K-SYGG-1 5mL glass syringe with Luer Lock tip. 125


 low sensitivity (2) high sensitivity (3) Assorted tools for maintenance of FROG-4000.")
126 APPENDIX I: AVAILABLE ACCESSORIES/SPARE PARTS Item Defiant Part # Description 5mL Plastic Syringe DT-FG4K-SYGP-1 5mL plastic syringe with Luer Lock tip. 60mL Rinsing Syringe Luer Lock Inlet DT-FG4K-SYGN-1 DT-FG4K-LL-1 60mL syringe with Luer Lock tip for rinsing Sparge Needle. Attachment for syringe. PID Assembly Tool Kit DT-FG4K-PID-1 DT-FG4K-PID-2 DT-FG4K-PID-3 DT-FG4K-TK-1 PID Assembly for normal sensitivity (1) low sensitivity (2) high sensitivity (3) Assorted tools for maintenance of FROG Sparge Tube Cover Guard DT-FG4K-GUARD-1 Sparge Tube Guard for covering Sparge tube in shipping container 126


127 APPENDIX I: AVAILABLE ACCESSORIES/SPARE PARTS Item Defiant Part # Description Ferrules for Sparge Bottle Nut DT-FG4K-SBNF-1 Replacement ferrules for the Sparge Bottle Nut, 1/2" ferrule set. Ferrules for Air Sample Bag Adapter for FROG Air Sampler Sparge Line DT-FG4K-SBNF-2 DT-FG4KSL-1 Replacement ferrules for the Air Sample bag adapter for the FROG s air sampler, 3/16" ferrule set, teflon. Sparge Line with Connectors. Valve Assembly DT-FG4K-VLV-1 Replacement valve assembly for FROG Air Sampler Wand DT-FG4K-AS-WAND Replacement air sampler wand. 1/16-3/16 Adapter DT-AS-316-ADAPTER Replacement 1/16-3/16 adapter for connecting the air sampler transfer line to a Tedlar bag. 127


128 APPENDIX I: AVAILABLE ACCESSORIES/SPARE PARTS Item Defiant Part # Description Air Sample Transfer Line DT-AS-TRAS-LINE Replacement transfer line for connecting air sampler. Air Sampler Coupler Line Battery DT-AS-COUP Replacement couple line for connecting the air sampler box to the Frog. DT-BT-NIMH9V5K- 1 Rechargeable NiMH Battery 9V, 5000 mahr. Serial Data Cable DT-DC-1 Ellvin (software) communication cable. USB Cable DT-USB-1 Cable USB A / MINI B ASSY. Stored data transfer cable. Power Supply DT-PS9V3A-1 Power Supply, 9V 3A. 128


129 APPENDIX I: AVAILABLE ACCESSORIES/SPARE PARTS Item Defiant Part # Description Battery Charger DT-BTCHG-1 Nickel-Metal Hydride Battery Charger. Pump DT-PU-1 Replacement air pump. 129
FROG-4000 TM Chemical Analysis System
 FROG-4000 TM Chemical Analysis System User s Manual Defiant Technologies, Inc. 2014 Vol.4 This page is intentionally left blank. FROG-4000 TM Chemical Analysis System User s Manual Defiant Technologies,
FROG-5000TM Chemical Analysis System User s Manual
 FROG-5000TM Chemical Analysis System User s Manual Defiant Technologies, Inc. 2018 Rev.3 How to assemble a ferrule. This problem has arisen so often and caused so many problems, that we have added it as
Gas Diluter Portable Gas Dilution System User s Manual
 Gas Diluter Portable Gas Dilution System User s Manual Defiant Technologies, Inc. 2015 Vol.1 This page is intentionally left blank. Gas Diluter Portable Gas Dilution System User s Manual Defiant Technologies,
UNITY 2 TM. Air Server Series 2 Operators Manual. Version 1.0. February 2008
 UNITY 2 TM Air Server Series 2 Operators Manual Version 1.0 February 2008 1. Introduction to the Air Server Accessory for UNITY 2...2 1.1. Summary of Operation...2 2. Developing a UNITY 2-Air Server method
GCMSD-Headspace Analysis SOP
 Before you start GCMSD-Headspace Analysis SOP Method and Sequences names are restricted to 50 characters (MSD program will crash otherwise) The GC oven and Injection Ports need to be cooled to 50 oc to
Ghost Peaks: How to Fix a Haunting Problem. Jacob A. Rebholz Teledyne Tekmar VOC Product Line Manager
 Ghost Peaks: How to Fix a Haunting Problem Jacob A. Rebholz Teledyne Tekmar VOC Product Line Manager Outline of Topics What is a ghost peak? How to identify ghost peaks and their source How to correct
Calibration of a GC955
 Calibration of a GC955 1 Contents of the power point instructions Standard calibration Automatic validation methods and calibration of multi component mixes Autolinearisation: test of the linearity of
Air Quality 2b - PFGC/FID Analysis of Benzene and Toluene in Automobile Emissions
 Air Quality 2b - PFGC/FID Analysis of Benzene and Toluene in Automobile Emissions Introduction: There is a bit of explanation of the health effects of benzene in the Introduction section of the first part
Instructions for Assembly, Installation, and Operation of the Gas Addition Kit Accessory with the CEM Discover Systems
 Corporation Issued: 5/09 P/N: 600104 Rev. 2 Instructions for Assembly, Installation, and Operation of the Gas Addition Kit Accessory with the CEM Discover Systems The Gas Addition Accessory permits the
Quantitative Analysis of Hydrocarbons by Gas Chromatography
 Quantitative Analysis of Hydrocarbons by Gas Chromatography Introduction Gas-liquid chromatography (GLC) accomplishes a separation by partitioning solutes between a mobile gas phase and a stationary liquid
SOP: Buck Scientific BLC-20P HPLC Operation
 Page 1 of 11 Approvals Preparer: John Buford Reviewer: Tim Kull Reviewer: Dr. Margaret Bryans Date: 16OCT13 Date: 30OCT13 Date: 31OCT13 1. Purpose 1.1. Basic operation of the Buck Scientific BLC-20P isocratic
SHIMADZU LC-10/20 PUMP
 SHIMADZU LC-10/20 PUMP Clarity Control Module ENG Code/Rev.: M091/70C Date: 24.10.2017 Phone: +420 251 013 400 DataApex Ltd. Fax: +420 251 013 401 Petrzilkova 2583/13 clarity@dataapex.com 158 00 Prague
Chromat Calibration Updated October 27th, 2017
 Chromat Calibration Updated October 27th, 2017 Calibrating the Chromatograph Performing the Chromat Calibration is highly recommended when starting a new well. The MLogger already has a default calibration
Appendix: Simplified Instructions for Operating the HP 5890 GC/FID and Air Sampling Systems
 Appendix: Simplified Instructions for Operating the HP 5890 GC/FID and Air Sampling Systems The bucket brigade air sampler. For the square Tedlar bags with the push/pull valves: Put the valve of a tedlar
AKTA ION EXCHANGE CHROMATOGRAPHY SOP Date: 2/02/05 Author: A DeGiovanni Edited by: C. Huang Reviewed by:
 1 AKTA ION EXCHANGE CHROMATOGRAPHY SOP Date: 2/02/05 Author: A DeGiovanni Edited by: C. Huang Reviewed by: Materials/Reagents/Equipment Vendor 1. 0.2 um filtered Water + 0.05% sodium azide 2. 0.2 um filtered
Using the UltraRAE. Firmware 2.35
 Using the UltraRAE Firmware 2.35 Training Agenda UltraRAE features Setting up the UltraRAE Turning on the UltraRAE Idle Operation RAE-Sep Tubes Prepping for a measurement Taking a measurement Alarm modes
MASK INTEGRITY TEST ACCESSORY (MITA) MODEL 8120
 MODEL 8120") MASK INTEGRITY TEST ACCESSORY (MITA) MODEL 8120 QUICK START GUIDE P/N 6006154, REVISION C MAY 2013 Model 8120 Mask Integrity Tester is patented under U.S. Patent No. 8,312,761. Additional patents are pending.
MASK INTEGRITY TEST ACCESSORY (MITA) MODEL 8120 QUICK START GUIDE P/N 6006154, REVISION C MAY 2013 Model 8120 Mask Integrity Tester is patented under U.S. Patent No. 8,312,761. Additional patents are pending.
User s Booklet for the Wyatt minidawn Light Scattering Instrumentation
 User s Booklet for the Wyatt minidawn Light Scattering Instrumentation The Wyatt minidawn Light Scattering instrument is able to measure the weight average molecular weight of a synthetic polymer or a
User guide for operating the Agilent 6420A QqQ mass spectrometer by direct infusion/injection
 User guide for operating the Agilent 6420A QqQ mass spectrometer by direct infusion/injection This user guide does not have the intention to introduce you to any of the theory and/or principles behind
Experiment GC : Analysis of BTEX by GC-FID
 46 Experiment GC : Analysis of BTEX by GC-FID Learning Goals: Familiarity with gas chromatography Gain experience in temperature programming and method development Correctly use an internal standard, and
Automated Determination of Dissolved Gases in Water Anne Jurek. Abstract: Discussion:
 Automated Determination of Dissolved Gases in Water Anne Jurek Abstract: The RSK-175 standard operating procedure was developed in order to determine the amount of dissolved gas in water. Due to the expansion
5890II GC Standard Operating Procedure 9/2/2005
 5890II GC Standard Operating Procedure 9/2/2005 This procedure is for the analysis of natural gas using the HP 5890II GC with the Restek ShinCarbon column. Detector Type: TCD Column Type: Restek Micropacked,
Using the Akta Prime plus October 22, 2012
 Some starting precautions: 1. Vacuum filter all buffers. Removes any large particles/debris that may clog your column De-gases the buffers 2. Clarify lysates first by centrifugation and then filtration
Armfield Distillation Column Operation Guidelines
 Armfield Distillation Column Operation Guidelines 11-2016 R.Cox Safety SAFETY GLASSES ARE REQUIRED WHEN OPERATING THE DISTILLATION COLUMN Wear gloves when mixing alcohol feedstock The column will become
General Specifications: Forensic. Petrochemical Environmental. Lab Quality Analyses in the Field, It Goes with you Anywhere!
 The portable Gas Chromatograph is now more versatile than ever. DPS Instruments is pleased to present the newest Portable Companion 2 Gas Chromatograph with room for 2 Detectors. The Companion 2 GC was
Environmental Petrochemical, Pharmaceutical, Foods & Flavors, Chemicals, Personal Care, Forensics,...and more!
 After years of development and testing, DPS Instruments is pleased to present the newest, most expandable and versatile Gas Chromatography Systems in history. The DPS 600 Series GC systems are the world
Microfluidic Demonstration
 Microfluidic Demonstration Co-flow of liquids across a microfluidic chip Create a microfluidic controller to flow liquids across a microfluidic chip. 1. Assemble fluidic circuits and attach to breadboard.
NanoSight NS300. NanoSight NS300. Operation instructions. Laser Spectroscopy Labs, UCI
 NanoSight NS300 Operation instructions Injection/flushing brief overview: 1. Do not exceed flow of 1 ml per 20 seconds. 2. Inject two 1 ml syringes with nano-pure or DI water. 3. If the water does not
Manual for continuous distillation
 Manual for continuous distillation 1. Week 1: Objectives: Run the column at total reflux. When steady state is reached, take the sample from the top and bottom of the column in order to determine the overall
MV5: Automated concentration system
 MV5: Automated concentration system Abstract LabTech MV5 is the latest automatic nitrogen evaporator developed by our R&D Team able to process up to 54 samples simultaneously. This advanced instrument
AKTA pure 25 New Owner s Intro
 AKTA pure 25 New Owner s Intro The exercise below will give a quick demonstration of how easy and intuitive the AKTA pure 25 will be for you in demonstrating downstream processing to your students. Steps
SomnoSuite FAQ. Setup. Calibration 4. What are the calibration requirements for the SomnoSuite? Settings
 SomnoSuite FAQ V1.3 January 2015 Setup 1. How do I connect the SomnoSuite to my oxygen source? 2. Is there a way to speed up the downward movement of the pusher block when setting the empty position? 3.
Laboratory Hardware. Custom Gas Chromatography Solutions WASSON - ECE INSTRUMENTATION. Engineered Solutions, Guaranteed Results.
 Laboratory Hardware Custom Gas Chromatography Solutions Engineered Solutions, Guaranteed Results. WASSON - ECE INSTRUMENTATION Laboratory Hardware Wasson-ECE Instrumentation offers hardware-only solutions
Demystifying the Process of Calibrating your Thermal Desorption Gas Chromatography System using Compressed Gas Standards.
 Demystifying the Process of Calibrating your Thermal Desorption Gas Chromatography System using Compressed Gas Standards. Jamie Brown R&D Scientist Supelco 595 North Harrison RD. Bellefonte, PA 16823 National
Experiment AMe-1: Small Animal Respiratory Exchange Ratio (RER)
") Experiment AMe-1: Small Animal Respiratory Exchange Ratio (RER) Background There are two main sources of energy available for animal metabolism: carbohydrates (CHO) and fats. These molecules are broken
Experiment AMe-1: Small Animal Respiratory Exchange Ratio (RER) Background There are two main sources of energy available for animal metabolism: carbohydrates (CHO) and fats. These molecules are broken
Pegas 4000 MF Gas Mixer InstructionManual Columbus Instruments
 Pegas 4000 MF Gas Mixer InstructionManual Contents I Table of Contents Foreword Part I Introduction 1 2 1 System overview... 2 2 Specifications... 3 Part II Installation 4 1 Rear panel connections...
Experiment AMe-1: Small Animal Respiratory Exchange Ratio (RER)
") Experiment AMe-1: Small Animal Respiratory Exchange Ratio (RER) Background There are two main sources of energy available for animal metabolism: carbohydrates (CHO) and fats. These molecules are broken
Experiment AMe-1: Small Animal Respiratory Exchange Ratio (RER) Background There are two main sources of energy available for animal metabolism: carbohydrates (CHO) and fats. These molecules are broken
AKTA MC SOP Page 1 9/27/04 AKTA METAL CHELATING SOP
 AKTA MC SOP Page 1 9/27/04 Date: 9/27/04 Author: A DeGiovanni Edited by: R Kim Reviewed by: Y. Lou AKTA METAL CHELATING SOP Materials/Reagents/Equipment Vendor 1. Water + 0.05% sodium azide 2. 0.2 um filtered
Operation of the Perkin Elmer TGA-GC/MS
 Operation of the Perkin Elmer TGA-GC/MS Summary of the TGA-GC/MS: The TGA-GC/MS allows a user to decompose a sample by heating, measure its loss of mass, and simultaneously analyze the chemical composition
Retention Time Locking: Concepts and Applications. Application
 Retention Time Locking: Concepts and Applications Application Gas Chromatography December 1997 Authors Vince Giarrocco Bruce Quimby Matthew Klee Agilent Technologies, Inc. 2850 Centerville Road Wilmington,
System Overview. TCD Detector temperature setpoint Regulator
 System Overview POPULAR CONFIGURATION GCs Your educational TCD GC is configured on the compact 310 chassis. It is equipped with a TCD Detector, a temperature programmable Column Oven, a 3 Silica Gel packed
Figure 1: Plug in ion inlet of mass spec
 Starting procedure: by Vicky - is the vacuum pump running (should run all time, otherwise it ll need 4-5 hours to have a adequate vacuum for the MS) otherwise something has gone wrong- F.T - Remove plug
Gases&Technology. Measurement of Impurities in Helium Using the Dielectric Barrier Discharge Helium Ionization Detector. FEATURE.
 Gases&Technology FEATURE Measurement of Impurities in Helium Using the Dielectric Barrier Discharge Helium Ionization Detector. B Y M A T T H E W M O N A G L E Abstract Bulk gases are often delivered to
Application Note. Rapid performance verification of AZURA systems with refractive index detector. Summary. Introduction
 Application Note Rapid performance verification of AZURA systems with refractive index detector Method Keywords ID HPLC Quality control, system verification, refractive index, AZURA Analytical HPLC Plus
AKTA 3D SOP. Click on the System Control tab. This screen has 4 windows.
 AKTA 3D SOP Page 1 9/09/04 Date: 9/09/04 Author: A DeGiovanni Reviewed by: Y. Lou AKTA 3D SOP Materials/Reagents/Equipment Vendor 1. 0.2 um filtered Water + 0.05% sodium azide 2. 0.2 um filtered buffers
Cover Page for Lab Report Group Portion. Head Losses in Pipes
 Cover Page for Lab Report Group Portion Head Losses in Pipes Prepared by Professor J. M. Cimbala, Penn State University Latest revision: 02 February 2012 Name 1: Name 2: Name 3: [Name 4: ] Date: Section
Rapid and Reliable Detection of Dissolved Gases in Water
 Rapid and Reliable Detection of Dissolved Gases in Water Andrea Caruso and Massimo Santoro Thermo Fisher Scientific, Milan, Italy Application Note 005 Key Words Chromeleon CDS, Environmental, Fracking,
Varian 3300 Gas Chromatograph Abbreviated Operating Instructions
 Varian 3300 Gas Chromatograph Abbreviated Operating Instructions 1. Introduction and Startup 2 2. Basic Configurations for the GC 3 3. Sample Preparation 3 4. Building a Method 3 5. Split/Splitless Injection
no peaks missing peaks too small peaks increasing retention decreasing retention
 GC Troubleshooting We can help you. 1. Observation: no peaks no peaks missing peaks too small peaks increasing retention decreasing retention declining baseline rising baseline bleeding plateaus interfering
Read this first. Zetasizer nano series Self installation and Quick start guide MRK825-02
 ! Read this first Zetasizer nano series Self installation and Quick start guide I N S T R U M E N T S MRK825-02 Zetasizer Nano series Self installation and Quick start guide MAN0383 Issue 1.1 July 2007
Automated Liquid Handling Station
 Automated Liquid Handling Station Software User s Guide Manual Part Number 32-0442-048 Rev 0 2018 Teledyne Technologies Incorporated. All rights reserved. Printed in USA. Installation See the SimPrep Quick
Laboratory Hardware. Custom Gas Chromatography Solutions WASSON - ECE INSTRUMENTATION. Custom solutions for your analytical needs.
 Laboratory Hardware Custom Gas Chromatography Solutions Custom solutions for your analytical needs. Laboratory Hardware Wasson-ECE Instrumentation offers hardware-only solutions for advanced chromatography
6890 GC Site Preparation
 6890 GC Site Preparation (a16011) This document is believed to be accurate and up-to-date. However, Agilent Technologies, Inc. cannot assume responsibility for the use of this material. The information
A SCENT OF FUTURE. Master DHS. Dynamic Head Space Sampler. Operating Manual
 A SCENT OF FUTURE Master DHS Dynamic Head Space Sampler Operating Manual Edition Master DHS - Operating manual rev. 1.0 Warnings The information contained in this document can be updated by DANI Instruments
DETERMINATION OF TETRAHYDROTHIOPHENE IN AMBIENT AIR BY GAS CHROMATOGRAPHY WITH A PFPD DETECTOR COUPLED TO A PRECONCENTRATION TECHNOLOGY
 DETERMINATION OF TETRAHYDROTHIOPHENE IN AMBIENT AIR BY GAS CHROMATOGRAPHY WITH A PFPD DETECTOR COUPLED TO A PRECONCENTRATION TECHNOLOGY Nengbing Xu, Hongmei Ying and Libo Zhu Ningbo Environmental Monitoring
ACV-10 Automatic Control Valve
 ACV-10 Automatic Control Valve Installation, Operation & Maintenance General: The Archer Instruments ACV-10 is a precision automatic feed rate control valve for use in vacuum systems feeding Chlorine,
GA-300 Gas Analyzer. Technical Note. Overview. Front Panel. iworx Systems, Inc. GA-300
 Technical Note GA-300 Overview The GA-300 CO2 and O2 Gas Analyzer is easy to use, robust, and adaptable to human, animal, and plant applications. The GA-300 has two analog outputs to allow recording and
Glove Box Installation Manual
 Glove Box Installation Manual 1998 by M. Braun Company File: GB-UNI-INS.DOC! Edition 08-00 by M. Boutin! Subject to be changed without notice Glovebox Installation Your Glove box has been fully assembled,
HPICAL Operation & Data Logging Procedures. Click spacebar to advance through slides 1
 HPICAL-15000 Operation & Data Logging Procedures Click spacebar to advance through slides 1 WARNING Always wear proper safety equipment when using high pressure equipment. Do not exceed 125 psi air pressure.
EXPERIMENT XI. Careful!! Improper handling of the vacuum line may result in the release of SO 2 which is an irritating and suffocating gas.
 Chem 366-3 Page XI - 1 EXPERIMENT XI INFRARED SPECTRUM OF SO2 (S&G, 5th ed. Expt 36, 6th ed. Expt. 35) 1. Pre-Lab preparation. The description of this experiment has disappeared from the more recent editions
In Response to a Planned Power Outage: PPMS EverCool II Shut Down and Re-start Procedure
 PPMS Service Note 1099-412 In Response to a Planned Power Outage: PPMS EverCool II Shut Down and Re-start Procedure Introduction: Loss of electricity to the PPMS EverCool II should not cause damage to
B. Assemble the Method-25 sample train with a heated probe/filter.
 6/30/2015 VOC Reporting, Inc. Method 25 Heated Controller Operating Instructions. pg. 1 of 5 INSTRUCTIONS FOR EPA METHOD-25 FIELD SAMPLE COLLECTION USING A VRi HEATED PROBE AND FILTER ASSEMBLY Introduction:
Detector Carrier Gas Comments Detector anode purge or reference gas. Electron Capture Nitrogen Maximum sensitivity Nitrogen Argon/Methane
 Gas requirements Gases for packed columns The carrier gas you use depends upon the type of detector and the performance requirements. Table 520-1 lists gas recommendations for packed column use. In general,
Title: Standard Operating Procedure for Measurement of Ethylene (C 2 H 4 ) in Ambient Air by Reduced Gas Detection (RGD)
 in Ambient Air by Reduced Gas Detection (RGD)") Procedure No: SOP-026 Revision No: 1.0 January 24, 2011 Page No.: 1 of 10 1. INTRODUCTION AND SCOPE To obtain timely data for the purpose of air quality assessment, air quality trend reporting and to meet
Procedure No: SOP-026 Revision No: 1.0 January 24, 2011 Page No.: 1 of 10 1. INTRODUCTION AND SCOPE To obtain timely data for the purpose of air quality assessment, air quality trend reporting and to meet
CHM Gas Chromatography: Our Instrument Charles Taylor (r10)
") 1/8 Introduction You should already be familiar with the basic concepts of gas chromatography. The purpose of this note pack is to familiarize you with the specific instrument that we will use in our labs.
1/8 Introduction You should already be familiar with the basic concepts of gas chromatography. The purpose of this note pack is to familiarize you with the specific instrument that we will use in our labs.
This test shall be carried out on all vehicles equipped with open type traction batteries.
 5.4. Determination of hydrogen emissions page 1 RESS-6-15 5.4.1. This test shall be carried out on all vehicles equipped with open type traction batteries. 5.4.2. The test shall be conducted following
High Pressure Chem-SCAN Operating Manual
 GAS INLET VALVES REACTIVE GAS PRESSURE RELIEF VALVE INERT GAS VENT VENT VALVE REACTOR INLET VALVES PRESSURE TRANSDUCERS REACTORS STIRRER & THERMOWELL HEATING JACKET STIRRER MOTORS High Pressure Chem-SCAN
Simplified Backflush Using Agilent 6890 GC Post Run Command Application Note
 Simplified Backflush Using Agilent 6890 GC Post Run Command Application Note Gas Chromatography Author Matthew S. Klee Agilent Technologies 2850 Centerville Road Wilmington, DE 19808-1610 USA Abstract
Gas Chromatography. MS Vent Enhancement to the PreVent System to Optimize Operation with the TurboMass, TurboMass Gold, and Clarus 500 GC/MS Systems
 Inorganic Analysis Chromatography Molecular Spectroscopy Thermal/Elemental Analysis Informatics Gas Chromatography MS Vent Enhancement to the PreVent System to Optimize Operation with the TurboMass, TurboMass
FireHawk M7 Interface Module Software Instructions OPERATION AND INSTRUCTIONS
 FireHawk M7 Interface Module Software Instructions OPERATION AND INSTRUCTIONS WARNING THE WARRANTIES MADE BY MSA WITH RESPECT TO THE PRODUCT ARE VOIDED IF THE PRODUCT IS NOT USED AND MAINTAINED IN ACCORDANCE
Vapor Pressure of Liquids
 Vapor Pressure of Liquids In this experiment, you will investigate the relationship between the vapor pressure of a liquid and its temperature. When a liquid is added to the Erlenmeyer flask shown in Figure
STANDARD OPERATING PROCEDURES
 PAGE: 1 of 9 CONTENTS 1.0 SCOPE AND APPLICATION 2.0 METHOD SUMMARY 3.0 SAMPLE PRESERVATION, CONTAINERS, HANDLING AND STORAGE 3.1 Canister Receipt 3.2 Canister Storage 4.0 INTERFERENCE AND POTENTIAL PROBLEMS
The instrument will process the samples one by one till all the samples have been cleaned up.
 Table of Contents SPE-01 Cleanup Station... 1 LC-04SP Valve System... 5 LC-04SP Standalone Valve... 10 LC-05 Auto Injector... 12 LC-06 Dosing Pump... 16 LC-08 Column Selector... 17 SPE-01 Cleanup Station
Vapor Pressure of Liquids
 Vapor Pressure of Liquids Experiment 10 In this experiment, you will investigate the relationship between the vapor pressure of a liquid and its temperature. When a liquid is added to the Erlenmeyer flask
Optimizing Vial Pressurization Parameters for the Analysis of <USP 467> Residual Solvents Using the 7697A Headspace Sampler
 Optimizing Vial Pressurization Parameters for the Analysis of Residual Solvents Using the 7697A Headspace Sampler Application Note Pharmaceuticals Author Roger L Firor Agilent Technologies, Inc.
Superconducting Susceptometer (MPMS-5S) Quantum Design Room 296 (MPMS)
 Quantum Design Room 296 (MPMS)") Superconducting Susceptometer (MPMS-5S) Quantum Design Room 296 (MPMS) Sensitivity: 1x10 11 A m 2 Applied DC fields: 0 T to 5 T Applied AC fields: 0 G to 3 G (zero-to-peak), 0.01 Hz to 1000 Hz Temperatures
Superconducting Susceptometer (MPMS-5S) Quantum Design Room 296 (MPMS) Sensitivity: 1x10 11 A m 2 Applied DC fields: 0 T to 5 T Applied AC fields: 0 G to 3 G (zero-to-peak), 0.01 Hz to 1000 Hz Temperatures
Navigator 600 Silica analyzers
 ABB MEASUREMENT & ANALYTICS INFORMATION INF09/020 REV. B Navigator 600 Silica analyzers Troubleshooting Measurement made easy Navigator 600 silica analyzers 1 Introduction This publication details troubleshooting
RM-80 respiration monitor
 RM-80 respiration monitor User Manual September 18, 2015 0025-003M 950 North Hague Avenue Columbus, Ohio 43204-2121 USA Sales: sales@colinst.com Service: service@colinst.com Phone: (614) 276-0861 Fax:
Boyle s Law: Pressure-Volume Relationship in Gases
 Boyle s Law: Pressure-Volume Relationship in Gases The primary objective of this experiment is to determine the relationship between the pressure and volume of a confined gas. The gas we will use is air,
OMCL Network of the Council of Europe QUALITY ASSURANCE DOCUMENT
 OMCL Network of the Council of Europe QUALITY ASSURANCE DOCUMENT PA/PH/OMCL (16) 17 R QUALIFICATION OF EQUIPMENT ANNEX 2: QUALIFICATION OF GC EQUIPMENT Full document title and reference Document type Legislative
Boyle s Law VC 09. Experiment 9: Gas Laws. Abstract
 Experiment 9: Gas Laws VC 09 Abstract In this laboratory activity, you will experimentally confirm Boyle s Law, determine absolute zero from Gay-Lussac's Law, and determine the molecular weight of acetone,
METHOD 21 - DETERMINATION OF VOLATILE ORGANIC COMPOUND LEAKS. 1.2 Scope. This method is applicable for the
 1151 METHOD 21 - DETERMINATION OF VOLATILE ORGANIC COMPOUND LEAKS 1.0 Scope and Application. 1.1 Analytes. Analyte Volatile Organic Compounds (VOC) CAS No. No CAS number assigned 1.2 Scope. This method
BioAerosol Nebulizing Generator. Operation and Maintenance User Manual
 BioAerosol Nebulizing Generator Operation and Maintenance User Manual INTRODUCTION The BANG or BioAerosol Nebulizing Generator is a unique nebulizer for the generation of aqueous aerosols at a low air
1. Study the performance of a binary distillation column operated in batch mode.
 Goals for batch distillation using the East distillation column: 1. Study the performance of a binary distillation column operated in batch mode. 2. Determine the overall and local efficiency of the column
Air Bubbler Depth Gauge DG2200 Installation and Reference Manual
 Air Bubbler Depth Gauge DG2200 Installation and Reference Manual Rev. 3.2.2 06/2011 Installation and Reference Manual Page 2 Contents Chapter 1: Installation and Overview... 3 1.1 DG2200 Location Diagram...
Model of a Standard Operating Procedure (SOP) for BTX measurements with automated pumped sampling and in situ gas chromatography
 for BTX measurements with automated pumped sampling and in situ gas chromatography") Model of a Standard Operating Procedure (SOP) for BTX measurements with automated pumped sampling and in situ gas chromatography How to use this specimen SOP This model SOP aims at giving support to network
Model of a Standard Operating Procedure (SOP) for BTX measurements with automated pumped sampling and in situ gas chromatography How to use this specimen SOP This model SOP aims at giving support to network
Operating Instructions
 Operating Instructions Preparation for Start-up 1. If the computer system is logged off, log into the computer system. Log into the operator account on the computer. Please ask your TA for username and
6800 Maintenance Instruction System Flush Procedure
 Equipment Required FA74005 FA65318 FA900005 FA900003 Damper Drain Tube 6800 Cover Removal Tool Beaker 0.25 Litre Solvent Cleaning Bottle FA940021 Syringe Polypropylene 50 ml as required FA999045 Gloves
Multiple Gas#5 GC configuration Jan 2016
 History: Unfortunately there is no single column that can separate: Hydrogen Oxygen Nitrogen Methane CO CO2 Ethane Water Propane Butane Pentane Over the years SRI Instruments has devised several solutions
Valve INV-907. Instructions. 1 Introduction. 2 Installation. Safety. Unpacking. Installing the valve
 Instructions 1 Introduction is a motorised rotary 7 port valve. The valve is used in ÄKTA design chromatography systems. It is powered from the ÄKTAdesign P-900 series system pump, and is controlled from
XpressFill XF2500 Counter Pressure Filler. Operating Instructions
 XpressFill XF2500 Counter Pressure Filler Operating Instructions ii XPRESSFILL Systems LLC lling machine. ank you for choosing our handcrafted bottle filler as the technology to bottle your passion. We
This GC has two columns (I think new columns can be ordered from Restek)
") SRI 8610C GC Ann s Notes 11-17-2014 Introduction This is the GC as it came from the manufacturer This GC has two columns (I think new columns can be ordered from Restek) 1. Hayesep D: Column 1 a. Separating
SRI 8610C GC Ann s Notes 11-17-2014 Introduction This is the GC as it came from the manufacturer This GC has two columns (I think new columns can be ordered from Restek) 1. Hayesep D: Column 1 a. Separating
Best Practice for Identifying Leaks in GC and GC/MS Systems
 Best Practice for Identifying Leaks in GC and GC/MS Systems Technical Overview Maintaining a leak-free GC or GC/MS system is critical for obtaining optimal system performance with reliable, reproducible,
Operator Quick Guide ORBISPHERE 3654
 Operator Quick Guide ORBISPHERE 3654 Revision H - 14/03/2008 Operating Information About this Guide The information in this guide has been carefully checked and is believed to be accurate. However, Hach
STANDARD OPERATING PROCEDURES. Andersen Instruments Federal Reference Method (FRM) Ambient Particulate (PM 10 /PM 2.
 Ambient Particulate (PM 10 /PM 2.") STANDARD OPERATING PROCEDURES Andersen Instruments Federal Reference Method (FRM) Ambient Particulate (PM 10 /PM 2.5 ) Sampler (RAAS) AMBIENT AIR MONITORING PROGRAM for the 130 LIBERTY STREET DECONSTRUCTION
STANDARD OPERATING PROCEDURES Andersen Instruments Federal Reference Method (FRM) Ambient Particulate (PM 10 /PM 2.5 ) Sampler (RAAS) AMBIENT AIR MONITORING PROGRAM for the 130 LIBERTY STREET DECONSTRUCTION
CORESTA RECOMMENDED METHOD Nº 67
 CORESTA RECOMMENDED METHOD Nº 67 DETERMINATION OF WATER IN THE MAINSTREAM SMOKE OF CIGARS BY GAS CHROMATOGRAPHIC ANALYSIS (November 2005) 1. FIELD OF APPLICATION The method is applicable to the particulate
STANDARD OPERATING PROCEDURES
 PAGE: 1 of 14 CONTENTS 1.0 SCOPE AND APPLICATION 2.0 METHOD SUMMARY 3.0 SAMPLE PRESERVATION, CONTAINERS, HANDLING AND STORAGE 4.0 INTERFERENCE AND POTENTIAL PROBLEMS 5.0 EQUIPMENT/APPARATUS 6.0 REAGENTS
Variable Temperature Operation
 Variable Temperature Operation AVIII 400 MHz Spectrometer November 11, 2012 The CBC NMR Laboratory University of Delaware AVIII 400 User Guide: Variable Temperature Operation 1 INTRODUCTION... 5 1.1 SAFETY...
Appendix D: SOP of INNOVA 1412 Photoacoustic Multi-Gas Monitor. Description and Principle of Operation
 Page 1 of 19 : SOP of INNOVA 1412 Photoacoustic Multi-Gas Monitor Description and Principle of Operation The photoacoustic multi-gas monitor (INNOVA 1412, Innova AirTech Instruments, Denmark) is a highly
Standard Operating Procedure Inductively Coupled Plasma Optical Emission Spectrometer (ICP-OES) - Thermo Scientific icap 6300
 - Thermo Scientific icap 6300") Standard Operating Procedure Inductively Coupled Plasma Optical Emission Spectrometer (ICP-OES) - Thermo Scientific icap 6300 The Thermo Scientific icap 6300 Inductively Coupled Plasma Optical Emission
Standard Operating Procedure Inductively Coupled Plasma Optical Emission Spectrometer (ICP-OES) - Thermo Scientific icap 6300 The Thermo Scientific icap 6300 Inductively Coupled Plasma Optical Emission