Conversion of a large scale orifice measurement station to an ultrasonic measurement station with double capacity
|
|
|
- Tamsyn Bennett
- 5 years ago
- Views:
Transcription
1 Conversion of a large scale orifice measurement station to an ultrasonic measurement station with double capacity Steinar Fosse, Measurement Adviser, Norwegian Petroleum Directorate Frode Bjelland, Measurement Specialist, Gassco Norway Gὔnter Buss, Supervisor Metering & ICT, Gassco Germany Dr. Rainer Kramer, Gas metering Specialist, Physikalisch Technische Bundesanstalt (PTB) 1
2 Content 1. Norwegian natural gas deliveries. A historic overview Legal framework 4 3. The upgrade of the metering station in Emden (EMS) 5 4. Computational Fluid Dynamics (CFD) System overview USM meter specification USM flow meter testing Operating philosophy Condition Based Monitoring (CBM) follow up Summary References..37 2

3 1. Norwegian natural gas deliveries - a historic overview. The Ekofisk Field was discovered by Phillips Petroleum Company in It is located offshore in the southern sector of the Norwegian Continental Shelf. The development of the field started soon after and first oil was tanker loaded on the field in The permanent oil pipeline (354 km, 34 ) to Teesside in United Kingdom (UK) was ready for operation in The permanent gas pipeline (443 km, 36 ) to Emden in Germany was ready for operation in See figure 1. Pipeline infrastructure, underneath. The terminal facility in Emden Germany (NGT) was fairly simple, but it contained some filters to clean the gas (removal of liquids, particles and H2S). The Measurement station was however huge. Originally the configuration of the 3 customers were Ruhrgas with 9 tubes, 3
4 Gasunie with 9 tubes and BEB with 3 tubes. All metering tubes were 20 size with Daniel orifice meters and densitometers. The quality measurement was originally done by 2 Calorimeters. They were later replaced by 2 Gas Chromatographs. Responsible operator for the terminal was Phillips Petroleum/ConocoPhillips and later GasPort (one year) and then Gassco (state company, independent pipeline and terminal operator). Europipe I was ready for operation in The landfall and terminal is in Dornum 50 km away from the Emden terminal, but the gas was then sent to Emden EMS (neighbor facility to NGT) where it was metered and sold to the same customers as for NGT. Operator was originally Statoil, but this was transferred to Gasport/Gassco, similar as for ConocoPhillips. The metering station EMS has the same sizing (20 orifice plates) as the NGT metering station but fewer tubes. 5 for Ruhrgas and Gasunie and 4 for BEB. Europipe II was ready for operation in It includes a new metering station located at the landfall in Dornum. This is also an orifice metering station with 6*20 tubes for the customer Ruhrgas. The customers have now changed names: Ruhrgas = OGE (Open Grid Europe) Gasunie = GTS (Gasunie Transportation System) BEB = GUD (Gasunie Deutschland) The total maximum gas offtake from the Norwegian Continental Shelf is ca 376 mill Sm3/day. Ca 150 mill Sm3/day can now be delivered through the 2 sales gas metering stations (EMS and ERF) in Germany. 2. Legal framework When a pipeline involving different nations is planned, then the government in both nations are involved and a treaty is developed. This treaty will normally also include a paragraph which defines both nations rights related to fiscal metering. As the fiscal sales point for these pipeline systems is at the landfall after the terminals in Germany, this is a point of interest for both the authorities in Germany and Norway. In addition to various authority requirements it is also an Agreement with the Downstream Operators (buyers) (interconnecting agreement). It also leads to additional metering requirements. Under the treaty a so called Memorandum of Understanding (MoU) is developed. It is a short document which describes some practical ways to cooperate and show the rights for the involved parties. It helps the fiscal authorities in both countries and the Operating company in their communication. The relevant metering authorities: Norway: Norwegian Petroleum Directorate 4
5 Germany: Pysikalisch Technische Bundesanstalt (PTB) approve equipment and solutions while Mess- Eichwesen Niedersachsen (MEN) do the daily follow up thereafter. 3. The upgrade of the metering station in Emden (EMS) As the original North Sea Gas Terminal was put in service in 1977, much of the equipment needed to be refurbished. This lead to a large replacement project (Gassco Emden Project GEP) for the process equipment which included the metering station. The original metering station should be closed and the gas transferred over the fence to the Europipe I metering station where it should be sold through the 3 EMS metering stations, which of only the Gasunie Transportation System (GTS) metering station (see figure 2) required more capacity. Figure 2 The scope of the project was to increase the capacity of the EMS GTS metering station from the existing 40 mill Sm3/day to 80 mill Sm3/day. This will be achieved by changing the orifice meter runs with ultrasonic meter runs. The flow control valves would also have to be replaced. In addition a new mixer as shown on figure 2 and 3 was installed. 5
 The Norwegian research company CMR did a thorough and comprehensive report which included a) CFD study on the gas mixing at the GC probe shown at point D in figure")
6 Figure 3 4. Computational Fluid Dynamics (CFD) The Norwegian research company CMR did a thorough and comprehensive report which included a) CFD study on the gas mixing at the GC probe shown at point D in figure 4, using STAR CCM+ from CD-adapco b) CFD study on the flow profiles in the metering runs for some metering run constellations, using a CMR proprietary tool called MUSIC c) USM measurement results approximately in the area where the master USM is located, using a CMR proprietary tool called USMSIM In this paper the focus is to show some results of part b) and c) for one flow scenario. 6
7 Part 3: To here from end of Part 2 ~74 ID to check USM, ~77 ID to master USM Run A/1 GTS Run E/5 EP inlet NP inlet (Alt. EP inlet, filter maint.) Part 2: To here from end of Part 1 OGE Part 1: From A/B/C to 35 D from bend GUD > 100 m/100 D Figure 4 Pipe section being CFD simulated Six different flow scenarios as shown in figure 5 were simulated. Figure 5 Metering run simulations In this paper GTS case 4 with meter runs A, B, C and D open are covered. The flow-split ratio between run A, B, C and D was in the simulations found to be respectively 29, 26.5, 23.5 and 21 % of the total flow rate when the total flow rate was 60 MSm3/day. A period of fairly stable flow around 59 MSm3/day with the same meter runs in use was found in October This showed flow-split ratio between run A, B, C and D to be respectively 27, 24, 23 and 26 % of the total flow rate. Hence the flow in meter run D was higher and the flow in meter run A and B were lower in real life compared to the simulations. Axial flow profiles respectively 2.5 and 78.5 ID (inner diameter) downstream of the valve are shown in Figure 6 for run A, in Figure 7 for run B, in Figure 8 for run C and in Figure 9 for run D. The asymmetry is clearly reduced downstream in the pipe, and the axial flow velocity becomes more symmetric. 7

 in the pipe cross-section in meter run")

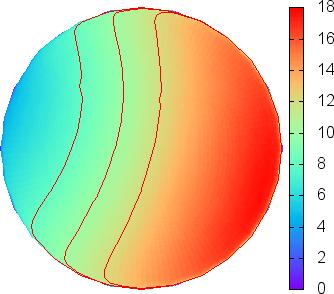
8 Figure 6 GTS Case 4, Run A: Axial velocity (m/s) in the pipe cross-section in meter run 2.5 ID after the inlet valve to the left and 78.5 ID after the inlet valve to the right. The view direction is upstream towards the inlet header. Figure 7 GTS Case 4, Run B: Axial velocity (m/s) in the pipe cross-section in meter run 2.5 ID after the inlet valve to the left and 78.5 ID after the inlet valve to the right. The view direction is upstream towards the inlet header. Figure 8 GTS Case 4, Run C: Axial velocity (m/s) in the pipe cross-section in meter run 2.5 ID after the inlet valve to the left and 78.5 ID after the inlet valve to the right. The view direction is upstream towards the inlet header. 8

 to run D (bigger difference). The flow seems centralized in left to right position.")
9 Figure 9 GTS Case 4, Run D: Axial velocity (m/s) in the pipe cross-section in meter run 2.5 ID after the inlet valve to the left and 78.5 ID after the inlet valve to the right. The view direction is upstream towards the inlet header. When looking at the simulated flow profiles at position 78.5 ID downstream the inlet header in figure 6 to 9, it seems the flow is slightly higher at the top than at the bottom, and this is becoming more evident for every meter run going from run A (small difference) to run D (bigger difference). The flow seems centralized in left to right position. When looking at the real flows experienced when meter runs A (1) to D (4) were in use from 12 th to 14 th October 2016, see figure 9.16 page 31 and 9.17 page 32, this behavior is very clear in meter run B and also for run A it is clear, but not for run C and D. For the Sick USMs path A is at the top and path D is at the bottom. For the FMC USMs paths A1 and A2 are at the top (crossed), path B1 and B2 are the top middle chords (crossed), path C is the bottom middle. chord and path D is the bottom chord. Figure 10 GTS Case 4, meter runs A (1), B (2), C (3) and D (4): Deviation from meter reference along the line Figure 11 GTS Case 4, run A(1), B(2), C(3) and D(4) active: Maximum swirl angle in cross-section to the left, average swirl angle in the pipe section to the right 9
10 5. System overview Each metering run contains 2 ultrasonic meters, 2 pressure transmitters and 2 temperature transmitters. Each USM has it dedicated pressure and temperature transmitters. The ultrasonic meters are from different brands: 1*SICK and 1*FMC Each meter run has 2 separate Sick Flow-X flow computers Each ultrasonic meter is connected to a dedicated Flow-X flow computer, using a serial connection for flow data and diagnostic data Pressure and temperature transmitters are communicating via the Hart protocol. Each Flow computer operates independent from the other flow computers All Flow-X flow computers belonging to the Sick pay meters are placed in one rack, all Flow-X flow computers belonging to the FMC check meters are placed in another rack All Flow computers have redundant Ethernet connection. Each connection is connected to a different network. Each network has its own IP address range. This dual redundant Ethernet network is the highway for data transmission between the flow computers, GC composition and supervisory computers Figure 12 10


11 6. USM Meter specifications SICK Flowsic 600 Figure 13 11


12 FMC MPU 1200 Figure 14 12
13 7. USM Flow meter testing The meter runs (see figure 4 & 12/13) were tested at Euroloop test facilities in Rotterdam, Netherland. On top of the actual 7 points calibration with 2 verification points, additional tests were performed (on first metering run only): Transducer swapping Cross talk test Chord failure test Transducer swapping test at 25% and 75% flow rates. This test give experience in the meter tolerance if we later have to exchange transducers for service purposes. Cross talk test: Start at 120% with only USM A active and USM B switched off. Then 120% with USM B active and USM A switched off Then a normal 7 point calibration is performed with both meters active, starting with 120% flow and ending up with 5% flow The cross talk test is then repeated at 5% flow Chord failure test at 25% and 75% flow rates. Disconnect the transducer cables at the field terminals in electronic enclosures to simulate failing path The test shall give experience in the effect on measurement uncertainty when a path fails All tests passed the relevant API/ISO/PTB/NPD requirements and the additional tests as mentioned above. Logging of basic data (foot print) was done for the various parameters. It is, however, fair to say that both from the vendor side and from the operating company it is valuable and in some cases critical to have experienced engineers on the test site to do quality control and solve eventual discussion topics which might come up. 8. Operating philosophy The Sick meter is the master meter or pay meter. The FMC meter is the check meter. The operational mode of the system can be set to manual or automatic. Automatic mode: Line is a part of the automatic valve control and can only be opened if the inlet valve is open If any equipment fails in one metering line, independent of this being associated with the Sick meter or the FMC meter, the supervisory computer will initiate to open a closed line After the new line is opened, the supervisory computer will send a request to close the failing line If any parts (PT, TT, USM or flow computer) related to the pay meter are failing, and the check meter is still ok, then the supervisory computer will search for a line where the pay meter is ok 13
14 If no spare line exist, the check meter in the line can give the fiscal figures as an ultimate back up. When it comes to recalibration of USM`s the Norwegian Petroleum Directorate would normally rely on Condition Based Monitoring (CBM) for such a purpose. The German Physikalisch Technische Bundesanstalt (PTB) was requiring this concept with 2 USM`s in series with different path configuration. The PTB Technische Richtlinien G 18 (Messgeräte für gas) gives an annual baseline check as a requirement. Based on the results of this, an eventual recalibration shall be performed. The maximum allowed deviation from the determined baseline is 0,5% (half of the Eichfehlergrenze) and 0,3% deviation for the ratio of the VOS of each chord compared to the average VOS value. 9. Condition based monitoring At the terminal, alarms provide on-line monitoring of deviations between the two USM`s in series in each line on parameters like: Flow rates Velocity of sound, and towards AGA 10 calculated VoS Pressure Temperature Line density (AGA 8), and for FMC also DECA density In addition to this on-line monitoring, regular on-site checks and routines are performed by qualified Gassco technicians. Daily alarm and report verification. Weekly GC checks. Two monthly instrument checks. And on annual basis system verification together with German authorities. Condition Based Monitoring (CBM) is performed to detect any drift or deterioration of the meter performance in a long term perspective. When doing this, care should be taken not to mix deterioration or drift with natural causes for parameter changes, like a change of meter lines in operation. The CBM is done on the basis of hourly data received in a daily xml file produced by the metering system. This file contains quantities and mass weighted hourly values of all parameters of interest from the pay and the check meters in each line, in addition to GC and quantity data on station level. This includes parameters like mass, actual line volume, reference volume, energy, pressure, temperature, AGA 8 density and USM specific parameters like velocity of sound per chord and per USM, calculated velocity of sound, gas velocity per chord and per USM, AGC, SNR, symmetry, turbulence etc. This file is automatically sent to Gassco Norway and loaded into a database. The next step is to manually run an excel macro to fetch the data into a monthly excel file containing one sheet per gas day. The parameters are sorted in some sheets, and deviations between the instruments and meters are calculated. At the end of the file, all the graphs of the different parameters are shown to enable trending. In this way, all parameters in a new month can be compared with the situation at start-up, or any other month. As already mentioned, care should be taken to compare periods with the same metering lines in use, and preferably comparable flow rates. 14


15 Typical pressure in the metering station is 55 Bara, temperature is 6 degree Celsius, line density is 50 kg/m 3 and a typical composition is shown here: C1 C2 C3 ic4 nc4 ic5 nc5 neoc5 C6+ CO2 N2 [Mole%] [Mole%] [Mole%] [Mole%] [Mole%] [Mole%] [Mole%] [Mole%] [Mole%] [Mole%] [Mole%] Figure 9.1 Typical composition This gives Standard density of kg/sm 3 and GCV of MJ/Sm 3. The attached figures shown in the rest of this chapter are mainly taken from metering line 2 and 4. Metering line 2 exhibits the poorest flow profile, without doubt. Metering line 3 and 4 exhibit the best flow profile. Metering line 1 and 5 show something in between, but normally closer to line 3 and 4 than to line 2. The excel file contains one sheet of hourly data per calendar day in the month. 15


16 Figure 9.2 Hourly data loaded into the monthly excel file 16

17 One sheet shows the daily quantities of both USMs and the deviation between them, both per line and for the station totals. Figure 9.3 Daily station totals of the two USM brands and the deviations 17

18 The line density is calculated both by using AGA 8 and DECA. The AGA 8 algorithm uses all the GC components, pressure and temperature as input. The DECA algorithm uses the measured VoS from the USM, pressure, temperature, N2 and CO2, and it is developed by CMR which is a Norwegian research institute. The blue AGA 8 line density and the green DECA density match well and sit on top of each other, and they are connected to the left Y-axis. The deviation between them in red (for FMC USM also the purple) is shown on the right Y-axis. Monitoring that the deviation is around zero gives a confidence that both the USM and the GC are working properly. See figure
19 Figure 9.4 AGA 8 vs DECA density The velocity of sound is trended in several graphs, and below the absolute difference in m/s towards the measured USM average value is shown, both per chord and for the AGA 10 calculated value. This trending involves several instruments and this gives a cross-check of the USM and the GC. See fig
20 Figure 9.5 Velocity of sound per chord and AGA 10 vs the average The gas velocity is also trended in several graphs. Below the ratio of the chords to the weighted average are shown. The outer chords should have similar values and the inner chords should have similar values if the flow profile is fully developed. The flow profile of line 2 varies with the lines in use. See fig
21 Figure 9.6 Gas velocity ratio per chord The flow profile flatness gives a relationship between inner and outer chords and gives some information of upstream piping geometry. This should be stable and within limits specified by the vendor. When installation has long and straight upstream length, they normally are around 1.14 for Sick and 89 % for FMC. See figure
22 Figure 9.7 Flow profile flatness 22
23 The flow profile symmetry gives a relationship between upper and lower chords and gives some information of upstream piping geometry. This should be stable and within limits specified by the vendor, ideally around 1 for Sick and 0 for FMC. See figure 9.8 underneath. 23
24 The swirl percentage gives amount of (clockwise) flow rotation, and cross flow percentage gives amount of dual vortex rotation. Both parameters give some information of upstream piping geometry. They only exist for the FMC meters and these should ideally be stable around 0, and at least within limits specified by the vendor. See figure 9.9, underneath. 24
25 Figure 9.9 Swirl percentage and cross flow percentage The turbulence level indicates variation in gas velocity (e.g. standard deviation of gas velocity over a certain time period) and may give some information of upstream piping geometry, but higher values can also be caused by equipment like compressors. This parameter should preferably be as low as possible, but higher values do not necessarily indicate faulty readings of the meter. However, if the sampling rate of the USM does not match with the gas flow variations, the uncertainty of the meter will increase. The outer chords will have higher values than the inner chords. See figure
26 Figure 9.10 Turbulence As seen on figure 9.10 the turbulence of metering line 2 FMC USM is high in the first period (ca 11 October 2016) but still the gas velocity ratio of the chords show good correspondence, see figure 9.6. The AGC level is mainly dependent on pressure and path length and should be stable and below limit specified by the vendor, as too high values will result in distorted signal. 26

27 Figure 9.11 AGC level The signal to noise ratio indicates the strength of the signal compared to the noise, and this should be higher than the minimum specified by the vendor. 27

28 Figure 9.12 Signal to noise ratio The burst/signal percentage/performance level should ideally be 100 % and preferably above limit specified by the vendor. The number of transmitted signals of the FMC USM is 28
29 configurable, here 30-35/sec, which is considerable higher than for the Sick USM, here 10/sec. Hence, a lower value of FMC USMs do not influence the accuracy of the measurements in a great deal. Even going below the vendor alarm limit should not harm too much. See fig Burst & performance level underneath. 29

30 The deviation in actual volume (m 3 ) of the FMC USM to the Sick USM given as a percentage of the Sick USM figure should preferably be zero. Figure 9.14 Line volume percentage deviation between the USMs The rest of the figures show data from all lines. The numbers in red shown on metering line 1 indicate which metering lines are in use. 30

31 Figure 9.15 Line volume percentage deviation between the USMs, all lines 31

32 Figure 9.16 Gas velocity ratios of Sick USMs 32

33 Figure 9.17 Gas velocity ratios of FMC USMs 33

34 Figure 9.18 Swirl percentage level of FMC USMs Figure 9.19 Flow profile symmetry of Sick USMs As seen on figure 9.18 the swirl of the FMC USMand on figure 9.19 the symmetry of the Sick USM have higher values in metering line 2. Also minor increase in line 1. Situation with discrepancy between gas velocity ratios of the chords. 34

35 Figure 9.20 GC1 minus GC2 gas components Figure 9.21 Line pressure deviations per line Figure 9.22 Line temperature deviations per line 35
36 10. Summary This was a project with a total value of several millon dollars. It took 4 years to finalize (1 year delayed). All projects are dependent on that all parts are operating synchronized and deliver their parts at expected quality at the right time. The expectation to high quality deliveries would normally increase if critical personnel have been through similar work processes earlier (documented experience). This was not the case for this project and lead to additional effort for the end user. But as in most cases if the people involved are just consistent and dedicated the goal is finally reached. 75 IDs of straight upstream length is not sufficient to prevent disturbed flow profiles if pipe sections upstream metering runs are poorly designed. CFD analyses are powerful and give impressive detailed and comprehensive results, but they might not always tell the whole truth due to assumptions and limitations set and due to uncertainty in the models. It seems not to be ideal to have a long header in case of later capacity increase and locate installed meter runs towards one end of it. Unfortunately this was the situation in Emden. Generally, the USMs show good agreements, but the achieved results varies with metering lines in use. It is useful to log and trend data from the metering station to raise the awareness of how the equipment behaves and to detect drift. Some of the USM parameters may indicate that the installation is not ideal and they may vary with operational conditions like metering lines in use or flowrate, but this will not be improved by re-calibrating the meters. Generally the USMs show good agreement. 36
37 11. References 1. Memorandum of Understanding between Norway and Germany regarding fiscal metering 2. Norwegian regulations regarding fiscal measurements 3. German regulations regarding fiscal measurements 4. AGA 9 5. ISO part 1 6. Christian Michelsen Research (CMR) Computational Flow Design (CFD) 7. GEP project project documentation 8. SICK product information 9. FMC product information 10. Euroloop calibration documents 11. Gassco operating documents and operating data 37
Diagnostics for Liquid Meters Do they only tell us what we already know? Terry Cousins - CEESI
 Diagnostics for Liquid Meters Do they only tell us what we already know? Terry Cousins - CEESI DIAGNOSTICS FOR LIQUID METERS-DO THEY ONLY TELL US WHAT WE ALREADY KNOW? T. Cousins CEESI CMSI INTRODUCTION
Performance of an 8-path gas ultrasonic meter with and without flow conditioning. Dr Gregor Brown Caldon Ultrasonics Cameron
 Performance of an 8-path gas ultrasonic meter with and without flow conditioning Dr Gregor Brown Caldon Ultrasonics Cameron Introduction Brief history of the Caldon ultrasonic meters Why 8-paths? Additional
ULTRASONIC METER FLOW CALIBRATIONS CONSIDERATIONS AND BENIFITS. Joel Clancy
 ULTRASONIC METER FLOW CALIBRATIONS CONSIDERATIONS AND BENIFITS Joel Clancy Colorado Engineering Experiment Station, Inc. of Iowa (CEESI Iowa) 2365 240 th Street Garner, Iowa 50438 Introduction Measurement
Nitrogen subtraction on reported CO 2 emission using ultrasonic flare gas meter
 Nitrogen subtraction on reported CO 2 emission using ultrasonic flare gas meter Kjell-Eivind Frøysa, Christian Michelsen Research AS, Bergen, Norway Henning Ekerhovd, StatoilHydro ASA, Kollsnes, Norway
2013 Honeywell Users Group Europe, Middle East and Africa. Jürgen Wolff Advanced Gas Metering through Flow Profile Analysis
 2013 Honeywell Users Group Europe, Middle East and Africa Jürgen Wolff Advanced Gas Metering through Flow Profile Analysis 1 Agenda Introduction to RMG by Honeywell s ultrasonic meter USZ08 The diagnostic
Oil and Gas Custody Transfer
 Downstream Focus By Emerie Dupuis Daniel Measurement and Control, Emerson Process Management Oil and Gas Custody Transfer When money changes hands, flow measurement accuracy matters. When flow measurement
Remote. Measurement Assurance. Why CEESmaRT? significantly in measurement
 Why CEESmaRT? significantly in measurement Remote Measurement Assurance Phone: (409)721-9100 Website: www.ceesmart.com info@ceesmart.com support@ceesmart.com Headquarters: 4484 Hodgson Road Nederland Texas
EXPERT SYSTEMS IN ULTRASONIC FLOW METERS
 EXPERT SYSTEMS IN ULTRASONIC FLOW METERS Marcel J.M. Vermeulen, Jan G. Drenthen, Hilko den Hollander KROHNE Oil & Gas, CT Products 1 INTRODUCTION: Custody transfer ultrasonic gas flow meters are the cash
ULTRASONIC FLOW METER CALIBRATIONS CONSIDERATIONS AND BENIFITS American School of Gas Measurement Technology, September 2007.
 ULTRASONIC FLOW METER CALIBRATIONS CONSIDERATIONS AND BENIFITS American School of Gas Measurement Technology, September 2007 Joel Clancy Colorado Engineering Experiment Station, Inc. of Iowa (CEESI Iowa)
Towards ISO Koos van Helden, B.ASc. International Account Manager Eastern Hemisphere mailto:
 Towards ISO 17089-1 Koos van Helden, B.ASc. International Account Manager Eastern Hemisphere mailto: koos.vanhelden@kpnmail.nl Who am I? My name: Koos van Helden International Account Manager Eastern Hemisphere
Calibrating and Monitoring MUSMs in Natural Gas Service
 Calibrating and Monitoring MUSMs in Natural Gas Service James E. Gallagher, P.E. Chief Executive Officer Copyright 2001 MUSMs in Natural Gas Service Slide 1 of 21 Abstract Companies today are grappling
ONSITE PROVING OF GAS METERS. Daniel J. Rudroff WFMS Inc West Bellfort Sugar Land, Texas. Introduction
 ONSITE PROVING OF GAS METERS Daniel J. Rudroff WFMS Inc. 13901 West Bellfort Sugar Land, Texas Introduction With the increased use of Natural Gas as a fuel, and higher natural gas prices buyers and sellers
A review of best practices for Selection, Installation, Operation and Maintenance of Gas meters for Flare Applications used for Managing facility
 A review of best practices for Selection, Installation, Operation and Maintenance of Gas meters for Flare Applications used for Managing facility mass balance and compliance 1. What, When and Why? 2. Flare
Paper 2.2. Operation of Ultrasonic Flow Meters at Conditions Different Than Their Calibration
 Paper 2.2 Operation of Ultrasonic Flow Meters at Conditions Different Than Their Calibration Mr William Freund, Daniel Measurement and Control Mr Klaus Zanker, Daniel Measurement and Control Mr Dale Goodson,
Ultrasonic Flowmeter USZ 08
 Ultrasonic Flowmeter USZ 08 PRODUCT INFORMATION Reliable Measurement of Gas Fields of application, method of operation and construction 2 Fields of application The ultrasonic flowmeter is an advanced measuring
Metering Code Gas TSO, measurement by connected party Effective from to the present
 Please note that although Gasunie Transport Services B.V. translated the Dutch network codes with utmost care, Gasunie Transport Services B.V. would like to point out that only the decisions of the Dutch
FLOWSIC100 Flare Challenges in Ultrasonic Flare meter field installations. History of Evolution
 FLOWSIC100 Flare Challenges in Ultrasonic Flare meter field installations Mart Gloudemans, Sebastian Stoof, Sven Holzbächer SICK Germany History of Evolution 1 Introduction SICK FLOWSIC100 has track record
NFOGM temadag
 NFOGM Temadag 19.3.2015 Challenges with calibration and adjustment of liquid USM`s Standards for Gas USM`s Author : Steinar Fosse, Norwegian Petroleum Directorate 1 NFOGM temadag 19.3.2015 Challenges with
ONSITE PROVING OF GAS TURBINE METERS Daniel J. Rudroff Invensys Metering Systems
 ONSITE PROVING OF GAS TURBINE METERS Daniel J. Rudroff Invensys Metering Systems 1322 Foxwood, Houston, Texas 77008 INTRODUCTION With the increased use of Natural Gas as a fuel, higher natural gas prices,
The ERCB Directive 017 Overview
 The ERCB Directive 017 Overview November 4, 2009 By Bill Cheung Why measure and report production, flaring, and venting? Public Safety and Environment Understand and monitor emissions Reservoir Engineering
Effect of noise in the performance of the transducers in an ultrasonic flow meter of natural gas
 23rd World Gas Conference, Amsterdam 2006 Effect of noise in the performance of the transducers in an ultrasonic flow meter of natural gas Main author R. Villarroel Venezuela TABLE OF CONTENTS 1. Abstract
CALCULATING THE SPEED OF SOUND IN NATURAL GAS USING AGA REPORT NO Walnut Lake Rd th Street Houston TX Garner, IA 50438
 CALCULATING THE SPEED OF SOUND IN NATURAL GAS USING AGA REPORT NO. 10 Jerry Paul Smith Joel Clancy JPS Measurement Consultants, Inc Colorado Engineering Experiment Station, Inc (CEESI) 13002 Walnut Lake
"BS An overview of updates to the previous ( 2009 ) edition. Andrew Wrath & BS7965 Working Group
 edition. Andrew Wrath & BS7965 Working Group") "BS7965 2013 - An overview of updates to the previous ( 2009 ) edition Andrew Wrath & BS7965 Working Group BS7965:2013 Guide to the selection, installation, operation and calibration of diagonal path transit
"BS7965 2013 - An overview of updates to the previous ( 2009 ) edition Andrew Wrath & BS7965 Working Group BS7965:2013 Guide to the selection, installation, operation and calibration of diagonal path transit
Micro Motion Pressure Drop Testing
 12/2018 Micro Motion Pressure Drop Testing www.emerson.com/micromotion Introduction Micro Motion has traditionally taken a very conservative approach to pressure drop, with single pressure measurements
Impact of imperfect sealing on the flow measurement of natural gas by orifice plates
 Impact of imperfect sealing on the flow measurement of natural gas by orifice plates Rubens Silva Telles 1, Kazuto Kawakita 2 1 IPT Instituto de Pesquisas Tecnológicas, São Paulo, Brazil, rtelles@ipt.br
deltaflowc deltaflowc Venturi or Probe
 deltaflowc Mass Flowmeter for Gases - Multivariable with ultra fast dp, p and T-sensors - Compact, accurate and user-friendly - Ideal for OEMs deltaflowc Venturi or Probe Precise mass flow metering deltaflowc
Operational Settings:
 instrucalc features more than 70 routines associated with control valves, ISO flow elements, relief valves and rupture disks, and calculates process data at flow conditions for a comprehensive range of
Installation Effects on Ultrasonic Flow Meters for Liquids. Jan Drenthen - Krohne
 Installation Effects on Ultrasonic Flow Meters for Liquids Jan Drenthen - Krohne Jan G. Drenthen & Pico Brand ALTOSONIC 5 Installation effects on ultrasonic flow meters for liquids 1. Introduction 2. Meter
Product Information. Three in One: Gas Meter Tariff Device Volume Corrector. Ultrasonic Gas Meter ECOSONIC X12
 Product Information Three in One: Gas Meter Tariff Device Volume Corrector Ultrasonic Gas Meter ECOSONIC X12 ECOSONIC X12 Values you can count on The Application Fields The ultrasonic gas meters of the
Recalibration of gas meters
 12 November 2015 Recalibration of gas meters Experiences of GTS The value of Recalibration Robert Kruithof First European Recalibration Workshop NMi Euroloop, Rotterdam Robert Kruithof Agenda Introduction
CUSTODY TRANSFER METERING
 flotek.g 2017- Innovative Solutions in Flow Measurement and Control - Oil, Water and Gas August 28-30, 2017, FCRI, Palakkad, Kerala, India CUSTODY TRANSFER METERING Pranali Salunke Mahanagar Gas Ltd. Email:
OIL AND GAS INDUSTRY
 This case study discusses the sizing of a coalescer filter and demonstrates its fouling life cycle analysis using a Flownex model which implements two new pressure loss components: - A rated pressure loss
Flowatch Multiphase Flow Meter
 Multiphase Flow Meter Multiphase Flow Meter Key Components Pietro Fiorentini's FLOWATCH is a non-intrusive, non radioactive, in-line multiphase meter for measuring flow rates of oil, water and gas from
Electronic Volume Correctors
 Electronic Volume Correctors Ben Manson Landis+Gyr October 14, 2016 PUBLIC Agenda Customer Types and suitable equipment Volume corrector standards / regulations Basics of volume correction Gauge v Absolute
COMPUTATIONAL FLOW MODEL OF WESTFALL'S LEADING TAB FLOW CONDITIONER AGM-09-R-08 Rev. B. By Kimbal A. Hall, PE
 COMPUTATIONAL FLOW MODEL OF WESTFALL'S LEADING TAB FLOW CONDITIONER AGM-09-R-08 Rev. B By Kimbal A. Hall, PE Submitted to: WESTFALL MANUFACTURING COMPANY September 2009 ALDEN RESEARCH LABORATORY, INC.
ProSoft Technology, Inc. Summary Regarding Alberta Energy and Utilities Board Directive 017 of May 2007
 Overview ProSoft Technology, Inc. Summary Regarding Alberta Energy and Utilities Board Directive 017 of May 2007 ProSoft Technology s Gas and Liquid Flow Computer (AFC) products will comply with the requirements
Operational experiences with the EuroLoop Liquid Hydrocarbon Flow Facility
 Operational experiences with the EuroLoop Liquid Hydrocarbon Flow Facility Jos G.M. van der Grinten, NMi EuroLoop Bart van der Stap, Flowways Dick van Driel, Krohne Abstract The operational experiences
485 Annubar Primary Flow Element Installation Effects
 ROSEMOUNT 485 ANNUBAR 485 Annubar Primary Flow Element Installation Effects CONTENTS Mounting hole diameter Alignment error Piping Geometry Induced Flow Disturbances Pipe reducers and expansions Control
Gerald D. Anderson. Education Technical Specialist
 Gerald D. Anderson Education Technical Specialist The factors which influence selection of equipment for a liquid level control loop interact significantly. Analyses of these factors and their interactions
Flow Meter Diagnostics The Future of Measurement
 Flow Meter Diagnostics The Future of Measurement Craig Marshall, NEL 1 INTRODUCTION Flow meters have been in use for thousands of years with the first documented case being in Egypt some 3000 years ago
GAS TRANSPORTER S REQUIREMENTS FOR GAS MEASUREMENT SYSTEMS CONNECTED TO THE NATIONAL GRID GAS NETWORK
 SPECIFICATION FOR GAS TRANSPORTER S REQUIREMENTS FOR GAS MEASUREMENT SYSTEMS CONNECTED TO THE NATIONAL GRID GAS NETWORK J510 ( Rev 04/06 ) OCTOBER 2005 . CONTENTS Page FOREWORD BRIEF HISTORY iii iii INTRODUCTION
Applied Fluid Mechanics
 Applied Fluid Mechanics 1. The Nature of Fluid and the Study of Fluid Mechanics 2. Viscosity of Fluid 3. Pressure Measurement 4. Forces Due to Static Fluid 5. Buoyancy and Stability 6. Flow of Fluid and
PIG MOTION AND DYNAMICS IN COMPLEX GAS NETWORKS. Dr Aidan O Donoghue, Pipeline Research Limited, Glasgow
 PIG MOTION AND DYNAMICS IN COMPLEX GAS NETWORKS Dr Aidan O Donoghue, Pipeline Research Limited, Glasgow A model to examine pigging and inspection of gas networks with multiple pipelines, connections and
Ultrasonic Meter Diagnostics - Advanced
 Ultrasonic Meter Diagnostics - Advanced Overview of advanced diagnostic features of wetted-sensor ultrasonic flow meters Dan Hackett Daniel Measurement and Control, Inc. 11100 Brittmoore Park Drive Houston,
Courses of Instruction: Controlling and Monitoring of Pipelines
 Courses of Instruction: Controlling and Monitoring of Pipelines Date December 2010 Dr. Peter Eschenbacher Partner Angergraben 4 85250 Altomünster Germany Tel. +49-(0)8254 / 99 69 57 Fax +49-(0)8254 / 99
Fundamentals of Multipath Ultrasonic flow meters for Gas Measurement
 Fundamentals of Multipath Ultrasonic flow meters for Gas Measurement Overview of selection, installation, operation and maintenance of wetted-sensor ultrasonic flow meters Dan Hackett Daniel Measurement
Ultrasonic Gas Measurement in a Production Environment
 Ultrasonic Gas Measurement in a Production Environment Introduction While ultrasonic meters are widely accepted in larger pipeline transportation applications; ultrasonic meters (USMs) are not as commonplace
ULTRASONIC METER DIAGNOSTICS - BASIC. Dan Hackett. Daniel Flow Products
 ULTRASONIC METER DIAGNOSTICS - BASIC Dan Hackett Daniel Flow Products Abstract This paper discusses fundamental principles of ultrasonic gas flow meters used for measurement of natural gas and the available
CHAPTER 7: THE FEEDBACK LOOP
 When I complete this chapter, I want to be able to do the following. Identify the major elements in the feedback loop Select appropriate candidate variables to be controlled and manipulated Evaluate the
Gas measurement for the real world
 V-Cone meter : Gas measurement for the real world Maron J. Dahlstrøm Phillips Petroleum Company Norway Summary This paper describes the performance of the V-Cone meters used for Embla test separator gas
Contribution to economic upstream gas metering with a dual-path ultrasonic metering solution
 Contribution to economic upstream gas metering with a dual-path ultrasonic metering solution Sebastian Stoof, SICK AG, Germany Dr. Andreas Ehrlich, SICK AG, Germany Dr. Olaf Stawicki, SICK AG, Germany
A Depletion Compensated Wet Bath Simulator For Calibrating Evidential Breath Alcohol Analyzers
 A Depletion Compensated Wet Bath Simulator For Calibrating Evidential Breath Alcohol Analyzers Slemeyer, A. University of Applied Sciences of Giessen, Dept. of Electrical Engineering 1 Wiesenstr. 14, D-35390
ERZ 2000-NG Flow Computer
 ERZ 2000-NG Flow Computer With decades of natural gas measurement experience, RMG has developed the ERZ 2000-NG an approved and best-in-class gas flow measurement solution for all areas of gas volume conversion.
deltaflowc deltaflowc Gas Massflowmeter Venturi- and Probe Type
 deltaflowc Mass Flowmeter for Gases - Multivariable with ultra fast dp-, p- and T-Sensors - Compact, accurate and user-friendly - Ideal for OEMs deltaflowc Gas Massflowmeter Venturi- and Probe Type Precise
Significant Change to Dairy Heat Treatment Equipment and Systems
 Significant to Dairy Heat Treatment September 2008 Page 1 Significant to Dairy Heat Treatment Equipment and Systems September 2008 1 Background Requirements for the assessment of dairy heat treatment equipment
Mass Flow Controller (MFC) for Gases
 for Gases") Mass Flow Controller (MFC) for Gases Type 8713 can be combined with... Direct flow measurement by MEMS- Technology for nominal flow rates from 1 ml N /min to 8 l N /min (N 2 ) High accuracy and repeatability
Mass Flow Controller (MFC) for Gases Type 8713 can be combined with... Direct flow measurement by MEMS- Technology for nominal flow rates from 1 ml N /min to 8 l N /min (N 2 ) High accuracy and repeatability
Ron Gibson, Senior Engineer Gary McCargar, Senior Engineer ONEOK Partners
 New Developments to Improve Natural Gas Custody Transfer Applications with Coriolis Meters Including Application of Multi-Point Piecewise Linear Interpolation (PWL) Marc Buttler, Midstream O&G Marketing
North Sea Flow Measurement Workshop th October 2017
 The Search for Gas Chromatograph Operational Nirvana Anwar Sutan, i-vigilant Technologies Børge Olafsen, AkerBP Andrew Runcie, PX Limited 1 Introduction In the summer of 2017, the author went for a holiday
Integral type Differential pressure flowmeter VNT Series
 Integral type Differential pressure flowmeter VNT Series OUTLINE VH series Wafer-Cone differential pressure flowmeter and high precision differential pressure transmitter are integrated into one flowmeter.
TEK-THERMAL 1700B. Thermal Mass Flowmeter. FLOW. Technology Solutions
 Technology Solutions TEK-THERMAL 1700B Thermal Mass Flowmeter FLOW www.tek-trol.com Flow Level Temperature Pressure Valves Analyzers Accessories TekValSys Introduction Tek-Thermal 1700B Thermal Mass Flowmeters,
BOTTOM MAPPING WITH EM1002 /EM300 /TOPAS Calibration of the Simrad EM300 and EM1002 Multibeam Echo Sounders in the Langryggene calibration area.
 BOTTOM MAPPING WITH EM1002 /EM300 /TOPAS Calibration of the Simrad EM300 and EM1002 Multibeam Echo Sounders in the Langryggene calibration area. by Igor Kazantsev Haflidi Haflidason Asgeir Steinsland Introduction
TECHNIQUES OF COMPOSITE SAMPLING. Kris Kimmel. YZ Systems, Inc Pollok Drive Conroe, Texas 77303
 TECHNIQUES OF COMPOSITE SAMPLING Kris Kimmel YZ Systems, Inc. 3101 Pollok Drive Conroe, Texas 77303 Introduction Since a gas sampling system can be referred to as a cash register it is very important that
Experimental Analysis on Vortex Tube Refrigerator Using Different Conical Valve Angles
 International Journal of Engineering Research and Development e-issn: 7-067X, p-issn: 7-00X, www.ijerd.com Volume 3, Issue 4 (August ), PP. 33-39 Experimental Analysis on Vortex Tube Refrigerator Using
Chapter 22 Testing Protocols
 This document is not an API Standard; it is under consideration within an API technical committee but has not received all approvals required to become an API Standard. It shall not be reproduced or circulated
PROCESS MONITORING AND CONTROL
 Chemical Engineering Process Design PROCESS MONITORING AND CONTROL Keith Marchildon David Mody Monitoring means Measurement 1. There is no Control without Monitoring 2. Monitoring should not be done without
The Discussion of this exercise covers the following points:
 Exercise 3-2 Orifice Plates EXERCISE OBJECTIVE In this exercise, you will study how differential pressure flowmeters operate. You will describe the relationship between the flow rate and the pressure drop
M-06 Nitrogen Generator (Nitrogen Making Machine)
") Guideline No.M-06 (201510) M-06 Nitrogen Generator (Nitrogen Making Machine) Issued date: 20 th October, 2015 China Classification Society Foreword This Guideline is a part of CCS Rules, which contains
Guideline No.M-06 (201510) M-06 Nitrogen Generator (Nitrogen Making Machine) Issued date: 20 th October, 2015 China Classification Society Foreword This Guideline is a part of CCS Rules, which contains
Instructions for SMV 3000 Multivariable Configuration (MC) Data Sheets
 Data Sheets") Instructions for SMV 3000 Multivariable Configuration (MC) Data Sheets Similar to the TC option for ST 3000 transmitters, the MC option for the SMV 3000 provides a service to our customers which results
Instructions for SMV 3000 Multivariable Configuration (MC) Data Sheets Similar to the TC option for ST 3000 transmitters, the MC option for the SMV 3000 provides a service to our customers which results
INTERACTION BETWEEN WIND-DRIVEN AND BUOYANCY-DRIVEN NATURAL VENTILATION Bo Wang, Foster and Partners, London, UK
 INTERACTION BETWEEN WIND-DRIVEN AND BUOYANCY-DRIVEN NATURAL VENTILATION Bo Wang, Foster and Partners, London, UK ABSTRACT Ventilation stacks are becoming increasingly common in the design of naturally
TWO PHASE FLOW METER UTILIZING A SLOTTED PLATE. Acadiana Flow Measurement Society
 TWO PHASE FLOW METER UTILIZING A SLOTTED PLATE Acadiana Flow Measurement Society Gerald L. Morrison Presented by: Mechanical Engineering Department Daniel J. Rudroff 323 Texas A&M University Flowline Meters
TI 176B Flow Rate Audit Calculations
 TI 176B Flow Rate Audit Calculations TABLE OF CONTENTS TABLE OF FIGURES... 1 LIST OF TABLES... 1 1.0 PURPOSE AND APPLICABILITY... 2 2.0 RESPONSIBILITIES... 2 2.1 Field Specialist... 2 2.2 Field Technician...
ZIN Technologies PHi Engineering Support. PHi-RPT CFD Analysis of Large Bubble Mixing. June 26, 2006
 ZIN Technologies PHi Engineering Support PHi-RPT-0002 CFD Analysis of Large Bubble Mixing Proprietary ZIN Technologies, Inc. For nearly five decades, ZIN Technologies has provided integrated products and
Mass Flow Controller (MFC) for Gases
 for Gases") Mass Flow Controller (MFC) for Gases Bypass MFC with capillary technology for nominal flow rates from 5 ml N /min to 15 l N /min Applicable for aggressive gases Compact design and digital communication
Mass Flow Controller (MFC) for Gases Bypass MFC with capillary technology for nominal flow rates from 5 ml N /min to 15 l N /min Applicable for aggressive gases Compact design and digital communication
Engineering: Measurement Technology Pressure/Level (SCQF level 6)
") National Unit Specification: general information CODE F5KT 12 SUMMARY This Unit can be delivered as part of a National Qualification Group Award but can also be taken as a free-standing Unit. This Unit
National Unit Specification: general information CODE F5KT 12 SUMMARY This Unit can be delivered as part of a National Qualification Group Award but can also be taken as a free-standing Unit. This Unit
Compiled by: B Beard. Approved by: SH Carstens. Description of requirements and procedures for compact provers to be used as verification standards.
 1. Scope Description of requirements and procedures for compact provers to be used as verification standards. 2. Reference documents Trade Metrology Act SANS1698 3. Policy A. BASIC REQUIREMENTS Compact
Stormy Phillips BASICS OF LEASE AUTOMATIC CUSTODY TRANSFER (LACT) SYSTEMS
 SYSTEMS") Stormy Phillips BASICS OF LEASE AUTOMATIC CUSTODY TRANSFER (LACT) SYSTEMS Why is Stormy Walking Funny?? What is a LACT system? Introduction A LACT unit is a group of equipment designed specifically for
Stormy Phillips BASICS OF LEASE AUTOMATIC CUSTODY TRANSFER (LACT) SYSTEMS Why is Stormy Walking Funny?? What is a LACT system? Introduction A LACT unit is a group of equipment designed specifically for
ENSURING AN ACCURATE RESULT IN AN ANALYTICAL INSTRUMENTATION SYSTEM PART 1: UNDERSTANDING AND MEASURING TIME DELAY
 ENSURING AN ACCURATE RESULT IN AN ANALYTICAL INSTRUMENTATION SYSTEM PART 1: UNDERSTANDING AND MEASURING TIME DELAY Process measurements are instantaneous, but analyzer responses never are. From the tap
Measurement & Analytics Wet gas monitoring
 Product guide PG/FLOW/010-EN Measurement & Analytics Wet gas monitoring Economical wet gas metering using non-proprietary correlations Measurement made easy Introduction With many of the most economically
N.V. Nederlandse Gasunie. Gasunie Transport Services
 N.V. Nederlandse Gasunie Gasunie Transport Services Functional requirements for fiscal metering systems This specification is drawn up by the Gasunie department "Gasunie Transport Services; Metering &
Hydro-Control V User Guide
 Hydro-Control V User Guide Hydronix Part no: HD0193 Version 2.3.0 Revision date: July 2006 1 COPYRIGHT Neither the whole or any part of the information contained in nor the product described in this documentation
2600T Series Pressure Transmitters Plugged Impulse Line Detection Diagnostic. Pressure Measurement Engineered solutions for all applications
 Application Description AG/266PILD-EN Rev. C 2600T Series Pressure Transmitters Plugged Impulse Line Detection Diagnostic Pressure Measurement Engineered solutions for all applications Increase plant productivity
Gas Measurement Fundamentals Certification. Curriculum
 Gas Certification Institute, LLC P.O. Box 131525 Houston, Texas 77219-1525 281-598-7200 Phone 281-598-7199 Fax contact@gascertification.com www.gascertification.com Curriculum Copyright 2007-2012 Gas Certification
Aberdeen Significant Error Review ITE Independent Report. Eur Ing Keith Vugler CEng FInstMC
 1 Aberdeen Significant Error Review ITE Independent Report 331 Eur Ing Keith Vugler CEng FInstMC 2 Previous Presentation Summary My previous presentation (16 th July 2012) provided; an introduction to
Level MEASUREMENT 1/2016
 Level MEASUREMENT 1/2016 AGENDA 2 A. Introduction B. Float method C. Displacer method D. Hydrostatic pressure method E. Capacitance method G. Ultrasonic method H. Radar method I. Laser method J. Level
Lab 3 Introduction to Quantitative Analysis: Pumps and Measurements of Flow
 Georgia Institute of Technology School of Earth and Atmospheric Sciences EAS 4641, Spring 2008 Lab 3 Introduction to Quantitative Analysis: Pumps and Measurements of Flow Purpose of Lab 3: 1) To gain a
Vortex Flow Meter Wafer or Flange Connection. - Steam - Liquid - Gas
 Vortex Flow Meter Wafer or Flange Connection - Steam - Liquid - Gas Working Principle & Circuit Diagram Working Principle When a column body placed in flowing fluids in pipe, a series of vortices will
Coriolis Mass Flow Meter
 Coriolis Mass Flow Meter TMFW Series Mini Type Coriolis Mass Flow Meter Xi an Tosilon Automation Co., Ltd No.299, Daqing Rd, Lianhu District, Xi'an Shaanxi, China Tel: +86-29-8823 8550 info@tosilon.com;
SPE The paper gives a brief description and the experience gained with WRIPS applied to water injection wells. The main
 SPE 102831 Online Water-Injection Optimization and Prevention of Reservoir Damage Bjørn Øyvind Bringedal, Svein Arne Morud, Nicolas Alexander Hall, ABB; Gary Huseman, Shell Copyright 2006, Society of Petroleum
Yokogawa Systems and PCI Training
 Yokogawa Systems and PCI Training 09 th December 2014 Nico Marneweck 082 883 2652 Kallie Bodenstein 083 226 2787 Marco Coccioni 072 409 5779-1 - Introduction Training customised for the South Africa Industrial
Gasunie Technical Standard
 Gasunie Technical Standard Design Specification Instrumentation OSM-20-E Functional requirements for fiscal metering systems External Version 1 23-03-2015 N.V. Nederlandse Gasunie Gasunie Technical Standard
Vehicle-mounted meters, pump supplied
 Purpose This inspection procedure outline (IPO) defines the minimum tests which must be performed to ensure that basic volumetric measuring devices comply with the legislation. Application Vehicle-mounted
THE BRIDGE COLLAPSED IN NOVEMBER 1940 AFTER 4 MONTHS OF ITS OPENING TO TRAFFIC!
 OUTLINE TACOMA NARROWS BRIDGE FLOW REGIME PAST A CYLINDER VORTEX SHEDDING MODES OF VORTEX SHEDDING PARALLEL & OBLIQUE FLOW PAST A SPHERE AND A CUBE SUMMARY TACOMA NARROWS BRIDGE, USA THE BRIDGE COLLAPSED
THE WAY THE VENTURI AND ORIFICES WORK
 Manual M000 rev0 03/00 THE WAY THE VENTURI AND ORIFICES WORK CHAPTER All industrial combustion systems are made up of 3 main parts: ) The mixer which mixes fuel gas with combustion air in the correct ratio
CONTROL VALVE WHAT YOU NEED TO LEARN?
 CONTROL VALVE WHAT YOU NEED TO LEARN? i) The control valve characteristics refers to the relationship between the volumetric flowrate F (Y-axis) through the valve AND the valve travel or opening position
Measurement And Control Appreciation
 Measurement And Control Appreciation Course Content Aim To provide an appreciation of the operation and application of process plant instrumentation used for the measurement and display of the main process
NUMERICAL INVESTIGATION OF THE FLOW BEHAVIOUR IN A MODERN TRAFFIC TUNNEL IN CASE OF FIRE INCIDENT
 - 277 - NUMERICAL INVESTIGATION OF THE FLOW BEHAVIOUR IN A MODERN TRAFFIC TUNNEL IN CASE OF FIRE INCIDENT Iseler J., Heiser W. EAS GmbH, Karlsruhe, Germany ABSTRACT A numerical study of the flow behaviour
EXPERIMENTAL RESULTS OF GUIDED WAVE TRAVEL TIME TOMOGRAPHY
 18 th World Conference on Non destructive Testing, 16-20 April 2012, Durban, South Africa EXPERIMENTAL RESULTS OF GUIDED WAVE TRAVEL TIME TOMOGRAPHY Arno VOLKER 1 and Hendrik VOS 1 TNO, Stieltjesweg 1,
Measurement Technology
 In the field of compressed air, measuring pressure provides the data basis for rating the correct pressure head of pressure differences in the distribution system as well as for controlling and regulating
17. Flare header gas sampler at atmospheric pressure. Ole-John Melkevik, Specialist O&M Statoil Kårstø Gas Processing Plant Norway
 17. Flare header gas sampler at atmospheric pressure By Ole-John Melkevik, Specialist O&M Statoil Kårstø Gas Processing Plant Norway Table of contents 1 Introduction... 3 2 Problem... 3 3 Solution... 4
CALIBRATION PARAMETERS IMPACT ON ACCURACY OF NATURAL GAS ULTRASONIC METER
 flotek.g 2017- Innovative Solutions in Flow Measurement and Control - Oil, Water and Gas August 28-30, 2017, FCRI, Palakkad, Kerala, India CALIBRATION PARAMETERS IMPACT ON ACCURACY OF NATURAL GAS ULTRASONIC