Spatially Tracking Wave Events in Partitioned
|
|
|
- Archibald Hill
- 5 years ago
- Views:
Transcription
1 Spatially Tracking Wave Events in Partitioned Numerical Wave Model Outputs Haoyu Jiang 1,2,3* 1 College of Marine Science and Technology, China University of Geosciences, Wuhan, China 2 Laboratory for Regional Oceanography and Numerical Modeling, Qingdao National Laboratory for Marine Science and Technology, Qingdao, China 3 Shenzhen Research Institute, China University of Geosciences, Shenzhen, China Corresponding Author: Haoyu Jiang (Haoyujiang@cug.edu.cn)
2 ABSTRACT Numerical wave models can output partitioned wave parameters at each grid point using a spectral partitioning technique. Because these wave partitions are usually organized according to the magnitude of their wave energy without considering the coherence of wave parameters in space, it can be difficult to observe the spatial distributions of wave field features from these outputs. In this study, an approach for spatially tracking coherent wave events (which means a cluster of partitions originated from the same meteorological event) from partitioned numerical wave model outputs is presented to solve this problem. First, an efficient traverse algorithm applicable for different types of grids, termed breadthfirst search, is employed to track wave events using the continuity of wave parameters. Second, to reduce the impact of the garden sprinkler effect on tracking, tracked wave events are merged if their boundary outlines and wave parameters on these boundaries are both in good agreement. Partitioned wave information from the Integrated Ocean Waves for Geophysical and other Applications dataset is used to test the performance of this spatial tracking approach. The test results indicate that this approach is able to capture the primary features of partitioned wave fields, demonstrating its potential for wave data analysis, model verification, and data assimilation. 1
3 1. Introduction The ocean wave field at a given point is usually the superposition of a local windsea system and one or more swell systems originating from different meteorological events. Each of these wave systems can be considered to be independent of the others. Efforts are made to improve spectral partitioning schemes that isolate the information of different wave systems in directional wave spectra (e.g., Gerling, 1992; Hanson and Phillips, 2001; Portilla et al., 2009; Ailliot et al., 2013), because wave parameters integrated over the whole spectrum (such as the overall significant wave height (SWH), mean wave period, and mean wave direction) can be misleading in mixed seas. After years of development, the spectral partitioning scheme is used in increasing numbers of applications (e.g., Collard et al., 2009; Delpey et al., 2010; Jiang et al., 2016, 2017). Some numerical wave models (NWMs) use spectral partitioning to output partitioned wave parameters, such as partitioned SWH (PSWH), partitioned peak wave direction (PPWD), and partitioned peak wave period (PPWP). For example, the WAVEWATCH III (WW3) uses the method of Hanson and Phillips (2001) to partition wave spectra into at most one windsea system and five swell systems (Tracy et al. 2007; The WAVEWATCH III Development Group, 2016). A similar data product is also available from the European Centre for Medium Range Weather Forecast ocean wave model with at most one windsea system and three swell systems (Bidlot, 2016). The windsea partition in NWM output is usually labeled as Partition 0, and the swell partitions are usually sorted and labeled according to their respective SWHs. Therefore, the coherence of the wave parameters at two points close to each in space and time cannot be guaranteed for the same partition label. For instance, Figure 1 shows the global 2
4 distributions of PSWH, PPWD, and PPWP for the windsea partition and the first five most energetic swell partitions on 1-January-2016, 0000 UTC from a WW3 output field (the data used here will be introduced in section 3). Discontinuity can be observed in all partitions for all three parameters, especially in partitions with larger label numbers, making it difficult to observe the features of wave fields in most of these plots. Meanwhile, the continuity of these parameters might skip from one partition to another, even between a windsea partition and a swell partition. This figure is similar to Figure 2 in Delpey et al. (2010) where a similar problem is discussed. The time series for any given partition at any given location may also exhibit discontinuity within the same partition label (not shown here). To generate a coherent wave event, some spatial and temporal tracking algorithms are developed to track waves that originate from the same meteorological event. There are two types of wave event tracking methods. One involves back-tracking the wave based on the linear dispersion relation to test whether a group of wave parameters corresponds to a unique (e.g., Aarnes and Krogstad, 2001) or known (e.g., Delpey et al., 2010) source. This type of method works only for old swells which have propagated into far fields while it cannot apply to windseas and young swells because the non-linear wave-wave interaction is not usually taken into consideration in backing-tracking. The other type of tracking algorithm makes use of wave parameter continuity in space-time neighboring grid points for the same wave event (e.g., Voorrips et al., 1997; Hanson and Phillips, 2001; Devaliere et al., 2009). The temporal tracking scheme proposed by Hanson and Phillips (2001) is widely used to track time series of wave events (e.g., Jiang et al., 2016), and a spatial tracking scheme is proposed by Devaliere et al. (2009) using a spiral searching algorithm. 3
5 Both the temporal and spatial tracking schemes are implemented in WW3 (Van der Westhuysen et al., 2013; The WAVEWATCH III Development Group, 2016). Temporal tracking is conducted on a one-dimensional time series so that the search strategy can be simply searching from one time point to the next, but spatial tracking of wave events is conducted on a two-dimensional map so that different search algorithms can be applied. Devaliere et al. (2009) develop a spiral search algorithm to merge wave components into wave events. However, this algorithm is designed for rectangular grids and is not directly applicable to unstructured grids (Devaliere et al., 2009; Van der Westhuysen et al., 2013). In addition, the spiral search algorithm is often influenced by the land effect, which reduces the efficiency. The aim of this study is to present an algorithm for spatially tracking wave events that is applicable for both structured and unstructured grids. 2. Breadth-first tracking of wave field The process of wave event spatial tracking involves searching for the wave components in all neighboring grid points with a small variation of wave parameter, which can be regarded as a process of graph traversing. A widely used traversing algorithm, breadth-first search (BFS), should therefore be a good tool for this task. BFS starts at any grid point in the wave field and explores all the neighboring grid points prior to moving on to one of them. Based on this algorithm, wave events are spatially tracked as shown in the flowchart in Figure 2 and described below: (1) Start the search from any partition at any grid point. Put this partition into a queue (a first-in-first-out array), remove it from the original dataset, and mark this grid point as 4
6 visited. Here, the starting grid point and partition are specified as the grid point and partition with the global maximum PSWH. (2) Designate the first element in the queue as the current wave partition. For all the partitions in all neighboring grid points that are not visited, calculate the spectral distance gradients between them and the current partition. The spectral distance gradient is defined as: Hcur H nei Tcur T nei cur nei turn = (1) d Ha T b c 2 where H, T, and θ are PSWH, PPWP, and PPWD, respectively, and the subscript cur and nei denote the current and neighboring points, respectively. d is the geographical distance between the two points, and Ha, Tb, and θc are weighting factors that need to be tuned. θturn is also a tuning parameter introduced here because the nominal direction of a wave packet can change while propagating along a great circle especially at high latitudes. (3) For each neighboring grid point, if the spectral distance gradient of the partition with minimum δ is less than an assigned threshold δth, put this partition into the aforementioned queue, mark this grid point as visited, and remove this partition from the original dataset. The neighboring grid point does not have to be connected with the current grid point: it can also be referred to as the grid points within a certain distance of the current point (e.g., less than 100 km). In this study, the grid points in the 8-connectivity of the current point are selected as the neighboring grid points for the rectangular grid, and grid points connected with the current grid point are selected for the triangular grid. 5
7 (4) When no partition meets the requirement of δ in any neighboring grid points of the current partition, the current wave partition is transferred to another array that stores the tracking results (the current wave partition is also removed from the queue). (5) Repeat steps (2)-(4) until all the wave partitions in the queue are transferred to the array storing the results. This result array then corresponds to a tracked wave event. (6) Mark all grid points as unvisited, and then repeat from step (1) to track other wave events until all the wave partitions are removed from the original dataset. According to Equation 1, a small spectral distance gradient means that the PSWH, PPWP, and PPWD are geographically changing slowly. It is noted that there is no consensus on the definition of the spectral distance in Equation 1 (e.g., Hanson and Phillips, 2001, Delpey et al., 2009; Husson, 2012). Here, a form similar to the one given by Hanson and Phillips (2001) is selected, but other definitions should also work. The values of the tuning parameters, Ha, Tb, θc, and θturn, as well as the assigned threshold δth, are shown in Table 1. During the tuning process, the value of Tb is set to 1 s, and the other parameters are obtained through an iterative trial process. These values are with only one significant digit because changing these values slightly have a very small impact on the tracking results. The value of θturn is set to be proportional to the square of latitude because the nominal direction change along a great circle is larger at high latitudes. The value of δth is also regarded as being proportional to Hcur because newly generated waves usually have both larger wave heights and larger gradient of wave parameters. 3. Test and improvement Since the search process needs to compare only the wave parameters in neighboring grid points, the tracking method presented in the above section should be applicable to any 6
8 partitioned NWM output in any type of grid, no matter whether it is structured or unstructured. Because WW3 can provide standard output for partitioned wave information in NetCDF format with one windsea system and up to five swell systems, the Integrated Ocean Waves for Geophysical and other Applications (IOWAGA) dataset (Rascle and Ardhuin, 2013), which is a hindcast dataset of WW3, is employed in this study to test the algorithm. IOWAGA is an open-access dataset which contains the global information of partitioned SWH, PWP, and PWD with a relatively high spatial-temporal resolution of h. This dataset is selected here for two primary reasons: (1) The data is available for free from the FTP server of IFREMER where detailed information can also be found. (2) This dataset shows good agreement with observations from buoys and altimeters (e.g., Ardhuin et al., 2010) and is selected in some other studies of swell event tracking (e.g., Delpey et al., 2010; Jiang et al., 2016). Figure 1 displays the information contained in this dataset, and these data are also employed for the demonstration of the tracking results. The dataset is organized in a structured grid. To test the performance of the tracking method in an unstructured grid, the data is interpolated into a global triangular grid generated by Gridgen software using the nearest neighbor approach. Other interpolation approaches, such as linear or Kriging interpolation, are not used here due to the discontinuity of wave parameters in the same partition label, or to say, interpolation approaches involving more than one grid point have to be implemented after the spatial tracking of wave events. There is almost no difference between the results for the structured and unstructured grids. Three examples of the spatial tracking results are shown in Figure 3. The first example is a storm-generated wave event in the North Pacific. A winter storm generates waves with 7
9 a PSWH of more than 6 m in the center of the wave field. The largest PPWP (~15s) is observed in two locations: one corresponds to the largest PSWH, which is primarily due to the strong wave-wave interaction in windseas, and the other is near the spatial boundary of the wave event along the wave direction, which is primarily due to the frequency dispersion of swells. Parts of this event should be regarded as windseas while parts of it should be regarded as swells, and this event implies that there is no clear distinction between the two types of wind-waves. The second example is a pure swell case which can be identified from the rainbow-like pattern of PPWP: a clear PPWP gradient is observed along the propagation direction of the wave field but the gradient is almost zero along the crosspropagation direction. When waves propagate far away from their generating areas, the spectra become narrow and the wave-wave interactions are negligible. The swells with higher PPWPs travel faster than those with lower PPWPs because of the dispersion relation, resulting in the rainbow-like period striping. The SWH distribution in the second case shows clear anisotropy which is discussed in Delpey et al. (2010), and the highest wave energy is found in the intermediate periods of the wave event. The third example is a typical windsea event (as can be seen in Figure 1a and 1b) generated by the winter monsoon in the South China Sea. Since the fetch is short in such a semi-enclosed sea, it is difficult for the frequency dispersion to separate the energy with different periods or for the wave to reach a fully-developed state. Therefore, the distribution of PPWP is relatively homogeneous in this event and only varies in the range of 9~10 s. Using this method, tens of such wave events are spatially tracked at the same time. During the test, however, it is found that the same swell event might be wrongly separated into several fields with different PPWPs and PSWHs due to the garden sprinkler effect 8
10 (GSE) of frequencies along swell propagation directions (Tolman, 2002). An example is shown in Figure 4 where the spatial boundaries of three wave events seem to be in good agreement with each other. The PPWDs of them are generally the same, and the PSWHs/PPWPs of them decrease/increase gradually along the wave propagation direction. Clearly, they belong to the same swell event. Although the GSE can be greatly alleviated by some numerical schemes (e.g., Tolman, 2002), it is still well-defined in the model output especially for swells in the far field where the spectra are very narrow. In this case, the GSE leads to a PPWP difference of ~0.5 s between adjacent grids. This difference corresponds to a spectral distance gradient of 10-2 order of magnitude, which is much larger than the δth. Simply increasing the value of δth can partially solve the problem, but it will also lead to other problems as shown in Figure 5 where the δth is set to Hcur km -1, five times the original value. For visual analysis, results like Figure 5 are acceptable as the wave parameters in Figure 5 are already much more organized and continuous compared to Figure 1. However, distinct discontinuity of wave parameters is observed especially in the PPWP. For instance, the forerunners of some swell events come into contact with the lower frequency components of some other swell events. Also, it is noted that the three wave events in Figure 3 are regarded as the same event in Figure 5 when the δth is enlarged. To better separate different wave events while minimizing the impact of the GSE, a corresponding procedure termed event merging is applied for the wave events of which the boundaries are in good agreement. To determine whether two tracked events can be merged, the following criteria are used: 9
11 (1) Overlap Test: If the spatial extents of the two wave events have significant overlap, they will not be regarded as being from the same wave event. In this case, the threshold grid number of overlap is set to 1 of the grid number of the wave event with the lower grid number. (2) Boundary Test: Extend the spatial extent of one of the two events for two grid points (i.e., dilate the boundary of one of the events by two grid points from a graphics point of view). If the extended spatial extent does not have significant overlap with the spatial extent of the other event (i.e., the boundaries of two tracked wave events are inconsistent), the two events cannot be merged. Here, this threshold grid number of overlap is simply set to 10 which works well for the test dataset. (3) Wave Parameter Test: If the spatial distance between the two points respectively from two to-be-merged tracked wave events which are not filtered by the above two criteria is within 150 km, they are referred to as a point pair. If the mean spectral distance gradient of all point pairs is within a threshold δth2, the two tracked wave events will be merged. Here, the value of δth2 is set to Nov (in km -1 ) where Nov is the number of overlapping grid points in the above Boundary Test (2). The idea of introducing Nov is that the possibility of the two tracked wave results being from the same events will be larger if their boundaries are in better agreement. This value works well for this dataset, and changing it within ±20% has almost no influence on the results due to the first two criteria. After merging, the three tracked results in Figure 4 are merged into one in Figures 6a and 6b, showing that they are indeed the same event. Figures 6c and 6d show the same event of the one in Figures 3c and 3d, but the spatial extent of the event appears to be larger after merging the long-ppwp stripes, and some data gaps are filled (e.g., the region with 10
12 the maximum PSWH), showing the improvement of the tracking results using this merging procedure. Figures 6e and 6f are also a case in which several tracked results are merged into one wave event. In this case, a seam can be observed in the low-frequency (long-period) part of the wave event. That is the reason why the spatial extent of one of the tracked events is extended for two grid points instead of one in the above Boundary Test (2). The PSWH near this seam is low (less than 0.2 m) so that the GSE might lead to lower wave energy in this seam which might not be identified by the partitioning algorithm of Hanson and Phillips (2001). These results all show that the GSE in the frequency direction has a relatively large impact on swells with long periods in the far field. Although this effect only has a very small impact on the simulation of overall SWHs due to the low energy contribution of such partitions, it should be taken into account in tracking and modeling the forerunners of ocean swells. 4. Summary and Discussion Wave partitions in NWM output are usually organized without considering the coherence of wave parameters in space, making it difficult to observe the features of wave fields. In this study, an approach for spatially tracking coherent wave events using partitioned NWM output is presented to solve this problem. This two-step method first traverses the wave event using the continuity of wave parameters by BFS, then merges the events of which the boundaries and the wave parameters on the boundaries are both in good agreement. The BFS in the first step is an efficient traversal method which works for all grid types. The second step is to reduce the impact of the GSE, which effectively improves the tracking results. To have a better global view of the tested wave field, the first 100 largest (with respect to area) tracked wave events on 1-January-2016, 0000 UTC are shown 11
13 in Figure 7. The wave events without overlap with respect to the dilated spatial extents are plotted on the same map. Although more than six maps are used to display the information of the wave field (Figure 1 only uses six maps), the wave field features are much more clearly-observed and more coherent in Figure 7 than those in Figure 1. Although the results seem to be nice for some events, there are still two shortcomings in this approach that the author fails to overcome at this stage. On the one hand, not all the wave partitions are assigned to a wave event and the spatial extents of some tracked events are small (only a few grid points, as shown in Figure 7). This is largely due to the error of spectral partitioning algorithm itself. It is noted that the WW3 retains at most six partitions at a given location, but sometimes more than six partitions can coexist. In addition, the watershed-algorithm-based partitioning scheme (e.g., Hanson and Phillips, 2001) is a purely morphological method that does not consider wave dynamics. When the energy peak of a partition becomes smaller than the tail of a nearby partition, it might be overwhelmed by the nearby partition, and the watershed-algorithm-based partitioning scheme cannot identify it (Ailliot et al., 2013). Both of these might lead to discontinuity of partitioned wave parameters in neighboring grid points and interrupt the procedure of wave event tracking. On the other hand, only a single partition can be tracked at a given location, because only the partition with the minimum spectral distance gradient at that point can be included in the wave event according to this tracking method. However, this is not always the case because the complicated space-time structure of the wind field might sometimes lead to more than one partitions at the same location for the same event. Removing the step of marking grid points as visited and including all the partitions with δ less than δth, rather than only including the partition with minimum δ, can partially solve this problem. 12
14 Nevertheless, the author has not yet determined a way to visualize the results for the condition that more than one partition is in the same grid point for the same wave event. Despite these shortcomings, this spatial tracking method presented here can capture the main features of partitioned wave fields from NWM output, and there are several potential applications for it. As the visualization of the original NWM partitioned output directly can only provide very limited information on the wave field due to the spatial incoherence of identified partitions, the tracked results for wave events make it convenient to have a quick view of the model output. The resulting spatially coherent wave fields can be used to track the spatial-temporal evolution of wave events from windseas to swells, which can be employed in the study of the space-time structure of wave fields (e.g., Delpey et al., 2010). By comparing spatially-tracked model output with wave spectra measurements from buoys, this approach can also be used to identify potential error sources in wave modeling. Furthermore, this approach might serve as a potential tool for the data assimilation of partitioned NWM output: if coherent evolution of wave events in the NWMs can be obtained, wave data assimilation can be conducted at the event level by assimilating in-situ measurements from buoys or remote sensing data from synthetic aperture radars into the corresponding wave events. With the increasing attention being paid to partitioned wave information in NWMs, such a spatial tracking approach could contribute to both the scientific community and the marine industries. Acknowledgments The IOWAGA data are downloaded from IFREMER ftp (ftp.ifremer.fr). REFERENCES 13
15 Aarnes, J. E, and H. E. Krogstad, 2001: Partitioning sequences for the dissection of directional ocean wave spectra: A review. Tech. Rep., SINTEF Appl. Math., Oslo. Ailliot, P., C. Maisondieu, and V. Monbet, 2013: Dynamical partitioning of directional ocean wave spectra. Probabilist. Eng. Mech., 33, Ardhuin, F., et al., 2010: Semi-empirical dissipation source functions for wind-wave models: Part I, Definition, calibration and validation. J. Phys. Oceanogr., 40, Bidlot, J., 2016: Ocean wave model output parameters. [Available at version=1&modificationdate= &api=v2] Collard, F., F. Ardhuin, and B. Chapron, 2009: Monitoring and analysis of ocean swell fields from space: New methods for routine observations. J. Geophys. Res., 114, doi: /2008jc Delpey, M. T., F. Ardhuin, F. Collard, and B. Chapron, 2010: Space-time structure of long ocean swell fields. J. Geophys. Res., 115, doi: /2009jc Devaliere, E.-M., J. L. Hanson and R. Luettich, 2009: Spatial tracking of numerical wave model output using a spiral tracking search algorithm, World Congress Comput. Sci. Inf. Eng., Los Angeles, CA, 2, Gerling, T. W., 1992: Partitioning sequences and arrays of directional ocean wave spectra into component wave systems. J. Atmos. Oceanic Technol., 9, Hanson, J. L., and O. M. Phillips, 2001: Automated analysis of ocean surface directional wave spectra. J. Atmos. Oceanic Technol., 18,
16 Husson, R., 2012: Development and validation of a global observation-based swell model using wave mode operating Synthetic Aperture Radar, Ph.D. thesis, Dep. of Earth Sci., Univ. of Bretagne occidentale, Brest, France. (Available at ). Jiang, H., A. Babanin, and G. Chen, 2016: Event-Based Validation of Swell Arrival Time. J. Phys. Oceanogr., 46, Jiang, H., A. Mouche, H. Wang, A. Babanin, B. Chapron, and G. Chen, 2017: Limitation of SAR Quasi-Linear Inversion Data on Swell Climate: An Example of Global Crossing Swells. Remote Sens., 9, doi: /rs Portilla, J., F. J. Ocampo-Torres, and J. Monbaliu, 2009: Spectral Partitioning and Identification of Wind Sea and Swell. J. Atmos. Oceanic Technol. 26, Rascle, N., and F. Ardhuin, 2013: A global wave parameter database for geophysical applications. Part 2: Model validation with improved source term parameterization. Ocean Modell., 70, The WAVEWATCH III Development Group, 2016: User manual and system documentation of WAVEWATCH III version 5.16, Tech. Note, NOAA/NWS/NCEP/MMAB, College Park, MD, USA. [Available at Tolman, H. L., 2002: Alleviating the garden sprinkler effect in wind wave models. Ocean Modell., 4, Tracy, B., E.-M. Devaliere, T. Nicolini, H. L. Tolman, and J. L. Hanson, 2007: Wind sea and swell delineation for numerical wave modeling. Proc. 10th Int. Workshop on Wave Hindcasting and Forecasting, Paper P12. 15
17 Van der Westhuysen, A., 2013: Spatial and Temporal Tracking of Ocean Wave Systems, Mar. Model. and Anal. Branch, NOAA/NWS/NCEP/EMC. [Available at Voorrips, A. C., V. K. Makin, and S. Hasselmann, 1997: Assimilation of wave spectra from pitch and roll buoys in a North Sea wave model. J. Geophys. Res., 102,
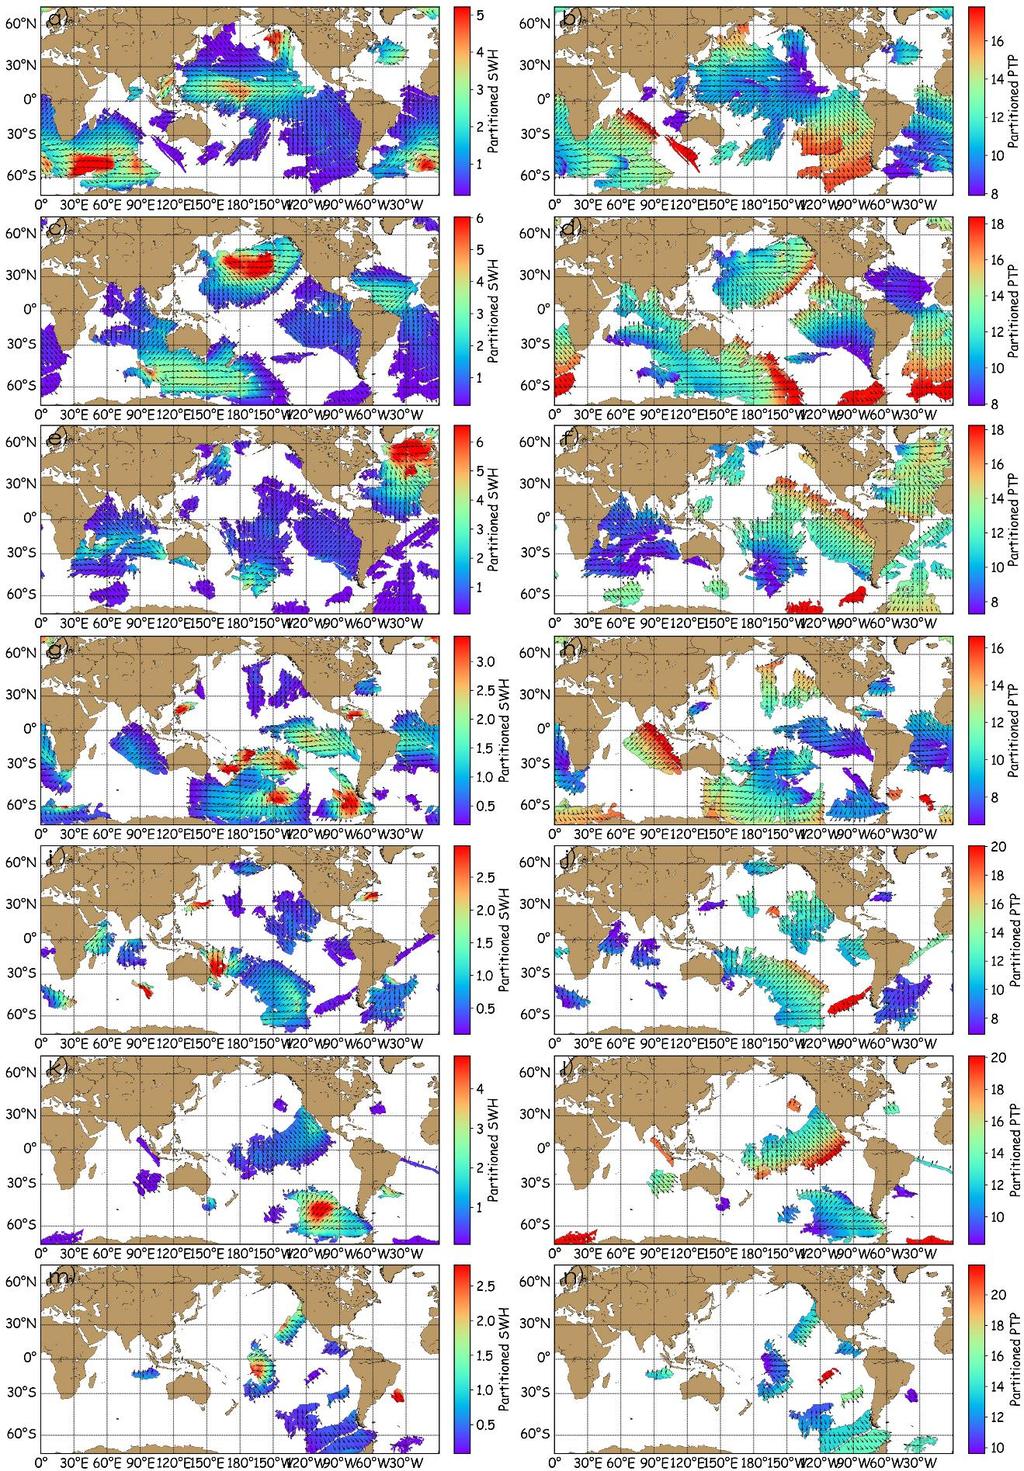
18 Figure & Table Captions Table 1. The values of the tuning parameters. FIG. 1. Modeled global distributions of PSWH (left), PPWP (right), and PPWD (arrows) for the windsea (1 st row) partition and the first (2 nd row) to the fifth (6 th row) swell partitions on 1-January-2016, 0000 UTC. The blank areas mean no corresponding partition is detected. The arrows in all figures are not scaled with the background field. FIG. 2. The flowchart for spatial tracking of wave events. Each color represents a step described in section 2b with the legend shown in the upper-left (S denotes STEP). FIG. 3. Distributions of PSWH (upper), PPWP (lower), and PPWD (arrows) for three examples of the wave events tracked by the method described in Section 2 on 1-January- 2016, 0000 UTC. Subplots a and b (left) show a storm-generated wave event in the North Pacific. Subplots c and d (middle) show a swell event which has propagated out of the generating areas. Subplots e and f (right) show a windsea event in the South China Sea. FIG. 4. An illustration of the distributions of PSWH (upper), PPWP (lower), and PPWD (arrows) for a swell event which is incorrectly separated by the tracking method described in Section 2 on 1-January-2016, 0000 UTC. 17
19 FIG. 5. Distributions of PSWH (left), PPWP (right), and PPWD (arrows) for a wave event when the δth is set to five times the original value in Table 1. FIG. 6. Distributions of PSWH (upper), PPWP (lower), and PPWD (arrows) for three examples of wave events on 1-January-2016 after event merging using the criteria in Section 3. Subplots a and b (left) are the same event as in Figure 4. Subplots c and d (middle) are the same event as in subplots c and d of Figure 3. Subplots e and f (right) show another merged swell event where a seam can be observed in the region with long PPWPs. FIG. 7. Distributions of PSWH (left), PPWP (right), and PPWD (arrows) for the first 100 largest (with respect to area) tracked wave events on 1-January-2016, 0000 UTC. The wave events without overlap with respect to dilated spatial extents are plotted on the same map. 18
20 Table 1. The values of the tuning parameters. Parameters Ha Tb Values (Unit) 2 (m) 1 (s) θc 10 ( ) θturn Max [5 sin 2 (φ), θcur-θnei ] ( ) * δth Hcur (km -1 ) * φ is the latitude of the current grid point. 19
, PPWP (right), and PPWD (arrows) for the windsea (1 st row) partition and the first (2 nd row) to the fifth (6 th row) swell")
21 FIG. 1. Modeled global distributions of PSWH (left), PPWP (right), and PPWD (arrows) for the windsea (1 st row) partition and the first (2 nd row) to the fifth (6 th row) swell partitions on 1-January-2016, 0000 UTC. The blank areas mean no corresponding partition is detected. The arrows in all figures are not scaled with the background field. 20

22 FIG. 2. The flowchart for spatial tracking of wave events. Each color represents a step described in section 2b with the legend shown in the upper-left (S denotes STEP). 21
 show a storm-generated wave event in the North Pacific. Subplots c and d (middle) show a swell event which has propagated out of the generating areas.")
23 FIG. 3. Distributions of PSWH (upper), PPWP (lower), and PPWD (arrows) for three examples of the wave events tracked by the method described in Section 2 on 1-January- 2016, 0000 UTC. Subplots a and b (left) show a storm-generated wave event in the North Pacific. Subplots c and d (middle) show a swell event which has propagated out of the generating areas. Subplots e and f (right) show a windsea event in the South China Sea. 22
, PPWP (lower), and PPWD (arrows) for a swell event which")
24 FIG. 4. An illustration of the distributions of PSWH (upper), PPWP (lower), and PPWD (arrows) for a swell event which is incorrectly separated by the tracking method described in Section 2 on 1-January-2016, 0000 UTC. 23
, PPWP (right), and PPWD (arrows) for a wave")
25 FIG. 5. Distributions of PSWH (left), PPWP (right), and PPWD (arrows) for a wave event when the δth is set to five times the original value in Table 1. 24
 are the same event as in Figure 4. Subplots c and d (middle) are the same event as in subplots c and d of Figure 3.")
26 FIG. 6. Distributions of PSWH (upper), PPWP (lower), and PPWD (arrows) for three examples of wave events on 1-January-2016 after event merging using the criteria in Section 3. Subplots a and b (left) are the same event as in Figure 4. Subplots c and d (middle) are the same event as in subplots c and d of Figure 3. Subplots e and f (right) show another merged swell event where a seam can be observed in the region with long PPWPs. 25
27 26
, PPWP (right), and PPWD (arrows) for the first 100 largest (with respect to area) tracked wave events on")
28 FIG. 7. Distributions of PSWH (left), PPWP (right), and PPWD (arrows) for the first 100 largest (with respect to area) tracked wave events on 1-January-2016, 0000 UTC. The wave events without overlap with respect to dilated spatial extents are plotted on the same map. 27
Dynamic validation of Globwave SAR wave spectra data using an observation-based swell model. R. Husson and F. Collard
 Dynamic validation of Globwave SAR wave spectra data using an observation-based swell model. R. Husson and F. Collard Context 1978 1979 1980 1981 1982 1983 1984 1985 1986 1987 1988 1989 1990 1991 1992
GLOBAL VALIDATION AND ASSIMILATION OF ENVISAT ASAR WAVE MODE SPECTRA
 GLOBAL VALIDATION AND ASSIMILATION OF ENVISAT ASAR WAVE MODE SPECTRA Saleh Abdalla, Jean-Raymond Bidlot and Peter Janssen European Centre for Medium-Range Weather Forecasts, Shinfield Park, RG 9AX, Reading,
Ocean Wave Forecasting
 Ocean Wave Forecasting Jean-Raymond Bidlot* Marine Prediction Section Predictability Division of the Research Department European Centre for Medium-range Weather Forecasts (E.C.M.W.F.) Reading, UK * With
EVALUATION OF ENVISAT ASAR WAVE MODE RETRIEVAL ALGORITHMS FOR SEA-STATE FORECASTING AND WAVE CLIMATE ASSESSMENT
 EVALUATION OF ENVISAT ASAR WAVE MODE RETRIEVAL ALGORITHMS FOR SEA-STATE FORECASTING AND WAVE CLIMATE ASSESSMENT F.J. Melger ARGOSS, P.O. Box 61, 8335 ZH Vollenhove, the Netherlands, Email: info@argoss.nl
IDENTIFICATION OF WIND SEA AND SWELL EVENTS AND SWELL EVENTS PARAMETERIZATION OFF WEST AFRICA. K. Agbéko KPOGO-NUWOKLO
 Workshop: Statistical models of the metocean environment for engineering uses IDENTIFICATION OF WIND SEA AND SWELL EVENTS AND SWELL EVENTS PARAMETERIZATION OFF WEST AFRICA K. Agbéko KPOGO-NUWOKLO IFREMER-
Generalized Wave-Ray Approach for Propagation on a Sphere and Its Application to Swell Prediction
 Generalized Wave-Ray Approach for Propagation on a Sphere and Its Application to Swell Prediction D. Scott 1, D. Resio 2, and D. Williamson 1 1. & Associates 2. Coastal Hydraulic Laboratory, U.S. Army
Refined Source Terms in WAVEWATCH III with Wave Breaking and Sea Spray Forecasts
 DISTRIBUTION STATEMENT A. Approved for public release; distribution is unlimited. Refined Source Terms in WAVEWATCH III with Wave Breaking and Sea Spray Forecasts Michael L. Banner School of Mathematics
ENVISAT WIND AND WAVE PRODUCTS: MONITORING, VALIDATION AND ASSIMILATION
 ENVISAT WIND AND WAVE PRODUCTS: MONITORING, VALIDATION AND ASSIMILATION Peter A.E.M. Janssen (), Saleh Abdalla (), Jean-Raymond Bidlot (3) European Centre for Medium-Range Weather Forecasts, Shinfield
A US NOPP project to stimulate wave research
 A US NOPP project to stimulate wave research Focus on operations and deep water Hendrik L. Tolman Chief, Marine Modeling and Analysis Branch NOAA / NWS / NCEP / EMC Hendrik.Tolman@NOAA.gov Tolman, 6/25/2012
Coastal Wave Studies FY13 Summary Report
 DISTRIBUTION STATEMENT A. Approved for public release; distribution is unlimited. Coastal Wave Studies FY13 Summary Report Jeffrey L. Hanson US Army Corps of Engineers, Field Research Facility 1261 Duck
Development of SAR-Derived Ocean Surface Winds at NOAA/NESDIS
 Development of SAR-Derived Ocean Surface Winds at NOAA/NESDIS Pablo Clemente-Colón, William G. Pichel, NOAA/NESDIS Frank M. Monaldo, Donald R. Thompson The Johns Hopkins University Applied Physics Laboratory
On the assimilation of SAR wave spectra of S-1A in the wave model MFWAM
 On the assimilation of SAR wave spectra of S-1A in the wave model MFWAM Lotfi Aouf and Alice Dalphinet Météo-France, Département Marine et Océanographie,Toulouse 14 th wave forecasting and hindcasting,
High-Resolution Measurement-Based Phase-Resolved Prediction of Ocean Wavefields
 DISTRIBUTION STATEMENT A. Approved for public release; distribution is unlimited. High-Resolution Measurement-Based Phase-Resolved Prediction of Ocean Wavefields Dick K.P. Yue Center for Ocean Engineering
THE QUALITY OF THE ASCAT 12.5 KM WIND PRODUCT
 THE QUALITY OF THE ASCAT 12.5 KM WIND PRODUCT Jur Vogelzang, Ad Stoffelen, Maria Belmonte, Anton Verhoef, and Jeroen Verspeek Royal Netherlands Meteorological Institute, Wilhelminalaan 10, 3732 GK, De
Ocean Wave Forecasting at ECMWF
 Ocean Wave Forecasting at ECMWF Jean-Raymond Bidlot Marine Aspects Section Predictability Division of the Research Department European Centre for Medium-range Weather Forecasts (E.C.M.W.F.) Reading, UK
University of the Rykyus International Graduate Program For Asia Pasific Region Report of International Research
 University of the Rykyus International Graduate Program For Asia Pasific Region Report of International Research Researcher Information Arik Wijayanti 2 nd Years of Master Program, Departemen of Civil
Evaluation of Unstructured WAVEWATCH III for Nearshore Application
 Evaluation of Unstructured WAVEWATCH III for Nearshore Application Jane McKee Smith, Tyler Hesser, Mary Anderson Bryant USACE Research and Development Center, Coastal and Hydraulics Lab Aron Roland BGS
On the use of a high resolution wind forcing in the operational coastal wave model WW3
 On the use of a high resolution wind forcing in the operational coastal wave model WW3 Alice Dalphinet (1), Lotfi Aouf (1), Christophe Bataille (1) and Héloïse Michaud (2) (1) Météo-France, Division Marine
A GENERALIZED WAVE-RAY APPROACH FOR PROPAGATION ON A SPHERE AND ITS APPLICATION TO SWELL PREDICTION
 A GENERALIZED WAVE-RAY APPROACH FOR PROPAGATION ON A SPHERE AND ITS APPLICATION TO SWELL PREDICTION D. Scott 1, D. Resio 2, D. Williamson 1 1. Baird & Associates, Suite 5, 1145 Hunt Club Road, Ottawa,
Swell (wind) fields obtained from Satellite Observation CLS Christian Ortega - Mission blue Journées Annuelles des Hydrocarbures 2013
 fields obtained from Satellite Observation CLS Christian Ortega - Mission blue Journées Annuelles des Hydrocarbures 2013") Swell (wind) fields obtained from Satellite Observation CLS Christian Ortega - cortega@cls.fr Mission blue Journées Annuelles des Hydrocarbures 2013 Purpose Develop new methodologies to obtain swell (wind)
Swell (wind) fields obtained from Satellite Observation CLS Christian Ortega - cortega@cls.fr Mission blue Journées Annuelles des Hydrocarbures 2013 Purpose Develop new methodologies to obtain swell (wind)
Nearshore Wind-Wave Forecasting at the Oregon Coast. Gabriel García, H. Tuba Özkan-Haller, Peter Ruggiero November 16, 2011
 Nearshore Wind-Wave Forecasting at the Oregon Coast Gabriel García, H. Tuba Özkan-Haller, Peter Ruggiero November 16, 2011 What is Wave Forecasting? An attempt to predict how the ocean surface is going
Extreme waves in the ECMWF operational wave forecasting system. Jean-Raymond Bidlot Peter Janssen Saleh Abdalla
 Extreme waves in the ECMWF operational wave forecasting system Jean-Raymond Bidlot Peter Janssen Saleh Abdalla European Centre for Medium range Weather Forecasts Shinfield Park, RG 9AX, Reading, United
Synthetic Aperture Radar imaging of Polar Lows
 Oslo Polar Low workshop 21-22 May 2012 Extended abstract Synthetic Aperture Radar imaging of Polar Lows Birgitte Furevik, Gunnar Noer and Johannes Röhrs met.no Forecasting polar lows is to a large degree
CHAPTER 6 DISCUSSION ON WAVE PREDICTION METHODS
 CHAPTER 6 DISCUSSION ON WAVE PREDICTION METHODS A critical evaluation of the three wave prediction methods examined in this thesis is presented in this Chapter. The significant wave parameters, Hand T,
Wave Energy Atlas in Vietnam
 Wave Energy Atlas in Vietnam Nguyen Manh Hung, Duong Cong Dien 1 1 Institute of Mechanics, 264 Doi Can Str. Hanoi, Vietnam nmhungim@gmail.com; duongdienim@gmail.com Abstract Vietnam has achieved remarkable
ABNORMALLY HIGH STORM WAVES OBSERVED ON THE EAST COAST OF KOREA
 ABNORMALLY HIGH STORM WAVES OBSERVED ON THE EAST COAST OF KOREA WEON MU JEONG 1 ; SANG-HO OH ; DONGYOUNG LEE 3 ; KYUNG-HO RYU 1 Coastal Engineering Research Department, Korea Ocean Research and Development
WaMoS II Wave Monitoring System
 WaMoS II Wave Monitoring System - An application of WaMoS II at Duck - Katrin Hessner, K. Reichert, J. Dannenberg OceanWaveS GmbH, Germany Kent Hathaway, Don Resio Engineering Research Development Center
Sentinel-1A Ocean Level-2 Products Validation Strategy
 Sentinel-1A Ocean Level-2 Products Validation Strategy Sentinel-1 Mission Performance Centre ESL L2 Team and Ocean Data Lab G.Hajduch (1), A.Mouche (2), P.Vincent (1), R.Husson (1), H.Johnsen (3), F.Collard
JCOMM Technical Workshop on Wave Measurements from Buoys
 JCOMM Technical Workshop on Wave Measurements from Buoys Val Swail Chair, JCOMM Expert Team on Wind Waves and Storm Surges Neville Smith Vincent Cardone Peter Janssen Gerbrand Komen Peter Taylor WIND WAVES
Wave forecasting at ECMWF
 Wave forecasting at ECMWF Peter Janssen, ECMWF 1. . Freak Waves. INTRODUCTION I will briefly discuss progress in ocean wave forecasting at ECMWF during the past years or so, by
Beach Wizard: Development of an Operational Nowcast, Short-Term Forecast System for Nearshore Hydrodynamics and Bathymetric Evolution
 Beach Wizard: Development of an Operational Nowcast, Short-Term Forecast System for Nearshore Hydrodynamics and Bathymetric Evolution Ad Reniers Civil Engineering and Geosciences, Delft University of Technology
Observation of swell dissipation across oceans
 GEOPHYSICAL RESEARCH LETTERS, VOL.???, XXXX, DOI:0.09/, Observation of swell dissipation across oceans Fabrice Ardhuin Service Hydrographique et Océanographique de la Marine, Brest, France Bertrand Chapron
Surface Wave Dynamics in the Coastal Zone
 DISTRIBUTION STATEMENT A. Approved for public release; distribution is unlimited. Surface Wave Dynamics in the Coastal Zone Gerbrant Ph. van Vledder Department of Civil engineering and Geosciences, Delft
PUV Wave Directional Spectra How PUV Wave Analysis Works
 PUV Wave Directional Spectra How PUV Wave Analysis Works Introduction The PUV method works by comparing velocity and pressure time series. Figure 1 shows that pressure and velocity (in the direction of
WAVE FORECASTING FOR OFFSHORE WIND FARMS
 9 th International Workshop on Wave Hindcasting and Forecasting, Victoria, B.C. Canada, September 24-29, 2006 WAVE FORECASTING FOR OFFSHORE WIND FARMS Morten Rugbjerg, Ole René Sørensen and Vagner Jacobsen
Air-Sea Interaction Spar Buoy Systems
 DISTRIBUTION STATEMENT A: Distribution approved for public release; distribution is unlimited Air-Sea Interaction Spar Buoy Systems Hans C. Graber CSTARS - University of Miami 11811 SW 168 th Street, Miami,
EFFECTS OF WAVE, TIDAL CURRENT AND OCEAN CURRENT COEXISTENCE ON THE WAVE AND CURRENT PREDICTIONS IN THE TSUGARU STRAIT
 EFFECTS OF WAVE, TIDAL CURRENT AND OCEAN CURRENT COEXISTENCE ON THE WAVE AND CURRENT PREDICTIONS IN THE TSUGARU STRAIT Ayumi Saruwatari 1, Yoshihiro Yoneko 2 and Yu Tajima 3 The Tsugaru Strait between
HIGH RESOLUTION WIND AND WAVE MEASUREMENTS FROM TerraSAR-X IN COMPARISON TO MARINE FORECAST
 SAR Maritime Applications German Aerospace Center (DLR) Remote Sensing Technology Institute Maritime Security Lab HIGH RESOLUTION WIND AND WAVE MEASUREMENTS FROM TerraSAR-X IN COMPARISON TO MARINE FORECAST
Metocean criteria for fatigue assessment. Rafael V. Schiller 5th COPEDI Seminar, Oct 8th 2014.
 Metocean criteria for fatigue assessment Rafael V. Schiller 5th COPEDI Seminar, Oct 8th 2014. Metocean requirements along the lifecycle of a project Metocean criteria for fatigue Analysis techniques and
7 th International Conference on Wind Turbine Noise Rotterdam 2 nd to 5 th May 2017
 7 th International Conference on Wind Turbine Noise Rotterdam 2 nd to 5 th May 2017 Sound power level measurements 3.0 ir. L.M. Eilders, Peutz bv: l.eilders@peutz.nl ing. E.H.A. de Beer, Peutz bv: e.debeer@peutz.nl
OPERATIONAL AMV PRODUCTS DERIVED WITH METEOSAT-6 RAPID SCAN DATA. Arthur de Smet. EUMETSAT, Am Kavalleriesand 31, D Darmstadt, Germany ABSTRACT
 OPERATIONAL AMV PRODUCTS DERIVED WITH METEOSAT-6 RAPID SCAN DATA Arthur de Smet EUMETSAT, Am Kavalleriesand 31, D-64295 Darmstadt, Germany ABSTRACT EUMETSAT started its Rapid Scanning Service on September
Wave Climate from Spectra and its Connections with
 Wave Climate from Spectra and its Connections with Local and Remote Wind Climate Haoyu Jiang 1,2,3, Lin Mu 1,3* 1 College of Marine Science and Technology, China University of Geosciences, Wuhan, China
Modelling of Extreme Waves Related to Stability Research
 Modelling of Extreme Waves Related to Stability Research Janou Hennig 1 and Frans van Walree 1 1. Maritime Research Institute Netherlands,(MARIN), Wageningen, the Netherlands Abstract: The paper deals
Sea State Analysis. Topics. Module 7 Sea State Analysis 2/22/2016. CE A676 Coastal Engineering Orson P. Smith, PE, Ph.D.
 Sea State Analysis Module 7 Orson P. Smith, PE, Ph.D. Professor Emeritus Module 7 Sea State Analysis Topics Wave height distribution Wave energy spectra Wind wave generation Directional spectra Hindcasting
ERS WAVE MISSION REPROCESSING- QC SUPPORT ENVISAT MISSION EXTENSION SUPPORT
 REPORT 8/2011 ISBN 978-82-7492-248-8 ISSN 1890-5218 ERS WAVE MISSION REPROCESSING- QC SUPPORT ENVISAT MISSION EXTENSION SUPPORT - Annual Report 2010 Author (s): Harald Johnsen (Norut), Fabrice Collard
WAVE CLIMATE IN DEEP AND COASTAL WATERS: NUMERICAL MODELS
 WAVE CLIMATE IN DEEP AND COASTAL WATERS: NUMERICAL MODELS BENTOS Servicios y Equipos Marinos Ltda. Avda. Suecia 3005, Ñuñoa, Santiago Telephone: (56 2) 296 373 60 Fax: (56 2) 296 373 77 E-mail: info@bentos.cl
Naval Postgraduate School, Operational Oceanography and Meteorology. Since inputs from UDAS are continuously used in projects at the Naval
 How Accurate are UDAS True Winds? Charles L Williams, LT USN September 5, 2006 Naval Postgraduate School, Operational Oceanography and Meteorology Abstract Since inputs from UDAS are continuously used
Implementation of the new French operational coastal wave forecasting system and application to a wavecurrent interaction study
 14 th International Workshop on Wave Hindcasting and Forecasting Implementation of the new French operational coastal wave forecasting system and application to a wavecurrent interaction study H. Michaud
Refined Source Terms in WAVEWATCH III with Wave Breaking and Sea Spray Forecasts
 Refined Source Terms in WAVEWATCH III with Wave Breaking and Sea Spray Forecasts Michael L. Banner School of Mathematics and Statistics, The University of New South Wales, Sydney 1466, Australia Tel :
Surface Wave Parameters Retrieval in Coastal Seas from Spaceborne SAR Image Mode Data
 PIERS ONLINE, VOL. 4, NO. 4, 28 445 Surface Wave Parameters Retrieval in Coastal Seas from Spaceborne SAR Image Mode Data Jian Sun 1,2 and Hiroshi Kawamura 1 1 Graduate School of Science, Tohoku University,
Wind Direction Analysis over the Ocean using SAR Imagery
 Journal of Information & Computational Science 5: 1 (2008) 223-231 Available at http: www.joics.com Wind Direction Analysis over the Ocean using SAR Imagery Kaiguo Fan a,b,, Weigen Huang a, Mingxia He
A study of advection of short wind waves by long waves from surface slope images
 A study of advection of short wind waves by long waves from surface slope images X. Zhang, J. Klinke, and B. Jähne SIO, UCSD, CA 993-02, USA Abstract Spatial and temporal measurements of short wind waves
CHANGE OF THE BRIGHTNESS TEMPERATURE IN THE MICROWAVE REGION DUE TO THE RELATIVE WIND DIRECTION
 JP4.12 CHANGE OF THE BRIGHTNESS TEMPERATURE IN THE MICROWAVE REGION DUE TO THE RELATIVE WIND DIRECTION Masanori Konda* Department of Geophysics, Graduate School of Science, Kyoto University, Japan Akira
The role of large-scale modes of climate variability on the Cape Point wave record
 GODAE OceanView 5th COSS-TT meeting, Cape Town 2017 The role of large-scale modes of climate variability on the Cape Point wave record Jennifer Veitch1, Andrew Birkett2, Juliet Hermes1, Christo Rautenbach,
SEA SURFACE TEMPERATURE RETRIEVAL USING TRMM MICROWAVE IMAGER SATELLITE DATA IN THE SOUTH CHINA SEA
 SEA SURFACE TEMPERATURE RETRIEVAL USING TRMM MICROWAVE IMAGER SATELLITE DATA IN THE SOUTH CHINA SEA Mohd Ibrahim Seeni Mohd and Mohd Nadzri Md. Reba Faculty of Geoinformation Science and Engineering Universiti
Global Ocean Internal Wave Database
 Global Ocean Internal Wave Database Victor Klemas Graduate College of Marine Studies University of Delaware Newark, DE 19716 phone: (302) 831-8256 fax: (302) 831-6838 email: klemas@udel.edu Quanan Zheng
WAVE PERIOD FORECASTING AND HINDCASTING INVESTIGATIONS FOR THE IMPROVEMENT OF
 WAVE PERIOD FORECASTING AND HINDCASTING INVESTIGATIONS FOR THE IMPROVEMENT OF NUMERICAL MODELS Christian Schlamkow and Peter Fröhle University of Rostock/Coastal Engineering Group, Rostock Abstract: This
Local-to-Global Algorithms in Biology: Drosophila and Beyond (maybe...)
") Local-to-Global Algorithms in Biology: Drosophila and Beyond (maybe...) MIT Synthetic Biology Working Group Dan Yamins 27.2.5 spatial multi-agent systems a space with agents embedded in the space local
Local-to-Global Algorithms in Biology: Drosophila and Beyond (maybe...) MIT Synthetic Biology Working Group Dan Yamins 27.2.5 spatial multi-agent systems a space with agents embedded in the space local
THE WAVE CLIMATE IN THE BELGIAN COASTAL ZONE
 THE WAVE CLIMATE IN THE BELGIAN COASTAL ZONE Toon Verwaest, Flanders Hydraulics Research, toon.verwaest@mow.vlaanderen.be Sarah Doorme, IMDC, sarah.doorme@imdc.be Kristof Verelst, Flanders Hydraulics Research,
Vika Grigorieva and Sergey Gulev. Sea Atmosphere Interaction And Climate Laboratory P. P. Shirshov Institute of Oceanology, Russia
 Global Ocean Wave Statistics from VOS: a new dataset and associated Atlas Vika Grigorieva and Sergey Gulev Sea Atmosphere Interaction And Climate Laboratory P. P. Shirshov Institute of Oceanology, Russia
DUXBURY WAVE MODELING STUDY
 DUXBURY WAVE MODELING STUDY 2008 Status Report Duncan M. FitzGerald Peter S. Rosen Boston University Northeaster University Boston, MA 02215 Boston, MA 02115 Submitted to: DUXBURY BEACH RESERVATION November
PRELIMINARY STUDY ON DEVELOPING AN L-BAND WIND RETRIEVAL MODEL FUNCTION USING ALOS/PALSAR
 PRELIMINARY STUDY ON DEVELOPING AN L-BAND WIND RETRIEVAL MODEL FUNCTION USING ALOS/PALSAR Osamu Isoguchi, Masanobu Shimada Earth Observation Research Center, Japan Aerospace Exploration Agency (JAXA) 2-1-1
STUDY ON TSUNAMI PROPAGATION INTO RIVERS
 ABSTRACT STUDY ON TSUNAMI PROPAGATION INTO RIVERS Min Roh 1, Xuan Tinh Nguyen 2, Hitoshi Tanaka 3 When tsunami wave propagation from the narrow river mouth, water surface is raised and fluctuated by long
On the use of a high resolution wind forcing in the operational coastal wave model WW3
 On the use of a high resolution wind forcing in the operational coastal wave model WW3 A. Dalphinet (1), L. Aouf (1), C. Bataille (1), H. Michaud (2) (1) Météo-France (2) SHOM Île de Sein (Brittany) 05/02/2014
ON THE USE OF DOPPLER SHIFT FOR SAR WIND RETRIEVAL
 ON THE USE OF DOPPLER SHIFT FOR SAR WIND RETRIEVAL K-F. Dagestad 1, A. Mouche 2, F. Collard 2, M. W. Hansen 1 and J. Johannessen 1 (1) Nansen Environmental and Remote Censing Center, Thormohlens gt 47,
RapidScat wind validation report
 Ocean and Sea Ice SAF Technical Note SAF/OSI/CDOP2/KNMI/TEC/RP/228 25 and 50 km wind products (OSI-109) Anton Verhoef, Jur Vogelzang and Ad Stoffelen KNMI Version 1.1 March 2015 DOCUMENTATION CHANGE RECORD
Chapter 11 Waves. Waves transport energy without transporting matter. The intensity is the average power per unit area. It is measured in W/m 2.
 Energy can be transported by particles or waves: Chapter 11 Waves A wave is characterized as some sort of disturbance that travels away from a source. The key difference between particles and waves is
Recent developments in wave modelling with the Two-Scale WAVEWATCH-III
 Recent developments in wave modelling with the Two-Scale Approximation implemented in WAVEWATCH-III Will Perrie 1, Bash Toulany 1, Don Resio 2, Chuck Long 3, Jean-Pierre Auclair 4 1. BIO, 2. UNF, 3. USACE,
COnstraining ORographic Drag Effects (COORDE)
") COnstraining ORographic Drag Effects (COORDE) A GASS/WGNE Modeling Intercomparison Project Annelize van Niekerk and Irina Sandu Contents 1 Introduction....................................................
COnstraining ORographic Drag Effects (COORDE) A GASS/WGNE Modeling Intercomparison Project Annelize van Niekerk and Irina Sandu Contents 1 Introduction....................................................
PARAMETRIZATION OF WAVE TRANSFORMATION ABOVE SUBMERGED BAR BASED ON PHYSICAL AND NUMERICAL TESTS
 Proceedings of the 6 th International Conference on the Application of Physical Modelling in Coastal and Port Engineering and Science (Coastlab16) Ottawa, Canada, May 10-13, 2016 Copyright : Creative Commons
Preliminary assessment of the variability of UK offshore wind speed as a function of distance to the coast
 Journal of Physics: Conference Series PAPER OPEN ACCESS Preliminary assessment of the variability of UK offshore wind speed as a function of distance to the coast To cite this article: Rolando Soler-Bientz
Wave-Current Interaction in Coastal Inlets and River Mouths
 DISTRIBUTION STATEMENT A. Approved for public release; distribution is unlimited. Wave-Current Interaction in Coastal Inlets and River Mouths Tim T. Janssen Department of Geosciences, San Francisco State
SUPERGEN Wind Wind Energy Technology Rogue Waves and their effects on Offshore Wind Foundations
 SUPERGEN Wind Wind Energy Technology Rogue Waves and their effects on Offshore Wind Foundations Jamie Luxmoore PhD student, Lancaster University SUPERGEN Wind II - 7 th training seminar 3 rd - 4 th September
Temperature, salinity, density, and the oceanic pressure field
 Chapter 2 Temperature, salinity, density, and the oceanic pressure field The ratios of the many components which make up the salt in the ocean are remarkably constant, and salinity, the total salt content
Currents measurements in the coast of Montevideo, Uruguay
 Currents measurements in the coast of Montevideo, Uruguay M. Fossati, D. Bellón, E. Lorenzo & I. Piedra-Cueva Fluid Mechanics and Environmental Engineering Institute (IMFIA), School of Engineering, Research
DEPARTMENT OF THE NAVY DIVISION NEWPORT OFFICE OF COUNSEL PHONE: FAX: DSN:
 IMAVSBA WARFARE CENTERS NEWPORT DEPARTMENT OF THE NAVY NAVAL UNDERSEA WARFARE CENTER DIVISION NEWPORT OFFICE OF COUNSEL PHONE: 401 832-3653 FAX: 401 832-4432 DSN: 432-3653 Attorney Docket No. 85031 Date:
PROC. ITB Eng. Science Vol. 36 B, No. 2, 2004,
 PROC. ITB Eng. Science Vol. 36 B, No. 2, 2004, 133-139 133 Semiannual Kelvin Waves Propagation along the South Coast of Sumatra-Jawa-Bali and the Lesser Sunda Islands Observed by TOPEX/POSEIDON and ERS-1/2
Wave Transformation and Setup from a Cross-shore Array of Acoustic Doppler Profilers (Poster)
") Wave Transformation and Setup from a Cross-shore Array of Acoustic Doppler Profilers (Poster) Kent K. Hathaway and Jeffrey L. Hanson Introduction US Army Corps of Engineers Field Research Facility, Kitty
Wave Transformation and Setup from a Cross-shore Array of Acoustic Doppler Profilers (Poster) Kent K. Hathaway and Jeffrey L. Hanson Introduction US Army Corps of Engineers Field Research Facility, Kitty
Wind Sea and Swell Separation of 1D Wave Spectrum by a Spectrum Integration Method*
 116 J O U R N A L O F A T M O S P H E R I C A N D O C E A N I C T E C H N O L O G Y VOLUME 29 Wind Sea and Swell Separation of 1D Wave Spectrum by a Spectrum Integration Method* PAUL A. HWANG Remote Sensing
Numerical wave modeling and wave energy estimation
 Numerical wave modeling and wave energy estimation Galanis G. 1,2*, Zodiatis G. 2, Hayes D. 2, Nikolaidis A. 2, Georgiou G. 2, Stylianou S. 2, Kallos G. 1, Kalogeri C. 1, Chu P.C. 3, Charalambous A. 4,
Recent Changes in Wind Chill Temperatures at High Latitudes in North America
 University of Massachusetts Amherst From the SelectedWorks of Raymond S Bradley 2001 Recent Changes in Wind Chill Temperatures at High Latitudes in North America H. F Keimig Raymond S Bradley, University
Development and Implementation of a Relocatable Coastal and Nearshore Modeling System
 Development and Implementation of a Relocatable Coastal and Nearshore Modeling System James M. Kaihatu Zachry Department of Civil Engineering, Texas A&M University 3136 TAMU College Station, TX 77843-3136
10.6 The Dynamics of Drainage Flows Developed on a Low Angle Slope in a Large Valley Sharon Zhong 1 and C. David Whiteman 2
 10.6 The Dynamics of Drainage Flows Developed on a Low Angle Slope in a Large Valley Sharon Zhong 1 and C. David Whiteman 2 1Department of Geosciences, University of Houston, Houston, TX 2Pacific Northwest
Buoy data assimilation to improve wave height assessment in Bay of Bengal during monsoon seasons
 Indian Journal of Geo Marine Sciences Vol. 46 (06), June 2017, pp. 1083-1090 Buoy data assimilation to improve wave height assessment in Bay of Bengal during monsoon seasons Kalyani M 1, *, Latha G 1,
J4.2 AUTOMATED DETECTION OF GAP WIND AND OCEAN UPWELLING EVENTS IN CENTRAL AMERICAN GULF REGIONS
 J4.2 AUTOMATED DETECTION OF GAP WIND AND OCEAN UPWELLING EVENTS IN CENTRAL AMERICAN GULF REGIONS Xiang Li*, University of Alabama in Huntsville Huntsville, AL D. K. Smith Remote Sensing Systems Santa Rosa,
Application of Simulating WAves Nearshore (SWAN) model for wave simulation in Gulf of Thailand
 model for wave simulation in Gulf of Thailand") pplication of Simulating Wves Nearshore (SWN) model for wave simulation in Gulf of Thailand Wongnarin Kompor 1, Hitoshi Tanaka 2 Chaiwat Ekkawatpanit 3, and Duangrudee Kositgittiwong 4 bstract Evaluation
pplication of Simulating Wves Nearshore (SWN) model for wave simulation in Gulf of Thailand Wongnarin Kompor 1, Hitoshi Tanaka 2 Chaiwat Ekkawatpanit 3, and Duangrudee Kositgittiwong 4 bstract Evaluation
Ocean Wave Parameters Retrieval from TerraSAR-X Images Validated against Buoy Measurements and Model Results
 Remote Sens. 2015, 7, 12815-12828; doi:10.3390/rs71012815 Article OPEN ACCESS remote sensing ISSN 2072-4292 www.mdpi.com/journal/remotesensing Ocean Wave Parameters Retrieval from TerraSAR-X Images Validated
NUMERICAL STUDY OF WIND-GENERATED WAVES IN THE RED SEA
 NUMERICAL STUDY OF WIND-GENERATED WAVES IN THE RED SEA NATACHA FERY (1), GERD BRUSS (2), ABDULLAH AL-SUBHI (3) & ROBERTO MAYERLE (4) (1) Research and Technology Centre, Christian Albrechts University,
Waves, Turbulence and Boundary Layers
 Waves, Turbulence and Boundary Layers George L. Mellor Program in Atmospheric and Oceanic Sciences Princeton University Princeton NJ 8544-71 phone: (69) 258-657 fax: (69) 258-285 email: glm@splash.princeton.edu
Using Satellite Spectral Wave Data for Wave Energy Resource Characterization
 Using Satellite Spectral Wave Data for Wave Energy Resource Characterization M. T. ontes 1,2, M. Bruck 3, S. Lehener 3, A. Kabuth 1,4 1 LNEG Estrada do aço do Lumiar 1649-038 Lisboa, ortugal teresa.pontes@lneg.pt
MIKE 21 Toolbox. Global Tide Model Tidal prediction
 MIKE 21 Toolbox Global Tide Model Tidal prediction MIKE Powered by DHI 2017 DHI headquarters Agern Allé 5 DK-2970 Hørsholm Denmark +45 4516 9200 Telephone +45 4516 9333 Support +45 4516 9292 Telefax mike@dhigroup.com
Proceedings of the ASME nd International Conference on Ocean, Offshore and Arctic Engineering OMAE2013 June 9-14, 2013, Nantes, France
 Proceedings of the ASME 3 3nd International Conference on Ocean, Offshore and Arctic Engineering OMAE3 June 9-, 3, Nantes, France OMAE3- SWELL GENESIS, MODELLING AND MEASUREMENTS IN WEST AFRICA Marc Prevosto
Subsurface Ocean Indices for Central-Pacific and Eastern-Pacific Types of ENSO
 Subsurface Ocean Indices for Central-Pacific and Eastern-Pacific Types of ENSO Jin-Yi Yu 1*, Hsun-Ying Kao 1, and Tong Lee 2 1. Department of Earth System Science, University of California, Irvine, Irvine,
Shot-by-shot directional source deghosting and directional designature using near-gun measurements
 H1-1-3 Shot-by-shot directional source deghosting and directional designature using near-gun measurements Neil Hargreaves, Rob Telling, Sergio Grion Dolphin Geophysical, London, UK Introduction In this
Climatology of the 10-m wind along the west coast of South American from 30 years of high-resolution reanalysis
 Climatology of the 10-m wind along the west coast of South American from 30 years of high-resolution reanalysis David A. Rahn and René D. Garreaud Departamento de Geofísica, Facultad de Ciencias Físicas
13. TIDES Tidal waters
 Water levels vary in tidal and non-tidal waters: sailors should be aware that the depths shown on the charts do not always represent the actual amount of water under the boat. 13.1 Tidal waters In tidal
Determination Of Nearshore Wave Conditions And Bathymetry From X-Band Radar Systems
 Determination Of Nearshore Wave Conditions And Bathymetry From X-Band Radar Systems Okey G. Nwogu Dept. of Naval Architecture and Marine Engineering University of Michigan Ann Arbor, MI 489 phone: (734)
An Investigation of the Influence of Waves on Sediment Processes in Skagit Bay
 DISTRIBUTION STATEMENT A. Approved for public release; distribution is unlimited. An Investigation of the Influence of Waves on Sediment Processes in Skagit Bay Geoffrey W. Cowles School for Marine Science
6.28 PREDICTION OF FOG EPISODES AT THE AIRPORT OF MADRID- BARAJAS USING DIFFERENT MODELING APPROACHES
 6.28 PREDICTION OF FOG EPISODES AT THE AIRPORT OF MADRID- BARAJAS USING DIFFERENT MODELING APPROACHES Cecilia Soriano 1, Darío Cano 2, Enric Terradellas 3 and Bill Physick 4 1 Universitat Politècnica de
Wave Generation. Chapter Wave Generation
 Chapter 5 Wave Generation 5.1 Wave Generation When a gentle breeze blows over water, the turbulent eddies in the wind field will periodically touch down on the water, causing local disturbances of the