Litter Strategy Monitoring Wave 55 November 2011 Report
|
|
|
- Alexina Elliott
- 5 years ago
- Views:
Transcription


1 Strategies, Marketing and Social Research Head Office: 259 Glen Osmond Rd, Frewville SA 5063 Tel: Fax: Litter Strategy Monitoring Wave 55 November 2011 Report Prepared for: John Phillips On behalf of: KESAB Environmental Solutions Project No: 7239 Date: November 2011
2 Contents Section 1 Introduction... 1 Background... 2 Section 2 Wave 55 Executive Summary... 5 Items Counted... 6 Litter Volume Glass Items Volume Metal Items Volume Plastic Items Volume Paper/ Paperboard Items Volume Miscellaneous Items Volume Cigarette Butts Items Volume Dispersion of Litter by Site Type Items Volume CDL Beverage Containers Data Summary - Items Data Summary - Volumes Appendix 1: Tracking Graphs Unweighted Tracking Graphs - Items Unweighted Tracking Graphs - Volume Weighted Tracking Graphs - Items Weighted Tracking Graphs - Volumes Appendix 2: Data Collection Form For enquiries on this report please contact David O Dea. T:\! FINAL REPORTS 2011\7239 KESAB 2010 Reports\7239 KESAB - Wave 55 - REPORT - November 2011.docx
3 Section 1 Introduction - 1 -
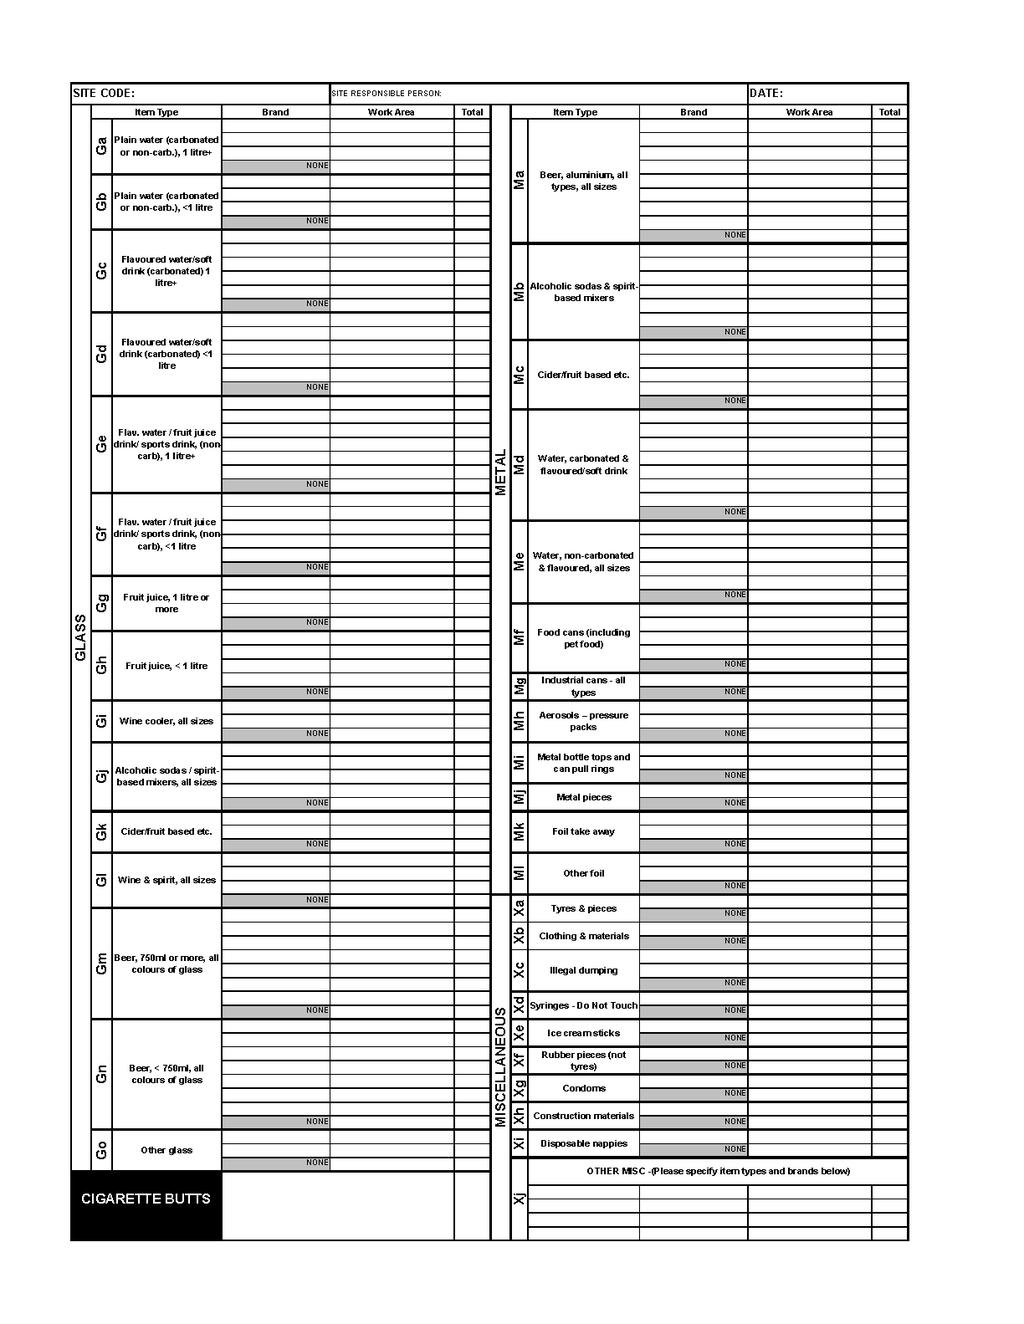
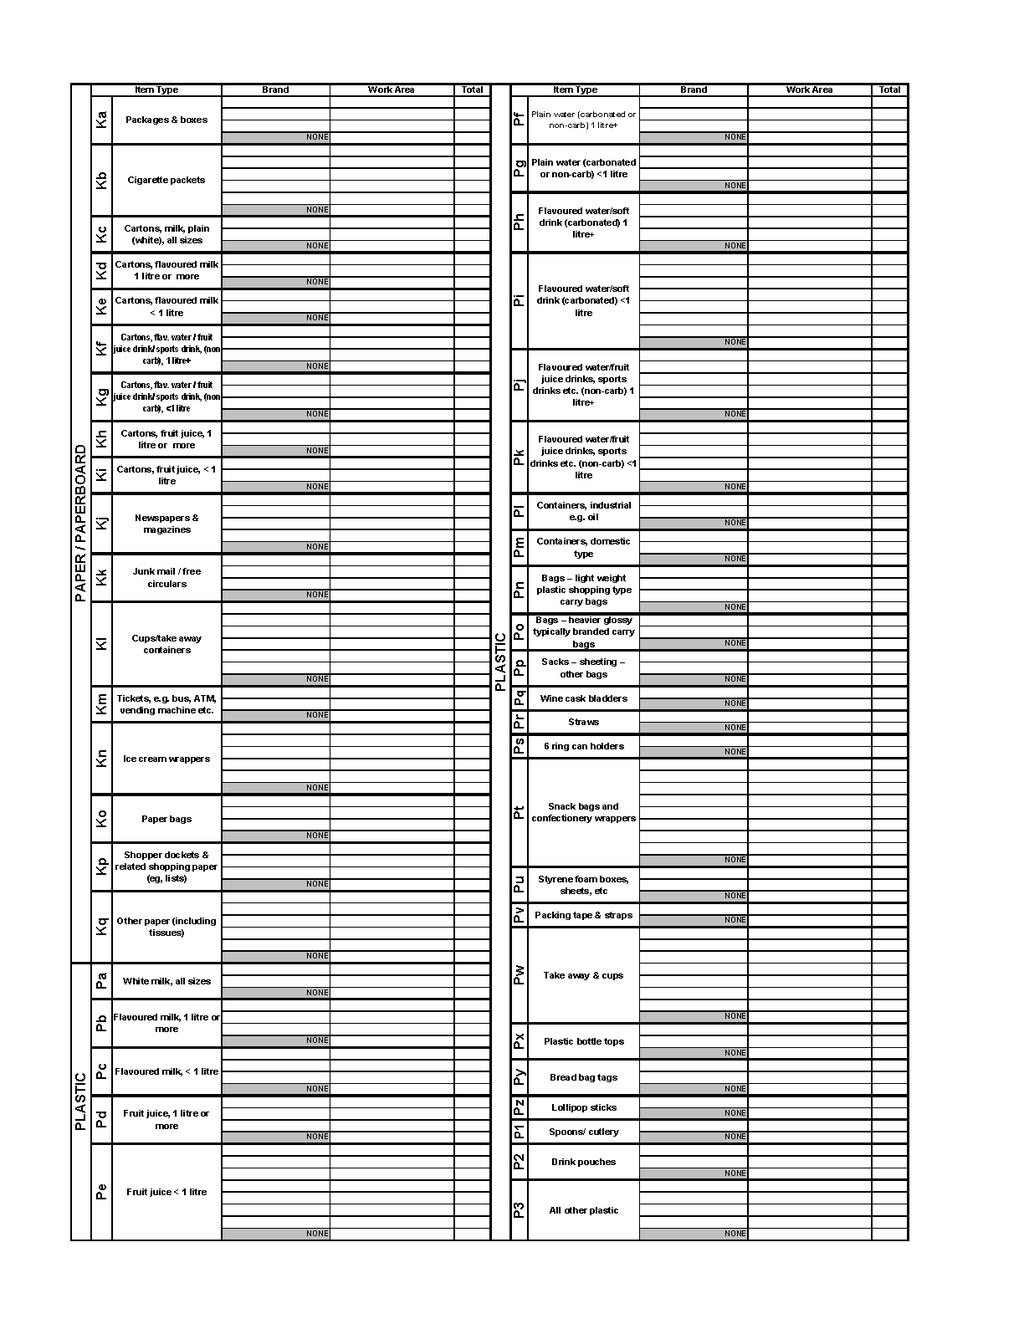
4 1.1 This document has been prepared by McGregor Tan Research to report on Wave 55 of the quarterly KESAB Litter Monitor. Surveys for the current Wave were conducted in South Australia during November Background 1.2 Regular monitoring of the litter stream is necessary in order to maintain a clear picture of its components, such as the various material types that contribute to the litter stream as well as the distribution of litter across different area types. Keep South Australia Beautiful (KESAB) had been monitoring the State's litter stream for many years, but the level of detail required during the South Australian Government s moratorium on changes to Container Deposit Legislation was considerably greater than previously recorded. 1.3 An expanded monitoring program commenced in February 1998, and McGregor Tan Research was commissioned at that time to undertake the actual count and to report regularly on the outcomes. This expanded program was continued throughout 1999, 2000, 2001, 2002, 2003, 2004, 2005, 2006, 2007, 2008, 2009, 2010 and is planned to continue. 1.4 With the exception of August 2002, counts have been conducted quarterly, carried out in February, May, August and November of each year. Throughout the Monitor, care has been taken to maintain the data in a form compatible with KAB's requirements. 1.5 During each Wave of the survey, litter counts are undertaken at 151 sites across South Australia. In conjunction with the national litter count, a review of all South Australian sites showed that 11 of the sites surveyed were disproportionately represented in the data. These original sites were found to be unusual in nature, and were replaced with 11 revised sites. 1.6 The data collection form utilised for the count was jointly developed by McGregor Tan Research and KESAB. A copy of this form is provided in Appendix In January 2003, Container Deposit Legislation (CDL) was extended to cover most beverages under 1 litre, such as juice cartons, fruit boxes, flavoured milk cartons, etc. As a result, a new method of analysing the data had to be adopted so that the changes to the CDL, and the effect on the total litter stream could be evaluated. 1.8 Prior to the August 2004 Litter Count, the data collection form was reevaluated and re-designed to take into account the changes to the CDL and - 2 -
5 also to incorporate new categories for litter items that were previously coded as other or in an inappropriate category. The changes that were made to the data collection form include: Plastic bags were separated into 3 types of litter: o Supermarket type lightweight shopping bags o Heavier glossy, typically branded carry bags o Sacks, sheeting and other bags Bottle and can tops were moved and separated from the Miscellaneous Category into both plastic bottle top and metal bottle and can tops. The following four litter types were also added to the Plastic category: o Bread bag tags o Lollipop sticks o Spoons/ cutlery o Drink pouches The Metal Cans category name was changed to Metal. Foil take away was moved from Miscellaneous to Metal. Cigarette butts were separated from the Miscellaneous Category. Two extra items were added to the Paper/paperboard category: o o Paper bags Shopper dockets & related shopping paper 1.9 In previous waves, the data collection form separated each litter type into CDL and non-cdl categories However, extended Container Deposit Legislation (CDL) has now meant that the litter categories alone (e.g. Flavoured milk, < 1 litre) can be used to establish whether or not beverage containers are covered under CDL or not In order to determine the effectiveness of the current CDL (as of January 2003), and for comparative purposes, it was necessary to re-calculate the number of current CDL items from the waves prior to the extension. References to CDL items in Waves prior to Wave 17 (waves 1-16) therefore denote beverage containers that are currently covered by CDL not the items that were covered by the legislation prior to this time During the Wave 29 Monitor estimates of the volumes for each litter item category were defined. The assignments of volume estimates to each litter item category were based on actual measurements of containers/ items, the condition that these items were most commonly found (which was based on the audits of at least three Waves), and the most common or average size - 3 -
6 of the items that were found within each category The auditors were an important part of the volume formulation process, and these persons were able to record the number, size and type of different items within each category over a number of waves. Volumes ascribed to each item represented the average size for that category across all site types The final volume attributed to each litter item category furthermore took into account the fact that some items were often found crushed and weathered. For example, some drink cans and cartons are often crushed and/ or weathered when they are identified by the auditors and counted. The same volume measurements have been used for all subsequent Waves Two noteworthy events that have taken place since the beginning of this longitudinal study include: The deposit on drink containers was increased from 5 cents to 10 cents in September The ban on thin plastic shopping bags came into effect in May This document reports on Wave 55 of the longitudinal study. The litter count was conducted during November Section 2 of this report outlines the litter characteristics of the 151 sites, which include 11 revised sites (replacing 11 of the original 151). Appendix 1 contains charts tracking results back across all prior Monitors, and includes weighted results to facilitate meaningful comparison of results established at the 151 original sites with results derived from the 151 revised sites
7 Section 2 Wave 55 Executive Summary - 5 -
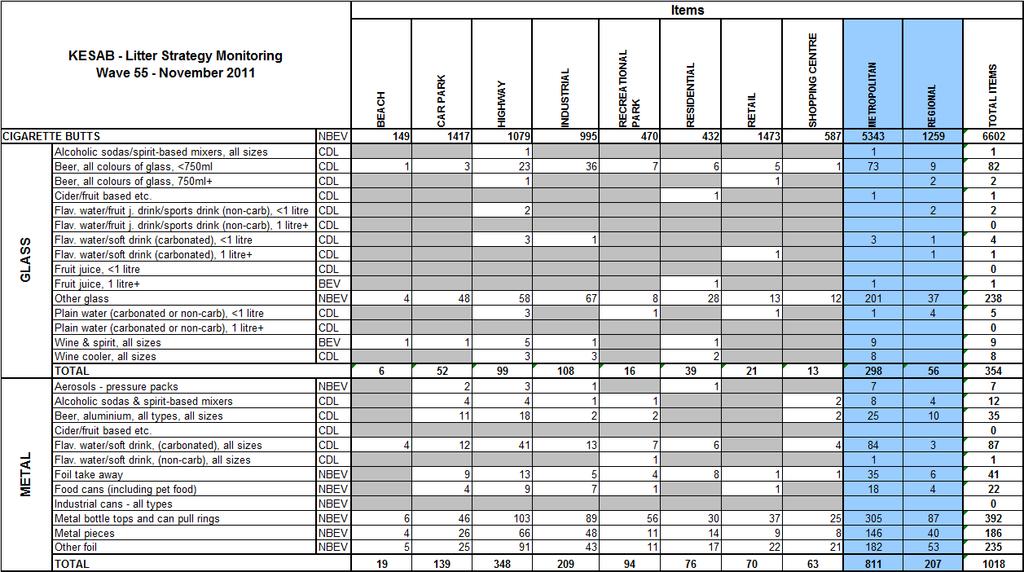
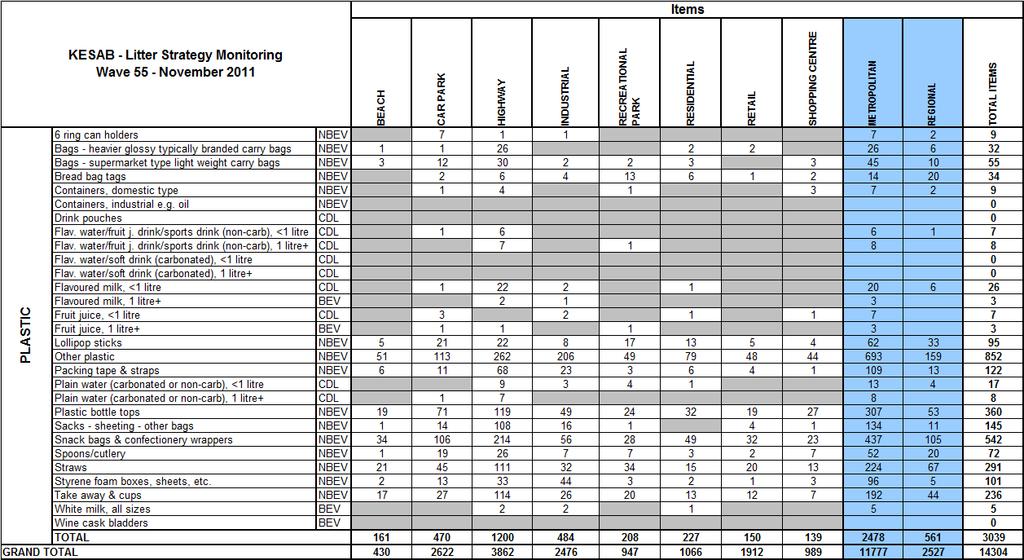
8 The following Executive Summary covers the findings of the November 2011 (Wave 55) KESAB Litter Monitor. Where possible, results have been tracked against those derived from any previous Waves which incorporated revised sites. All 151 sites were counted during the November 2011 count. Items Counted A total of 14,304 litter items were counted across the 151 South Australian sites during Wave 55. These figures are above those from the previous monitors in August (13,115), May 2011 (13,021), February 2011 (14,026) and November 2010 (13,913) from the same time last year. Cigarette butts remained the main contributor (4) to the litter count with 6,602 butts counted in Wave 55, up from Wave 54 (6,156 butts), Wave 53 (5,715 butts), Wave 52 (5,446 butts) and Wave 51 (5,786 butts) counted at the same time last year in November The increase in items counted in Wave 55 is demonstrated most strongly amongst the following litter items: CIGARETTE BUTTS - 6,602 butts, up from 6,156 butts in Wave 54 ( increase) METAL - Metal bottle tops and can pull rings items, up from 269 items in Wave 54 (4 increase) PLASTIC - Plastic bottle tops items, up from 252 items (4 increase) PAPER/PAPERBOARD - Other paper (including tissues) 1,665 items, up from 1,559 items in Wave 54 ( increase) PLASTIC - Snack bags & confectionery wrappers items, up from 437 items in Wave 54 (2 increase) PLASTIC - Sacks - sheeting - other bags items, up from 59 items in Wave 54 (14 increase) GLASS - Other glass items, up from 161 items in Wave 54 (4 increase) PAPER/PAPERBOARD - Packages & boxes items, up from 142 items in Wave 54 (4 increase) PAPER/PAPERBOARD - Cups/take away containers items, up from 144 items in Wave 54 (4 increase) METAL - Flavoured. water/soft drink, (carbonated), all sizes - 87 items, up from 42 items in Wave 54 (10 increase) GLASS - Beer, all colours of glass, <750ml - 82 items, up from 49 items in Wave 54 (6 increase) MISCELLANEOUS - Rubber pieces (not tyres) items, up from 123 items in Wave 54 (20% increase) METAL - Metal pieces items, up from 165 items in Wave 54 (1 increase) - 6 -
9 PLASTIC - Bread bag tags - 34 items, up from 13 items in Wave 54 (16 increase) PLASTIC - Flavoured milk, <1 litre - 26 items, up from 8 items in Wave 54 (22 increase) METAL - Beer, aluminium, all types, all sizes - 35 items, up from 18 items in Wave 54 (9 increase) MISCELLANEOUS - Construction materials items, up from 124 items in Wave 54 (1 increase) MISCELLANEOUS - Clothing & materials items, up from 166 items in Wave 54 ( increase) PLASTIC - Bags - supermarket type light weight carry bags - 55 items, up from 40 items in Wave 54 (3 increase) METAL - Food cans (including pet food) - 22 items, up from 8 items in Wave 54 (17 increase) Conversely, there was a decrease in several litter items, these included: PLASTIC - Other plastic 852 items, down from 981 items in Wave 54 (1 decrease) PLASTIC - Take away & cups items, down from 264 items in Wave 54 ( decrease) METAL - Other foil items, down from 260 items in Wave 54 ( decrease) GLASS - Beer, all colours of glass, 750ml+ - 2 items, down from 23 items in Wave 54 (91% decrease) PLASTIC - Lollipop sticks - 95 items, down from 116 items in Wave 54 (1 decrease) PAPER/PAPERBOARD - Shopper dockets & related shopping paper (e.g. lists) - 97 items, down from 115 items in Wave 54 (1 decrease) METAL - Flavoured water/soft drink, (non-carb), all sizes - 1 items, down from 18 items in Wave 54 (9 decrease) PLASTIC - Straws items, down from 308 items in Wave 54 ( decrease) PLASTIC - Flavoured water/soft drink (carbonated), <1 litre nil items, down from 14 items in Wave 54 (100% decrease) Cigarette butts accounted for the largest proportion of all litter items counted (4, down from 4 in Wave 54, but up from 4 in Wave 53, 3 in Wave 52 and 4 in Wave 51 at the same time in the previous year). Other material types represented the following proportions of the litter items counted: Plastic items (21%, down from 2 in Wave 54) Paper/ paperboard (1, unchanged from Wave 54) - 7 -


10 Metal items (, up from in Wave 54) Miscellaneous items (, unchanged from Wave 54) Glass items (, unchanged from Wave 54) Items as Proportions of Total by Material Type Cigarette Butts, 4 Glass, Metal, Miscellaneous, Plastic, 21% Paper/ paperboard, 1 The top 20 ranking of litter items for November 2011 also included PLASTIC - Sacks - sheeting - other bags not present previously in wave 54. The item that exited the top 20 as a result of the new entrant was PLASTIC Lollipop sticks
11 TOP 20 CATEGORIES - HIGHEST COUNTS CIGARETTE BUTTS PAPER/PAPERBOARD - Other paper (including tissues) PLASTIC - Other plastic PLASTIC - Snack bags & confectionery wrappers METAL - Metal bottle tops and can pull rings PLASTIC - Plastic bottle tops PLASTIC - Straws GLASS - Other glass PLASTIC - Take away & cups METAL - Other foil PAPER/PAPERBOARD - Packages & boxes PAPER/PAPERBOARD - Cups/take away containers METAL - Metal pieces MISCELLANEOUS - Clothing & materials MISCELLANEOUS - Rubber pieces (not tyres) PLASTIC - Sacks - sheeting - other bags PAPER/PAPERBOARD - Cigarette packets MISCELLANEOUS - Construction materials PAPER/PAPERBOARD - Paper bags PLASTIC - Packing tape & straps Items Nov.11 Aug.11 May.11 Feb.11 Nov
, but lower than the estimated litter volume established during the volume recorded at the same time last year in November 2010 (1.333m3).")
. The most significant contributor to volume among miscellaneous items was illegal dumping, this accounted for more than one third (3) of the overall total volume of litter.")
12 Litter Volume The total volume of litter recorded in November 2011 amounted to cubic metres, higher than the estimated litter volume established in the August 2011 Monitor (1.133m3), but lower than the estimated litter volume established during the volume recorded at the same time last year in November 2010 (1.333m3). The largest proportion of litter volume for Wave 55 was contributed by miscellaneous items (4, up from 41% in Wave 54), paper/ paperboard items (2, up from 21% in Wave 54) and plastic items (1, down from 2 in Wave 54). The most significant contributor to volume among miscellaneous items was illegal dumping, this accounted for more than one third (3) of the overall total volume of litter. Other material types represented the following proportions of the total volume of litter items counted: Metal (, up from in Wave 54) Glass (, unchanged Wave 54) Cigarette butts (<1%, unchanged from Wave 54) Litter Volume as a Proportion of Total Volume Cigarette Butts, <1% Glass, Plastic, 1 Metal, Paper/ paperboard, 2 Miscellaneous,
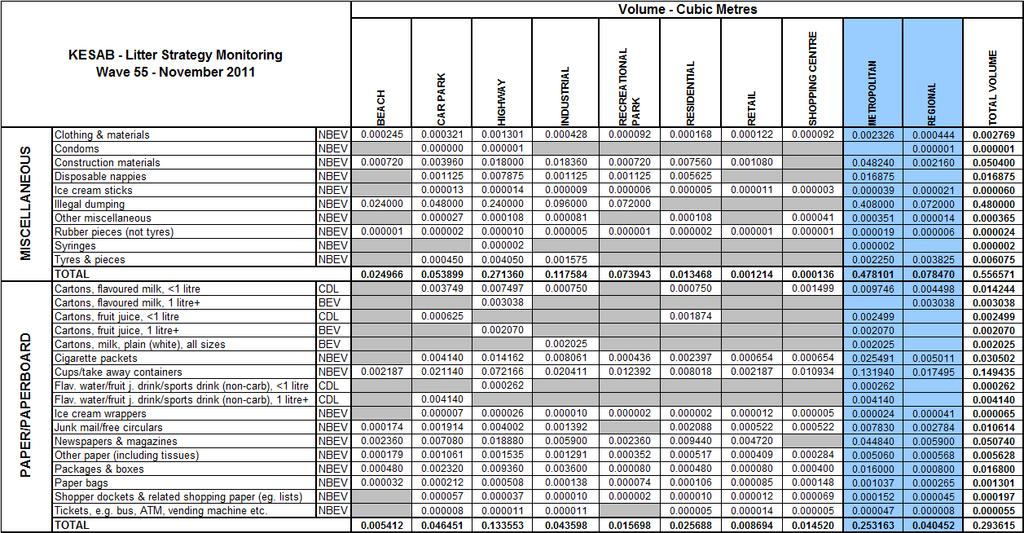
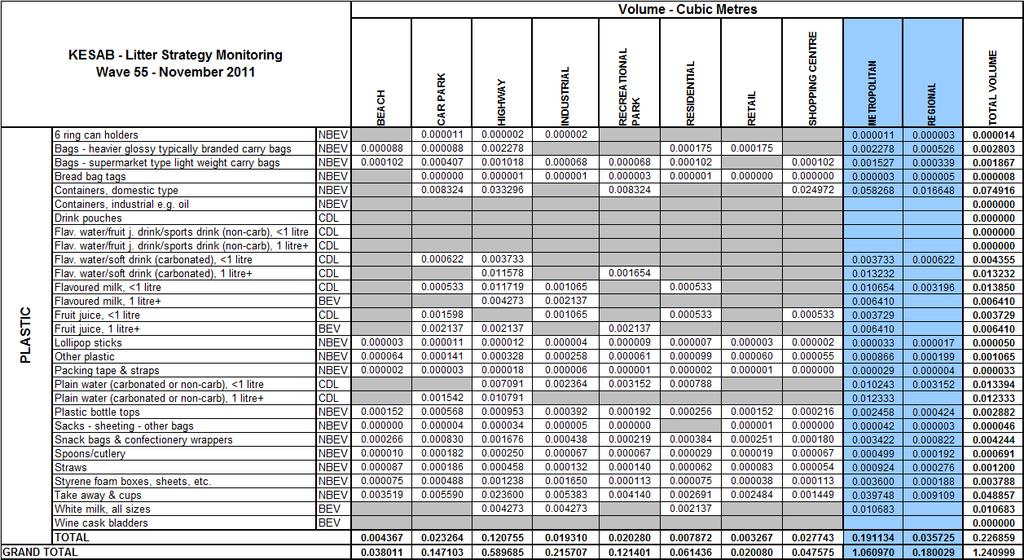
13 The items associated with the largest estimated litter volumes in Wave 55 included: MISCELLANEOUS - Illegal dumping (0.480m³, up from 0.408m³ in Wave 54) PAPER/PAPERBOARD - Cups/take away containers (0.149m³, up from 0.105m³ in Wave 54) PLASTIC - Containers, domestic type (0.075m³, up from 0.067m³ in Wave 54) PAPER/PAPERBOARD - Newspapers & magazines (0.051m³, up from 0.042m³ in Wave 54) MISCELLANEOUS - Construction materials (0.050m³, up from 0.045m³ in Wave 54) PLASTIC - Take away & cups (0.049m³, down from 0.055m³ in Wave 52) GLASS Beer, all colours of glass, <750ml (0.039m³, up from 0.023m³ in Wave 54) METAL flavoured water/ soft drink (carbonated) all sizes (0.038m3, up from 0.018m3 in Wave 54) PAPER/PAPERBOARD - Cigarette packets (0.031m3, down from 0.032m³ in Wave 54) The top 20 ranking of litter items by volume in Wave 55 was similar to the results for previous waves, the new items entering the top 20 however were: METAL - Beer, aluminium, all types, all sizes PLASTIC Flavoured milk, < 1 litre PLASTIC Plain water (carbonated or non- carbonated), < 1 litre PLASTIC Plain water (carbonated or non- carbonated), 1 litre + PLASTIC White milk, all sizes With new entrants there are always those items that exit from the top 20 volume list, in Wave 55 they were: PLASTIC - Containers, industrial type GLASS - Beer, all colours of glass, 750ml+ METAL - Industrial cans, all types PLASTIC - flavoured water/ soft drink (carbonated), < 1 litre METAL - Alcoholic sodas & spirit-based mixers
14 TOP 20 CATEGORIES - LARGEST VOLUMES MISCELLANEOUS - Illegal dumping PAPER/PAPERBOARD - Cups/take away containers PLASTIC - Containers, domestic type PAPER/PAPERBOARD - Newspapers & magazines MISCELLANEOUS - Construction materials PLASTIC - Take away & cups GLASS - Beer, all colours of glass, <750ml METAL - Flav. water/soft drink, (carbonated), all sizes PAPER/PAPERBOARD - Cigarette packets METAL - Foil take away MISCELLANEOUS - Disposable nappies PAPER/PAPERBOARD - Packages & boxes METAL - Beer, aluminium, all types, all sizes PAPER/PAPERBOARD - Cartons, flavoured milk, <1 litre PLASTIC - Flav. milk, <1 litre PLASTIC - Plain water (carbonated or non-carb), <1 litre PLASTIC - Flav. water/soft drink (carbonated), 1 litre+ PLASTIC - Plain water (carbonated or non-carb), 1 litre+ PLASTIC - White milk, all sizes PAPER/PAPERBOARD - Junk mail/free circulars Cubic metres Nov.11 Aug.11 May.11 Feb.11 Nov
15 3.1 Glass Items A total of 354 items (up from 250 items in Wave 54) glass litter items were counted during Wave 55. The most frequently recorded glass items included: Other glass (238 items, up from 161 items in Wave 54) Beer, all colours of glass <750ml (82 items, up from 49 items in Wave 54) Wine and spirits, all sizes (9 items, up from 3 items in Wave 54) Wine cooler, all sizes (8 items, up from nil in Wave 54) Plain water (carbonated or non-carbonated), < 1 litre (5 items, up from 2 items in Wave 54) Flavoured water/ soft drink (carbonated), < 1 litre (4 items, up from 2 items in Wave 54) GLASS ITEMS - COUNTS - top 5 - Other glass Beer, all colours of glass, <750ml Wine & spirit, all sizes Wine cooler, all sizes Plain water (carbonated or non-carb), <1 litre Flav. water/soft drink (carbonated), <1 litre Items counted Nov.11 Aug.11 May.11 Feb.11 Nov
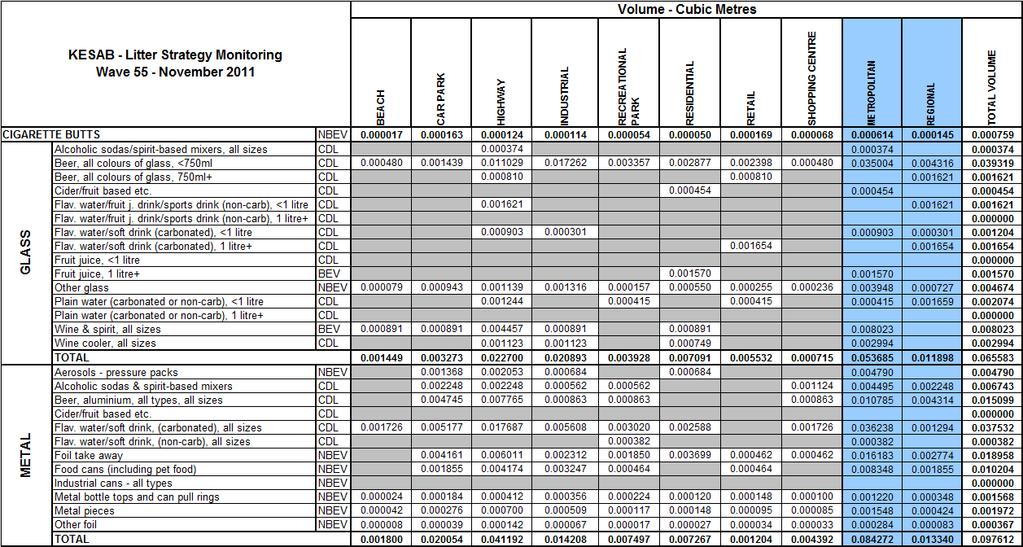
16 Volume Glass litter items accounted for 0.066m3 (up from 0.054m3 in Wave 54) in estimated litter volume during Wave 55. Glass items which contributed the largest volumes to the total included: Beer, all colours of glass, <750 ml (0.039m3, up from 0.023m3 in Wave 54) Wine and spirits, all sizes (0.008m3, up from 0.003m3 in Wave 54) Other glass (0.005m3, up from 0.003m3 in Wave 54) Wine cooler, all sizes (0.003m3, up from nil in Wave 54) Plain water (carbonated or non-carbonated), < 1 litre (0.002m3, up from 0.001m3 in Wave 54) GLASS ITEMS - VOLUMES - Top 5 - Beer, all colours of glass, <750ml Wine & spirit, all sizes Other glass Wine cooler, all sizes Plain water (carbonated or noncarb), <1 litre Cubic metres Nov.11 Aug.11 May.11 Feb.11 Nov
17 3.2 Metal Items A total of 1,018 (up from 836 items in Wave 54) metal litter items were counted during November The most frequently counted metal litter items included: Metal bottle tops and can pull rings (392 items, up from 269 items in Wave 54) Other foil (235 items, down from 260 items in Wave 54) Metal pieces (186 items, up from 165 items in Wave 54) Flavoured water/soft drink, (carbonated), all sizes (87 items, up from 42 items in Wave 54) Foil take away (41 items, up from 31 items in Wave 54) METAL ITEMS - COUNTS - Top 5 Metal bottle tops and can pull rings Other foil Metal pieces Flav. water/soft drink, (carbonated), all sizes Foil take away Items counted Nov.11 Aug.11 May.11 Feb.11 Nov
18 Volume Metal litter items accounted for a total estimated litter volume of 0.098m3 (up from 0.085m3 in Wave 54). The metal items associated with the largest estimated volumes of litter during Wave 55 included: Flavoured water/ soft drink (carbonated), all sizes (0.038m3, up from 0.018m3 in Wave 54) Foil take away (0.019m3, up from 0.014m3 in Wave 54) Beer aluminium, all types, all sizes (0.015m3, up from 0.008m3 in Wave 54) Food cans (including pet food) (0.010m3, up from 0.004m3 in Wave 54) Alcoholic sodas & spirit-based mixers (0.007m3, down from 0.008m3 in Wave 54) METAL ITEMS - VOLUMES - Top 5 Flav. water/soft drink, (carbonated), all sizes Foil take away Beer, aluminium, all types, all sizes Food cans (including pet food) Alcoholic sodas & spirit-based mixers Cubic metres Nov.11 Aug.11 May.11 Feb.11 Nov
19 3.3 Plastic Items A total of 3,039 (up from 2,865 items in Wave 54) plastic litter items were counted during Wave 55. The most frequently counted plastic litter items included: Other plastic (852 items, down from 981 items in Wave 54) Snack bags & confectionery wrappers (542 items, up from 437 items in Wave 54) Plastic bottle tops (360 items, up from 252 items in Wave 54) Straws (291 items, down from 308 items in Wave 54) Take away & cups (236 items, down from 264 items in Wave 54) PLASTIC ITEMS - COUNTS - Top 5 Other plastic Snack bags & confectionery wrappers Plastic bottle tops Straws Take away & cups Items counted Nov.11 Aug.11 May.11 Feb.11 Nov
20 Volume Plastic items were associated with an estimated litter volume of 0.227m3 (down from 0.286m3 in Wave 54). Items which represented the largest volumes within the Wave 55 litter count included: Containers, domestic type (0.075m3, up from 0.067m3 in Wave 54) Take away & cups (0.049m3, down from 0.055m3 in Wave 54) Flavoured milk, < 1 litre (0.014m3, up from 0.004m3 in Wave 54) Plain water (carbonated or non-carbonated), <1 litre (0.013m3, up from 0.005m3 in Wave 54) Flavoured water/soft drink (carbonated), 1 litre+ (0.013m3, down from 0.017m3 in Wave 54) PLASTIC ITEMS - VOLUMES - Top 5 Containers, domestic type Take away & cups Flavoured milk, <1 litre Plain water (carbonated or noncarb), <1 litre Flav. water/soft drink (carbonated), 1 litre Cubic metres Nov.11 Aug.11 May.11 Feb.11 Nov
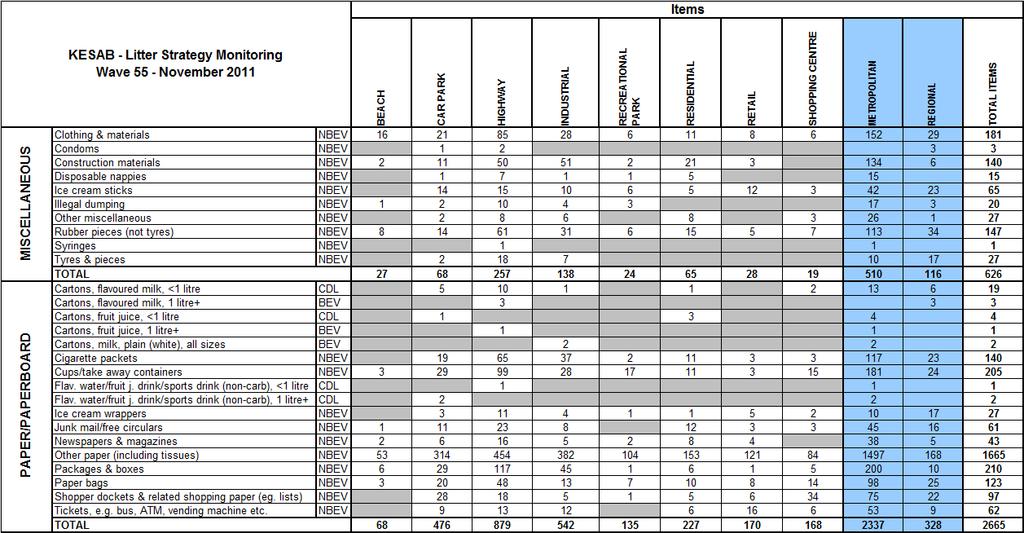
21 3.4 Paper/ Paperboard Items A total of 2,665 (up from 2,438 items in Wave 54) paper/ paperboard litter items were recorded during Wave 55. The most frequently identified items within this material type were: Other paper including tissues (1,665 items, up from 1,559 items in Wave 54) Packages & boxes (210 items, up from 142 items in Wave 54) Cups/ take away containers (205 items, up from 144 items in Wave 54) Cigarette packets (e.g. lists) (140 items, down from 145 items in Wave 54) Paper bags (123 items, up from 116 items in Wave 54) PAPER/ PAPERBOARD ITEMS - COUNTS - Top 5 Other paper (including tissues) Packages & boxes Cups/take away containers Cigarette packets Paper bags Items counted Nov.11 Aug.11 May.11 Feb.11 Nov
22 Volume Paper/ Paperboard items accounted for 0.294m3 in estimated litter volume (up from 0.237m3 in Wave 54) in November Paper/ paperboard items which contributed the largest volumes to the total included: Cups/take away containers (0.149m3, up from 0.105m3 in Wave 54) Newspapers & magazines (0.051m3, up from 0.042m3 in Wave 54) Cigarette packets (0.031m3, down from 0.032m3 in Wave 54) Packages & boxes (0.017m3, up from 0.011m3 in Wave 54) Cartons flavoured milk, < 1 litre (0.014m3, down from 0.019m3 from Wave 54) PAPER/ PAPERBOARD ITEMS - VOLUMES - Top 5 Cups/take away containers Newspapers & magazines Cigarette packets Packages & boxes Cartons, flavoured milk, <1 litre Cubic metres Nov.11 Aug.11 May.11 Feb.11 Nov
23 3.5 Miscellaneous Items A total of 626 miscellaneous litter items (up from 570 items in Wave 54) were counted during Wave 55. The most frequently recorded items included: Clothing & materials (181 items, up from 166 items in Wave 54) Rubber pieces not tyres (147 items, up from 123 items in Wave 54). Rubber pieces in this category include vehicle rubber mouldings, hose pipes and tubing, bicycle handle bar grips and casings, pram mouldings and strips. Construction materials (140 items, up from 124 items in Wave 54) Ice cream sticks (65 items, down from 77 items in Wave 54) Tyres & pieces (27 items, up from 23 items in Wave 54) MISCELLANEOUS ITEMS - COUNTS - Top 5 Clothing & materials Rubber pieces (not tyres) Construction materials Ice cream sticks Tyres & pieces Items counted Nov.11 Aug.11 May.11 Feb.11 Nov
24 Volume Miscellaneous litter was associated with an estimated litter volume of 0.557m3 (up from 0.470m3 in Wave 54) during Wave 55. Illegal dumping remained the major contributor to the total volume of miscellaneous items, with an estimated total volume of 0.480m3 (up from 0.408m3 in Wave 54). Other miscellaneous items which contributed to the litter stream volume included: Construction materials (0.050m3, up from 0.045m3 in Wave 54) Disposable nappies (0.017m3, up from 0.009m3 in Wave 54) Tyres & pieces (0.006m3, up from 0.005m3 in Wave 54) Clothing and materials (0.003m3, unchanged from Wave 54) MISCELLANEOUS ITEMS - VOLUMES - Top 5 Illegal dumping Construction materials Disposable nappies Tyres & pieces Clothing & materials Cubic metres Nov.11 Aug.11 May.11 Feb.11 Nov
25 3.6 Cigarette Butts Items The total number of cigarette butts recorded during Wave 55 amounted to 6,602, up from 6,156 butts in Wave 54 and from 5,786 butts counted in Wave 51 at the same time last year. The proportion of cigarette butts of the total litter items counted increased at shopping centres (5, up from 5 in Wave 54), residential sites (41%, up from 3 in Wave 54), industrial sites (40%, up from 3 in Wave 54) and highways (2, up from 2 in Wave 54). There was decrease in the cigarette butts counted as a proportion of litter at retail sites (7, down from 81% in Wave 54), car parks (5, down from 5 in Wave 54) and recreational parks (50%, down from 51% in Wave 54), while the proportion of cigarette butts of the total litter items remained the same at beaches (3, unchanged from Wave 54). CIGARETTE BUTTS AS A PROPORTION OF TOTAL LITTER AT EACH SITE TYPE Beach 21% Car Park Highway % 2 Industrial 40% Recreational Park 3 50% 51% 4 4 Residential % 41% Retail 70% % Shopping Centre % 20% 30% 40% 50% 60% 70% 80% 90% % of total litter at each site type Nov.11 Aug.11 May.11 Feb.11 Nov
26 Volume Despite cigarette butts being the most numerous litter item, they accounted for less than 1% of the total volume of litter recorded during the current Wave
27 3.7 Dispersion of Litter by Site Type Items Highways remained the most significant contributor to the total number of litter items counted in November 2011 with more than one quarter (2, up from 2 in Wave 54) of the total litter items counted at highway locations. Other sites contributed the following proportions of the total number of litter items counted during Wave 55: Car Park (1, down from 21% in Wave 54) Industrial (1, up from 1 in Wave 54) Retail (1, down from 1 in Wave 54) Recreational Park (, up from in Wave 54) Residential (, down from in Wave 54) Shopping Centre (, down from in Wave 54) Beach (, down from in Wave 54) PROPORTION OF TOTAL LITTER ITEMS COUNTED WITHIN SITE TYPE Shopping centre, Retail, 1 Residential, Beach, Car park, 1 Recreational park, Industrial, 1 Highway,
28 A comparison of the proportions of litter items found at each site type revealed that highway and car park locations contributed large amounts to the total number of litter items counted in the November 2011 Monitor. Although highway sites represented only 1 of the total number of sites surveyed, they contributed more than one quarter (2, up from 2 in Wave 54) of the total litter items counted. Similarly, industrial areas incorporated of the sites surveyed and contributed 1 (up from 1 in Wave 54) of the total litter items counted in Wave 55. Conversely, residential locations and beaches continued to only contribute smaller proportions of litter items to the total litter count than anticipated based upon the proportion of these sites within the overall sample of locations as outlined below: Residential areas incorporated 1 of the sites surveyed, but contributed only (down from in Wave 54) of the litter items counted in Wave 55 Beaches - represented of the sites surveyed, but contributed (down from in Wave 54) of the litter counted in Wave 55 The remaining sites contributed the expected proportions of litter based on the proportion of these sites among the overall number of sites counted during November 2011, the proportions were: Car parks only incorporated 1 of the sites surveyed and contributed 1 (down from 21% in Wave 54) of the litter items counted in Wave 55 Retail areas - incorporated of the sites surveyed and contributed 1 (down from 1 in Wave 54) of the litter items counted in Wave 55 Recreational parks represented of sites surveyed, and contributed (up from in Wave 54) of the litter counted in Wave 55 Shopping centres - incorporated of the sites surveyed and contributed (down from in Wave 54) of the litter items counted in Wave
29 PROPORTION OF TOTAL LITTER ITEMS COUNTED WITHIN SITE TYPE - tracking - Nov Aug.11 21% May Feb.11 20% 31% 1 Nov Aug.10 20% 2 1 May Feb Nov Aug.09 21% 3 1 May Feb % 20% 30% 40% 50% 60% 70% 80% 90% 100% % of total Beach Car Park Highway Industrial Recreational Park Residential Retail Shopping Centre
 during November 2011.")
, beaches (, up from 1% in Wave 54) and retail sites (, up from 1% in Wave 54) to the total volume of litter recorded in Wave 55.")
30 Volume Almost half (4, up from 4 in Wave 54) of the total volume of litter estimated during Wave 55 was associated with litter items at highway locations. Moderate volumes of litter were contributed to the overall litter volume by industrial sites (1, down from 1 in Wave 54) during November Lower volumes of litter were estimated at car park sites (1, down from 1 in Wave 54), recreational parks (, up from in Wave 54), residential sites (, down from 1 in Wave 54), shopping centres (, up from in Wave 54), beaches (, up from 1% in Wave 54) and retail sites (, up from 1% in Wave 54) to the total volume of litter recorded in Wave 55. The increase in volume estimates at recreational parks and the decrease in volume estimates at residential sites were due primarily to the incidence of illegal dumping at these sites. PROPORTION OF TOTAL LITTER VOLUME BY SITE TYPE Industrial, 1 Recreational park, Residential, Retail, Shopping centre, Highway, 4 Beach, Car park, 1 A comparison of the litter volume, number of litter items and proportion of sites represented within location types shows that highways contributed a larger number and volume of litter items than would be expected given their representations within the sample. NUMBER AND VOLUME OF LITTER BY SITE TYPE AS PROPORTIONS OF TOTALS % of total litter volume % of total items counted % of total number of sites counted % 20% 30% 40% 50% 60% 70% 80% 90% 100% % of total Beach Car Park Highway Industrial Recreational Park Residential Retail Shopping Centre
31 3.8 CDL Beverage Containers The overwhelming majority (9, down from 9 in Wave 54) of litter items counted in November 2011 were non-beverage items. The total number of CDL beverage containers counted in Wave 55 increased by 31% to 340 items (up from 260 in Wave 54) from the previous monitor. CDL beverage containers accounted for 9 (up from 9 in Wave 54) of all beverage containers counted during Wave
32 Data Summary - Items
33 - 31 -
34 - 32 -
35 - 33 -
36 Data Summary - Volumes
37 - 35 -
38 - 36 -
39 - 37 -
40 Appendix 1: Tracking Graphs
41 Weighting of Previous Results Since February 2006 (Wave 32), 11 revised sites have been surveyed concurrently with the 151 original sites included within the litter monitor program since its inception in February The new and old sites were surveyed simultaneously across four Waves of the monitor. These 11 revised sites have previously been surveyed concurrently with the 151 original sites to replace 11 of the original sites that were found to be unusual in nature, and analyses have typically focused on results for the 151 sites including the 11 new sites and the 151 sites including the 11 old sites separately. However, in counts since the February 2007 Monitor only the 151 revised sites (incorporating the 11 new locations) have been surveyed. In order to facilitate tracking comparisons, figures prior to February 2007 have been weighted based upon the variations between results corresponding to the 151 sites including the 11 new sites and the 151 sites including the 11 old sites. Weighting techniques were based upon comparisons of figures for items and volumes recorded during Waves 32, 33, 34 and 35 across all sites incorporating either the 11 original or 11 revised sites. Differences between such figures provided indices of the degree of consistent variation between original and revised site litter data, and reliable weightings were thereby established. Figures which have been weighted included: Absolute values (counts and volumes) within material categories and site types, since the inclusion of the revised sites resulted in differences in nearly all absolute values of counted litter. Comparisons between proportional representation of litter across site types, due to the fact that site revision altered the proportions of litter contributed to the total litter stream within certain site categories whilst others remained unchanged. However, preliminary investigations demonstrated that proportional contribution to the total litter stream within material types was consistently similar between the original and revised site sets. This finding supports the assumption that whilst the quantities of litter recorded differed between old and new sites, the types of materials present within such litter were relatively consistent. For this reason, proportional figures within material types did not require weighting
42 Residential Beach Industrial Car Park Shopping Centre Retail Recreational Park Highway Metropolitan Regional TOTAL Items within material categories across all 151 sites including either 11 original or 11 revised sites Old New Diff New as % of Old Old New Diff New as % of Old Old New Diff New as % of Old Old New Diff New as % of Old Glass Metal Plastic Paper/ paperboard Miscellaneous Cigarette Butts TOTAL AVERAGE New as % of Old OVERALL Mean New as % of Old Wave 32 Wave 33 Wave 34 Wave 35 Items within site type across all 151 sites including either 11 original or 11 revised sites Wave 32 Wave 33 Wave 34 Wave 35 Old New Diff New as % of Old Old New Diff New as % of Old Old New Diff New as % of Old Old New Diff New as % of Old Average New as % of Old
43 Residential Beach Industrial Car Park Shopping Centre Retail Recreational Park Highway Metropolitan Regional TOTAL Proportions of total items within site type across all 151 sites including either 11 original or 11 revised sites Old New Wave 32 Old % of total items % % New % of total items % 4.1% % change from Old to New 2.1% % 3.1% % Old New Wave 33 Old % of total items % New % of total items % 12.1% % % change from Old to New 2.0% % -14.1% Old New Wave 34 Old % of total items % % % New % of total items % 36.1% 74.1% 25. % change from Old to New % % 8.1% Old New Wave 35 Old % of total items 5.0% New % of total items % % 26. % change from Old to New Average % difference from Old to New 1% 0% 1%
44 Residential Beach Industrial Car Park Shopping Centre Retail Recreational Park Highway Metropolitan Regional TOTAL Volumes within material categories across all 151 sites including either 11 original or 11 revised sites Wave 32 Wave 33 Wave 34 Wave 35 Old New Diff New as % of Old Old New Diff New as % of Old Old New Diff New as % of Old Old New Diff Glass Metal Plastic Paper/ paperboard Miscellaneous Cigarette Butts TOTAL AVERAGE New as % of Old OVERALL MEAN DIFFERENCE New as % of Old Volumes within site type across all 151 sites including either 11 original or 11 revised sites Wave 32 Wave 33 Wave 34 Wave 35 Old New Diff New as % of Old Old New Diff New as % of Old Old New Diff New as % of Old Old New Diff New as % of Old Average New as % of Old
45 Residential Beach Industrial Car Park Shopping Centre Retail Recreational Park Highway Metropolitan Regional TOTAL Proportions of total volume within site type across all 151 sites including either 11 original or 11 revised sites Old New Wave 32 Old % of total volume New % of total volume % change from Old to New % % 11.1% Old New Wave 33 Old % of total volume % 24. New % of total volume % % change from Old to New Old New Wave 34 Old % of total volume 3.1% % % 25.0% New % of total volume 4.1% % change from Old to New 1.0% % Old New Wave 35 Old % of total volume New % of total volume % change from Old to New % % % Average % difference from Old to New 1% 0% -1% 0% 0%
46 Unweighted Tracking Graphs - Items
47 Feb.98 May.98 Aug.98 Nov.98 Feb.99 May.99 Aug.99 Nov.99 Feb.00 May.00 Aug.00 Nov.00 Feb.01 May.01 Aug.01 Nov.01 Feb.02 May.02 Nov.02 Feb.03 May.03 Aug.03 Nov.03 Feb.04 May.04 Aug.04 Nov.04 Feb.05 May.05 Aug.05 Nov.05 Feb.06 May.06 Aug.06 Nov.06 Feb.07 May.07 Aug.07 Nov.07 Feb.08 May.08 Aug.08 Nov.08 Feb.09 May.09 Aug.09 Nov.09 Feb.10 May.10 Aug.10 Nov.10 Feb.11 May.11 Aug.11 Nov Total Litter - Number of Items Revised Sites Inc CDL - 5c to 10c Sept
48 Feb. 98 May.98 Aug. 98 Nov. 98 Feb.99 May.99 Aug. 99 Nov. 99 Feb.00 May.00 Aug.00 Nov.00 Feb.01 May.01 Aug.01 Nov.01 Feb.02 May.02 Nov.02 Feb.03 May.03 Aug.03 Nov.03 Feb.04 May.04 Aug.04 Nov.04 Feb.05 May.05 Aug.05 Nov.05 Feb.06 May.06 Aug.06 Nov.06 Feb.07 May.07 Aug.07 Nov.07 Feb.08 May.08 Aug.08 Nov.08 Feb.09 May.09 Aug.09 Nov.09 Feb.10 May.10 Aug.10 Nov.10 Feb.11 May.11 Aug.11 Nov Number of litter items Degrees Celsius Weather Temperature and Total Number of Litter Items Inc CDL - 5c to 10c Sept 08 Revised Sites Absolute total Average Temperature
49 Number of Litter Items by Material Type Nov.11 Aug.11 May.11 Feb.11 Nov.10 Aug.10 May.10 Feb.10 Nov.09 Aug.09 May.09 Feb.09 Nov.08 Aug.08 May.08 Feb.08 Nov.07 Aug.07 May.07 Feb.07 Nov.06 Aug.06 May.06 Feb.06 Nov.05 Aug.05 May.05 Feb.05 Nov.04 Aug.04 May.04 Feb.04 Nov.03 Aug.03 May.03 Feb.03 Nov.02 May.02 Feb.02 Nov.01 Aug.01 May.01 Feb.01 Nov.00 Aug.00 May.00 Feb.00 Nov. 99 Aug. 99 May.99 Feb.99 Nov. 98 Aug. 98 May.98 Feb Inc CDL - 5c to 10c Sept Revised Number of Items Cigarette butts Glass Metal Miscellaneous Paper/paperboard Plastic
50 Proportion of Total Litter Stream by Material Type Nov.11 Aug.11 May.11 Feb.11 Nov.10 Aug.10 May.10 Feb.10 Nov.09 Aug.09 May.09 Feb.09 Nov.08 Aug.08 May.08 Feb.08 Nov.07 Aug.07 May.07 Feb.07 Nov.06 Aug.06 May.06 Feb.06 Nov.05 Aug.05 May.05 Feb.05 Nov.04 Aug.04 May.04 Feb.04 Nov.03 Aug.03 May.03 Feb.03 Nov.02 May.02 Feb.02 Nov.01 Aug.01 May.01 Feb.01 Nov.00 Aug.00 May.00 Feb.00 Nov. 99 Aug. 99 May 99 Feb.99 Nov. 98 Aug. 98 May 98 Feb % 40% 40% 3 40% % 41% 40% 4 41% % 1% 1% 1% 1% 1% 1% 1% 1% 1% 1% 1% 1% 1% 1% 1% 1% 1% 1% 1% 1 0% 20% 30% 40% 50% 60% 70% 80% 90% 100% % % 20% 20% % 2 20% 20% % 2 20% % 21% 2 21% % % % % % % 21% % 20% 21% 20% 21% Inc CDL - 5c to 10c Sept 08 Revised % of litter items Cigarette butts Glass Metal Miscellaneous Paper/paperboard Plastic
51 Number of Litter Items by Site Type Nov.11 Aug.11 May.11 Feb.11 Nov.10 Aug.10 May.10 Feb.10 Nov.09 Aug.09 May.09 Feb.09 Nov.08 Aug.08 May.08 Feb.08 Nov.07 Aug.07 May.07 Feb.07 Nov.06 Aug.06 May.06 Feb.06 Nov.05 Aug.05 May.05 Feb.05 Nov.04 Aug.04 May.04 Feb.04 Nov.03 Aug.03 May.03 Feb.03 Nov.02 May.02 Feb.02 Nov.01 Aug.01 May.01 Feb.01 Nov.00 Aug.00 May.00 Feb.00 Nov. 99 Aug. 99 May.99 Feb.99 Nov. 98 Aug. 98 May.98 Feb Number of Litter Items Inc CDL - 5c to 10c Sept 08 Revised Sites 1282 Beach Car park Highway Industrial Recreational Park Residential Retail Shopping Centre
52 % % 1 20% 1 21% % % % % % % % 1 0% 20% 30% 40% 50% 60% 70% 80% 90% 100% Proportion Feb. 98 May 98 Aug. 98 Nov. 98 Feb.99 May 99 Aug. 99 Nov. 99 Feb.00 May.00 Aug.00 Nov.00 Feb.01 May.01 Aug.01 Nov.01 Feb.02 May.02 Nov.02 Feb.03 May.03 Aug.03 Nov.03 Feb.04 May.04 Aug. 04 Nov.04 Feb.05 May.05 Aug. 05 Nov.05 Feb.06 May.06 Aug.06 Nov.06 Feb.07 May.07 Aug.07 Nov.07 Feb.08 May.08 Aug.08 Nov.08 Feb.09 May.09 Aug.09 Nov.09 Feb.10 May.10 Aug.10 Nov.10 Feb.11 May.11 Aug.11 Nov.11 % of Total Litter Items Proportion of Total Litter by Site Type Beach Car park Highway Industrial Recreational Park Residential Retail Shopping Centre Revised Sites Inc CDL - 5c to 10c Sept 08
53 Feb.98 May.98 Aug.98 Nov.98 Feb.99 May.99 Aug.99 Nov.99 Feb.00 May.00 Aug.00 Nov.00 Feb.01 May.01 Aug.01 Nov.01 Feb.02 May.02 Nov.02 Feb.03 May.03 Aug.03 Nov.03 Feb.04 May.04 Aug.04 Nov.04 Feb.05 May.05 Aug.05 Nov.05 Feb.06 May.06 Aug.06 Nov.06 Feb.07 May.07 Aug.07 Nov.07 Feb.08 May.08 Aug.08 Nov.08 Feb.09 May.09 Aug.09 Nov.09 Feb.10 May.10 Aug.10 Nov.10 Feb.11 May.11 Aug.11 Nov.11 Number of Items Total Number of Cigarette Butts Revised Sites
54 Feb.98 May.98 Aug.98 Nov.98 Feb.99 May.99 Aug.99 Nov.99 Feb.00 May.00 Aug.00 Nov.00 Feb.01 May.01 Aug.01 Nov.01 Feb.02 May.02 Nov.02 Feb.03 May.03 Aug.03 Nov.03 Feb.04 May.04 Aug.04 Nov.04 Feb.05 May.05 Aug.05 Nov.05 Feb.06 May.06 Aug.06 Nov.06 Feb.07 May.07 Aug.07 Nov.07 Feb.08 May.08 Aug.08 Nov.08 Feb.09 May.09 Aug.09 Nov.09 Feb.10 May.10 Aug.10 Nov.10 Feb.11 May.11 Aug.11 Nov % % % % % % 40% Number of Items 5 60% % 60% % % % 5 51% 51% % 60% 5 61% 6 60% % 5 60% Proportion of Cigarette Related Litter Items in Total Litter Stream Revised Sites 100% 90% 80% 70% 60% 50% 40% 30% 20% 0% 1% 1% 1% 1% 1% 1% 1% 1% 1% 1% 1% 1% Cigarette Packets Cigarette Butts Other Litter
55 Number of Cigarette Butts by Site Type Nov.11 Aug.11 May.11 Feb.11 Nov.10 Aug.10 May.10 Feb.10 Nov.09 Aug.09 May.09 Feb.09 Nov.08 Aug.08 May.08 Feb.08 Nov.07 Aug.07 May.07 Feb.07 Nov.06 Aug.06 May.06 Feb.06 Nov.05 Aug.05 May.05 Feb.05 Nov.04 Aug.04 May.04 Feb.04 Nov.03 Aug.03 May.03 Feb.03 Nov.02 May.02 Feb.02 Nov.01 Aug.01 May.01 Feb.01 Nov.00 Aug.00 May.00 Feb.00 Nov. 99 Aug. 99 May.99 Feb.99 Nov.98 Aug.98 May Revised Sites Number of cigarette butts Beach Car park Highway Industrial Recreational Park Residential Retail Shopping Centre
56 Nov.11 Aug.11 May.11 Feb.11 Nov.10 Aug.10 May.10 Feb.10 Nov.09 Aug.09 May.09 Feb.09 Nov.08 Aug.08 May.08 Feb.08 Nov.07 Aug.07 May.07 Feb.07 Nov.06 Aug.06 May.06 Feb.06 Nov.05 Aug.05 May.05 Feb.05 Nov.04 Aug.04 May.04 Feb.04 Nov.03 Aug.03 May.03 Feb.03 Nov.02 May.02 Feb.02 Nov.01 Aug.01 May.01 Feb.01 Nov.00 Aug.00 May.00 Feb.00 Nov. 99 Aug. 99 May.99 Feb.99 Nov.98 Aug.98 May.98 Feb.98 Proportion of Total Cigarette Butt Litter at Highway sites & Other sites % % 2 30% % 2 20% % % 40% % % % % % % % % % % 81% % % 7 80% 0% 20% 40% 60% 80% 100% % of total cigarette butt litter Revised Sites Highway sites Other sites
57 Number of CDL containers and total beverage containers % of beverage litter covered by current CDL % 9 90% % Proportion of Beverage Litter Covered By Current CDL & Total Number of Beverage Litter Items & Containers Covered By Current CDL January 2003 extension to CDL Inc CDL - 5c to 10c Sept % 91% % 90% % 91% % % 90% % 90% 80% % Total Beverage CDL - Trendline 60% % 40% % % 0 0% Total Beverage CDL Total Beverage % CDL of Total Beverage Linear (Total Beverage CDL) Linear (% CDL of Total Beverage)
58 Feb.98 May.98 Aug.98 Nov.98 Feb.99 May.99 Aug.99 Nov.99 Feb.00 May.00 Aug.00 Nov.00 Feb.01 May.01 Aug.01 Nov.01 Feb.02 May.02 Nov.02 Feb.03 May.03 Aug.03 Nov.03 Feb.04 May.04 Aug.04 Nov.04 Feb.05 May.05 Aug.05 Nov.05 Feb-06 May.06 Aug.06 Nov.06 Feb.07 May.07 Aug.07 Nov.07 Feb.08 May.08 Aug.08 Nov.08 Feb.09 May.09 Aug.09 Nov.09 Feb.10 May.10 Aug.10 Nov.10 Feb.11 May.11 Aug.11 Nov.11 % of CDL litter items January 2003 extension to CDL Proportion of Current CDL Litter Items in Total Litter Stream Inc CDL - 5c to 10c Sept % % % % % 2.0% Trendline % % 3.0% % % 2. 0%
59 May.98 Aug.98 Nov.98 Feb.99 May.99 Aug.99 Nov.99 Feb.00 May.00 Aug.00 Nov.00 Feb.01 May.01 Aug.01 Nov.01 Feb.02 May.02 Nov.02 Feb.03 May.03 Aug.03 Nov.03 Feb.04 May.04 Aug.04 Nov.04 Feb.05 May.05 Aug.05 Nov.05 Feb.06 May.06 Aug.06 Nov.06 Feb.07 May.07 Aug.07 Nov.07 Feb.08 May.08 Aug.08 Nov.08 Feb.09 May.09 Aug.09 Nov.09 Feb.10 May.10 Aug.10 Nov.10 Feb.11 May.11 Aug.11 Nov Number of items CDL and Non-CDL Beverage Items Within Material Categories 1000 Revised Sites Inc CDL - 5c to 10c Sept Total CDL glass Total CDL metal Total CDL paperboard Total CDL Plastic Total non-cdl glass Total non-cdl paperboard Total non-cdl Plastic
60 Top 20 Litter Items - Highest Counts CIGARETTE BUTTS - Cigarette butts PAPER/PAPERBOARD - Other paper (including tissues) PLASTIC - Other plastic PLASTIC - Snack bags & confectionery wrappers METAL - Metal bottle tops and can pull rings PLASTIC - Plastic bottle tops PLASTIC - Straws GLASS - Other glass PLASTIC - Take away & cups METAL - Other foil PAPER/PAPERBOARD - Packages & boxes PAPER/PAPERBOARD - Cups/take away containers METAL - Metal pieces MISCELLANEOUS - Clothing & materials MISCELLANEOUS - Rubber pieces (not tyres) PLASTIC - Sacks - sheeting - other bags PAPER/PAPERBOARD - Cigarette packets MISCELLANEOUS - Construction materials PAPER/PAPERBOARD - Paper bags PLASTIC - Packing tape & straps Number of Litter Items Nov.11 Aug.11 May.11 Feb.11 Nov
61 Unweighted Tracking Graphs - Volume
62 Top 20 Litter Items by Volume MISCELLANEOUS - Illegal dumping PAPER/PAPERBOARD - Cups/take away containers PLASTIC - Containers, domestic type PAPER/PAPERBOARD - Newspapers & magazines MISCELLANEOUS - Construction materials PLASTIC - Take away & cups GLASS - Beer, all colours of glass, <750ml METAL - Flav. water/soft drink, (carbonated), all sizes PAPER/PAPERBOARD - Cigarette packets METAL - Foil take away MISCELLANEOUS - Disposable nappies PAPER/PAPERBOARD - Packages & boxes METAL - Beer, aluminium, all types, all sizes PAPER/PAPERBOARD - Cartons, flavoured milk, <1 litre PLASTIC - Flav. milk, <1 litre PLASTIC - Plain water (carbonated or non-carb), <1 litre PLASTIC - Flav. water/soft drink (carbonated), 1 litre PLASTIC - Plain water (carbonated or non-carb), 1 litre PLASTIC - White milk, all sizes PAPER/PAPERBOARD - Junk mail/free circulars Volume of Litter Items (m3) Nov.11 Aug.11 May.11 Feb.11 Nov
63 Volume of Litter by Site Type Nov Aug May Feb Nov Aug May Feb Nov Aug May Feb Nov Aug May Feb Nov Aug May Feb.07 Nov.06 Aug.06 May.06 Feb.06 Nov.05 Aug.05 May.05 Feb.05 Nov.04 Aug.04 May.04 Feb.04 Nov.03 Aug.03 May.03 Feb.03 Nov.02 May.02 Feb.02 Nov.01 Aug.01 May.01 Feb.01 Nov.00 Aug.00 May.00 Feb.00 Nov.99 Aug.99 May.99 Feb.99 Nov.98 Aug.98 May.98 Feb Inc CDL - 5c to 10c Sept Revised Sites Volume of litter (m3) Beach Car park Highway Industrial Recreational Park Residential Retail Shopping Centre
64 Proportion of Litter Volume in Total Litter Stream by Site Type Nov.11 1 Aug.11 1% 1 May.11 1% Feb.11 1% Nov.10 1% Aug.10 1% 1 May.10 0% Feb.10 Nov.09 Aug.09 1% May.09 Feb.09 Nov.08 Aug.08 1% 0% May.08 Feb.08 1% Nov.07 Aug.07 May.07 Feb.07 1% Nov.06 0% Aug.06 May.06 1% Feb.06 1% Nov.05 Aug.05 1% May.05 Feb.05 Nov.04 Aug. 04 May.04 1% Feb.04 Nov.03 Aug.03 1% May.03 0% Feb.03 1 Nov.02 1% May.02 Feb.02 Nov.01 1% Aug.01 1% May.01 1% Feb.01 Nov.00 Aug.00 1 May.00 Feb.00 Nov. 99 Aug. 99 May 99 1 Feb.99 Nov Aug May 98 Feb. 98 Proportion of % % 5 60% 5 60% 50% 4 51% 5 60% 61% % % % % % % % 1 1% 1% 1% 1 2 1% 1 20% % 1 1 1% 1 1% 1% 1 1 1% 1 21% % 1 1 1% 1 0% 0% 1% 1% 0% 1% 1 1% 1% 1% 1% 0% 0% 0% 1% 0% 0% 1% 1% 1% 0% 1% 1% 1% 0% 0% 1% 1% 0% 0% 1% 0% 1% 1% 0% 0% 1% 0% 0% 1% 0% 1% 0% 0% 1% 0% 0% 1% 0% 1% 1% 0% 0% 1% 1% 1% 0% 1% 1% 0% 1% 0% 1% 1% 1% 1% 1 1% 1% 1% 1% 1% 1% 1% 1% 1% 1% 1% 1% 1% 1% 1% 1% 1% 1% 1% 0% 20% 30% 40% 50% 60% 70% 80% 90% 100% % of Total Litter Items Beach Car park Highway Industrial Recreational Park Residential Retail Shopping Centre Inc CDL - 5c to 10c Sept 08 Revised Sites
65 May.98 Aug. 98 Nov. 98 Feb.99 May.99 Aug. 99 Nov. 99 Feb.00 May.00 Aug.00 Nov.00 Feb.01 May.01 Aug.01 Nov.01 Feb.02 May.02 Nov.02 Feb.03 May.03 Aug.03 Nov.03 Feb.04 May.04 Aug.04 Nov.04 Feb.05 May.05 Aug.05 Nov.05 Feb.06 May.06 Aug.06 Nov.06 Feb.07 May.07 Aug.07 Nov.07 Feb.08 May.08 Aug.08 Nov.08 Feb.09 May.09 Aug.09 Nov.09 Feb.10 May.10 Aug.10 Nov.10 Feb.11 May.11 Aug.11 Nov.11 Volume of items (m3) Volume of Litter Items by Material Type Cigarette butts Glass Illegal dumping Metal Miscellaneous (excluding illegal dumping) Paper/paperboard Plastic Revised Sites Inc CDL - 5c to 10c Sept 08
66 Nov.11 Aug.11 May.11 Feb.11 Nov.10 Aug.10 May.10 Feb.10 Nov.09 Aug.09 May.09 Feb.09 Nov.08 Aug.08 May.08 Feb.08 Nov.07 Aug.07 May.07 Feb.07 Nov.06 Aug.06 May.06 Feb.06 Nov.05 Aug.05 May.05 Feb.05 Nov.04 Aug.04 May.04 Feb.04 Nov.03 Aug.03 May.03 Feb.03 Nov.02 May. 02 Feb.02 Nov.01 Aug.01 May. 01 Feb.01 Nov.00 Aug.00 May. 00 Feb.00 Nov. 99 Aug. 99 May 99 Feb.99 Nov. 98 Aug. 98 May 98 Feb. 98 Proportion of Total Litter Volume by Material Type - Please note that cigarette butts are not included as the volumes of such are consistently negligible % 21% 20% % 20% % % 30% 31% 3 40% % 41% % % 20% % % % % % 20% 30% 40% 50% 60% 70% 80% 90% 100% % % of litter items 21% 20% 2 20% % % 1 51% % % % % % 3 30% 30% % 20% Glass Illegal dumping Metal Miscellaneous (excluding illegal dumping) Paper/paperboard Plastic
67 Feb. 98 May 98 Aug. 98 Nov. 98 Feb.99 May 99 Aug. 99 Nov. 99 Feb.00 May. 00 Aug.00 Nov.00 Feb.01 May. 01 Aug.01 Nov.01 Feb.02 May. 02 Nov.02 Feb.03 May.03 Aug.03 Nov.03 Feb.04 May.04 Aug.04 Nov.04 Feb.05 May.05 Aug.05 Nov.05 Feb.06 May.06 Aug.06 Nov.06 Feb.07 May.07 Aug.07 Nov.07 Feb.08 May.08 Aug.08 Nov.08 Feb.09 May.09 Aug.09 Nov.09 Feb.10 May.10 Aug.10 Nov.10 Feb.11 May.11 Aug.11 Nov Volume of litter items (m3) Degrees Celsius Weather Temperature and Total Volume of Litter Items Revised Sites Inc CDL - 5c to 10c Sept Volume Average Temperature
68 Feb.98 May.98 Aug.98 Nov.98 Feb.99 May.99 Aug.99 Nov.99 Feb.00 May.00 Aug.00 Nov.00 Feb.01 May.01 Aug.01 Nov.01 Feb.02 May.02 Nov.02 Feb.03 May.03 Aug.03 Nov.03 Feb.04 May.04 Aug.04 Nov.04 Feb.05 May.05 Aug.05 Nov.05 Feb.06 May.06 Aug.06 Nov.06 Feb.07 May.07 Aug.07 Nov.07 Feb.08 May.08 Aug.08 Nov.08 Feb.09 May.09 Aug.09 Nov.09 Feb.10 May.10 Aug.10 Nov.10 Feb.11 May.11 Aug.11 Nov.11 Volume (m3) Total Volume (Cubic Metres) of Litter Revised Sites Inc CDL - 5c to 10c Sept
69 Weighted Tracking Graphs - Items
70 Feb.98 May.98 Aug.98 Nov.98 Feb.99 May.99 Aug.99 Nov.99 Feb.00 May.00 Aug.00 Nov.00 Feb.01 May.01 Aug.01 Nov.01 Feb.02 May.02 Nov.02 Feb.03 May.03 Aug.03 Nov.03 Feb.04 May.04 Aug.04 Nov.04 Feb.05 May.05 Aug.05 Nov.05 Feb.06 May.06 Aug.06 Nov.06 Feb.07 May.07 Aug.07 Nov.07 Feb.08 May.08 Aug.08 Nov.08 Feb.09 May.09 Aug.09 Nov.09 Feb.10 May.10 Aug.10 Nov.10 Feb.11 May.11 Aug.11 Nov.11 Total Litter - Number of Items - Weighted Trendline
71 Feb. 98 May.98 Aug. 98 Nov. 98 Feb.99 May.99 Aug. 99 Nov. 99 Feb.00 May.00 Aug.00 Nov.00 Feb.01 May.01 Aug.01 Nov.01 Feb.02 May.02 Nov.02 Feb.03 May.03 Aug.03 Nov.03 Feb.04 May.04 Aug.04 Nov.04 Feb.05 May.05 Aug.05 Nov.05 Feb.06 May.06 Aug.06 Nov.06 Feb.07 May.07 Aug.07 Nov.07 Feb.08 May.08 Aug.08 Nov.08 Feb.09 May.09 Aug.09 Nov.09 Feb.10 May.10 Aug.10 Nov.10 Feb.11 May.11 Aug.11 Nov Number of litter items Degrees Celsius Weather Temperature and Total Number of Litter Items - Weighted Weighted Average Temperature
72 Nov.11 Aug.11 May.11 Feb.11 Nov.10 Aug.10 May.10 Feb.10 Nov.09 Aug.09 May.09 Feb.09 Nov.08 Aug.08 May.08 Feb.08 Nov.07 Aug.07 May.07 Feb.07 Nov.06 Aug.06 May.06 Feb.06 Nov.05 Aug.05 May.05 Feb.05 Nov.04 Aug.04 May.04 Feb.04 Nov.03 Aug.03 May.03 Feb.03 Nov.02 May.02 Feb.02 Nov.01 Aug.01 May.01 Feb.01 Nov.00 Aug.00 May.00 Feb.00 Nov. 99 Aug. 99 May.99 Feb.99 Nov. 98 Aug. 98 May.98 Feb. 98 Number of Litter Items by Material Type - Weighted Number of Items Cigarette butts - weighted Glass - weighted Metal - weighted Miscellaneous - weighted Paper/paperboard - weighted Plastic - weighted
73 Nov.11 Aug.11 May.11 Feb.11 Nov.10 Aug.10 May.10 Feb.10 Nov.09 Aug.09 May.09 Feb.09 Nov.08 Aug.08 May.08 Feb.08 Nov.07 Aug.07 May.07 Feb.07 Nov.06 Aug.06 May.06 Feb.06 Nov.05 Aug.05 May.05 Feb.05 Nov.04 Aug.04 May.04 Feb.04 Nov.03 Aug.03 May.03 Feb.03 Nov.02 May.02 Feb.02 Nov.01 Aug.01 May.01 Feb.01 Nov.00 Aug.00 May.00 Feb.00 Nov. 99 Aug. 99 May.99 Feb.99 Nov. 98 Aug. 98 May.98 Feb Number of Litter Items by Site Type - Weighted Number of Litter Items Beach - weighted Car park - weighted Highway - weighted Industrial - weighted Recreational Park - weighted Residential - weighted Retail - weight Shopping Centre - weighted
74 Proportion of Total Litter by Site Type - Weighted Nov.11 Aug.11 May.11 Feb.11 Nov.10 Aug.10 May.10 Feb.10 Nov.09 Aug.09 May.09 Feb.09 Nov.08 Aug.08 May.08 Feb.08 Nov.07 Aug.07 May.07 Feb.07 Nov.06 Aug.06 May.06 Feb.06 Nov.05 Aug. 05 May.05 Feb.05 Nov.04 Aug. 04 May.04 Feb.04 Nov.03 Aug.03 May.03 Feb.03 Nov.02 May.02 Feb.02 Nov.01 Aug.01 May.01 Feb.01 Nov.00 Aug.00 May.00 Feb.00 Nov. 99 Aug. 99 May 99 Feb.99 Nov. 98 Aug. 98 May 98 Feb. 98 Proportion of % 1 20% 1 20% % % % % % % % % 2 30% % % 2 30% 21% 20% % 2 20% % % 1 0% 20% 30% 40% 50% 60% 70% 80% 90% 100% % of Total Litter Items Beach - weighted Car park - weighted Highway - weighted Industrial - weighted Recreational Park - weighted Residential - weighted Retail - weighted Shopping Centre - weighted
75 May.98 Aug.98 Nov.98 Feb.99 May.99 Aug.99 Nov.99 Feb.00 May.00 Aug.00 Nov.00 Feb.01 May.01 Aug.01 Nov.01 Feb.02 May.02 Nov.02 Feb.03 May.03 Aug.03 Nov.03 Feb.04 May.04 Aug.04 Nov.04 Feb.05 May.05 Aug.05 Nov.05 Feb.06 May.06 Aug.06 Nov.06 Feb.07 May.07 Aug.07 Nov.07 Feb.08 May.08 Aug.08 Nov.08 Feb.09 May.09 Aug.09 Nov.09 Feb.10 May.10 Aug.10 Nov.10 Feb.11 May.11 Aug.11 Nov.11 Number of Items Total Number of Cigarette Butts - Weighted Trendline
76 Number of Cigarette Butts by Site Type - Weighted Nov.11 Aug.11 May.11 Feb.11 Nov.10 Aug.10 May.10 Feb.10 Nov.09 Aug.09 May.09 Feb.09 Nov.08 Aug.08 May.08 Feb.08 Nov.07 Aug.07 May.07 Feb.07 Nov.06 Aug.06 May.06 Feb.06 Nov.05 Aug.05 May.05 Feb.05 Nov.04 Aug.04 May.04 Feb.04 Nov.03 Aug.03 May.03 Feb.03 Nov.02 May.02 Feb.02 Nov.01 Aug.01 May.01 Feb.01 Nov.00 Aug.00 May.00 Feb.00 Nov. 99 Aug. 99 May.99 Feb.99 Nov.98 Aug.98 May.98 Feb Number of cigarette butts Beach - weighted Car park - weighted Highway - weighted Industrial - weighted Recreational Park - weighted Residential - weighted Retail - weighted Shopping Centre - weighted
77 Proportion of Total Cigarette Butt Litter at Highway sites & Other sites - Weighted Nov.11 Aug.11 May.11 Feb.11 Nov.10 Aug.10 May.10 Feb.10 Nov.09 Aug.09 May.09 Feb.09 Nov.08 Aug.08 May.08 Feb.08 Nov.07 Aug.07 May.07 Feb.07 Nov.06 Aug.06 May.06 Feb.06 Nov.05 Aug.05 May.05 Feb.05 Nov.04 Aug.04 May.04 Feb.04 Nov.03 Aug.03 May.03 Feb.03 Nov.02 May.02 Feb.02 Nov.01 Aug.01 May.01 Feb.01 0% % % 2 30% % 2 20% % 2 1 0% 0% Nov.00 Aug.00 0% May.00 0% Feb.00 Nov. 99 0% Aug. 99 May.99 Feb.99 Nov.98 Aug.98<1% May.98 Feb % % % % % 91% % % 9 100% 100% 100% 9 100% % 9 9 0% 20% 40% 60% 80% 100% % of total cigarette butt litter Highway sites - weighted Other sites - weighted
78 Feb.98 May.98 Aug.98 Nov.98 Feb.99 May.99 Aug.99 Nov.99 Feb.00 May.00 Aug.00 Nov.00 Feb.01 May.01 Aug.01 Nov.01 Feb.02 May.02 Nov.02 Feb.03 May.03 Aug.03 Nov.03 Feb.04 May.04 Aug.04 Nov.04 Feb.05 May.05 Aug.05 Nov.05 Feb.06 May.06 Aug.06 Nov.06 Feb.07 May.07 Aug.07 Nov.07 Feb.08 May.08 Aug.08 Nov.08 Feb.09 May.09 Aug.09 Nov.09 Feb.10 May.10 Aug.10 Nov.10 Feb.11 May.11 Aug.11 Nov Number of items CDL and Non-CDL Beverage Items Within Material Categories - Weighted Total CDL glass - weighted Total CDL metal - weighted Total CDL paperboard - weighted Total CDL Plastic - weighted
79 Top 20 Litter Items - Highest Counts - Weighted CIGARETTE BUTTS - Cigarette butts PAPER/PAPERBOARD - Other paper (including tissues) PLASTIC - Other plastic PLASTIC - Snack bags & confectionery wrappers METAL - Metal bottle tops and can pull rings PLASTIC - Plastic bottle tops PLASTIC - Straws GLASS - Other glass PLASTIC - Take away & cups METAL - Other foil PAPER/PAPERBOARD - Packages & boxes PAPER/PAPERBOARD - Cups/take away containers METAL - Metal pieces MISCELLANEOUS - Clothing & materials MISCELLANEOUS - Rubber pieces (not tyres) PLASTIC - Sacks - sheeting - other bags PAPER/PAPERBOARD - Cigarette packets MISCELLANEOUS - Construction materials PAPER/PAPERBOARD - Paper bags PLASTIC - Packing tape & straps Number of Litter Items Nov.11 Aug.11 May.11 Feb.11 Nov
80 Weighted Tracking Graphs - Volumes
81 Top 20 Litter Items by Volume - Weighted MISCELLANEOUS - Illegal dumping PAPER/PAPERBOARD - Cups/take away containers PLASTIC - Containers, domestic type PAPER/PAPERBOARD - Newspapers & magazines MISCELLANEOUS - Construction materials PLASTIC - Take away & cups GLASS - Beer, all colours of glass, <750ml METAL - Flav. water/soft drink, (carbonated), all sizes PAPER/PAPERBOARD - Cigarette packets METAL - Foil take away MISCELLANEOUS - Disposable nappies PAPER/PAPERBOARD - Packages & boxes METAL - Beer, aluminium, all types, all sizes PAPER/PAPERBOARD - Cartons, flavoured milk, <1 litre PLASTIC - Flav. milk, <1 litre PLASTIC - Plain water (carbonated or non-carb), <1 litre PLASTIC - Flav. water/soft drink (carbonated), 1 litre+ PLASTIC - Plain water (carbonated or non-carb), 1 litre+ PLASTIC - White milk, all sizes PAPER/PAPERBOARD - Junk mail/free circulars Volume of Litter Items (m3) Nov.11 Aug.11 May.11 Feb.11 Nov
82 Volume of Litter by Site Type - Weighted Nov.11 Aug.11 May.11 Feb.11 Nov.10 Aug.10 May.10 Feb.10 Nov.09 Aug.09 May.09 Feb.09 Nov.08 Aug.08 May.08 Feb.08 Nov.07 Aug.07 May.07 Feb.07 Nov.06 Aug.06 May.06 Feb.06 Nov.05 Aug.05 May.05 Feb.05 Nov.04 Aug.04 May.04 Feb.04 Nov.03 Aug.03 May.03 Feb.03 Nov.02 May.02 Feb.02 Nov.01 Aug.01 May.01 Feb.01 Nov.00 Aug.00 May.00 Feb.00 Nov.99 Aug.99 May.99 Feb.99 Nov.98 Aug.98 May.98 Feb Volume of litter (m3) Beach - weighted Car park - weighted Highway - weighted Industrial - weighted Recreational Park - weighted Residential - weighted Retail - weighted Shopping Centre - weighted
83 Proportion of Litter Volume in Total Litter Stream by Site Type - Weighted Nov.11 Aug.11 May.11 Feb.11 Nov.10 Aug.10 May.10 Feb.10 Nov.09 Aug.09 May.09 Feb.09 Nov.08 Aug.08 May.08 Feb.08 Nov.07 Aug.07 May.07 Feb.07 Nov.06 Aug.06 May.06 Feb.06 Nov.05 Aug.05 May.05 Feb.05 Nov.04 Aug. 04 May.04 Feb.04 Nov.03 Aug.03 May.03 Feb.03 Nov.02 May.02 Feb.02 Nov.01 Aug.01 May.01 Feb.01 Nov.00 Aug.00 May.00 Feb.00 Nov. 99 Aug. 99 May 99 Feb.99 Nov. 98 Aug. 98 May 98 Feb. 98 Proportion of sites 1% 1% 1% 1% 1% 0% 1% 1% 0% 1% 1% 1% 1% 1% 1% 1% % % 51% % 4 60% % % 51% 5 50% % % % % % 2 21% % 3 1% 2 31% 1% % 1% 1% 2 1% 1% 2 1% 20% 1% 1% 1 1% 1% 1 1% 1% 0% 1% % 1 1 1% 1% 1% 1% 1% 1% 1% 1 1% 1% 1% 1% 1% 1% 1% 1% 1 1% 1 1% 1% 1% 1% 1% 1% 0% 0% 1% 1% 1% 1% 1% 1% 1% 1% 1% 1% 1% 1% 1% 1% 1% 1% 1% 1% 1% 1% 1% 1% 0% 0% 1% 1% 1% 1% 1% 1 1% 1% 1% 1% 1% 30% % 2 1% 21% 1% 0% 2 1% 1 0% 20% 30% 40% 50% 60% 70% 80% 90% 100% % of Total Litter Items Beach - weighted Car park - weighted Highway - weighted Industrial - weighted Recreational Park - weighted Residential - weighted Retail - weighted Shopping Centre - weighted
84 Feb. 98 May.98 Aug. 98 Nov. 98 Feb.99 May.99 Aug. 99 Nov. 99 Feb.00 May.00 Aug.00 Nov.00 Feb.01 May.01 Aug.01 Nov.01 Feb.02 May.02 Nov.02 Feb.03 May.03 Aug.03 Nov.03 Feb.04 May.04 Aug.04 Nov.04 Feb.05 May.05 Aug.05 Nov.05 Feb.06 May.06 Aug.06 Nov.06 Feb.07 May.07 Aug.07 Nov.07 Feb.08 May.08 Aug.08 Nov.08 Feb.09 May.09 Aug.09 Nov.09 Feb.10 May.10 Aug.10 Nov.10 Feb.11 May.11 Aug.11 Nov.11 Volume of items (m3) Volume of Litter Items by Material Type - Weighted Cigarette butts - weighted Glass - weighted Illegal dumping - weighted Metal - weighted Miscellaneous (excluding illegal dumping) - weighted Paper/paperboard - weighted Plastic - weighted
85 Feb. 98 May 98 Aug. 98 Nov. 98 Feb.99 May 99 Aug. 99 Nov. 99 Feb.00 May. 00 Aug.00 Nov.00 Feb.01 May. 01 Aug.01 Nov.01 Feb.02 May. 02 Nov.02 Feb.03 May.03 Aug.03 Nov.03 Feb.04 May.04 Aug.04 Nov.04 Feb.05 May.05 Aug.05 Nov.05 Feb.06 May.06 Aug.06 Nov.06 Feb.07 May.07 Aug.07 Nov.07 Feb.08 May.08 Aug.08 Nov.08 Feb.09 May.09 Aug.09 Nov.09 Feb.10 May.10 Aug.10 Nov.10 Feb.11 May.11 Aug.11 Nov.11 Volume of litter items (m 3 ) Degrees Celsius Weather Temperature and Total Volume of Litter Items - Weighted Volume - weighted Average Temperature
86 Feb.98 May.98 Aug.98 Nov.98 Feb.99 May.99 Aug.99 Nov.99 Feb.00 May.00 Aug.00 Nov.00 Feb.01 May.01 Aug.01 Nov.01 Feb.02 May.02 Nov.02 Feb.03 May.03 Aug.03 Nov.03 Feb.04 May.04 Aug.04 Nov.04 Feb.05 May.05 Aug.05 Nov.05 Feb.06 May.06 Aug.06 Nov.06 Feb.07 May.07 Aug.07 Nov.07 Feb.08 May.08 Aug.08 Nov.08 Feb.09 May.09 Aug.09 Nov.09 Feb.10 May.10 Aug.10 Nov.10 Feb.11 May.11 Aug.11 Nov.11 Volume (m3) Total Volume (Cubic Metres) of Litter - Weighted
87 Appendix 2: Data Collection Form
88 - 86 -
89 - 87 -
90 - 88 -
Litter Strategy Monitoring Wave 62 August 2013 Report
 Strategies, Marketing and Social Research Head Office: 259 Glen Osmond Rd, Frewville SA 5063 Tel: 08 8433 0200 Fax: 08 8338 2360 research@mcgregor.com.au www.mcgregor.com.au Litter Strategy Monitoring
N NE E SE S SW W NW N/A. onshore offshore sideshore side-on side-off
 COASTAL SITE SURVEY Survey Guidelines: Complete one Coastal Litter survey form per site and one transect data form for each transect at the site. Record all coordinates in WGS84 datum only. Minimum of
An Investigation Into The Effect Of Slack Fill In Chip Packets SCIENTIFIC REPORT
 An Investigation Into The Effect Of Slack Fill In Chip Packets SCIENTIFIC REPORT Background Research: Many people around the world treat themselves to a packet of chips when wanting a quick snack, but
REPORT Meetillig Date: June 6, 2013 Waste Management Committee
 REPORT Meetillig Date: June 6, 2013 Waste Management Committee DATE: May 7,201 3 REPORT TITLE: ADDITION OF MIXED RIGID PLASTICS TO THE BLUE BOX RECYCLING PROGRAM FROM: Dan Labrecque, Commissioner of Public
POMS Science Summer Challenge
 POMS Science Summer Challenge The true essence of science is the relentless and unwavering need to know why. With your inquisitiveness, you can learn to do science. There are five basic skills you need
Information on the Solid Waste Services commencing February 2014:
 Information on the Solid Waste Services commencing February 2014: Q: What is the new kerbside collection service and when does it start? A: Buller District Council is introducing a new kerbside collection
Report: 2016 International Coastal Cleanup by VESS
 Report: 2016 International Coastal Cleanup by VESS In this the 31st year of the ICC, VESS again joined in the global effort to rid our oceans of debris. Following on from Vanuatu s first events in 2015,
Assessing Permeation of Gas through Polyethylene Pipe
 Assessing Permeation of Gas through Polyethylene Pipe REPORTS Introduction Gas Distribution Networks (GDNs) regularly review the Shrinkage and Leakage model (SLM) to further enhance the reporting of Shrinkage
A REVIEW OF AGE ADJUSTMENT FOR MASTERS SWIMMERS
 A REVIEW OF ADJUSTMENT FOR MASTERS SWIMMERS Written by Alan Rowson Copyright 2013 Alan Rowson Last Saved on 28-Apr-13 page 1 of 10 INTRODUCTION In late 2011 and early 2012, in conjunction with Anthony
Reduction of Speed Limit at Approaches to Railway Level Crossings in WA. Main Roads WA. Presenter - Brian Kidd
 Australasian College of Road Safety Conference A Safe System: Making it Happen! Melbourne 1-2 September 2011 Reduction of Speed Limit at Approaches to Railway Level Crossings in WA Radalj T 1, Kidd B 1
Loughborough University Travel Planning
 Document Ti tle Client Name Loughborough University Travel Planning Loughborough University Travel Plan Executive Summary 2015-2020 23 December 2015 Loughborough University Travel Planning Project no:
National monitoring of beach litter in Denmark 2018 Amounts and composition of marine litter on reference beaches
 National monitoring of beach litter in Denmark 2018 Amounts and composition of marine litter on reference beaches Research note from DCE - Danish Centre for Environment and Energy December 2018 Louise
Review of Considerations and Requirements for Automated Enforcement
 Review of Considerations and Requirements for Automated Enforcement Summary: The purpose of this report is to provide information related to expanding the use of automated enforcement in the City of Toronto,
GD 0043/18 ACTIVE TRAVEL STRATEGY
 GD 0043/18 ACTIVE TRAVEL STRATEGY 2018-2021 May 2018 Minister s Introduction There is strong evidence that regular physical activity reduces the risk of a range of health conditions. The best way to increase
Students measure the change in pressure by varying the volume of trapped air in a syringe while:
 How Does a Trapped Gas Behave? Teacher Information Objective Students investigate the effect of changes in the volume of a confined gas on pressure at constant temperature. Using the pressure sensor, students
TARANAKI VISITOR STATISTICS SEPTEMBER 2017
 TARANAKI VISITOR STATISTICS SEPTEMBER 217 Taranaki Visitor Statistics At a Glance: Year ending September 217 For the 12 months ending September 217 there were 38,288 visitors who stayed in commercial accommodation
Speed Limit Policy Isle of Wight Council
 APPENDIX B Speed Limit Policy Isle of Wight Council 2009 Contents Section 1 Introduction 1.1 Links with the Local Transport Plan Section 2 Speed Limits on Urban Roads and Residential Areas 2.1 20mph Limits
Safety and Participation Policies 2017
 Safety and Participation Policies 2017 POLICY AND PROCEDURE CHANGES From the Australian Rugby Strategic Plan 2016-2020, under the Pillar Make Rugby a Game for All, Australian Rugby is committed to ensuring
Investment in Active Transport Survey
 Investment in Active Transport Survey KEY FINDINGS 3 METHODOLOGY 7 CYCLING INFRASTRUCTURE 8 Riding a bike 9 Reasons for riding a bike 9 Mainly ride on 10 Comfortable riding on 10 Rating of cycling infrastructure
WILMAPCO Public Opinion Survey Summary of Results
 Wilmington Area Planning Council WILMAPCO Public Opinion Survey Summary of Results Prepared by: 2955 Valmont Road, Suite 300 Boulder, Colorado 80301 t: 303-444-7863 f: 303-444-1145 www.n-r-c.com Table
Australian Rules Football
 Australian Rules Football Characteristics of the Sport Overview Australian Rules Football is played predominantly by males with the major league, the Australian Football league, having developed into a
REPORT ON RED-LIGHT MONITORING SYSTEMS
 REPORT ON RED-LIGHT TRAFFIC CONTROL SIGNAL MONITORING SYSTEMS Prepared by the New Jersey Department of Transportation November 2011 Executive Summary Public Law 2007, Chapter 348 (P.L. 2007, c.348), signed
At each type of conflict location, the risk is affected by certain parameters:
 TN001 April 2016 The separated cycleway options tool (SCOT) was developed to partially address some of the gaps identified in Stage 1 of the Cycling Network Guidance project relating to separated cycleways.
Participation in Structured Swimming Lessons : 0-13 Years
 Participation in Structured Swimming Lessons : 0-13 Years Nov 2017 Booking data kindly supplied by users of EXECUTIVE SUMMARY This report reviews the participation of young people aged 0 to 13 years who
PERSONALISED TRAVEL PLANNING IN MIDLETON, COUNTY CORK
 PERSONALISED TRAVEL PLANNING IN MIDLETON, COUNTY CORK Elaine Brick Principal Transport Planner AECOM Abstract Smarter Travel funding was awarded to the Chartered Institute of Highways and Transportation
Road Safety Audits of Traffic Signal Schemes
 Road Safety Audits of Traffic Signal Schemes David Prior Waterman Infrastructure & Environment Abstract This paper examines the following elements of Road Safety Audits (RSAs) of traffic signal schemes:
A Dialogue on Handguns and Assault Weapons
 Reducing Violent Crime: A Dialogue on Handguns and Assault Weapons Engagement Paper Context The Government of Canada has committed to get handguns and assault rifles off our streets. In support of this,
Safety Monitor Requirements. September 2012
 Introduction This document sets out Safety Monitors for the 2012/13 winter, pursuant to National Grid s obligations under the Uniform Network Code (UNC), Section Q. Safety Monitors were introduced in 2004
Summary of bicycle helmet law results in Western Australia
 Summary of bicycle helmet law results in Western Australia * All graphs, charts and tables presented in this document are scanned directly from reports published by Western Australia government departments,
1999 On-Board Sacramento Regional Transit District Survey
 SACOG-00-009 1999 On-Board Sacramento Regional Transit District Survey June 2000 Sacramento Area Council of Governments 1999 On-Board Sacramento Regional Transit District Survey June 2000 Table of Contents
Curtin Artificial Reef, Moreton Bay Marine Park Underwater Clean-up Annual Progress Report 31 October 2016
 Curtin Artificial Reef, Moreton Bay Marine Park Underwater Clean-up 205-207 Annual Progress Report 3 October 206 Liz Vang - Project Officer 6 Nov 206 Summary URGQ is ahead of its clean-up commitment and
Increased Onboard Bicycle Capacity Improved Caltrain s Performance in 2009
 Increased Onboard Bicycle Capacity Improved Caltrain s Performance in 2009 February 4, 2010 Prepared by: BIKES ONboard Project San Francisco Bicycle Coalition Prepared by the San Francisco Bicycle Coalition
Huon Archers Inc. Registration number: IA10126
 Huon Archers Inc. Registration number: IA10126 Club Access and Safety Policy Adopted by the Committee on 22 July 2012. Contents Section Page No 1. Purpose... 3 2. Definitions and interpretation... 3 2.1
Delivering the. Strategy 7.0
 7.0 Delivering the Strategy 7.1 Introduction This chapter presents a framework for the delivery of the strategy. Key challenges and opportunities are identified that will have an impact on the successful
Winterborne Houghton Parish Council Application for a Village Speed Limit
 Winterborne Houghton Parish Council Application for a Village Speed Limit Winterborne Houghton Parish Council October 2016 Winterborne Houghton Application for a Village Speed Limit The purpose of this
Competitive Performance of Elite Olympic-Distance Triathletes: Reliability and Smallest Worthwhile Enhancement
 SPORTSCIENCE sportsci.org Original Research / Performance Competitive Performance of Elite Olympic-Distance Triathletes: Reliability and Smallest Worthwhile Enhancement Carl D Paton, Will G Hopkins Sportscience
Planning for tennis in your Local Government Area. A resource from Tennis Australia
 Planning for tennis in your Local Government Area A resource from Tennis Australia Part 1 July 2016 ABOUT THIS RESOURCE This resource forms part of Tennis Australia's Local Government Engagement Program.
Evaluating the Influence of R3 Treatments on Fishing License Sales in Pennsylvania
 Evaluating the Influence of R3 Treatments on Fishing License Sales in Pennsylvania Prepared for the: Pennsylvania Fish and Boat Commission Produced by: PO Box 6435 Fernandina Beach, FL 32035 Tel (904)
BIOLOGICAL MAGNIFICATION THE TRAGEDY OF PLASTIC WASTE
 BIOLOGICAL MAGNIFICATION THE TRAGEDY OF PLASTIC WASTE 20 th SGRA SUSTAINABLE SHARED GROWTH SEMINAR FEBRUARY 10, 2016 ATENEO DE MANILA UNIVERSITY Presented by EnP Grace P. Sapuay President Solid Waste Management
April 7, Prepared for: The Caribbean Disaster Emergency Response Agency Prepared by: CEAC Solutions Co. Ltd.
 April 7, 2006 Prepared for: The Caribbean Disaster Emergency Response Agency Prepared by: Introduction CEAC Solutions Co. Ltd was commissioned in May 2005 to prepare coastal beach erosion hazard maps for
Osmosis - dependence of the osmotic pressure on the concentration (Item No.: P )
") Osmosis - dependence of the osmotic pressure on the concentration (Item No.: P1135700) Curricular Relevance Area of Expertise: Biology Education Level: University Topic: Plant Physiology / Botany Subtopic:
Osmosis - dependence of the osmotic pressure on the concentration (Item No.: P1135700) Curricular Relevance Area of Expertise: Biology Education Level: University Topic: Plant Physiology / Botany Subtopic:
(Received 9 September 1940)
") 257 J. Physiol. (I 94I) 99, 257-264 6I2.2II A METHOD OF RECORDING THE RESPIRATION BY J. H. GADDUM From the College of the Pharmaceutical Society, 17 Bloomsbury Square, London, W.C. 2 (Received 9 September
257 J. Physiol. (I 94I) 99, 257-264 6I2.2II A METHOD OF RECORDING THE RESPIRATION BY J. H. GADDUM From the College of the Pharmaceutical Society, 17 Bloomsbury Square, London, W.C. 2 (Received 9 September
Siren Fleet Rates & Inclusions
 Siren Fleet Rates & Inclusions 2017 2019 Euro Fiji Siren 7 and 10 nights to the Bligh Waters, Namena, Gau & Taveuni Dates Retail Rates* 7 - nights 10 - nights 2017-2019 Twin / Double Cabin 2995 EUR 4150
4 Ridership Growth Study
 Clause 4 in Report No. 15 of Committee of the Whole was adopted, without amendment, by the Council of The Regional Municipality of York at its meeting held on November 16, 2017. 4 Ridership Growth Study
LIVERPOOL TRANSPORTATION MODELING TECHNICAL MEMO MAY 2009
 LIVERPOOL TRANSPORTATION MODELING TECHNICAL MEMO MAY 2009 Syracuse Metropolitan Transportation Council 100 Clinton Square 126 N. Salina Street, Suite 100 Syracuse, NY 13202 Telephone (315) 422-5716; Fax
Honors Physiology The Respiratory System
 Honors Physiology Name: The Respiratory System Objective: To create a model of our respiratory system, understanding the relationship between structure and function. Warm Up Questions: 1. What is the function
A New Survey Method to Determine Plastic Rubbish in Port Phillip Bay,
 A New Survey Method to Determine Rubbish in Port Phillip Bay, Dr Ross Headifen, Ramona Headifen MSW BeachPatrol Australia Abstract This is the preliminary report of a daily horizontal sub tide line survey
(2) but does not include a shaft, trench or tunnel that is a mine or is part of the workings of a mine.
 but does not include a shaft, trench or tunnel that is a mine or is part of the workings of a mine.") Health and Safety Procedure - Confined Spaces Section 1 - Background and Purpose (1) Confined spaces are, for the purposes of this procedure, defined as the following which is the definition under the
Health and Safety Procedure - Confined Spaces Section 1 - Background and Purpose (1) Confined spaces are, for the purposes of this procedure, defined as the following which is the definition under the
LPG SAFETY INFORMATION. Kwik-Gas. Safety Manual. Less talk more energy
 LPG SAFETY INFORMATION Kwik-Gas Safety Manual Less talk more energy CONTENTS Introduction to the Kwik-Gas program 2 Emergency and contact information 2 Emergency procedures 3 First aid Instructions for
About Clean Ocean Action s Beach Sweeps
 Clean Ocean Action 018 Corporate Beach Sweeps Annual Report About Clean Ocean Action s Beach Sweeps Clean Ocean Action (COA) is a coalition of 115 participating organizations working to improve and protect
Traffic Impact Analysis Chatham County Grocery Chatham County, NC
 Chatham County Grocery Chatham County, NC TABLE OF CONTENTS 1. INTRODUCTION... 1 1.1. Location and Study Area... 1 1.2. Proposed Land Use and Access... 2 1.3. Adjacent Land Uses... 2 1.4. Existing ways...
Atlantic States Marine Fisheries Commission
 Atlantic States Marine Fisheries Commission Summer Flounder, Scup, and Black Sea Bass Management Board Conference Call Draft Agenda May 22, 2017 12:30 2 p.m. Webinar Link: https://attendee.gotowebinar.com/register/499991200830679809
NUMERICAL INVESTIGATION OF THE FLOW BEHAVIOUR IN A MODERN TRAFFIC TUNNEL IN CASE OF FIRE INCIDENT
 - 277 - NUMERICAL INVESTIGATION OF THE FLOW BEHAVIOUR IN A MODERN TRAFFIC TUNNEL IN CASE OF FIRE INCIDENT Iseler J., Heiser W. EAS GmbH, Karlsruhe, Germany ABSTRACT A numerical study of the flow behaviour
Fieldstone Pond Homeowners Association
 Fieldstone Pond Homeowners Association To: Fieldstone Pond Homeowners Date: April 28, 2017 Subject: Recreation Facilities Rules and Regulations The pool will open on Saturday, May 27 th and remain open
Introduction to the NRA Design Manual for Roads and Bridges
 Volume 0 Section 0 Part A 0.0.A Introduction to the NRA Design Manual for Roads and Bridges July 2011 St. Martin s House, Waterloo Road, Dublin 4. Tel:+353 1 660 2511 Fax +353 1 668 0009 Email : info@nra.ie
Dribbling with Long Implement
 Dribbling with Long Implement Dribbling with long implement involves controlling an object with an implement (usually a stick) and travelling with it. It is a common skill in games like hockey and floorball.
Speed Data Analysis. Monk Fryston Parish Council. Traffic Speed data Statistical Analysis 30th. November 2017 to 6th December 2017.
 Traffic Speed data Statistical Analysis 30th November 2017 to 6th December 2017 and 14th December 2017 to 21st December 2017 Monk Fryston Parish Council December 2017 Speed Data Analysis Monk Fryston Parish
WORLD RECORD DEMOLITION DERBY NOMINATION FORM Saturday 21st April 2018
 WORLD RECORD DEMOLITION DERBY NOMINATION FORM Saturday 21st April 2018 ENTRANT S NAME CAR NO: (Entity to which prize monies are awarded) ENTRANT S ADDRESS STATE: E-MAIL ADDRESS ENTRANT S PHONE NO: CREDIT
Chicane Schemes. Traffic Advisory Leaflet 12/97 December Introduction
 Traffic Advisory Leaflet 12/97 December 1997 Chicane Schemes Introduction Traffic Advisory Leaflet 9/94 "Horizontal Deflections" reported on the results of track trials carried out by the Transport Research
Starting the TLR Performance brand gave me the fantastic opportunity to contribute to, and make a living out of a sport that I love.
 About the Author With 30 years experience in cycling and triathlon, Colin Leeson is a leading authority in affordable, quality performance components for the cycling and triathlon industry. Colin is the
City of Perth Cycle Plan 2029
 Bicycling Western Australia s response City of Perth Cycle Plan 2029 2012-2021 More People Cycling More Often ABOUT BICYCLING WESTERN AUSTRALIA Bicycling Western Australia is a community based, not-for-profit
PUBLISHED PROJECT REPORT PPR850. Optimisation of water flow depth for SCRIM. S Brittain, P Sanders and H Viner
 PUBLISHED PROJECT REPORT PPR850 Optimisation of water flow depth for SCRIM S Brittain, P Sanders and H Viner Report details Report prepared for: Project/customer reference: Copyright: Highways England,
Page 1
 Contents: 1. Thrust and Pressure 2. Pressure in Fluids 3. Buoyancy 4. Why objects sink or Float when placed on surface of water? 5. Archimedes Principle 6. Relative Density Learning Objectives: The students
Los Angeles District 4 Data Analysis Report
 Los Angeles District 4 Data Analysis Report January 218 Dixon Resources Unlimited Commissioned by: Los Angeles District 4 Council Office Table of Contents Introduction 4 Project Background 4 Data Collection:
Operational Policy. Queensland Parks and Wildlife Service. Mountain biking in QPWS managed areas. Visitor Management. 1 Purpose
 Queensland Parks and Wildlife Service Operational Policy Visitor Management Mountain biking in QPWS managed areas Operational policies provide a policy direction or set operational standards for day-to-day
Bus and Transit Lane Review Update
 Board Meeting / 25 February 2013 Agenda Item no.8(i) Bus and Transit Lane Review Update Glossary Auckland Transport New Zealand Transport Agency Transit Two Transit Three (AT) (NZTA) (T2) (T3) Executive
2.0 Management Systems and Documentation
 SHE Rules BOW142.3 1.0 Introduction This document details the safety, health and environment rules that apply to anyone accessing Arqiva sites and describes the standards of performance expected. This
SAMPLE EVALUATION ONLY
 TopiC 1 Numeracy 1 1.1 Overview Why learn this? Understanding numeracy helps us make sense of mathematical ideas and how they relate to everyday life. Numeracy includes counting, addition, subtraction,
PORTS AUSTRALIA. PRINCIPLES FOR GATHERING AND PROCESSING HYDROGRAPHIC INFORMATION IN AUSTRALIAN PORTS (Version 1.5 November 2012)
") PORTS AUSTRALIA PRINCIPLES FOR GATHERING AND PROCESSING HYDROGRAPHIC INFORMATION IN AUSTRALIAN PORTS (Version 1.5 November 2012) PREFACE These Principles have been prepared by the Hydrographic Surveyors
PORTS AUSTRALIA PRINCIPLES FOR GATHERING AND PROCESSING HYDROGRAPHIC INFORMATION IN AUSTRALIAN PORTS (Version 1.5 November 2012) PREFACE These Principles have been prepared by the Hydrographic Surveyors
OHRP Guidance on Written IRB Procedures
 Office for Human Research Protections (OHRP) Department of Health and Human Services Date: OHRP Guidance on Written IRB Procedures Scope: This document outlines the required elements of written Institutional
THE IMPORTANCE OF SUCTION LINES
 THE IMPORTANCE OF SUCTION LINES Analysis and connection to compressors Unicla Cat. No. B1801 Copyright 2018 All rights reserved No part of this document shall be reproduced in whole or in part without
WHAT CAN WE LEARN FROM COMPETITION ANALYSIS AT THE 1999 PAN PACIFIC SWIMMING CHAMPIONSHIPS?
 WHAT CAN WE LEARN FROM COMPETITION ANALYSIS AT THE 1999 PAN PACIFIC SWIMMING CHAMPIONSHIPS? Bruce Mason and Jodi Cossor Biomechanics Department, Australian Institute of Sport, Canberra, Australia An analysis
Collision Site Investigation - Bodenham By-Pass Background
 Collision Site Investigation - Bodenham By-Pass Background The junction of the C12 and A338 was the subject of a Local Safety Scheme (LSS) in 2011. Analysation of the collisions at the time revealed the
NORTHBRIDGE OVAL WINTER SEASON 2013 MANAGEMENT PLAN
 NORTHBRIDGE OVAL WINTER SEASON 2013 MANAGEMENT PLAN Background This Management Plan has been prepared to satisfy Council s requirement for a Plan to manage use for the 2013 Winter Sports Season. It is
Temporary Vehicle Restraint System Policy
 Temporary Vehicle Restraint System Policy Prepared By; J Wilkinson H&S Manager, Civils Prepared for: Installation of TVRS on all triio highways projects including JV s. Page 1 of 8 Contents 1.0 Introduction
Health and Safety Inspection Procedure
 Template v4 WILTSHIRE POLICE FORCE PROCEDURE Health and Safety Inspection Procedure Effective from: 25.03.2012 Last Review Date: 10.05.2015 Version: 2.0 Next Review Date: 10.05.2018 TABLE OF CONTENTS PROCEDURE
Bottle Rocket Launcher P4-2000
 WWW.ARBORSCI.COM Bottle Rocket Launcher P4-2000 BACKGROUND: The Bottle Rocket Launcher allows for the exploration of launching rockets using commonly available materials such as plastic soda bottles and
Strategies to Promote the Availability of Affordable Healthy Food and Beverages
 Strategies to Promote the Availability of Affordable Healthy Food and Beverages CDC Recommended Strategies and Measurements Strategy #1: Communities Should Increase Availability of Healthier Food and Beverage
Emerging Crash Trend Analysis. Mark Logan Department of Main Roads, Queensland. Patrick McShane Queensland Transport
 Emerging Crash Trend Analysis Mark Logan Department of Main Roads, Queensland Patrick McShane Queensland Transport The authors would like to acknowledge the assistance of Queensland Transport's Data Analysis
Roundabouts in Edmonton - A Comparison to the State-of-the-Art
 Roundabouts in Edmonton - A Comparison to the State-of-the-Art Authors: Carl Clayton, P.Eng. P.E. PTOE Stantec Consulting Ltd. Chuan Kua, P.Eng. City of Edmonton, Transportation and Streets Brice Stephenson,
INTERNATIONAL GOLF TRAVEL MARKET 2017
 INTERNATIONAL GOLF TRAVEL MARKET 2017 EUROPEAN GOLF TOURISM TRENDS & SPOTLIGHT ON FRANCE ORGANISED BY REED TRAVEL EXHIBITIONS 15/3/1815/3/18 IGTM 2017 EUROPEAN GOLFER SURVEY Background: With the partnership
GBR RULES FOR COMPETITION
 GENERAL GBR RULES FOR COMPETITION 2017-18 1.1 All competitions will be conducted under the Laws of the Sport of Lawn Bowls, Bowls Australia Domestic Regulations and, except where provided for in these
PAEKĀKĀRIKI HILL ROAD / BEACH ROAD / SH1 INTERSECTION PROGRESS REPORT
 Chairperson and Committee Members ENVIRONMENT AND COMMUNITY DEVELOPMENT COMMITTEE 6 DECEMBER 2011 Meeting Status: Public Purpose of Report: For Decision PAEKĀKĀRIKI HILL ROAD / BEACH ROAD / SH1 INTERSECTION
SANDRINGHAM GOLF LINKS PROJECT
 SANDRINGHAM GOLF LINKS PROJECT STAKEHOLDER ENGAGEMENT BACKGROUND INFORMATION PAPER SEPTEMBER 2017 This paper provides information regarding the context for the concept proposal for the Sandringham Golf
Australian/New Zealand Standard
 AS/NZS 3788:2006 AS/NZS 3788:2006 Australian/New Zealand Standard Pressure equipment In-service inspection AS/NZS 3788:2006 This Joint Australian/New Zealand Standard was prepared by Joint Technical Committee
Returned & Services League of Australia Limited
 Returned & Services League of Australia Limited Forensic review summary of interim findings 12 December 2016 Liability limited by a scheme approved under Professional Standards Legislation Glossary Relevant
MSW Objective 1.1: Level of Service Standards To maintain the IMSWMS MSW collection system to meet or exceed established LOS standards.
 INFRASTRUCTURE - MUNICIPAL SOLID WASTE PURPOSE The purpose of the Solid Waste section of the Infrastructure Element is to ensure that necessary sanitation facilities and services are in place to provide
Ecological Interactions in Coastal Marine Ecosystems: Rock Lobster
 Ecological Interactions in Coastal Marine Ecosystems: Rock Lobster Progress Report to 3 November Lachlan MacArthur and Glenn A. Hyndes Centre for Ecosystem Management, Edith Cowan University, 1 Joondalup
TRIAL EVALUATION OF WIDE, AUDIO-TACTILE, CENTRELINE CONFIGURATIONS ON THE NEWELL HIGHWAY
 TRIAL EVALUATION OF WIDE, AUDIO-TACTILE, CENTRELINE CONFIGURATIONS ON THE NEWELL HIGHWAY Connell D.J., Smart W.J, Levett S., Cleaver M., Job R.F.S., de Roos M., Hendry T., Foster J., Saffron D... New South
U.S. EXPORTS Dairy Products - by Country, 2009 (pie chart) 69 Dairy Products, 2009 v (bar graph) 70 All Dry Whey, All Dry Whey -
 69 Dairy Products, 2009 v (bar graph) 70 All Dry Whey, All Dry Whey -") TABLE OF CONTENTS I. EXECUTIVE SUMMARY 5 II. UTILIZATION A. Dry Milk Products Utilization 1. Nonfat Dry Milk Compilation of Dry Milk Utilization Data 9 Nonfat Dry Milk Overview 10 Nonfat Dry Milk Domestic
TABLE OF CONTENTS I. EXECUTIVE SUMMARY 5 II. UTILIZATION A. Dry Milk Products Utilization 1. Nonfat Dry Milk Compilation of Dry Milk Utilization Data 9 Nonfat Dry Milk Overview 10 Nonfat Dry Milk Domestic
Brenda Patterson, General Manager, Parks, Forestry and Recreation. P:\2011\Cluster A\PFR\PE AFS#13791
 Regulating of Kite Flying in City Parks STAFF REPORT ACTION REQUIRED Date: May 11, 2011 To: From: Wards: Reference Number: Parks and Environment Committee Brenda Patterson, General Manager, Parks, Forestry
Community perceptions of the sustainability of the fishing industry in Australia
 Community perceptions of the sustainability of the fishing industry in Australia October 2013 Prepared for: Peter Horvat Communications Manager Fisheries Research and Development Corporation Prepared by:
West Australian Beach Clean-up Report 2016 Tangaroa Blue Foundation. Kirrily Hastings, Wally Smith, Heidi Taylor, Renee Mouritz
 West Australian Beach Clean-up Report 2016 Tangaroa Blue Foundation Kirrily Hastings, Wally Smith, Heidi Taylor, Renee Mouritz 1 Contents Highlights from 2016... 2 Bull kelp transported from distant shores...
The Joint Report of the Bus Lane Adjudicators
 The Joint Report of the Bus Lane Adjudicators January 2007 March 2008 1 For the period covered by this report only a few councils were undertaking civil bus lane enforcement so that there are a relatively
Baseline Survey of New Zealanders' Attitudes and Behaviours towards Cycling in Urban Settings
 Baseline Survey of New Zealanders' Attitudes and Behaviours towards Cycling in Urban Settings Highlights 67% of urban New Zealanders, 18 years of age or more own or have access to a bicycle that is in
Municipal waste management in Cyprus
 Municipal waste management in Cyprus Prepared by Ioannis Bakas ETC/SCP February 2013 EEA project manager Almut Reichel 1 Author affiliation Ioannis Bakas, Copenhagen Resource Institute, http://www.cri.dk/
Pre Feasibility Study Report Citiwater Cleveland Bay Purification Plant
 SOLAR POWER SPECIALISTS.Pure Power ACN 074 127 718 ABN 85 074 127 718 POWER MAGIC PTY LTD 245 INGHAM RD GARBUTT QLD 4814 Phone: 1800 068 977 Fax: 07 4725 2479 Email: FNQSOLAR@bigpond.com Pre Feasibility
Bag It, Move It, Leave It or Report it?
 Bag It, Move It, Leave It or Report it? Adopt-a-Highway instructions for handling roadside litter & Identifying Illicit Discharge If you ve ever wondered what to do with something you ve found on the roadside,
Use of Additional Through Lanes at Signalized Intersections
 Transportation Research Record 869 1 Use of Additional Through Lanes at Signalized Intersections PATRICK T. McCOY AND JOHN R. TOBIN One method sometimes used to increase the capacity of signalized intersections
Amy Gillett Foundation Response to Towards Zero Road Safety Action Plan Discussion Paper
 30 June 2017 Attention: Manager of the Road Safety Unit Level 1, Energy House 18-20 Cavenagh Street Darwin, NT 0801 Lodged via email: roadsafety@nt.gov.au Amy Gillett Foundation Response to Towards Zero