Eric Thomas Garcia. A Thesis Submitted to the Faculty of Graduate Studies of. The University of Manitoba
|
|
|
- Paulina Barber
- 5 years ago
- Views:
Transcription
1 The Pedometer Project: Using an Individualized Cadence-Based Exercise Prescription (CBEP) to Increase the Amount of Moderate-Vigorous Physical Activity Accumulated by a Cohort of Previously Inactive Adults. by Eric Thomas Garcia A Thesis Submitted to the Faculty of Graduate Studies of The University of Manitoba in partial fulfilment of the requirements of the degree of MASTER OF SCIENCE Department of Kinesiology and Recreation Management University of Manitoba Winnipeg, Manitoba, Canada Copyright 2013 by Eric Thomas Garcia
2 I Abstract This study determined whether a cadenced-based exercise prescription (CBEP) enabled participants to increase the time they spend doing moderate-to-vigorous intensity physical activity (MVPA) to a greater extent than Standard Care (SC). Forty-six participants were recruited from the ENCOURAGE study and were allocated to SC (n=25) or CBEP (n=21). Data was collected at baseline (T0), prior to the intervention (T1) and then again at 16 (T2) and 24 (T3) weeks. Moderate-to-vigorous physical activity was assessed by accelerometry in 10 minute (MVPA 10min ) and sporadic bouts (MVPA Spor ) as well as step counts (Steps Total, Steps MVPA ). Although participants reported that CBEP helped them to increase their motivation to become more active, none of the accelerometer parameters differed between SC and CBEP at baseline, 8, 16, or 24 weeks. These data suggest that CBEP did not have an added benefit for influencing physical activity over time amongst a population of previously sedentary adults.
3 II Acknowledgements I would like to acknowledge important people, groups, and organizations for their support with my thesis project. I am pleased to acknowledge Dr. Todd Duhamel (St. Boniface Research Centre and University of Manitoba) as my graduate studies advisor and friend. His constant support and mentorship has guided me throughout this process and I will never forget the life lessons he has taught me during our time together. A special thanks to the entire Duhamel research team for their friendship and help conducting the study. I would also like to thank Dr. Danielle Bouchard (University of Manitoba) as a thesis committee member and her research laboratory team for allowing us to use their equipment and personnel to conduct the study. Furthermore, I would like to acknowledge Dr. Jon McGavock as a thesis committee member and his research laboratory for helping us with accelerometer data analysis. I would like to thank Dr. Dean Kriellaars as a thesis committee member for becoming my external advisor and for providing me with valuable information in our meetings. It is also important to recognize the Access Transcona and Access River East health care clinics for allowing us to conduct the study in their workplace. I would like to thank the Faculty of Kinesiology and Recreation Management at the University of Manitoba for supporting my first year in the graduate program by providing me with opportunity to take part in the graduate research assistantship. In addition, I would like to thank Sport Manitoba and Folklorama for also supporting my first year of graduate studies by honouring me with the Manitoba Foundation for Sports Inc. Scholarship and the Mark and Dorothy Danzker scholarship, respectively. Furthermore, a special thank you to Ruth Asper for choosing me as the recipient of the Ruth Asper
4 III Scholarship in Physical Education, Kinesiology & Recreation and for supporting me as a graduate student for two years. Finally, I would like to acknowledge the Canadian Institutes for Health Research (CIHR) for supporting me with the Frederick Banting and Charles Best Canada Graduate Scholarship for my second year in the program and the Heart and Stroke Foundation of Manitoba (HSFM) for funding my thesis project.
5 IV Dedication I would like to dedicate my thesis project to my family. I would not be where I am today without their constant support, sacrifice and love. Also, I would like to dedicate this project to my graduate studies advisor Dr. Todd Duhamel. I would not be as successful and fortunate in my current research career if it were not for his mentorship and encouragement to help me reach my full potential as a research scientist.
6 V Abbreviations 6MWT 6 minute walking test Age young age below or equal to 52 years Age old age above 52 years BMI body mass index BMI over BMI over 36 kg/m 2 BMI Steps Work of moving calculated by multiplying BMI and total steps per day BMI under BMI under or equal to 36 kg/m 2 Cadence mod cadence when target HR at 50% of HRR is achieved CBEP cadenced-based exercise prescription CBEP Individual Cadenced-Based Exercise Prescription group accelerometer data based on individual cut-points CBEP Standard Cadenced-Based Exercise Prescription group accelerometer data based on standard cut-points CEP Certified Exercise Physiologist CFC Certified Fitness Consultant CI confidence interval CO 2 carbon dioxide CPAG Canadian Physical Activity Guidelines CSEP Canadian Society of Exercise Physiology EMR Electronic Medical Records ENCOURAGE ENhancing primary care COUnselling and Referrals to communitybased physical Activity opportunities for sustained lifestyle change
7 VI ENREB University of Manitoba Education/Nursing Research Ethics Board 2 H hydrogen H 2 O - water HR heart rate HR max maximum heart rate HR rest resting heart rate HRR heart rate reserve METs metabolic equivalents MET-min Total10min Total MET-minutes per week in 10 minute bouts MET-min TotalSpor Total MET-minutes per week in sporadic bouts MVPA moderate-to-vigorous physical activity MVPA 10min MVPA minutes per week in 10 minute bouts MVPA AE-CPAG met the aerobic exercise recommendation in the Canadian Physical Activity Guidelines based on MVPA 10min MVPA Bouts10min Number of bouts of MVPA performed for 10 minutes or longer per day MVPA Spor MVPA minutes per week in sporadic bouts 18 O - oxygen RCT randomized controlled trial RFIT risk factor identification tool RFIT AE-CPAG met the aerobic exercise recommendation in the Canadian Physical Activity Guidelines based on RFIT RFIT MVPA MVPA minutes per week based on RFIT RPE rating of perceived exertion
8 VII SC standard care SD standard deviation SF-12 short form-12 health survey Steps 10,000 reached 10,000 total steps per day Steps MVPA MVPA steps per day in sporadic bouts Steps Total - Total steps per day in sporadic bouts T0 baseline time point T1 8 week time point T2 16 week time point T2-T1/T1 percent change from 8 to 16 week time point T3 24 week time point T3-T1/T1 percent change from 8 to 24 week time point T3-T2/T2 percent change from 16 to 24 week time point TotalPA 10min Total minutes of physical activity per week in 10 minute bouts or longer TotalPA Bouts10min Number of bouts of total physical activity performed for 10 minutes or longer per day TotalPA Spor Total minutes physical activity per week in sporadic bouts VO 2max maximum oxygen consumption Weight over weight over 103 kg Weight under weight under or equal to 103 kg YMCA-YWCA Young Men s and Young Women s Christian Association of Winnipeg Incorporated
9 VIII Table of Contents Abstract... I Acknowledgements.II Dedication..IV Abbreviations..V Table of Contents VIII List of Tables XV List of Figures....XVII List of Copyrighted Material for which Permission was Obtained..XVIII Chapter 1: Literature Review Physical inactivity is a major issue Canadian Physical Activity Guidelines...1 Public awareness of the CPAG....2 Negative health benefits of inactive behaviour....3 Physical activity supports provided by primary health care...4 Approaches used to enhance physical activity prescription in health care What types of activity do people do when physically active?...7 Are people able to accumulate MVPA while walking?...7 Methods to measure or identify physical activity intensity Doubly-labelled water..8 Accelerometers..10 Heart rate monitors....11
10 IX Self-perceived intensity Pedometers.14 Instant feedback versus retrospective feedback Are total step-based goals effective for increasing physical activity amongst previously inactive adults?...15 The Green Prescription intervention enhanced with a pedometer.19 Can pedometers help people increase MVPA while walking?...21 Integrating an exercise specialist into the primary health care team The ENCOURAGE Project...25 Figure 1: The Expanded Chronic Care Model...27 Chapter 2: Study Design Rationale, objectives and hypotheses 32 Figure 2: The Prospective Interventional Study Design 33 Ethics approval...34 Participant recruitment...34 Figure 3: The total number of participants involved in each section of the recruitment process for the Pedometer project.. 35 Standard care..38 Table 1: The time line session guide for CSEP-CEP for the ENCOURAGE project Cadenced-based pedometer exercise prescription Subject characteristics...42 Primary outcome
11 X Additional outcome measures Surveys...45 RFIT self-reported physical activity...45 Short form-12 health survey (SF-12).46 Statistical analysis..46 Chapter 3: Results..49 Baseline characteristics..49 Table 2: Comparison of baseline characteristics of SC and CBEP Table 3: Month when participants began ENCOURAGE study...50 Intervention meeting and follow-up data...50 Table 4: CBEP intervention meeting results..52 Table 5: Comparison of cadenced measured by Garmin FR60 and accelerometer Table 6: CBEP Results from intervention meeting follow-ups Accelerometer physical activity.57 Table 7: Comparison of physical activity in 10 minute bouts between SC and CBEP Table 8: Comparison of physical activity in sporadic bouts between SC and CBEP.61 Figure 4: Comparison of total steps per day between SC and CBEP Figure 5: Comparison of MVPA steps per day between SC and CBEP RFIT self-reported physical activity..66
12 XI Table 9: Comparison of RFIT self-reported physical activity between SC and CBEP Figure 6: Correlation between self-reported physical activity measures...68 SF-12 health survey...69 Table 10: Comparison of SF-12 health survey results between SC and CBEP...70 Analysis of MVPA steps in different population sub-groups 71 Table 11: Comparison of MVPA steps per day in gender sub-groups..72 Table 12: Comparison of MVPA steps per day in age sub-groups 73 Table 13: Comparison of MVPA steps per day in weight sub-groups..75 Table 14: Comparison of MVPA steps per day in BMI sub-groups..77 Figure 7: Comparison of MVPA steps per day in seasonal sub-groups 79 Differences between the categorical MVPA steps and total steps per day data 79 Chapter 4: Discussion...81 Overview Evidence to support the feasibility of CBEP amongst previously inactive adults 82 CBEP participants have an increased risk of morality based on their maximum oxygen consumption (VO 2max ) Measured cadence was similar between Garmin FR60 and accelerometry...86 CBEP maintained physical activity over time in participants A seasonal effect was not seen for total and MVPA steps per day
13 XII Total steps and steps performed at a moderate-to-vigorous intensity were not affected by the baseline characteristics of the participants in our study population Using CBEP does not enhance the quality of life of participants..95 Limitations.96 Summary Conclusions..107 References Appendices A) CPAG for Adults Years B) CPAG for Older Adults - 65 Years & Older C) Certified Exercise Physiologist (CEP) Scope of Practice and Competencies 125 D) Risk Factor Identification Tool (RFIT)..130 E) Pedometer Intervention Sheet.135 F) Patient Information Sheets..137 G) Individualized Cadence-Based Pedometer Exercise Prescription Sheet 141 H) Pedometer Intervention Follow-up Script I) Accelerometer Output Examples J) Table 15: Comparison of physical activity in 10 minute bouts with absolute changes between SC and CBEP...149
14 XIII K) Table 16: Comparison of physical activity in sporadic bouts with absolute changes between SC and CBEP L) Table 17: Comparison of total steps per day between SC and CBEP M) Table 18: Comparison of MVPA steps per day between SC and CBEP N) Table 19: Comparison of RFIT self-reported physical activity with absolute changes between SC and CBEP O) Table 20: Comparison of SF-12 health survey results with absolute changes between SC and CBEP P) Table 21: Comparison of MVPA steps per day with absolute changes in gender sub-groups Q) Table 22: Comparison of MVPA steps per day with absolute changes in age sub-groups R) Table 23: Comparison of MVPA steps per day with absolute changes in weight sub-groups S) Table 24: Comparison of MVPA steps per day with absolute changes in BMI sub-groups T) Table 25: Comparison of MVPA steps per day in seasonal sub-groups U) Table 26: Comparison of total steps per day in gender sub-groups V) Table 27: Comparison of total steps per day in age sub-groups W) Table 28: Comparison of total steps per day in weight sub-groups X) Table 29: Comparison of total steps per day in BMI sub-groups Y) Table 30: Comparison of total steps per day in seasonal sub-groups...184
15 XIV Z) Table 31: Comparison of total and MVPA steps per day between SC and CBEP separated into seasonal sub-groups AA) Table 32: Comparison of valid accelerometer days and length of wear times between SC and CBEP BB) Table 33: CBEP accelerometer data sub-analysis comparing standard and individualized cut-points..190
16 XV Lists of Tables Table 1: The time line session guide for CSEP-CEP for the ENCOURAGE project...39 Table 2: Comparison of baseline characteristics of SC and CBEP Table 3: Month when participants began ENCOURAGE study...50 Table 4: CBEP intervention meeting results..52 Table 5: Comparison of cadenced measured by Garmin FR60 and accelerometer...53 Table 6: Results from intervention meeting follow-ups Table 7: Comparison of physical activity in 10 minute bouts between SC and CBEP.60 Table 8: Comparison of physical activity in sporadic bouts between SC and CBEP 61 Table 9: Comparison of RFIT self-reported physical activity between SC and CBEP.68 Table 10: Comparison of SF-12 health survey results between SC and CBEP.70 Table 11: Comparison of MVPA steps per day in gender sub-groups..72 Table 12: Comparison of MVPA steps per day in age sub-groups 73 Table 13: Comparison of MVPA steps per day in weight sub-groups..75 Table 14: Comparison of MVPA steps per day in BMI sub-groups..77 Table 15: Comparison of physical activity in 10 minute bouts with absolute changes between SC and CBEP Table 16: Comparison of physical activity in sporadic bouts with absolute changes between SC and CBEP Table 17: Comparison of total steps per day between SC and CBEP Table 18: Comparison of MVPA steps per day between SC and CBEP Table 19: Comparison of RFIT self-reported physical activity with absolute changes between SC and CBEP...161
17 XVI Table 20: Comparison of SF-12 health survey results with absolute changes between SC and CBEP Table 21: Comparison of MVPA steps per day with absolute changes in gender sub-groups Table 22: Comparison of MVPA steps per day with absolute changes in age sub-groups Table 23: Comparison of MVPA steps per day with absolute changes in weight sub-groups Table 24: Comparison of MVPA steps per day with absolute changes in BMI sub-groups Table 25: Comparison of MVPA steps per day in seasonal sub-groups Table 26: Comparison of total steps per day in gender sub-groups Table 27: Comparison of total steps per day in age sub-groups Table 28: Comparison of total steps per day in weight sub-groups Table 29: Comparison of total steps per day in BMI sub-groups Table 30: Comparison of total steps per day in seasonal sub-groups Table 31: Comparison of total and MVPA steps per day between SC and CBEP separated into seasonal sub-groups Table 32: Comparison of valid accelerometer days and length of wear times between SC and CBEP Table 33: CBEP accelerometer data sub-analysis comparing standard and individualized cut-points
18 XVII List of Figures Figure 1: The Expanded Chronic Care Model...27 Figure 2: The Prospective Interventional Trial Design Figure 3: The total number of participants involved in each section of the recruitment process for the Pedometer project Figure 4: Total steps per day between SC and CBEP...64 Figure 5: MVPA steps per day between SC and CBEP Figure 6: Correlation of self-reported physical activity measures.68 Figure 7: Comparison of MVPA steps per day in seasonal sub-groups 79
19 XVIII List of Copyrighted Material for which Permission was Obtained Appendix A: Canadian Physical Activity Guidelines for Adults Years, Canadian Society for Exercise Physiologists Appendix B: Canadian Physical Activity Guidelines for Older Adults - 65 Years & Older, Canadian Society for Exercise Physiologists Appendix C: Certified Exercise Physiologist (CEP) Scope of Practice and Competencies, Canadian Society for Exercise Physiologists...125
20 1 Physical inactivity is a major issue. Chapter 1: Literature Review Physical inactivity is the fourth leading cause of mortality in the world 1, 2. Furthermore, more than 85% of Canadians are not meeting the aerobic exercise recommendation in the Canadian Physical Activity Guidelines (CPAG) of 150 minutes per week of moderate-tovigorous physical activity (MVPA), performed in 10 minute bouts or longer 3. In fact, the average Canadian adult spends more than 9 hours a day being inactive 3. Physical inactivity plays a major role in overall health and can contribute to many chronic conditions, such as ischemic heart disease (30%), type 2 diabetes (27%), and breast and colon cancer (21%) 2. In addition, inactive individuals have a 30-40% higher risk of allcause mortality 4-6 and a 4.5 year shorter life expectancy as compared to more physically active individuals 7. Therefore, it is imperative to develop interventions to enable Canadians to adopt and sustain a more physically active lifestyle. Canadian Physical Activity Guidelines. The Canadian Society of Exercise Physiology (CSEP) developed the CPAG with the primary objective to promote the adoption of a more physically active lifestyle amongst Canadians. There are specific CPAG for 5-11 year old children, year old youth, year old adults, and 65 years and older 8. This thesis project recruited adults from the age of 18 years and older. Therefore, the following section will focus on the CPAG for year old adults and 65 years and older. The CPAG for the year old adults and for the adults age 65 years and older have the same basic recommendations; however, the 65 years and older group have an
21 2 additional recommendation to perform balance exercises to prevent falls by enhancing their mobility only if they present balance impairment The current CPAG recommendations are based on research that provides evidence that 150 minutes per week of MVPA of aerobic physical activity in 10 minute bouts or longer contributes to measureable health benefits 9, 10, 12, 13. The CPAG also recommend that adults perform resistance training using major muscle groups for at least two days per week to add muscle and strength 11. The CPAG provide several examples of moderate intensity activities, such as brisk walking, and vigorous intensity activities, such as cross-country skiing. Notably, people who meet the CPAG tend to have a lower risk of some chronic diseases, such as cardiovascular disease, colon and breast cancer, stroke and type-2 diabetes 12, 13. The CPAG also provide suggestions to help people become more physically active in their community by suggesting that people join a community walking or running group. Therefore, the CPAG are evidence based and seek to translate the knowledge that researchers have gathered from their studies into public health messages that are easy for the general public to understand and implement. A copy of the CPAG for year old adults is available for viewing within Appendix A and for 65 years and older within Appendix B. Public awareness of the CPAG. In Canada, less than 15% of adults reach the aerobic exercise recommendation in the CPAG by accumulating the recommended 150 minutes per week of MVPA in ten consecutive minutes to achieve health benefits 3. A reason for this could be that Canadians are not aware of the CPAG and its recommendations. A recent study has
22 3 evaluated Canadians knowledge of the CPAG and the results showed that 27% of Canadians were aware of the CPAG with only 16% knowing the specific recommendations 14. Furthermore, only 62% of primary care professionals reported providing the CPAG to their diabetic patients as part of their physical activity counselling 15. This statistic is surprising because the CPAG has been one of the most requested resources from the Public Health Agency of Canada 8, 16. Negative health benefits of inactive behaviour. Sedentary behaviour guidelines have been developed by CSEP to prevent inactivity in children and youth. The guidelines state that for health benefits, children and youth should minimize their recreational screen time (e.g., television, video games, computer) to less than two hours per day 17, 18. In addition, children and youth should minimize the time they spend sitting, being indoors, and in motorized transportation (e.g., bus, car) 17, 18. Currently, there are no sedentary behaviour guidelines for adults and older adults. However, CSEP is in the process of creating the sedentary behaviour guidelines for adults and older adults that would follow the similar concepts found in children and youth. Inactive behaviour can cause negative health benefits, such as poor cardiorespiratory fitness and an increased risk for all-cause mortality 4-6 and reduced life expectancy 7. It has been shown in scientific literature that a relationship exists between cardiorespiratory fitness and mortality 19, 20. Cardiorespiratory fitness is an important prognostic factor for major cardiac events and all-cause mortality in healthy adults 19, 20. For example, the relative risk of mortality was shown to be two times greater for people found in the least fit quintile compared to the next least fit quintile for cardiorespiratory fitness 19.
23 4 Furthermore, inactive behaviour has a negative effect on the overall health by increasing the risk of developing many chronic conditions, such as ischemic heart disease, diabetes, breast and colon cancer 2. Specifically for older adults inactive behaviour can cause problems with balance and low muscle strength 21, 22, which are both issues that increase the risk of falls and loss of autonomy 23. In addition, it is known that adults who sit uninterrupted for 14 hours (sitting regime) have reduced insulin sensitivity and higher plasma lipid levels compared to adults who spent 8 hours sitting, 4 hours walking and 2 hours standing (i.e. a minimal intensity physical activity regime) 24. Likewise, adults who perform one hour of daily vigorous physical activity and sit for 13 hours per day are known to have reduced insulin sensitivity and higher plasma lipid levels compared to adults in the minimal physical activity regime 24. Therefore, the problem of high levels of inactive behaviour should be addressed by getting individuals more physically active and sitting less before the negative health benefits can play a role in their health. Physical activity supports provided by primary health care. Primary health care is defined as any type of service care provided by a health care professional in a clinic regarding the patient s health and promoting a healthy lifestyle 25. Notably, primary health care may be a viable location to influence physical activity behaviour of inactive adults. In fact, there is evidence demonstrating that participants are more likely to change their behaviour if a physician tells them to change their behaviour 26. About 70% of primary care professionals state that they discuss physical activity with their participants 4. However, only 34% of patients reported discussing physical activity counselling with their primary care provider at their last primary care visit 27. In
24 5 Manitoba, Hnatiuk et al. 28 conducted a study to evaluate the type of physical activity support health care providers deliver to patients and how patients perceive this support. Their data indicates that 83% of health care providers report that they asked the patient about their readiness to become more physically active, while only 46% of the patients reported that the health care provider did so. Additionally, 100% of the health care providers indicated that they talked about barriers that may prevent the patients from becoming more physically active; whereas, only 65% of the patients reported that they received this support. Furthermore, 87% of the healthcare providers stated that they discussed physical activity resources available within the patient s community and 54% reported that they referred the patient to a physical activity program offered in the community. In contrast, only 38% of the patients reported discussing physical activity resources in their community and 0% reported that their health care provider referred them to a physical activity program offered in the community 28. This discrepancy may be explained by two different scenarios. The first scenario is that a majority of Canadians are not being advised to become more physically active by their physicians as often as physicians report. This is plausible because primary care providers often state limitations, such as lack of time 4, 29, 30 and lack of knowledge in counselling patients on physical activity 31, 32. In addition, most primary care providers only provide physical activity advice for patients that have pre-existing conditions and require weight management 30, 33. However, the second scenario is that primary care professionals are discussing physical activity with their participants, but that patients felt the physical activity prescription they received was insufficient 33 or language barriers made it difficult for the patients to understand the physical activity information being shared with them 34, 35.
25 6 Approaches used to enhance physical activity prescription in health care. A study in New Zealand by Swinburn et al. 36 was conducted to evaluate the effectiveness of written advice from a general practitioner (Green Prescription) for increasing physical activity levels amongst previously inactive individuals, as compared to just verbal advice given from a general practitioner. About 450 participants received verbal advice about increasing physical activity from a general practitioner and then half were randomized to receive an additional written exercise prescription. Physical activity levels were then measured using a standard questionnaire that they created that showed good reliability for assessing physical activity. The questionnaire was completed at baseline during the first meeting with the general practitioners and at six weeks over a phone call follow-up with a trained interviewer. The general practitioners spent about five minutes to assess the participant s physical activity levels and provide advice to increase physical activity levels during the patient s appointment at baseline. About 80% of that advice given to both groups was about increasing their time spent walking. The results showed that overall in both groups the percentage of participants engaging in any kind of recreational physical activity increased. Notably, 17% of participants in the verbal advice group increased their activity levels; whereas, 32% of participants in the Green Prescription group increased their activity levels 36. This study demonstrates how participants are more likely to make changes to their lifestyle if advised to do so by a physician 26. It also demonstrates that health care is a viable location to provide exercise prescription for previously inactive adults.
26 7 What types of activity do people do when physically active? In Canada, adults choose walking as the main mode of exercise (65%) followed by gardening (41%), and home exercise (24%) 37. Furthermore, other favourite activities that Canadian adults like to do for exercise are biking (19%), swimming (18%), and social dancing (15%) 37. This is surprising considering that less than 15% of people accumulate at least 150 minutes of MVPA on a weekly basis even though a majority of Canadians prefer to walk for exercise 3, 37. In addition, only 35% of Canadian adults are accumulating the recommended 10,000 steps per day goal 3. Specifically, Canadian men are accumulating 9,500 steps per day and Canadian women are accumulating 8,400 steps per day on average 3. With this in mind, it is possible that even though people may be doing physical activity, they are not being physically active frequently enough or may not fully understand how to be active at moderate to vigorous intensities that would achieve measureable heath benefits. Are people able to accumulate MVPA while walking? A study conducted by Duncan et al. 38 investigated the effectiveness of walking at varied intensities and frequencies in a previously sedentary adult population aged years. Their data indicates that sedentary adults, especially older adults can reach moderate intensity when walking 38. In addition, Tudor-Locke et al. 39 compared clinical and free-living cadence in older adults (61-81 years). The results showed that older adults are capable of walking at cadences greater than 100 steps per minute 39. A cadence between 95 and 110 steps per minute has been shown to be the minimum threshold for moderate intensity walking 40, 41.
27 8 A reason a majority of Canadians are not meeting the minutes of aerobic exercise to meet the CPAG could be because they do not know how to monitor walking at a moderate intensity. Therefore, Bouchard et al. 42 conducted a study to evaluate how effective three different methods to identify aerobic exercise intensity would be at helping inactive older adults reach the recommended minutes of aerobic exercise in the CPAG over 8 weeks. The participants were randomized into one of three groups using a specific method to monitor aerobic exercise intensity: heart rate (HR) monitor (% of maximum heart rate (HR max )), manual pulse (% of HR max ), or pedometer (walking cadence). The results indicated that none of the groups significantly increased their time spent performing MVPA or ability to identify exercise intensity correctly; however, the two groups using a device increased their total exercise time (both p<0.01) 42. Specifically, the pedometer group showed a trend (p=0.07), where participants tended to more often correctly identify exercise intensity 42. It is possible that the pedometer s ability to produce instant visual feedback enabled the user to recognize when they were walking at moderate intensity. Based on this data, it appears that pedometers can assist people to be aware of when they are performing MVPA, which might help them to reach the aerobic exercise component in the CPAG. Methods to measure or identify physical activity intensity. Doubly-labelled water The technique referred to as the doubly-labelled water is used to evaluate free-living energy expenditure of an individual over a period of four to twenty-one days 43. The doubly-labelled water method is very reliable and accurate at measuring energy
28 9 expenditure with a relative accuracy of 1% and within subject precision of 5 to 8% 44. The method involves the individual ingesting water with a known specific amount of stable isotopes of both oxygen ( 18 O) and hydrogen ( 2 H) that mix with the normal oxygen and hydrogen in the body within a few hours 43. Then, as the individual expends energy throughout the day, the body produces carbon dioxide (CO 2 ) that is lost through breathing and water (H 2 O) that is lost through breath, urine, sweat, and other evaporations 43. In fact, 18 O is lost from the body more rapidly than 2 H because 18 O can be found in both CO 2 and H 2 O, while 2 H is only found in H 2 O 43. The rate of CO 2 production is determined with difference between the elimination rates for both the isotopes and is used to calculate energy expenditure 43. Furthermore, the doubly-labelled water method has been used as an objective criterion method to validate methods assessing dietary energy intake and physical activity The limitations to using the doubly-labelled water method include the isotopes being quite expensive 43, 48, 49. However, a study by Mann et al. 49 showed that a reduced dose of doubly-labelled water positively correlates with resting energy expenditure measured by a metabolic cart (r=0.87, p<0.01). This means that more studies in the future may use the double-labelled water method with it being more affordable with the reduced dose and just as effective at measuring energy expenditure 49. On the other hand, the technique still requires specific expertise to analyze the isotope concentrations in the samples 43, 48. In addition, the doubly-labelled water method can only measure habitual energy expenditure over a certain time period making it difficult to obtain information about the brief periods of peak energy expenditure an individual performs during exercise 43. Therefore, the doubly-labelled water technique would not be an ideal approach to use to measure
29 10 exercise intensity. Accelerometers Physical activity intensity can be measured using different methods with some having the option of providing instant visual feedback. Accelerometers are accurate and reliable at objectively measuring 50, 51 the amount, intensity, pattern, and duration of physical activity that each individual completes in their free-living environment 52. For example, accelerometer data can be analyzed to characterize different bouts of physical activity and different intensities, such as sedentary, light, moderate, and vigorous. The accelerometer can be used in a field setting, which makes it the optimal choice for measuring physical activity over a period of time. Accelerometers are about the size of a watch (4 cm x 4 cm) and are normally worn for a period of seven days 52. The accelerometers are placed at the hip level, which allows the individual to perform their normal activities without interference. Accelerometers worn on the hip have been shown to have a moderate reliability of 0.66 to 0.78 for accuracy in measuring physical activity 53. A limitation with using accelerometers for personal use is that they are quite expensive and require specific equipment to be analyzed. Also, specific skill and software is required to evaluate the data output. The accelerometer provides retrospective feedback because the information is obtained after a seven days period. This makes it difficult for participants to know if they are at the appropriate intensity while actually performing the exercise. Another problem is the bias of the participant doing more physical activity while they are wearing it. Finally, a limitation of accelerometers is that cut-points for classifying different intensities are arbitrary and based on population data rather than individualized for the specific person wearing the device. Even so, accelerometers are often used to assess
30 11 changes in MVPA amongst diverse populations 3, Heart rate monitor A heart rate monitor is a simple device that can be used to help identify when exercising at the appropriate intensity based on the target heart rate zones. To have visual feedback for the intensity target zones, an individual can wear a heart rate monitor. The review paper by Laukkanen and Virtanen 57 reported that heart rate monitors provide reliable and valid measures of heart rate at rest (HR rest ) and during exercise in adults and children. The heart rate monitor is moderately priced and is worn just below the chest and accurately identifies when a participant is working in their appropriate target zone based on HR 58 max. There are two steps to calculating the target heart rate zone for moderate intensity exercise using the heart rate monitor. Step one is to determine an individual s HR max, which can be measured directly using a graded exercise test or estimated using the age of the participant in Equation 1 and Equation HR max = (220 age) Equation 1 HR max = (220 (0.7 X age)) Equation 2 Equation 1 is the conventional HR max formula and Equation 2 is the Gellish et al. 60 theoretical HR max formula 59. Gellish et al. 60 developed their theoretical HR max formula because the commonly used conventional HR max formula was biased at measuring HR max. They demonstrated that Equation 1 overestimated HR max in men and women under the age of 40 and underestimated HR max in men and women over the age of Therefore, 59, Equation 2 was developed to provide a more accurate estimate of HR 60 max. The direct measure for HR max using the graded exercise test would be the most accurate choice to
31 12 determine HR max amongst both young and older adults. However, it involves using a treadmill or bike ergometer in a laboratory setting 61. Therefore, it is not feasible to use in real world settings because it would be inconvenient for participants to come to a laboratory and exercise until exhaustion 61. Also, this approach would be costly and time consuming to perform on a large population 61. The last step is to calculate the target heart rate zone for moderate intensity exercise using the percentage of an individual s HR max or Heart Rate Reserve (HRR). Moderate intensity exercise can be defined and prescribed as 55 to 69% of HR max or 40 to 59% of HRR 62. The HRR formula is shown as Equation 3. HRR = (HR max - HR rest ) Equation 3 The Karvonen Formula Target Equation uses HRR to calculate the appropriate target heart rate zone for moderate intensity exercise. It is comprised of HR max calculated using Equation 1 and Equation 2, HR rest measured by the heart rate monitor, and the HRR formula 62. The Karvonen Formula Target Equation is displayed in Equation Target % of HRR = ((HRR) X Target Intensity %) HR rest Equation 4 Once the exercising target zones are established, the individual can monitor their exercise intensity using a heart rate monitor 62. The difficulty with heart rate monitors is that some confounding variables can affect heart rate reading. A study conducted by Dauncey and James 63 showed that confounding variables such as emotional stress and the type of activity being performed can influence heart rate without affecting oxygen uptake considerably. Also, heart rate monitors require some knowledge of how to operate the device properly and how to determine exercising target zones using Equation 1, Equation 2, Equation 3, and Equation 4, which could be
32 13 an issue for some adults. Self-perceived intensity A simple method of assessing intensity during exercise is using self-reported intensity monitoring such as the talking test or self-perceived exertion scale (Ratings of Perceived Exertion, RPE) called the Borg Scale. The talking test is evaluated by an individual s ability to carry on a conversation during an exercise. If they notice a slight increase in their breathing while talking, it indicates that they are working at moderate intensity 64. As for the self-perceived exertion scale, a score from 4 to 6 on a 10-point 65 or a score of 13 to on a 20-point scale would indicate moderate intensity. Dunbar and Kalinski 65 conducted a study using RPE to characterize exercise intensity of postmenopausal women during a 20-week exercise training program. The results showed that during training at week 2, the heart rate measured during the mean intensity of 40% of maximum oxygen consumption (VO 2max ) did not differ from the target heart rate for that intensity based on RPE 65. However, the study conducted by Whaley et al. 67 showed that there are differences between RPEs for different exercise protocols measured at 40%, 60%, and 80% of exercise intensity between genders. For example, men reported a higher RPE score than the women at the three exercise intensities 67. In fact, the men reported RPE scores of 10, 13, and 16, while the women reported RPE scores of 8, 11, and 14 at the same three exercise intensities, respectively 67. The difference between RPE scores reported by men and women is problematic because RPE scores are subjective measures and differ from person to person as each individual has their own experiences. Therefore, self-perceived intensity monitoring is not the best method to monitoring physical activity intensity because this variability.
33 14 Pedometers Scientific literature has shown pedometers can significantly increase physical activity levels of previously inactive individuals 61, Additionally, pedometers are validated as a tool to estimate walking intensity using steps per minute to monitor physical activity 41. In fact, pedometers provide instant visual feedback to monitor physical activity intensity. The pedometer is an inexpensive tool worn on the waist that is relatively easy to use and directly measures the number of steps taken during a specific time period. The person can divide the number of steps per period of time to estimate their cadence. However, activities such as swimming cannot be measured by the pedometer. Therefore, to compensate for activities that cannot be measured by the pedometer, such as swimming, it has been recommended that adding an extra 200 steps for every minute of that activity would be equivalent in terms of energy expenditure normally captured by a pedometer 72. However, there is no such conversion for exercise intensity. Research has shown that most people can reach moderate intensity when they are walking briskly at a pace of 100 steps per minute 39, 41. However, 100 steps per minute may not be enough for physically active adults to reach moderate intensity because heart rate at any given intensity is lower in a physically fit individual compared to a less fit individual 73. Therefore, a method to individualize the cadence-based prescription may be an optimal strategy to help individuals to achieve moderate intensity during exercise. Instant feedback versus retrospective feedback Accelerometers provide retrospective feedback, which makes it difficult for individuals to evaluate exercise intensity while they are performing the activity. In fact, research has shown that instant visual feedback from a heart rate monitor or pedometer 42, 74 is more
34 15 effective than retrospective feedback from an accelerometer for promoting adherence to an exercise program 75. In the Nemoto et al. 75 study, participants were randomly assigned to a no walking training group (control) (n=84), moderate-intensity continuous walking training group (n=75), or a high-intensity interval walking training group (n=87) for five months. The moderate-intensity continuous walking training group monitored their physical activity with a pedometer, while the high-intensity interval walking training group monitored their physical activity with an accelerometer. After the 5 months of training, a survey was completed to see which participants in each group met the training criteria given to them at the beginning of the study. The results showed that the proportion of participants that met the training criteria was 55% in the no walking group, 68% in the moderate-intensity continuous walking training group and 48% in the highintensity interval walking training group 75. The limitation is that the percentages of participants meeting the training criteria may be due to the training intensity rather than the devices. Despite the limitation, using a pedometer to monitor physical activity may be the best tool to help participants adopt a more physically active lifestyle given that it provides immediate visual feedback is relatively inexpensive and requires only basic knowledge of electronic equipment to utilize. Are total step-based goals effective for increasing physical activity amongst previously inactive adults? Bravata et al. 68 conducted a systematic review to evaluate the association between the use of pedometers and physical activity levels and health outcomes in outpatient adults. Studies were included if they reported pedometer use among more than 5 outpatient adults and data indicating a change in steps taken per day. Twenty-six studies (18
35 16 randomized controlled trail [RCT] and 8 observational studies) that included a total of 2767 participants met the inclusion criteria out of 2246 citations found in the search. A majority of the participants were women at 85% with a mean (standard deviation; SD) age of 49 (9) years. The mean intervention timeline was 18 weeks. In the RCTs, intervention participants increased their physical activity by 2491 steps per day more than the control participants (95% confidence interval [CI], steps per day, p<0.001). In the observational studies, participants that used a pedometer increased their physical activity by 2183 steps per day, as compared to baseline (95% CI, steps per day, p<0.0001). Overall, those participants who used a pedometer increased their physical activity by about 27% when compared to baseline. Furthermore, having a step based goal was shown to be a significant predictor of increased physical activity (p<0.001) 68. This systematic review provides evidence to support the notion that total step-based goals monitored using a pedometer can effectively increase physical activity in outpatient adults. However, it cannot be determined whether this increase in physical activity can be maintained long term. Additionally, it is not clear if physical activities were performed at moderate-to-vigorous intensities. Baker et al. 76 conducted a randomized controlled trial to evaluate the effectiveness of a 12 week community-based pedometer walking intervention Walking for Wellbeing in the West aiming to increase daily step-counts, self-reported physical activity and health outcomes in an inactive Scottish population (aged 18-65). Seventy-nine participants were randomized to either a control group or an intervention group. The participants in the control group were asked to maintain their current physical activity levels from baseline to week 12. The intervention group received a physical activity counseling session and a
36 17 12 week pedometer-based walking program focused around total daily step-based goals. The total daily step-based goals were structured so that by week six the participants would be achieving 3,000 steps above their baseline steps on at least five days per week. After week six, they would maintain the total daily step goal of 3,000 steps above their baseline steps on five days per week for the remaining six weeks. Outcome measures were evaluated at baseline and 12 weeks. The results showed that the control group showed no significant difference between steps per day at baseline (6924 ± 3201 steps/day) and week 12 (7078 ± 2911 steps/day), while the intervention group had a significant increase from steps per day at baseline (6802 ± 3212 steps/day) and week 12 (9977 ± 4669 steps/day). A chi-square analysis showed that there was a significant greater percentage of participants achieving 15,000 steps per week with 64% in the intervention group compared to 10% in the control group. Self-reported data showed that there were significant increases in the intervention group in time spent in leisure walking (+100 minutes per week) and significant decreases in time spent sitting on the weekdays (-1200 minutes per week), weekends (-360 minutes per week), and in total (-1680 minutes per week); whereas, no changes occurred in the control group from baseline to week These results demonstrate that total step-based goals monitored by a pedometer can effectively increase the total daily physical activity levels of inactive participants over a 12-week period. However, these results do not indicate whether or not the enhancements in physical activity were maintained after the 12 week pedometer intervention. Moreover, MVPA was not measured making it difficult to evaluate if participants were reaching the aerobic exercise recommendation from the CPAG.
37 18 Fitzsimons et al. 77 followed up the Walking for Wellbeing in the West intervention study by Baker et al. 76 by conducting another study to determine the same outcomes over a longer 12-month follow-up period. The first objective was to identify the longitudinal effects of a 12-week pedometer-based walking program on physical activity behaviour and health outcomes over a 12 month period. The second objective was to find out if the addition of a physical activity counseling session would enhance physical activity and health outcomes to a greater extent over the 12-month period, as compared those who do not receive physical activity counseling. This study used the same design, groups (control and intervention) and 12-week pedometer-based walking program from the Baker et al. 76 study. The control group was placed on a 12 week waiting list before receiving the 12 week pedometer-based walking program with minimal physical activity advice and no physical activity counseling sessions over the 12 month trial; whereas, while the intervention group received the 12 week pedometer-based walking program immediately, in addition to four physical activity counseling sessions over 12 months. Outcome measures were evaluated at pre-intervention and at 12 weeks and 24 weeks, and 48 weeks after receiving the intervention. The results showed that there was no significant difference between the two groups for healthy outcomes and steps per day. Both groups showed a significant enhancement for mood status, and quality of life and a significant increase in step counts over time. The average increase in steps per day for both groups combined at baseline, 12 weeks, 24 weeks, and 48 weeks were 6941 steps/day, 9237 steps/day, 8804 steps/day, and 8450 steps/day, respectively. Based on this data, it appears that a pedometer intervention can promote a more physically active lifestyle over a 12 month period. Additionally, although physical activity counseling did not have further
38 19 influence on the number of steps taken daily above what was observed with the pedometer alone, the intervention group reduced their sedentary behaviour by -451 ± 848 minutes, whereas, the control group had a smaller reduction of -130 ± 568 minutes for weekly sedentary behaviour, respectively 77. In addition, both groups showed significant improvements for mood and quality of life over the 12 month study. Based on that data, it seems important that step-based pedometer interventions should include physical activity counseling sessions to change an individual s behaviour to help them adopt a healthier lifestyle, including more physical activity and less sedentary behaviour. The Green Prescription intervention enhanced with a pedometer. Kolt et al. 78 took the Green Prescription Intervention to the next level by adding a pedometer and a specific step goal target as a strategy to increase the physical activity levels of inactive older adults. Additionally, the effects of the interventions on blood pressure, body mass index (BMI), functional status, and health-related quality of life were assessed. About 330 low-active older adults were recruited from 10 primary care sites in New Zealand and were randomized to either the Standard Green Prescription Group or the Pedometer Step-Based Green Prescription group. Both groups had an in person visit with their physician and three physical activity counselling sessions over the phone over 12 weeks to increase their physical activity levels. The Standard Green Prescription group received counselling that focused on accumulating physical activity using time-related goals, while the Pedometer Step-Based Green Prescription group received counselling that focused on total daily steps target goal prescribed using a pedometer. Outcomes consisted of the Auckland Heart Study Physical Activity
39 20 Questionnaire, blood pressure, BMI, 36-item Short Form Health Survey (quality of life), Short Physical Performance Battery (physical function status), and self-reported falls or injuries. Data was collected at baseline and then again at 12, 16, and 52 weeks. The data indicated that both groups increased their physical activity levels and reduced their blood pressure following the 12-week intervention and these effects were maintained after 52 weeks. More notably, the Pedometer Step-Based Green Prescription group increased their leisure walking time by 63 minutes per week, as compared to 31 minutes per week for the Standard Green Prescription group after 12 weeks. After 52 weeks, the Pedometer Step- Based Green Prescription group was able to maintain their increased leisure walking time from the 12 week follow-up (+50 minutes/week) to a greater extent, than the Standard Green Prescription group (+28 minutes/week) after 52 weeks 78. Therefore, it appears that a pedometer step-based exercise prescription can be a viable approach to increase physical activity amongst inactive adults. However, there was a limitation with exercise intensity not being measured because it could not be determined if individuals were meeting the aerobic exercise component in the CPAG by walking. Heron et al. 79 conducted a study examining the effect that two pedometer interventions using different step-based goals have on patients ages attending four primary care clinics that completed a General Practice physical activity questionnaire during their appointments over 12 weeks. Forty-one patients were classified by the questionnaire as inactive and completed baseline assessments before being randomly assigned to either group 1 (prescribed a self-determined goal non specific increase) or group 2 (prescribed a specific goal 2500 steps/day above baseline). Both groups were required to keep stepcount activity logs and received telephone follow-up calls at 1, 2, 6, and 11 weeks. The
40 21 results showed that mean baseline step counts were similar between group 1 (5685 steps/day, SD 2945) and group 2 (6513 steps/day, SD 3350). In fact, group 1 (2602 steps/day, SD 1957) showed a greater mean increase in steps/day compared to group 2 (748 steps/day, SD 1997) (p=0.005) 79. These results support pedometer step-based exercise prescription as an effective method to increase total physical activity levels of inactive individuals from primary care clinics. However, exercise intensity was not measured in this study making it difficult to determine whether or not these individuals were walking at a moderate or vigorous intensity in order to meet the aerobic exercise component of the CPAG. Can pedometers help people increase MVPA while walking? A study conducted by Marshall et al. 41 was designed to translate the physical activity recommendations of at least 150 minutes of MVPA into a pedometer-based step goal. To accomplish this, the research team recruited 97 adults from the community to complete four 6-minute incremental walking bouts on a treadmill at different speeds, while measuring oxygen consumption using a metabolic cart. Three Metabolic Equivalents (METs) was determined as the threshold for moderate intensity based on the oxygen consumption of the participants 41. The three METS threshold for moderate intensity that Marshall et al. 41 used would be considered as low-intensity aerobic exercise if it was following the recommended guidelines outlined by Warburton et al. 62. The cadence was measured when three METs were achieved 41. They found that the different step rates analyzed showed a minimum threshold for moderate intensity walking being between 100 and 110 steps per minute 41. Therefore, to reach the recommendation of at least 150
41 22 minutes of moderate to vigorous intensity physical activity a week, a person should do a minimum of 15, 000 steps per week split amongst bouts lasting 10 minutes or longer on 5 or more days per week to reach the aerobic component of the CPAG 41. Marshall et al. 56 followed up their 2009 study by evaluating how effective three different pedometer-based step goals were for increasing MVPA in 180 healthy Latina women (aged 18-65). Women were recruited from 12 sites in San Diego and randomized into one of three interventions. Each intervention provided a 12 week theory-based physical activity intervention with weekly meetings for goal setting, but the groups differed in the prescription of step targets. Specifically, the first group used self-selected goals (SELF), the second group used 10,000 steps per day goal (FREQUENCY), and the third group used 3000 steps in 30 minutes goal (CADENCE). Physical activity levels were then measured using accelerometers at baseline and 12 weeks after the interventions were completed. Notably, the results showed that there was no significant difference between levels of MVPA measured in SELF, FREQUENCY, or CADENCE after 12 weeks. Even so, participants in the CADENCE based intervention were more likely to accumulate MVPA in 10 minute bouts or longer (~1.25 bouts per day - median), as compared to SELF (0.2 bouts per day - median) or FREQUENCY (0 bouts per day - median) 56. From these results, we can speculate that the CADENCE based prescription may be a strategy that enables participants to increase the amount of MVPA they perform on a weekly basis.
42 23 Integrating an exercise specialist into the primary health care team. The addition of exercise specialists to the primary health care team is another strategy to address the limitations primary care providers report, such as lack of time 29, 30 and experience 32 in counselling patients on physical activity 80, 81. This approach is supported by the United States Department of Health and Services because there is evidence indicating that exercise specialists can help participants become more physically active 4, 82. In Canada, CSEP has a Certified Exercise Physiology (CEP) training program, which provides the appropriate knowledge and skills to prescribe exercise for healthy populations and populations characterized by chronic conditions. CSEP-CEP s are also able to conduct health related fitness assessments in order to design individualized exercise prescriptions to safely increase the physical activity of participants of all ages, whether they have chronic diseases or not, if they are medically cleared by a physician to participate to a physical activity program 83. Specifically, they are able to conduct both maximal and submaximal assessment protocols to evaluate physical fitness. However, they are not authorized to work with acutely injured participants and individuals that are not cleared by their physician to participate in physical activity. Also, CSEP-CEPs cannot diagnose any pathology based on the evaluation of the assessments they conduct with the participant. Nonetheless, the CSEP-CEP certification is preferred over other exercise certifications in Canada because a 4-year university degree in exercise science or related area is required prior to passing a standardized written and practical test. Additionally, 200 hours of applied experience working with clinical populations is required for a candidate to become certified 83. The CSEP-CEP scope of practice and competencies are available for review in Appendix C.
43 24 In Canada, a study was conducted by Fortier et al. 55 to evaluate the impact of integrating a physical activity counsellor in the primary health care team would have on a population of previously inactive adults at a community-based primary care clinic. The participants in that study received brief counselling about physical activity from their provider at baseline and were randomized either to a control group or an intervention group. The control group received no further counselling about physical activity, while the intervention group received six intensive physical activity counselling sessions over the next 12 weeks from a physical activity counsellor. The physical activity counsellor had a Bachelor s of Science in Human Kinetics and was a CSEP-Certified Fitness Consultant (CFC), which was the certification program that preceded the development of the CSEP-CEP credential and was the highest qualification at the time in Canada. Physical activity outcomes were measured using questionnaires and accelerometers and were evaluated at baseline and then again every six weeks. The follow-up period after the completion of the 12 week intervention consisted of data being obtained at 13, 19, and 25 weeks. The results showed that at 6 and 13 weeks, the intervention group significantly increased their self-reported physical activity levels by about 8 units, as compared to the control group. The increase of 8 units in self-reported physical activity is equivalent to performing two additional 20 minute exercise sessions a week with one session being done at a mild intensity (i.e. 3 units) and the other at a moderate intensity (i.e. 5 units). However, there was no significant difference between the groups in terms of self-reported physical activity during the follow-up period. Additionally, there was no significant difference between the two groups when physical activity levels were measured by accelerometers at any time point 55. Therefore, it appears that general physical activity
44 25 counselling may not be the solution to increasing physical activity levels of inactive people. In fact, the data suggests that alternative strategies are needed to help people become more physically active. For example, it is possible that physical activity counselling would be more effective if the CSEP-CEP were to recommend that the client utilize the immediate visual feedback from a pedometer to monitor their physical activity levels. The ENCOURAGE Project. Our research group developed a study to better support physical activity as a health intervention through physical activity counselling and referrals to community-based physical activity opportunities in inactive adults. The purpose of the ENCOURAGE project (ENhancing primary care COUnselling and Referrals to community-based physical Activity opportunities for sustained lifestyle change) was to improve physical activity prescription within two primary health care clinics and to develop a referral process to link patients from the clinic to community-based physical activity programs or self-directed physical activity opportunities. One hundred and nineteen eligible participants were recruited from two primary care clinics in Winnipeg, Manitoba to participate in the ENCOURAGE project. Eligible participants were identified after using a touch screen computer Risk Factor Identification Tool (RFIT). This tool enabled the research team to assess the participant health risks and readiness to change their behaviour by asking the participant questions about their relevant risk factors for chronic disease. From the participant answers, a report was printed containing information about chronic risk disease factors that the participant could choose to show to their primary care
45 26 provider. The RFIT was developed and validated by our research team 84. The questions that are asked during the RFIT can be found in Appendix D. The ENCOURAGE study participants received five physical activity counselling meetings over a 16-week period with a CSEP-CEP, with each lasting approximately minutes in length. The outcomes were measured using a series of questionnaires assessing different variables, RFIT, and accelerometer data taken at five times points (Baseline, 8, 16, 24, and 40 weeks) to assess participant s physical activity levels over time. The ENCOURAGE project differed from the Fortier et al. 55 study because it was conducted at multiple primary clinic sites, had a longer intervention period and a longer follow-up period. It also utilized the Expanded Chronic Care Model (Figure 1) to guide the development of specific aspects of the project 85.

46 27 Figure 1: The Expanded Chronic Care Model. The ENCOURAGE project combined the work health systems provide and community participation to promote population health that targets chronic disease issues. Adapted from Barr et al. Hosp Q. 7: The components of the Expanded Chronic Care Model that the ENCOURAGE project influenced are: 1) Delivery System Design The study created a referral system for participants to be referred from health care professionals at the clinics to a CSEP-CEP. The CSEP-CEP was then able to refer the participants to physical activity programs in the community. 2) Decision Support The addition of the CSEP-CEP to the health care team ensured that participants could receive specific physical activity counselling to
47 28 become more active and gain health benefits. The CSEP-CEP also supported the health care professionals at the health care clinics by providing them with specific physical activity supports or referral information for their patients. The RFIT also supported decision making by providing a report about chronic disease risk factors, which the physician could use to decide if a referral to a specialist was needed to provide optimal care to the patient 84. 3) Information Systems The Electronic Medical Records (EMR) was the information system utilized, where all health care professionals at the two clinic sites can enter patient information to be reviewed by each other. Notably, other health care professionals were able to read the physical activity notes entered in the EMR by the CSEP-CEP during participant meetings to follow patients as they tried to become more active. They reinforced the physical activity behaviour change by speaking with the patient. Finally, they documented their notes within the EMR so the CSEP-CEP could continue to build on their input. This innovation allowed for discussion between health care professionals as they could work together to reinforce health behaviour change. 4) Self-Management The CSEP-CEP taught the participants the skills they needed to develop their own action plans to become physically active and provided them with the skills and tools needed to address current and future barriers that may have prevented them from being more physically active. 5) Establishing Partnerships with Existing Community-Based Physical Activity Programs The CSEP-CEP developed partnerships with existing communitybased physical activity programs, such as the Young Men s and Young Women s
48 29 Christian Association of Winnipeg Incorporated (the YMCA-YWCA). This established a referral process between the CSEP-CEP and nearby exercise facilities to provide the participants with more options to become more physically active with different physical activity programs. For example, the CSEP-CEP established a program where facilities provided participants with free tours and day-passes to experience first-hand the facility based on the recommendations from the CSEP-CEP. The CSEP-CEP also referred patients to exercise classes at these facilities as a way to match participant interests with existing programs. This could have appealed to the participants more and motivated them to become physically active at the existing program. 6) Create Supportive Environments The ENCOURAGE project research team helped existing service providers develop new exercise classes in various locations in Winnipeg, such as the public library, City of Winnipeg facilities and Access health clinics, where participants could exercise in a comfortable environment and develop relationships with other participants. The exercise classes were specifically designed to help create a link between the primary health care clinic and the community to be able to refer patients to community exercise programs tailored for previously inactive adults. This approach helped the participants feel more comfortable being physically active because the exercise classes were appropriate for the patient s physical activity level. 7) Strengthen Educational Programs Offered at the Clinics The primary health care clinics run programs that provide knowledge about coping with certain chronic diseases, such as Type 2 Diabetes. These programs are led by different
49 30 specialists depending on the topic being covered. For examples, nutritional information has traditional been taught by a Dietician. In contrast, physical activity was not being taught by an exercise specialist. The ENCOURAGE project addressed that limitation so physical activity information was being taught by the CSEP-CEP at the two clinic sites. Community-based interventions following a social ecological framework have been shown to positively influence PA behaviour and attitudes 86, 87. Ecological models are used in public health to assess people s interactions with their physical and sociocultural surroundings 88. The ENCOURAGE project incorporated specific aspects from two domains in the ecological model framework for active living 87. The two domains were active recreation and active transport 87. Active recreation was addressed in the ENCOURAGE project with the referral system linking the individual to community organizations, such as the YMCA-YWCA that provide programs and opportunities to take part in physical activity. Active transport was utilized in the ENCOURAGE project with the CSEP-CEP promoting active transport as a way to increase physical activity levels since most people choose to walk as their main mode of exercise 37. The ENCOURAGE project provided the link needed between the health care system and community-based programs to help inactive adults become more physically active by offering physically activity counselling from a CSEP-CEP and a referral system to physical activity programs in the community. It is notable that walking was an activity that 46 of 119 participants in the ENCOURAGE project identified as their preferred way to enhance their activity levels. In fact, the CSEP-CEP taught the study participants how to utilize a pedometer as a tool to increase their physical activity levels by monitoring the
50 31 total number of steps they take in a day. However, he did not typically teach participants how to use pedometers as a tool to help them understand how fast they should walk in order to achieve better health outcomes or reach the intensity recommended by the CPAG for aerobic exercise. With this in mind, our research team considered the merits of embedding a second research study within the ENCOURAGE project to specifically determine if teaching patients how to use a pedometer to monitor their exercise intensity, while walking, would increase the total time spent at MVPA. Such an approach has been used previously by Kolt et al. 78, where a pedometer-based exercise prescription was embedded into the ongoing Green Prescription physical activity intervention to determine if this additional strategy would enhance physical activity levels to a greater extent.
51 32 Rationale, objectives and hypotheses Chapter 2: Study Design A majority of Canadian adults are not reaching the appropriate volume and intensity of physical activity required to reach the aerobic exercise recommendation in the CPAG. Based on the literature presented, adults have a difficulty recognizing their exercise intensity and, therefore have difficulty doing 150 minutes of MVPA. However, we believed that there was an opportunity to help previously inactive adults to increase the time spent at MVPA during walking by providing them with instant visual pedometer feedback and a specific cadenced-based exercise prescription so they can recognize, monitor and understand when they are exercising at a moderate-vigorous intensity. The objective of this prospective interventional trial was to determine if an individualized cadence-based pedometer exercise prescription increases the amount of time that participants spend doing moderate-vigorous intensity while walking. The individualized cadence-based pedometer prescription was generated during an intervention meeting that consisted of a combination of an indirect aerobic fitness test, a short educational session and the use of a pedometer to individualize the walking cadence (steps per minute) needed to reach moderate intensity for each participant. After the meeting, the participants were instructed to use their individualized cadenced-based exercise prescription to monitor their intensity when exercising on their own. The primary outcome measure was a change in the total number of weekly minutes spent exercising at moderate-vigorous intensity, as measured by accelerometer before and after the intervention meeting. We collected data at baseline (T0), 8 weeks (T1), 16 weeks (T2), and 24 weeks (T3) as seen in Figure 2. Furthermore, we determined if the amount
52 33 of MVPA was enhanced to a greater extent amongst participants who received the individualized cadence-based prescription, as compared to those who do not. Figure 2: The prospective interventional trial design that was utilized for participant recruitment and data collection for the Pedometer Project. CSEP-CEP, Canadian Society of Exercise Physiologists Certified Exercise Physiologist; CBEP, Cadence- Based Exercise Prescription; T0, baseline time point; T1, 8 week time point; T2, 16 week time point; T3, 24 week time point. CSEP- CEP CSEP- CEP CSEP- CEP CSEP- CEP CSEP- CEP Research Follow-up Appointments (RT): Accelerometers, Questionnaire, RFIT CBEP RT RT Intervention RT Identify CBEP Meeting Eligible Candidates (n=46) Weeks RT CBEP Participant Recruitment (n=21) T0 T1 T2 T3 We hypothesized that: 1) The group of people who received the individualized cadence-based pedometer exercise prescription (CBEP) would increase their MVPA time to a greater extent compared to the standard care group (SC) at T2 and T3, as compared to T1.
53 34 2) CBEP will improve other objectively measured physical activity and self-reported outcomes to a greater extent compared to SC at T2 and T3, as compared to T1. Ethics approval The study has been approved by three ethics review panels, namely 1) the University of Manitoba Education/Nursing Research Ethics Board (ENREB); 2) the Winnipeg Regional Health Authority Research Review Board; and 3) the St. Boniface Hospital Research Review Committee. Participant recruitment For clarity, we will refer to the current study as the Pedometer project to distinguish it from the ENCOURAGE study. The participants for the Pedometer project were recruited from the ENCOURAGE study cohort. One reason for using this approach is based on opportunity because one of the tools that the ENCOURAGE CSEP-CEP used to support patients as they sought to increase their physical activity levels was to provide some of them with a pedometer and advise them to achieve the 10,000 steps per day. However, his standard practice was to prescribe a total steps based prescription. With this in mind, there was an opportunity to recruit a total of 46 participants that were eligible for the pedometer project. See Figure 2 for the flow of recruitment.
54 35 Figure 3: The total number of participants involved in each section of the recruitment process for the Pedometer project. To, baseline time point, T1, 8 week time point; T2, 16 week time point; T3, 24 week time point. Total participants in ENCOURAGE study at T0 (n=119) Total eligible participants for Pedometer project (n=46) Allocated into control group (n=16) Made contact with participants for Pedometer project (n=30) Declined -Time (n=4) -Not interested (n=2) -Other (n=3) Control group adds participants that declined intervention, but consented to be in control group (n=25) Consented for intervention (n=21) T1 Data Collection -Completed (n=23) -Two participants missed T1 appointment T1 Data Collection -Completed (n=21) T2 Data Collection -Completed (n=18) -Seven participants dropped out before T2 appointment T2 Data Collection -Completed (n=19) -Two participants dropped out before T2 appointment T3 Data Collection -Completed (n=14) -Two participants dropped out before T3 appointment -Two participants missed only T3 appointment T3 Data Collection - Completed (n=19)
55 36 The inclusion criteria for the ENCOURAGE study consisted of male and female participants in the age range of 25 to 75 years that are identified as physically inactive by the RFIT (i.e. they self-report not meeting the CPAG recommended aerobic exercise of 150 minutes of moderate-vigorous intensity physical activity weekly) and reported being ready to adopt a more physically active lifestyle (i.e. they self-report being in the preparation stage of behavioural change as described in the transtheoretical model 89 ). Participants were excluded from the ENCOURAGE study if they had previously been diagnosed with a chronic disease (such as type 2 diabetes) or other conditions that would limit their ability to complete the intervention, such as exercise-induced angina or arrhythmia. Participants were also excluded if they were in the pre-contemplative stage of change because these participants are less likely to adopt a more physically active lifestyle 89. It is important to indicate that the current pedometer study had additional inclusion criteria. For example, participants must report that walking was their main mode of physical activity. Also, participants must have been using a pedometer so they are familiar with how to use the device and its functions. A person was excluded from the study if they could not participate due to physical limitations (e.g., shin splints, deep vein thrombosis, leg injury) that would prevent them from being able to walk. People that could not attend the cadence-prescription meeting for any reason, such as geographical limitations, were also excluded. Finally, participants that were using medications that limited heart rate were excluded. This criteria was selected because heart rate was utilized to help calculate the individualized cadence-based prescription.
56 37 The 46 eligible participants that were eligible for the pedometer project were allocated to either a Standard Care group (SC; n=25) or Cadence-Based Exercise Prescription group (CBEP; n=21). The specific processes for participant recruitment and data collection that were utilized in the Pedometer project are summarized in Figure 3. Specifically, the processes that were utilized include: 1) Participants were identified for inclusion in this study by the CSEP-CEP involved in the ENCOURAGE study after they met with the CSEP-CEP on three occasions during the first six weeks of the ENCOURAGE study. The CSEP-CEP then forwarded the names of the potential participants to the Pedometer project research staff. A recruiting list for potential participants was developed in order of the date for their scheduled eight week follow-up appointment as part of the ENCOURAGE study. 2) The research staff were aware that there was potentially bias with the CSEP-CEP identifying and influencing potential participants for the Pedometer project. Therefore, a number assignment of 2:1 for participants being approached for the Pedometer project was used for allocation. The number system consisted of the research staff approaching the two eligible participants on the eligibility list at their scheduled eight week follow-up appointment as part of the ENCOURAGE study. This was when the research staff would introduce the Pedometer project to determine if the participant was interested in joining the CBEP intervention. If the approached participant did not want to participate in the CBEP intervention then they were asked if they would be willing to be part of the SC group. The third eligible participant on the recruiting list was automatically placed in SC. The
57 38 number system was repeated and followed no matter what the first two eligible participants approached decided to do. 3) If they volunteered to participate in the Pedometer project, they were asked to provide informed consent. The SC group was asked to complete the series of questionnaires, RFIT and wear an accelerometer for a 7-day period. While the participants assigned to the CBEP group completed the same standard care as the ENCOURAGE project cohort, they received a pedometer intervention sheet with instructions regarding the intervention meeting scheduled within the following two weeks. The Pedometer intervention sheet can be found in Appendix E. 4) T0 for the ENCOURAGE study was used as a reference point to compare to the T1 data collection for the Pedometer project (Figure 3). Follow-up data was then collected at T2 and T3 based on the ENCOURAGE study data collection schedule. Standard care The 25 participants in the SC group continued to receive standard care as part of the ENCOURAGE study as summarized on Table 1. Briefly, standard care consisted of five minute meetings (i.e. baseline, 2 weeks, 6 weeks, 10 weeks, and 16 weeks) designed to help the participant learn the skills they need to develop an action plan so they can become more physically active.
58 39 Table 1: The CSEP-CEP followed the time line session guide to provide the standard care to all participants in the ENCOURAGE study. CSEP-CEP, Canadian Society of Exercise Physiologists Certified Exercise Physiologist.
59 40 Cadence-based pedometer exercise prescription group In addition to the standard ENCOURAGE intervention, the 21 participants in the CBEP group met with the Pedometer project research team for a 60 minute meeting at the participant s preferred location where it was possible to walk for 30 consecutive minutes on a flat surface (e.g., mall, arena, park, walking trail, sidewalk near their home or at a fitness gym on a treadmill). During the meeting, the participant received 10 minutes of instructions on how to walk at a speed that was considered to be a minimum of moderate intensity (40%-59% of HRR) and its importance for optimal health benefits 62. The participant was asked to wear a Garmin FR60 heart rate monitor that included accessories such as a foot pod to measure cadence (steps/min), a watch to display the participant s heart rate and cadence (steps/min) and a chest strap 90, 91. While receiving the instructions, the participant was in a seated position for a minimum of five minutes. This approach was utilized so we could measure HR rest. We then used Equation 2, Equation 3, and Equation 4 (n.b.; found in the Heart Rate Monitor section of the document) to calculate the participant s heart rate target to achieve the walking cadence equivalent to moderate intensity. For Equation 4, we used 50% of HRR as the target intensity because it is the middle point of the target heart rate zone considered moderate (40%-59% of HRR) 62. The log sheets used for the patient meetings are listed in Appendix F. After calculating the target heart rate, each participant was then asked to perform a 6 Minute Walking Test (6MWT). The goal of the 6MWT was to walk as quickly as possible for six minutes in order to cover as much distance as possible. Participants were able to stop for a rest at any time if needed 92. The 6MWT measures a person s ability to perform activities of daily living, such as walking, stair-climbing, or shopping 61. The 6MWT has
60 41 previously been used to evaluate exercise capacity within clinical populations 93. The 6MWT has been found to have a moderate correlation of r=0.49 (p=0.001) with VO 2max and an equation was developed to calculate VO 2max based on the 6MWT results in healthy adults that is shown in Equation VO 2max (ml/kg/min) = (0.023 X 6MWT [m]) Equation 5 (0.276 X weight [kg]) (6.79 X sex, where male=0 or female=1) (0.193 X resting HR [beats per minute]) (0.191 X age [years]) During the 6MWT, we were able to identify each participant s walking cadence needed to reach 50% of HRR (Cadence mod ) using a pedometer. When their target heart rate at a moderate intensity was achieved, the research team (n.b.; described in the subject characteristics section) recorded their walking cadence and RPE based on a Borg Scale from 1 to The participant s walking cadence and RPE was taken again at the completion of the 6MWT. Our committee recommended that we collect accelerometer data during the 6MWT to compare the Garmin FR60 measured cadence and the accelerometer measured cadence at the time Cadence mod was achieved. This is important because there is currently no literature comparing the two devices. However, we were only able to get two participants to wear the accelerometer during the 6MWT because we decided to evaluate the cadence measured between the two devices near the end of our participant recruitment phase. Once we had determined the participant s Cadence mod, we asked the participant to walk at that pace for five minutes so they could become familiar with the cadenced-based prescription. At the end of the 5 minute walk, we used the pedometer to compare the
61 42 steps taken in 5 minutes at their perceived Cadence mod walking pace to the prescribed steps for 5 minutes determined by Cadence mod. At the end of the meeting, we provided the participant with their individualized cadence-based prescription sheet to take home. The cadenced-based prescription provided them with a cadence prescription (i.e. the number of steps they must take within a certain amount of time) to achieve moderate intensity. We then translated their individualized walking cadence to total number of steps for a fix period of time (e.g., 3000 steps in 30 minutes). An example of the cadence-based exercise prescription is available in Appendix G. We also reminded the participant to expect two follow-up phone calls to find out if the participant was using the cadenced-based exercise prescription and to ask for feedback regarding the CBEP intervention meeting. The two follow-up phone calls were done at 2 weeks and 6 weeks from the CBEP intervention meeting date. An example of the CBEP follow-up phone call script is available in Appendix H. Before leaving the participant, we also provided the participant with a Piezo pedometer if they used a different pedometer model and a copy of CPAG specific for their age group. The CPAG for adults years is listed in Appendix A and the CPAG for older adults 65 years and older is in Appendix B. All 21 participants who completed the 6MWT during the intervention meeting were able to reach their target heart rate for moderate intensity by walking. Subject characteristics The research staff collected the following physical measures: height, weight and resting heart rate. All procedures were conducted by the research assistant and followed the Advanced Fitness Assessment and Exercise Prescription procedures for
62 43 measurement of height, weight, and resting heart rate 61. The research assistants have the skills, knowledge and experience with measuring the described physical measures during completion of their Kinesiology degree. Primary outcome measure A change in the total number of weekly minutes of MVPA performed in 10 minute bouts or longer (MVPA 10min ) measured at T2 and T3, as compared to T1, was the primary outcome variable in this study. This was our primary outcome measure because the CPAG recommends accumulating 150 weekly MVPA minutes in 10 minute bouts or longer for aerobic exercise. These recommendations are based on evidence from systematic reviews to provide support that the CPAG can help achieve optimal health benefits 13, 95. Actigraph multi-directional accelerometers were used to measure the primary outcome variable because they are accurate and reliable 50, 51 for measuring the amount, intensity, and duration of physical activity that each individual completes in their free-living environment 52. An example of the output that the accelerometers provide can be found in Appendix I. A valid accelerometer file was defined as the participant having worn the accelerometer for at least 3 days 96. A valid day of accelerometer data was defined as 8 or more hours of wear time. Non-wear time was defined as at least 60 consecutive minutes of zero counts between 0 and 100 3, 97. Wear time was defined by subtracting non-wear time from 24 hours 3, 97. The accelerometer recorded counts in 30 second intervals. The time spent at a given intensity is based off cut-off points that are used to relate the activity during the 30 second intervals to a specific intensity 3, 97. The specific cut-points used to distinguish sedentary, light,
63 44 moderate, and vigorous intensity activities were 3, 97 : 1) Sedentary intensity cut-points: 0 50 counts 2) Light intensity cut-points: counts 3) Moderate intensity cut-points: counts 4) Vigorous intensity cut-points: counts The MVPA 10min data was then used to classify the participant as having met or not met the aerobic exercise component of the CPAG (MVPA AE-CPAG ). In addition, we evaluated the number of total physical activity and MVPA bouts per day participants were performing for 10 minutes or longer (e.g. TotalPA Bouts10min, MVPA Bouts10min ). Additional outcome measures A change in the total daily physical activity, MET-minutes per week and step counts accumulated at different intensities were measured using Actigraph multi-directional accelerometers at T0, T1, T2 and T3. Total daily physical activity and MET-minutes per week was measured in 10 minute bouts or longer (TotalPA 10min, MET-min Total10min ) and in sporadic bouts (TotalPA Spor, MET-min TotalSpor ), which was defined as activities that were accumulated in 30 second bouts or longer. These outcomes included all the physical activity the participant accumulated at different intensities (light, moderate, and vigorous) throughout the day. Total MET-minutes per week were manually calculated by: MET level x minutes of activity x days per week. Each category of activity was assigned a given MET level (Vigorous = 8 METs; Moderate = 4 METs; Light = 3.3 METs). MVPA was also measured in sporadic bouts (MVPA Spor ). The specific accelerometers that were utilized in this study could also measure steps (e.g., Steps MVPA, Steps Total ), which allowed us to determine the total steps a participant
64 45 performs at specific intensities each day. Strong correlations (r=0.85, p<0.01 & r=0.87, p<0.01) have been shown between accelerometer and pedometer determined step counts 98. Therefore, we analyzed total steps per day (Steps Total ) as well as total steps per day accumulated at moderate-to-vigorous intensity (Steps MVPA ) as secondary outcomes. The Steps Total outcome was calculated as the sum of all the steps the participant performed at light, moderate, and vigorous intensity throughout the day. The Steps Total data was then used to classify the participant as having reached or not reached 10,000 steps per day (Steps 10,000 ). The Actigraph accelerometer has shown high interinstrument reliability for total activity counts, steps and time spent doing sedentary, light, vigorous, and MVPA intensity activities 99. Specifically, the measurement for the amount of time spent doing activity at MVPA intensity showed an intraclass correlation coefficient, coefficient of variation, and absolute percent error was 0.99, 3.7 ( ), and 4.9 ( ), respectively 99. Surveys RFIT self-reported physical activity The RFIT generated a report that provides information on chronic disease factors that may affect the participant s health based on the participant s responses to specific questions about certain risk behaviours. Specifically, the Pedometer project focused on the change in self-report physical activity (RFIT MVPA ) based on their answers in the physical activity section of the RFIT measured at T0, T1, T2 and T3. The self-reported physical activity data was then used to classify the participant as having met or not met the aerobic component of the CPAG (RFIT AE-CPAG ). The physical activity questions asked to gather the self-report physical activity can be found within Appendix D.
65 46 Short form-12 health survey (SF-12) The Short Form 12 Health Survey (SF-12) is a 12 item summary of physical and mental health components that was used to assess the change in the participant s quality of life at T0, T1, T2 and T3. The SF-12 is a shortened version of the 36-item short health survey (SF-36) and has been shown to be a reliable and valid tool at assessing quality of life 100, 101. Participants were given a score ranging from 0-100% across physical and mental functioning scales of health in accordance with the standardized SF-12 scoring system ( A lower score indicates a poorer health score while a higher percent score indicates a more favourable health score. Statistical analysis The primary outcome variable of changes in MVPA 10min was analyzed using a twoway ANOVA where time (T0, T1, T2, and T3) is a repeated measure and the experimental groups (SC and CBEP) are considered to be between group comparison. If differences were identified by the ANOVA, a Newman Keuls post hoc analysis was utilized to identify differences between specific means. A two-way ANOVA analysis was conducted in the same manner on other additional variables (e.g. TotalPA 10min, TotalPA Spor, MET-min Total10min, MET-min TotalSpor, MVPA Spor, TotalPA Bouts10min, MVPA Bouts10min, Steps MVPA, Steps Total, RFIT MVPA, SF-12 physical and mental functioning) as well. Significance was accepted at p<0.05. We planned to test for normalcy for these variables; however, we are unaware of a non-parametric method similar to the two-way ANOVA. Therefore, we assumed the data was normally
66 47 distributed in order to perform the two-way ANOVA. Some data (e.g. Gender, Season, Questions 1, 3, 5, 8, and 9 in the intervention meeting follow-ups, MVPA AE-CPAG, Steps 10,000, RFIT AE-CPAG ) was assessed using a 2x2 Chi- Square test and expressed in frequencies (percentage of group). Baseline characteristics and absolute (e.g. change from T1 to T2, change from T1 to T3, change from T2 to T3) and relative changes (e.g. percent change from T1 to T2, percent change from T1 to T3, percent change from T2 to T3) were tested for normalcy using the Shapiro-Wilk test (normal distribution, p 0.05). An independent t-test was used to compare differences for baseline characteristics as well as absolute and relative changes in each of the outcome variables between SC and CBEP if the data was normally distributed. Normally distributed data were expressed as means ± standard error. Non-parametric data was analyzed using the Mann-Whitney U-test and expressed as median (25 th to 75 th percentile). We used a paired t-test to compare differences for the prescribed steps and actual steps taken at Cadence mod for a 5 minute walk during the CBEP intervention meeting. Furthermore, we conducted the same analysis to compare the differences in self-reported physical activity in Question 6 from the intervention meeting follow-ups (Appendix H) completed at 2 and 6 weeks. A Pearson Correlation was used to analyze the relationship between self-reported physical activity (RFIT MVPA and Question 6 from the intervention meeting follow-up seen in Appendix H). We excluded participants from our analysis if they dropped out of the ENCOURAGE study after T1 or if they were missing two or more data points for any of the variables. For participants who were missing one data point (e.g. missed a research follow-up appointment, invalid accelerometer days, incomplete survey and/or RFIT), we carried their last data point
67 48 forward to fill the missing data point to complete the data set for all participants included in our analysis. The study population for the analysis consisted of 16 participants in SC and 19 participants in CBEP.
68 49 Chapter 3: Results Baseline characteristics Baseline characteristics were collected for all study participants (SC, n=16; CBEP, n=19) during their initial meeting with the CSEP-CEP and research assistants from two primary clinics in Winnipeg, MB and can be viewed in Table 2. Participant demographics, including age, gender, height, weight, and BMI did not differ between SC and CBEP. Table 2. Comparison of baseline characteristics between the participants in the Standard Care group (SC) and Cadenced-Based Exercise Prescription group (CBEP). SC CBEP p-value Demographics Age (years) 54 (49 to 59) 50 (42 to 58) N.S. Gender (% female per group) 11 (69%) 13 (68%) N.S. Height (cm) 166 ± ± 2 N.S. Weight (kg) 99 (89 to 109) 107 (96 to 118) N.S. BMI (kg/m 2 ) 36 ± 1 39 ± 1 N.S. Continuous variables expressed as mean ± standard error (e.g., height, BMI) or median (25 th to 75 th percentile; e.g., age, weight). Categorical variables expressed in frequencies (percentage of group). SC, Standard Care group n=16; CBEP, Cadenced-Based Exercise Prescription group n=19. BMI, body mass index. The number of participants that began the ENCOURAGE study in each month is shown in Table 3. Furthermore, we divided the experimental groups into seasons. The seasonal group the participants were placed in was determined by their starting month. Participants were placed in the Spring/Summer group if they began the ENCOURAGE study in March to August; and the Fall/Winter group if they began in September to
69 50 February. The range of months used for each seasonal group was utilized because it defined the season that the participants would be spending a majority of the Pedometer project in. During our Chi-Square test analysis, we found no differences between SC and CBEP for the number of participants that was classified into each seasonal group. Table 3. The month when the Standard Care group (SC) and Cadenced-Based Exercise Prescription group (CBEP) started the ENCOURAGE study at baseline (T0). SC CBEP Month January 5 (31%) 0 (0%) February 0 (0%) 1 (5%) March 1 (6%) 3 (16%) April 1 (6%) 6 (32%) May 3 (19%) 4 (21%) June 2 (13%) 0 (0%) July 1 (6%) 2 (11%) August 2 (13%) 0 (0%) September 0 (0%) 1 (5%) October 1 (6%) 1 (5%) November 0 (0%) 1 (5%) December 0 (0%) 0 (0%) Season Spring/Summer (March to August) 10 (62%) 15 (79%) Fall/Winter (September to February) 6 (38%) 4 (21%) Categorical variables expressed in frequencies (percentage of group). SC, Standard Care group n=16; CBEP, Cadenced-Based Exercise Prescription group n=19. T0, baseline time point. Intervention meeting and follow-up data During the intervention meeting that was scheduled two weeks after T1, we collected data for baseline measures of the 19 CBEP participants before performing the 6MWT
70 51 (Table 4). In addition, we recorded the information from the 6MWT and the 5 minute walk that was completed in order to compare the prescribed steps for a 5 minute walk to the actual steps taken during the 5 minute walk at Cadence mod. We found that the average prescribed cadence for 50% HRR was 126 ± 2 steps per minute. Furthermore, the CBEP participants reported a Borg Scale rating of 4 ± 0.4 when they reached 50% HRR. The average 6MWT distance was 554 ± 14 metres for CBEP. We calculated VO 2Max (ml/kg/min) using Equation 5 94 and found a VO 2Max of 24 ± 1 ml/kg/min. When we looked at the 5 minute walk results, we found the difference between the prescribed steps (632 ± 9) and actual steps (616 ± 13) taken over the 5 minutes was 17 ± 9 steps. Furthermore, we performed a paired t-test to compare differences in the prescribed steps at Cadence mod for a 5 minute walk and the actual steps taken at Cadence mod during a 5 minute walk. The results showed no significant difference between the prescribed steps and actual steps taken for a 5 minute walk at Cadence mod during the CBEP intervention meeting.
71 52 Table 4. Cadenced-Based Exercise Prescription group (CBEP) results during the intervention meeting. CBEP Baseline Measures Do you think you are reaching moderate intensity when you currently exercise? (% Yes per group) 13 (68%) HR max (beats/min) 173 ± 2 HR rest (beats/min) 80 ± 3 HRR (beats/min) 93 ± 3 6MWT Target HR at 50% HRR (beats/min) 127 ± 2 Cadence mod (steps/min) 126 ± 2 Borg Scale Rating at Cadence mod 4 ± 0.4 6MWT Final HR (beats/min) 138 ± 3 6MWT Final Cadence (steps/min) 125 ± 2 6MWT Final Borg Scale Rating 6 ± 0.4 6MWT Distance (m) 554 ± 14 VO 2Max (ml/kg/min) 24 ± 1 5 Minute Walk Prescribed Cadence mod (steps/min) 126 ± 2 Prescribed steps at Cadence mod for a 5 minute walk (steps) 632 ± 9 Actual steps at Cadence mod during a 5 minute walk (steps) 616 ± 13 Difference between prescribed steps and actual steps during 17 ± 9 a 5 minute walk (steps) Continuous variables expressed as mean ± standard error. Categorical variables expressed in frequencies (percentage of group). CBEP, Cadenced-Based Exercise Prescription group n=19. HR max, maximum heart rate; HR rest, resting heart rate; HRR, heart rate reserve; Cadence mod, cadence when target HR at 50% of HRR is achieved; 6MWT, 6 minute walking test; VO 2Max, maximum oxygen consumption. We performed a sub-analysis on two participants that wore their accelerometer during the 6MWT and observed that the cadence measured by the Garmin FR60 and accelerometer at 50% HRR was achieved was similar (Table 5). Participant #1 had a cadence of 120 steps per minute and 121 steps per minute at 50% HRR measured using
72 53 the Garmin FR60 and accelerometer, respectively. Furthermore, Participant #2 achieved a cadence of 130 steps per minute using the Garmin FR60 and 132 steps per minute using the accelerometer when 50% HRR was reached. Therefore, it appears that the accelerometer cut-points used to identify Steps MVPA was appropriate to use with our study population. Table 5. Cadence measured by the Garmin FR60 device and the accelerometer at the time target heart rate (HR) at 50% of heart rate reserve (HRR) is achieved that was completed with two participants. Garmin FR60 Accelerometer CBEP Cadence mod (steps/min) Participant # Participant # Values expressed as steps/min. CBEP, Cadenced-Based Exercise Prescription group n=2. HRR, heart rate reserve; Cadence mod, cadence when target HR at 50% of HRR is achieved. After the intervention meeting, the CBEP participants completed two follow-up phone calls at 2 and 6 weeks. The phone calls consisted of questions described in Appendix H and Table 6. The answers were then grouped together to fit common themes in Table 6. Ninety-five percent of the CBEP group reported that they continued using the pedometer 2 and 6 weeks after the intervention. One participant did not use a pedometer because they did not find it useful. For the people that did use the pedometer, 37% and 32% of the CBEP participants used the pedometer only while walking for exercise at 2 weeks and 6 week follow-up, respectively. At both follow-ups, the remaining participants reported wearing the pedometer all day, everyday. In addition, all of the
73 54 CBEP participants that used the pedometer reported that they liked the new method for tracking exercise intensity using the pedometer when asked at 2 week follow-up. The one participant who did not use the pedometer thought they would like the new method for tracking exercise intensity if they used the pedometer. However, only 74% of the CBEP participants reported liking this method when asked at 6 week follow-up. It was also notable that 63% and 79% of the CBEP participants did not report any challenges of using the pedometer for exercise at 2 week and 6 week follow-up, respectively. Fiftythree percent and sixty-eight percent of the CBEP participants felt motivated to do more physical activity because of the cadenced-based prescription when asked at 2 weeks and 6 weeks, respectively. The CBEP participants reported spending 287 ± 135 minutes per week and 286 ± 139 minutes per week walking at 2 week and 6 week follow-up, respectively. Moreover, 37% of the CBEP participants preferred trying to reach the prescribed steps per minute to reach moderate intensity goal rather than trying to reach 10,000 steps per day at both follow-ups. It was also notable that 74% and 100% of the CBEP participants reported being motivated by the intervention (i.e. meeting itself) to participate in more physical activity at 2 week and 6 week follow-up, respectively. Furthermore, 95% and 100% of the CBEP participants reported the intervention meeting helpful at 2 week and 6 week follow-up, respectively. The one person at 2 week followup that did not find the meeting helpful said it was because they did not understand the concept of the intervention meeting. We conducted a Chi-Square Test to compare the number of participants that answered yes or no for Questions 1, 3, 5, 8, and 9 in the CBEP intervention meeting followups. If the participant answered not sure then we considered that as a no answer.
74 55 This would allow us to perform the 2x2 Chi-Square Test analyses. There was no difference at 2 (95%) and 6 (95%) week follow-up for the number of participants using a pedometer after meeting with the researchers. In addition, no difference was found for the number of participants liking the new method of tracking exercise intensity at 2 (100%) and 6 (74%) week follow-up. When we analyzed Questions 5 and 8 regarding motivation, there was no difference between the number of participants that reported being motivated to participate in more physical activity because of CBEP and the intervention (i.e. meeting itself) at 2 (CBEP, 53%; intervention, 74%) and 6 (CBEP, 68%; intervention, 100%) weeks after the CBEP intervention meeting. Moreover, no difference was found in the number of participants that found the intervention meeting helpful at 2 (95%) and 6 (100%) week follow-up. Furthermore, we performed a paired t- test to compare differences in weekly minutes of self-reported physical activity at 2 and 6 week follow-up. The results showed no significant difference between the weekly minutes of self-reported physical activity 2 and 6 weeks after the CBEP intervention meeting.
75 56 Table 6. Results from the CBEP participants intervention meeting follow-ups completed at 2 and 6 weeks. 2 Weeks 6 Weeks Follow-up Data Q1: Have you been using the pedometer since your meeting with the researchers? Yes 18 (95%) 18 (95%) No 1 (5%) 1 (5%) Don t find it useful 1 (5%) 1 (5%) Q2: When are you wearing the pedometer? All day (including exercise period) 11 (58%) 12 (63%) Exercise period only 7 (37%) 6 (32%) Not applicable (i.e. did not use pedometer) 1 (5%) 1 (5%) Q3: Do you like this new method of tracking exercise intensity? Yes 19 (100%) 14 (74%) No 0 (0%) 2 (11%) Not sure 0 (0%) 3 (16%) Q4: What are the main challenges to using the pedometer for exercise alone? Not enough time 2 (11%) 2 (11%) Don t find it useful 2 (11%) 0 (0%) Too hard to keep track of 2 (11%) 1 (5%) Doctor said not to increase intensity 1 (5%) 0 (0%) Other (Did not specify) 0 (0%) 1 (5%) None 12 (63%) 15 (79%) Q5: Is the steps per minute prescription motivating you to do more physical activity? Yes 10 (53%) 13 (68%) No 6 (32%) 5 (26%) Not sure 3 (16%) 1 (5%) Q6: How many minutes of walking have you been doing in one week on average? (self-reported) # 287 ± ± 139
76 57 Q7: Which goal do you prefer? Trying to reach 10,000 steps per day 5 (26%) 6 (32%) Trying to reach the prescribed steps per minute to reach moderate intensity 7 (37%) 7 (37%) Both 6 (32%) 6 (32%) Neither 1 (5%) 0 (0%) Q8: Did the intervention in general motivate you to do more physical activity? Yes 14 (74%) 19 (100%) No 3 (16%) 0 (0%) Not sure 2 (11%) 0 (0%) Q9: Overall, did you find the intervention meeting helpful? Yes 18 (95%) 19 (100%) Motivational 9 (47%) 7 (37%) Provides structures and goals 3 (16%) 4 (21%) Determines baseline activity levels 1 (5%) 1 (5%) Informative 5 (26%) 6 (32%) Encouraged by the researchers 0 (0%) 1 (5%) No 1 (5%) 0 (0%) Did not understand 1 (5%) 0 (0%) Continuous variables expressed as mean ± standard error. Categorical variables expressed in frequencies (percentage of group). CBEP, Cadenced-Based Exercise Prescription group n=19. #, CBEP n=17 for that question because the question was added after the first two CBEP participants completed 2 week and 6 week follow-up. Accelerometer physical activity Physical activity was assessed by accelerometers and the different parameters are displayed in Table 7 and Table 8. Physical activity was analyzed in 10 minute bouts or longer (e.g. TotalPA 10min, MVPA 10min and MET-min Total10min ) and also in sporadic bouts of activity (e.g. TotalPA Spor, MVPA spor and MET-min TotalSpor ). Steps were also analyzed in sporadic bouts (e.g. Steps MVPA and Steps Total ). Valid accelerometer data was collected in 15 participants in SC and 17 participants in CBEP at the four time points (T0, T1, T2,
77 58 T3). When accelerometer data was analyzed in 10 minute bouts (TotalPA 10min, MVPA 10min, MET-min Total10min ; Table 7), there were no differences at T0 between SC and CBEP. Time had no effect on SC and CBEP for TotalPA 10min, MVPA 10min, and METmin Total10min. There were no differences observed for any intensity of activity (i.e. TotalPA 10min and MVPA 10min ) between SC and CBEP at any time. Furthermore, no differences between SC and CBEP were found for MET-min Total10min at any time. Likewise, there were no significant absolute changes at T1 to T2, T1 to T3, and T2 to T3 between SC and CBEP for any accelerometer data analyzed in 10 minute bouts (TotalPA 10min, MVPA 10min, MET-min Total10min ; Appendix J). When participants were categorized for meeting the aerobic exercise component of the CPAG based on their MVPA 10min (e.g. MVPA AE-CPAG ) there was no difference at T0 between SC (0%) and CBEP (0%). No differences were observed between SC and CBEP for MVPA AE-CPAG at any time. Furthermore, we analyzed the number of total physical activity and MVPA bouts per day that participants were performing for 10 minutes or longer (e.g. TotalPA Bouts10min, MVPA Bouts10min ). Our results showed no differences for TotalPA Bouts10min and MVPA Bouts10min at T0 between SC and CBEP. There was no time effect for TotalPA Bouts10min and MVPA Bouts10min. Moreover, no differences were observed for TotalPA Bouts10min and MVPA Bouts10min between SC and CBEP at any time point. When accelerometer physical activity was assessed based on sporadic bouts of activity lasting 30 seconds or longer (TotalPA Spor, MVPA spor ; Table 8), there were no differences at T0 between SC and CBEP. Time had no effect for TotalPA Spor and MVPA spor. For TotalPA Spor and MVPA spor, no differences were observed between SC
78 59 and CBEP at any time. There were no differences in absolute changes at T1 to T2, T1 to T3, and T2 to T3 for TotalPA Spor, MVPA spor, and MET-min TotalSpor between SC and CBEP (Appendix K). Likewise, the relative changes for TotalPA Spor and MVPA spor between SC and CBEP were not significant at T1 to T2, T1 to T3, and T2 to T3. At T0, MET-min TotalSpor did not differ between SC and CBEP. However, a main effect of time for MET-min TotalSpor was found, where T0, T1 > T2, T3 (p<0.05). However, there was no difference between SC and CBEP for MET-min TotalSpor. No differences were observed for MET-min TotalSpor between SC and CBEP for relative changes at T1 to T2, T1 to T3, and T2 to T3.
79 60 Table 7. Comparison of physical activity measured in 10 minute bouts between the Standard Care group (SC) and Cadenced-Based Exercise Prescription group (CBEP) at baseline (T0), 8 weeks (T1), 16 weeks (T2), and 24 weeks (T3) as measured using an accelerometer. T0 T1 T2 T3 10 Minute Bouts TotalPA 10min (mins/week) SC 48 ± ± ± ± 10 CBEP 37 ± ± ± ± 14 MVPA 10min (mins/week) SC 21 ± ± ± ± 9 CBEP 22 ± 8 25 ± ± ± 12 MET-min Total10min (MET-min/week) SC 176 ± ± ± ± 27 CBEP 140 ± ± ± ± 43 MVPA AE-CPAG SC 0 (0%) 1 (7%) 1 (7%) 0 (0%) CBEP 0 (0%) 1 (6%) 1 (6%) 1 (6%) TotalPA Bouts10min (bouts/day) SC 0.5 ± ± ± ± 0.1 CBEP 0.4 ± ± ± ± 0.1 MVPA Bouts10min (bouts/day) SC 0.2 ± ± ± ± 0.1 CBEP 0.2 ± ± ± ± 0.1 Values are means ± standard error or median (25 th to 75 th percentile). Categorical variables expressed in frequencies (Percentage of group). SC, Standard Care group n=15; CBEP, Cadenced-Based Exercise Prescription group n=17. T0, baseline time point; T1, 8 week time point; T2, 16 week time point; T3, 24 week time point; MVPA, moderate to vigorous physical activity; MET, metabolic equivalent; MVPA AE-CPAG, met the aerobic exercise recommendations in the Canadian Physical Activity Guidelines based on MVPA 10min ; TotalPA Bouts10min, number of bouts of total physical activity performed for 10 minutes or longer per day; MVPA Bouts10min, number of bouts of moderate to vigorous physical activity performed for 10 minutes or longer per day.
80 61 Table 8. Comparison of sporadic physical activity between the Standard Care group (SC) and Cadenced-Based Exercise Prescription group (CBEP) at baseline (T0), 8 weeks (T1), 16 weeks (T2), and 24 weeks (T3) as measured using an accelerometer. T0 T1 T2 T3 Sporadic Bouts TotalPA Spor (mins/week) SC 1186 ± ± ± ± 158 CBEP 1226 ± ± ± ± 105 Relative Change T2-T1/T1 SC ± 7% - CBEP ± 6% - T3-T1/T1 SC (-16 to 24%) CBEP (-30 to 14%) T3-T2/T2 SC (-11 to 11%) CBEP (-13 to 13%) MVPA Spor (mins/week) SC 124 ± ± ± ± 20 CBEP 139 ± ± ± ± 19 Relative Change T2-T1/T1 SC (-85 to 3%) - CBEP (-57 to 35%) - T3-T1/T1 SC (-49 to 11%) CBEP (-55 to 21%) T3-T2/T2 SC (-35 to 43%) CBEP (-26 to 16%)
81 62 MET-min TotalSpor (MET-min/week) SC 3528 ± ± ± ± 461 CBEP 3998 ± ± ± ± 347 Relative Change T2-T1/T1 SC (-49 to -15%) - CBEP (-55 to 1%) - T3-T1/T1 SC (-50 to 2%) CBEP (-48 to -20%) T3-T2/T2 SC (-38 to 38%) CBEP (-30 to 30%) Values are means ± standard error or median (25 th to 75 th percentile). SC, Standard Care group n=15; CBEP, Cadenced-Based Exercise Prescription group n=17. T0, baseline time point; T1, 8 week time point; T2, 16 week time point; T3, 24 week time point; T2-T1/T1, Percent change from 8 to 16 week time point; T3-T1/T1, Percent change from 8 to 24 week time point; T3-T2/T2, Percent change from 16 to 24 week time point; MVPA, moderate to vigorous physical activity; MET, metabolic equivalent. Time effect for MET-min TotalSpor where T0, T1 > T2, T3 (p<0.05). When we analyzed the accelerometer data for Steps Total (Figure 4), there was no difference at T0 between SC (5751 ± 711 steps) and CBEP (6439 ± 572 steps). Time had no effect for Steps Total. No difference was found between SC (T0, 5751 ± 711 steps; T1, 6417 ± 627 steps; T2, 5515 ± 943 steps; T3, 5712 ± 740 steps) and CBEP (T0, 6439 ± 572 steps; T1, 6379 ± 709 steps; T2, 5370 ± 500 steps; T3, 6102 ± 702 steps) for Steps Total at any time (Figure 4A). There was no significant difference between SC and CBEP for absolute changes in Steps Total at T1 to T2, T1 to T3, and T2 to T3 (Appendix L). Moreover, the relative changes in Steps Total at T1 to T2, T1 to T3, and T2 to T3 were not different between SC and CBEP (Figure 4B, 4C, 4D).
82 63 When participants were categorized for reaching 10,000 steps per day based on their Steps Total (e.g. Steps 10,000 ), there was no difference at T0 between SC (7%) and CBEP (6%), as seen in Figure 4E. No differences were observed between SC and CBEP for Steps 10,000 at any time.
83 64 Figure 4: We had the Standard Care group (SC) and Cadenced-Based Exercise Prescription group (CBEP) wear accelerometers for a week and measured the total number of steps they took per day. Values are mean ± standard error (Panel A) or median (25 th to 75 th percentile; Panel B to D). Categorical variables expressed in frequencies (percentage of group; Panel E). SC, Standard Care group n = 15; CBEP, Cadenced-Based Exercise Prescription group n = 17. A. Steps Total at T0, T1, T2, and T3. B. Percent change in Steps Total at T1 and T2. C. Percent change in Steps Total at T1 and T3. D. Percent change in Steps Total at T2 and T3. E. Steps 10,000 at T0, T1, T2, and T3. T0, baseline time point; T1, 8 week time point; T2, 16 week time point; T3, 24 week time point; T2-T1/T1, Percent change from 8 to 16 week time point; T3-T1/T1, Percent change from 8 to 24 week time point; T3-T2/T2, Percent change from 16 to 24 week time point; Steps 10,000, reached 10,000 total steps per day. B. Percent change in Steps Total at T1 and T2 C. Percent change in Steps Total at T1 and T3 D. Percent change in Steps Total at T2 and T3 Percent change (%) SC CBEP Percent change (%) SC CBEP Percent change (%) SC CBEP -60 SC T2-T1/T1 CBEP -60 SC T3-T1/T1 CBEP 0 SC T3-T2/T2 CBEP
84 65 When we analyzed Steps MVPA (Figure 5), there was no difference at T0 between SC (1742 ± 315 steps) and CBEP (2019 ± 283 steps). Time had no effect for Steps MVPA. Likewise, there was no group effects observed for Steps MVPA (Figure 5A). No differences were observed for absolute changes between SC and CBEP for Steps MVPA at T1 to T2, T1 to T3, and T2 to T3 (Appendix M). Likewise, there were no differences between SC and CBEP for Steps MVPA when comparing the relative changes from T1 (Figure 5B, 5C, 5D).
85 66 Figure 5: We compared the number of moderate-to-vigorous (MVPA) steps taken per day by the Standard Care group (SC) and Cadenced-Based Exercise Prescription (CBEP) that was measured using accelerometers. Values are mean ± standard error (Panel A) or median (25 th to 75 th percentile; Panel B to D). SC, Standard Care group n = 15; CBEP, Cadenced-Based Exercise Prescription group n = 17. A. Steps MVPA at T0, T1, T2, and T3. B. Percent change in Steps MVPA at T1 and T2. C. Percent change in Steps MVPA at T1 and T3. D. Percent change in Steps MVPA at T2 and T3. MVPA, moderate to vigorous physical activity; T0, baseline time point; T1, 8 week time point; T2, 16 week time point; T3, 24 week time point; T2-T1/T1, Percent change from 8 to 16 week time point; T3-T1/T1, Percent change from 8 to 24 week time point; T3-T2/T2, Percent change from 16 to 24 week time point. A. Steps MVPA at T0, T1, T2, and T SC CBEP T0 T1 T2 T3 B. Percent change in Steps MVPA at T1 and T2 C. Percent change in Steps MVPA at T1 and T3 Percent change (%) SC CBEP Percent change (%) SC CBEP -100 SC T2-T1/T1 CBEP -80 SC T3-T1/T1 CBEP RFIT self-reported physical activity Participant self-reported physical activity was captured using the RFIT (e.g., RFIT MVPA ; Table 9). There were 10 participants in SC and 13 participants in CBEP that completed the RFIT at all four time points. For RFIT MVPA, there was no statistical difference at T0 between SC (322 ± 200 minutes per week) and CBEP (668 ± 266 minutes per week). Time had no effect on RFIT MVPA in SC and CBEP. There were no differences between SC and CBEP for RFIT MVPA at the four time points. Furthermore,
86 67 there were no differences in absolute changes at T1 to T2, T1 to T3, and T2 to T3 for RFIT MVPA between SC and CBEP (Appendix N). There was a significant correlation between the self-reported physical activity in RFIT MVPA and Question 6 of the intervention meeting follow-up (r=0.73; p=0.004; Figure 6; Appendix H). When participants were categorized for meeting the aerobic exercise component of the CPAG based on their self-reported physical activity (e.g., RFIT AE-CPAG ), there was no difference at T0 between SC (40%) and CBEP (46%). No differences were observed between SC and CBEP for RFIT AE-CPAG at any time. Although not statistically significant based on the Chi-Square test, it should be indicated that at T3 more participants were meeting the aerobic exercise recommendations of the CPAG based on RFIT MVPA in CBEP (n=10), as compared to SC (n=5).
87 68 Table 9. Comparison of self-reported physical activity between the Standard Care group (SC) and Cadenced-Based Exercise Prescription group (CBEP) using the Risk Factor Identification Tool (RFIT) at baseline (T0), 8 weeks (T1), 16 weeks (T2), and 24 weeks (T3). T0 T1 T2 T3 RFIT MVPA (mins/week) SC 322 ± ± ± ± 163 CBEP 668 ± ± ± ± 277 RFIT AE-CPAG SC 4 (40%) 8 (80%) 7 (70%) 5 (50%) CBEP 6 (46%) 7 (54%) 7 (54%) 10 (77%) Continuous variables expressed as mean ± standard error or median (25 th to 75 th percentile). Categorical variables expressed in frequencies (percentage of group). SC, Standard Care group n=10; CBEP, Cadenced-Based Exercise Prescription group n=13. MVPA, moderate to vigorous physical activity; RFIT AE-CPAG, met the aerobic exercise recommendation in the Canadian Physical Activity Guidelines; T0, baseline time point; T1, 8 week time point; T2, 16 week time point; T3, 24 week time point. Figure 6. Correlation between self-reported physical activity from RFIT moderateto-vigorous physical activity at 8 weeks (T1) and question #6 from follow-up 2 weeks after the intervention meeting. Association between RFIT MVPA at T1 and Question #6 at 2 week intervention meeting follow-up. n= 13 XY data points. There was a significant correlation between RFIT MVPA and Question #6 from the intervention follow-up (r=0.73; p=0.004). MVPA, moderate to vigorous physical activity. 300 RFIT MVPA and Question #6 r = 0.73 p = Question # RFIT MVPA
88 69 SF-12 health survey The SF-12 health survey was utilized to determine whether there were differences over time between the groups for their physical and mental health components of quality of life over time (Table 10). There were 16 participants in SC and 19 participants in CBEP that completed the SF-12 health survey at all four time points. SF-12 Physical functioning was not different at T0 between SC (38 ± 3%) and CBEP (42 ± 2%). A main effect of time was found for SF-12 physical functioning, where T0 < T1, T3 (p<0.05). There were no differences between SC and CBEP for SF-12 physical functioning at any time point. In addition, there were no differences in absolute changes at T1 to T2 and T1 to T3 for SF-12 physical functioning between SC and CBEP (Appendix O). There was a trend (p=0.06), however, towards a difference in absolute change at T2 to T3 for SF-12 physical functioning between SC and CBEP (Appendix O). When relative change was analyzed for SF-12 physical functioning, no differences were found for relative changes at T1 to T2 and T1 to T3 for SF-12 physical functioning between SC and CBEP. There was a trend (p=0.09) for relative change at T2 to T3 for SF-12 physical functioning between SC and CBEP. When we analyzed SF-12 mental functioning, SF-12 mental functioning was not different at T0 between SC (46 ± 3%) and CBEP (47 ± 3%). Time had no effect on SF- 12 mental functioning. There were no differences for SF-12 mental functioning between groups over time. Furthermore, there were no absolute changes that were significant for SF-12 mental functioning between SC and CBEP at T1 to T2, T1 to T3, and T2 to T3 (Appendix O). Likewise, no differences were found for relative changes at T1 to T2, T1 to T3 and T2 to T3 for SF-12 mental functioning between SC and CBEP.
89 70 Table 10. Comparison of self-reported quality of life between the Standard Care group (SC) and Cadenced-Based Exercise Prescription group (CBEP) using the Short-form 12 quality of life questionnaire (SF-12) at baseline (T0), 8 weeks (T1), 16 weeks (T2), and 24 weeks (T3). T0 T1 T2 T3 SF-12 Survey Data Physical functioning SC 38 ± 3% 44 ± 3% 43 ± 3% 40 ± 3% CBEP 42 ± 2% 44 ± 2% 43 ± 3% 45 ± 3% Relative Change T2-T1/T1 SC ± 4% - CBEP ± 5% - T3-T1/T1 SC ± 4% CBEP ± 4% T3-T2/T2 SC (-24 to 4%) CBEP (-7 to 17%) Mental functioning SC 46 ± 3% 45 ± 3% 48 ± 3% 50 ± 3% CBEP 47 ± 3% 49 ± 2% 52 ± 3% 50 ± 3% Relative Change T2-T1/T1 SC (-12 to 16%) - CBEP (-10 to 22%) - T3-T1/T1 SC (-12 to 28%) CBEP (-20 to 26%) T3-T2/T2 SC (-8 to 16%) CBEP (-5 to 11%)
90 71 Values are mean ± standard error or median (25 th to 75 th percentile). SC, Standard Care group n=16; CBEP, Cadenced-Based Exercise Prescription n=19. SF-12, Short-form 12 Questionnaire; T0, baseline time point; T1, 8 week time point; T2, 16 week time point; T3, 24 week time point; T2-T1/T1, Percent change from 8 to 16 week time point; T3-T1/T1, Percent change from 8 to 24 week time point; T3-T2/T2, Percent change from 16 to 24 week time point. Time effect for physical functioning where T0 < T1, T3 (p<0.05). Analysis of MVPA steps per day in different population sub-groups We conducted a sub-analysis of Steps MVPA by pooling together SC (n=15) and CBEP (n=17) accelerometer data and broke them down into different categories based on the median and classification for the variables in their baseline characteristics (Table 11 to Table 15). Therefore, we pooled the data for 32 participants to complete the subanalyses for Steps MVPA in the different population sub-groups. The categories were gender (Table 11), age (median = 52 years; Table 12), weight (median = 103 kg; Table 13), body mass index (BMI; median = 36 kg/m 2 ; Table 14), and the season they participated in the study (Figure 7). The gender category (Table 11) was based on the participant classification of being female or male. We had 22 females and 10 males for this sub-analysis. At T0, Steps MVPA for females was 2199 ± 255 steps and for males it was 1209 ± 264 steps. A main effect of group was observed for Steps MVPA based on gender, where female > male (p<0.05). However, no effect of time was observed for Steps MVPA. Furthermore, no interaction effect observed. Females and males did not differ in absolute changes for Steps MVPA at T1 to T2, T1 to T3 and T2 to T3 (Appendix P). Likewise, no differences were found for relative changes for Steps MVPA at T1 to T2, T1 to T3, and T2 to T3 between females and males.
91 72 Table 11. We pooled the Standard Care group (SC) and Cadenced-Based Exercise Prescription group (CBEP) accelerometer data and divided them by their gender to compare moderate-to-vigorous (MVPA) steps per day at baseline (T0), 8 weeks (T1), 16 weeks (T2), and 24 weeks (T3). T0 T1 T2 T3 Gender Female 2199 ± ± ± ± 233 Male 1209 ± ± ± ± 303 Relative Change T2-T1/T1 Female (-45 to 23%) - Male (-117 to 69%) - T3-T1/T1 Female (-55 to 15%) Male (-94 to 94%) T3-T2/T2 Female (-37 to 37%) Male (-25 to 29%) Continuous variables expressed as mean ± standard error or median (25 th to 75 th percentile). We pooled the Standard Care group (SC) and Cadenced-Based Exercise Prescription group (CBEP) accelerometer data and divided them by gender. Female n=22; Male n=10. T0, baseline time point; T1, 8 week time point; T2, 16 week time point; T3, 24 week time point; T2-T1/T1, Percent change from 8 to 16 week time point; T3-T1/T1, Percent change from 8 to 24 week time point; T3-T2/T2, Percent change from 16 to 24 week time point; MVPA, moderate to vigorous physical activity. Group effect for gender where female > male (p<0.05). The age category (Table 12) was based on the median age of 52 years. There were 16 participants in both Age young (age below or equal to 52 years) and Age old (age above 52 years). At T0, no difference was found for Steps MVPA between Age young (2185 ± 244 steps) and Age old (1593 ± 330 steps). There was no effect of time observed for Steps MVPA. Furthermore, no interaction effect was observed. No difference was shown in Steps MVPA between Age young and Age old for absolute changes at T1 to T2, T1 to T3
92 73 and T2 to T3 (Appendix Q). Likewise, no differences were observed in Steps MVPA for relative changes at T1 to T2, T1 to T3, and T2 to T3 between Age young and Age old. Table 12. We pooled the Standard Care group (SC) and Cadenced-Based Exercise Prescription group (CBEP) accelerometer data and divided them based on their age being below, equal to, or above the median age of 52 years to compare moderate-to-vigorous (MVPA) steps per day at baseline (T0), 8 weeks (T1), 16 weeks (T2), and 24 weeks (T3). T0 T1 T2 T3 Age (52 years) Age young 2185 ± ± ± ± 250 Age old 1593 ± ± ± ± 270 Relative Change T2-T1/T1 Age young (-38 to 28%) - Age old (-60 to 20%) - T3-T1/T1 Age young (-50 to 24%) Age old (-57 to 19%) T3-T2/T2 Age young (-23 to 23%) Age old (-53 to 59%) Continuous variables expressed as mean ± standard error or median (25 th to 75 th percentile). We pooled the Standard Care group (SC) and Cadenced-Based Exercise Prescription group (CBEP) accelerometer data and divided them based on their age being below, equal to, or above the median age of 52 years. Age young n=16; Age old n=16. T0, baseline time point; T1, 8 week time point; T2, 16 week time point; T3, 24 week time point; T2-T1/T1, Percent change from 8 to 16 week time point; T3-T1/T1, Percent change from 8 to 24 week time point; T3-T2/T2, Percent change from 16 to 24 week time point; MVPA, moderate to vigorous physical activity. The weight category (Table 13) was based on the median of weight of 103 kg. There were 16 participants each in the two groups, Weight under (weight under or equal to 103
93 74 kg) and Weight over (weight over 103 kg). No difference was found at T0 for Steps MVPA between Weight under (2080 ± 355 steps) and Weight over (1699 ± 221 steps). There was no time effect for Steps MVPA. Moreover, no interaction effect was observed. Weight under and Weight over showed no differences in Steps MVPA for absolute changes at T1 to T2, T1 to T3, and T2 to T3 (Appendix R). Furthermore, no differences were found between Weight under and Weight over for Steps MVPA for relative changes at T1 to T2, T1 to T3, and T2 to T3.
94 75 Table 13. We pooled the Standard Care group (SC) and Cadenced-Based Exercise Prescription group (CBEP) accelerometer data and divided them based on their weight being under, equal to, or over the median weight of 103 kg to compare moderate-to-vigorous (MVPA) steps per day at baseline (T0), 8 weeks (T1), 16 weeks (T2), and 24 weeks (T3). T0 T1 T2 T3 Weight (103 kg) Weight under 2080 ± ± ± ± 221 Weight over 1699 ± ± ± ± 312 Relative Change T2-T1/T1 Weight under (-63 to 67%) - Weight over (-38 to 8%) - T3-T1/T1 Weight under (-72 to 54%) Weight over (-72 to 2%) T3-T2/T2 Weight under (-82 to 104 %) Weight over (-11 to 11%) Continuous variables expressed as mean ± standard error or median (25 th to 75 th percentile). We pooled the Standard Care group (SC) and Cadenced-Based Exercise Prescription group (CBEP) accelerometer data and divided them based on their weight being under, equal to, or over the median weight of 103 kg. Weight under n=16; Weight over n=16. T0, baseline time point; T1, 8 week time point; T2, 16 week time point; T3, 24 week time point; T2-T1/T1, Percent change from 8 to 16 week time point; T3-T1/T1, Percent change from 8 to 24 week time point; T3-T2/T2, Percent change from 16 to 24 week time point; MVPA, moderate to vigorous physical activity. The BMI category (Table 14) was based on the median BMI of 36 kg/m 2. There were 16 participants in the groups BMI under (BMI under or equal to 36 kg/m 2 ) and BMI over (BMI over 36 kg/m 2 ). No difference was found at T0 for Steps MVPA between BMI under (1954 ± 323 steps) and BMI over (1825 ± 273 steps). There was no effect of time observed for Steps MVPA. The analysis for the BMI category for Steps MVPA showed no
95 76 difference between BMI under and BMI over at any time. No significant differences were observed for absolute changes at T1 to T2, T1 to T3, and T2 to T3 between BMI under and BMI over (Appendix S). Likewise, no differences were found for relative changes at T1 to T2, T1 to T3, and T2 to T3 between BMI under and BMI over.
96 77 Table 14. We pooled the Standard Care group (SC) and Cadenced-Based Exercise Prescription group (CBEP) accelerometer data and divided them based on their BMI being under, equal to, or over the median BMI of 36 kg/m 2 to compare moderate-to-vigorous (MVPA) steps per day at baseline (T0), 8 weeks (T1), 16 weeks (T2), and 24 weeks (T3). T0 T1 T2 T3 BMI (36 kg/m 2 ) BMI under 1954 ± ± ± ± 232 BMI over 1825 ± ± ± ± 305 Relative Change T2-T1/T1 BMI under (-56 to 32%) - BMI over (-34 to 12%) - T3-T1/T1 BMI under (-58 to 40%) BMI over (-66 to -4%) T3-T2/T2 BMI under (-87 to 99%) BMI over (-16 to 16%) Continuous variables expressed as mean ± standard error or median (25 th to 75 th percentile). We pooled the Standard Care group (SC) and Cadenced-Based Exercise Prescription group (CBEP) accelerometer data and divided them based on their BMI being under, equal to, or over the median BMI of 36 kg/m 2. BMI under n=16; BMI over n=16. T0, baseline time point; T1, 8 week time point; T2, 16 week time point; T3, 24 week time point; T2-T1/T1, Percent change from 8 to 16 week time point; T3-T1/T1, Percent change from 8 to 24 week time point; T3-T2/T2, Percent change from 16 to 24 week time point; MVPA, moderate to vigorous physical activity; BMI, body mass index. The month the participants started the ENCOURAGE project was used to determine the seasonal category (Figure 7) the participants were involved in the Pedometer project. The two seasonal categories were Spring/Summer group (i.e. those people who enrolled in March to August) and Fall/Winter group (i.e. those people who enrolled from September to February). There were 23 participants that started in March to August
97 78 (Spring/Summer group) and 9 participants that started in September to February (Fall/Winter group). At T0, there was no difference in Steps MVPA between Spring/Summer group (1940 ± 232 steps) and Fall/Winter group (1761 ± 467 steps). No effect of time was observed for Steps MVPA in the season groups. Furthermore, no group effects were observed between season groups (Figure 7A). No significant differences were found for absolute changes in Steps MVPA at T1 to T2, T1 to T3 and T2 to T3 for both groups (Appendix T). Likewise, no difference in Steps MVPA was found between the Spring/Summer group and Fall/Winter group for relative change at T1 to T2, T1 to T3 and T2 to T3 (Figure 7B, 7C, 7D).
98 79 Figure 7: Our study population was divided into two groups based on the season they began participating in the ENCOURAGE study and we evaluated their moderate-tovigorous (MVPA) steps per day measured using accelerometers. Values are mean ± standard error (Panel A) or median (25 th -75 th percentile; Panel C to D). We pooled the Standard Care group (SC) and Cadenced-Based Exercise Prescription group (CBEP) together and separated them into two season groups (spring/summer group and fall/winter group) depending on the month they started the ENCOURAGE study. Spring/Summer (March to August) n=23; Fall/Winter (September to February) n=9. A. Steps MVPA at T0, T1, T2, and T3. B. Percent change in Steps MVPA at T1 and T2. C. Percent change in Steps MVPA at T1 and T3. D. Percent change in Steps MVPA at T2 and T3. MVPA, moderate to vigorous physical activity; T0, baseline time point; T1, 8 week time point; T2, 16 week time point; T3, 24 week time point; T2-T1/T1, Percent change from 8 to 16 week time point; T3-T1/T1, Percent change from 8 to 24 week time point; T3-T2/T2, Percent change from 16 to 24 week time point. A. Steps MVPA at T0, T1, T2, and T Spring/Summer Fall/Winter T0 T1 T2 T3 B. Percent change in Steps MVPA at T1 and T2 C. Percent change in Steps MVPA at T1 and T3 Percent change (%) Spring/Summer Fall/Winter Percent change (%) Spring/Summer Fall/Winter -60 Spring/Summer T2-T1/T1 Fall/Winter -80 Spring/Summer T3-T1/T1 Fall/Winter Differences between the categorical MVPA steps and total steps per day data We conducted a similar sub-analysis for the different population sub-groups for Steps Total (Appendix U, V, W, X, Y). The Steps Total data (Appendix U, V, W, X, Y) showed similar results to the Steps MVPA data (Appendix P, Q, R, S, T) for the gender, age, weight, BMI, and season categories. However, there was data for Steps Total
99 80 (Appendix U, V, W, X, Y) that differed from the Steps MVPA data for the five categories (Appendix P, Q, R, S, T). During the analysis of the gender data, a group effect was observed where female > male (p<0.05) for Steps MVPA (Appendix P), but not for Steps Total (Appendix U). Furthermore, our analyses for absolute changes showed a trend at T1 to T3 between males and females for both Steps MVPA (p=0.06; Appendix P) and Steps Total (p=0.08; Appendix U). However, our analyses for relative change only showed a trend (p=0.08) for Steps Total data at T1 to T3 between females and males (Appendix U). When we analyzed the age subgroup data, we observed a group effect where Age young > Age old (p<0.05; Appendix V) for Steps Total, but not for Steps MVPA (Appendix Q). We continued to only see differences in our Steps Total data after analyzing the weight subgroup data, where a significant difference was observed for absolute change at T1 to T2 for Steps Total between Weight under (-178 ± 566 steps) and Weight over (-1741 ± 498 steps; p<0.05; Appendix W). For the Steps Total data, we categorized the participants that reached 10,000 steps per day (e.g. Steps 10,000 ; Appendix U, V, W, X, Y). We observed no differences between the groups for the gender, age, BMI, and season categories for Steps 10,000 at any time point (Appendix, U, V, X, Y). However, there was a significant difference for Steps 10,000 in the weight category, where none of the Weight under (0%) group were classified as meeting the 10,000 steps per day recommendation but 31% of the Weight over subgroup did meet the 10,000 steps per day recommendation at T1 (p<0.05; Appendix W).
100 81 Chapter 4: Discussion Overview The purpose of the study was to help people accumulate more MVPA during walking by using a pedometer and an individualized cadenced-based exercise prescription so they could recognize, monitor, and understand when they are walking at a moderate-tovigorous intensity. We hypothesized that the group of people who received the CBEP would increase their time spent performing MVPA to a greater extent compared to the SC group at T2 and T3, as compared to T1. Furthermore, we hypothesized that the CBEP group would show greater improvements in other objectively measured physical activity and self-reported outcomes at T2 and T3, as compared to T1. Our results failed to support the first hypothesis because the CBEP group did not increase MVPA accumulated in 10 minute bouts (MVPA 10min ) or sporadic bouts (MVPA Spor ), as compared to the SC group. Moreover, the CBEP group did not show improvements in MVPA Bouts10min, TotalPA Bouts10min, TotalPA 10min, Met-min Total10min, TotalPA Spor, Met-min TotalSpor, Steps Total, Steps MVPA, RFIT MVPA, SF-12 physical functioning, and SF-12 mental functioning, as compared to the SC group at any of the time points. We then analyzed these same variables further to assess relative changes at T1 to T2, T1 to T3, and T2 to T3 and found no difference between the groups using this additional approach. Overall, our data provides evidence that the implementation of the CBEP intervention did not have an added benefit for influencing physical activity over a 6 month time period in previously sedentary adults.
101 82 Evidence to support the feasibility of CBEP amongst previously inactive adults. In Canada, only 15% of Canadians are meeting the CPAG aerobic exercise recommendations of 150 minutes of MVPA, performed in 10 minute bouts or longer, a week 3. At T0, no one in our study was meeting the aerobic exercise component of the CPAG based on their MVPA 10min. One reason could be that people may not fully understand how to be active at the appropriate intensity to achieve heath benefits. Therefore, our study utilized a pedometer as a method to identify exercise intensity, since it provides instant visual feedback during walking exercise to help the user recognize their walking cadence and total step count. It is worth knowing that 65% of Canadian adults choose to walk for exercise and this type of tool may help them to optimize their walking 37. A study conducted by Bouchard et al. 42 previously reported trends (p=0.07) that the use of a pedometer can help individuals to correctly identify exercise intensity. Therefore, we performed the current project to further explore the utility of pedometers for enhancing the time that adults spend performing MVPA. All CBEP participants were able to reach Cadence mod by walking during the intervention meeting. For our CBEP participants Cadence mod was 126 ± 2 steps per minute. These results differ from previous studies 39, 41 that reported that 95 to 110 steps per minute was the minimum threshold for walking at a moderate intensity. The prescribed cadence in the current study may be higher because we prescribed the cadence to match 50% HRR rather than the minimum threshold for moderate intensity at 40% HRR. We decided to prescribe the cadence at 50% of HRR because it is the middle point of the heart rate zone for moderate intensity exercise (40%-59% of HRR) 62. The fact that all the CBEP participants were able to achieve Cadence mod supports our
102 83 decision to use 50% of HRR to prescribe cadence. The CBEP participants reported a Borg Scale rating of 4 ± 0.4 at Cadence mod. A rating of 4 to 6 represented moderate intensity 65. Therefore, the CBEP participants perceived that they were walking at a moderate intensity when they reached their target HR at 50% HRR. During the five minute walk that was used to assess the CBEP participants perception of Cadence mod, we found the difference between the prescribed steps (632 ± 9) and actual steps (616 ± 13) taken over the 5 minutes was 17 ± 9 steps (i.e. 3 ± 2 steps/minute). This shows that the CBEP participants were able to achieve the prescribed cadence for a five minute walk based on their perception of Cadence mod. An increase of only about 3-4 steps per minute would have been needed to walk at a moderate intensity for the full 5 minutes. Therefore, our data shows that the CBEP intervention is feasible to apply to our inactive population because they could physically reach and perceive moderate intensity during walking exercise. This notion is supported by the information from the follow-ups to the intervention meetings that showed CBEP increased the motivation of the participants to participate in more physical activity. All of the CBEP participants liked the new method for tracking exercise intensity using the pedometer at 2 week follow-up. Fifty-three percent and seventy-four percent of the CBEP participants felt motivated to do more physical activity at 2 week follow-up because of the cadenced-based prescription and intervention (i.e. meeting itself), respectively. All participants, except one of the CBEP participants found the intervention meeting helpful at 2 week follow-up. These data showed that participants perceived CBEP in a positive way and as a motivator for them to become more physically active.
103 84 CBEP participants have an increased risk of morality based on their maximum oxygen consumption (VO 2max ) Cardiorespiratory fitness is an important prognostic factor for all-cause mortality in healthy adults 19, 20. Specifically, Mandic et al. 19 found that people in the quintile with the lowest VO 2max (15.4 ± 3.5 ml/kg/min) had a four-fold increased risk for cardiac events and all-cause mortality as compared to the people in the quintile with the highest VO 2max (50.4 ± 6.7 ml/kg/min). Furthermore, the relative risk of mortality was shown to be two times greater for people in the lowest VO 2max (15.4 ± 3.5 ml/kg/min) quintile compared to the next lowest VO 2max (23.8 ± 1.8 ml/kg/min) quintile for cardiorespiratory fitness 19. We conducted the 6MWT with our CBEP participants and calculated their VO 2Max (ml/kg/min) using Equation 5 94 and found a VO 2Max of 24 ± 1 ml/kg/min. Based on the evidence reported by Mandic et al. 19, the CBEP participants were in the next lowest VO 2max (23.8 ± 1.8 ml/kg/min) quintile for cardiorespiratory fitness. The next lowest VO 2max (23.8 ± 1.8 ml/kg/min) quintile was shown to have two times the relative risk of mortality as compared to people in the highest VO 2max (50.4 ± 6.7 ml/kg/min) quintile for cardiorespiratory fitness. In addition, a VO 2Max of 24 ± 1 ml/kg/min is considered as a poor VO 61 2Max for healthy subjects of all age groups. These results may be affected because Equation 5 94 is only applicable to participants between the ages of 26 to 60, while our study population was between the ages of 25 to 75. We decided to look into it further and compared baseline characteristics between our CBEP participants and the specific quintile groups they matched up with in the Mandic et al. 19 study. Our CBEP (50 (42 to 58) years) participants were younger in age as compared to Mandic et al. 19 participants in that quintile (60 ± 10 years). This means
104 85 that our CBEP population is probably at an increased risk for all-cause mortality and cardiovascular events at a younger age. The difference in gender between the groups was staggering, our CBEP participants were mostly females (68%), while the Mandic et al. 19 quintile showed only 7% were female. This could be a reason for our CBEP population having a lower VO 2max at a younger age, since females tend to have a lower VO 2max as compared to males. When BMI was assessed, we observed that the CBEP population had a higher BMI (39 ± 1 kg/m 2 ) as compared to the Mandic et al. 19 quintile (29.5 ±5.5 kg/m 2 ). This is important because it shows the CBEP population was overweight or obese, while the Mandic et al. 19 quintile had about 40% of their participants being obese. Obesity is a major risk factor for developing other chronic diseases, such as Type 2 Diabetes, cardiovascular disease, and more 61. We did find that the CBEP participants 6MWT results (554 ± 14 metres) is similar to the 6MWT distances data shown in Casanova et al. 102 study that showed distances that ranged between 510 to 638 metres over 7 different countries. However, we were unable to compare the VO 2Max of SC and CBEP because we did not complete the 6MWT with the SC group. Therefore, we were not able to calculate the VO 2Max and measure the walking distance that would have been completed during the 6MWT in the SC group. On the other hand, none of the baseline characteristics, accelerometer parameters, and selfreported parameters differed between SC and CBEP at any of the time points. These data suggest that our SC population was as inactive as our CBEP population and that both experimental groups were prime targets to receive the CBEP intervention to help them achieve health benefits.
105 86 Measured cadence was similar between Garmin FR60 and accelerometry. Strong correlations (r=0.85, p<0.01 & r=0.87, p<0.01) have been shown between accelerometer and pedometer determined steps per day 98. However, it is not understood how similar cadence measured by the Garmin FR60 and Actical accelerometer are. Therefore, we examined how similar the measures at Cadence mod were between the Garmin FR60 and Actical accelerometer. We were only able to compare data for two participants because we made this decision to examine Cadence mod between the two devices near the end of our recruitment phase. Our data showed that there was only a difference of 1-2 steps at Cadence mod between the cadence measured by the Garmin FR60 foot pod worn on the foot and Actical accelerometer worn on the hip for the two participants. These data indicate that the Garmin FR60 was an appropriate device to use to measure Cadence mod. In addition, the data supports the Actical accelerometer cutpoints utilized to identify Steps MVPA was appropriate to use for our study population. Therefore, our individualized CBEP was considered to be accurate for prescribing the number of steps needed to reach moderate intensity at 50% HRR. CBEP maintained physical activity over time in participants. Pedometer interventions have been shown to be effective for increasing physical activity levels of sedentary adults 68. Specifically, the pedometer interventions that used a step-based goal was shown to predict increased physical activity levels (p<0.001) 68. Bouchard et al. 42 showed the trend (p=0.07) in using pedometers to correctly identify exercise intensity. Therefore, we believed that the CBEP intervention would increase participant s physical activity levels. However, our results indicate that CBEP did not
106 87 influence physical activity accumulated in 10 minute bouts (e.g., TotalPA 10min, MVPA 10min ). Based on our MVPA 10min data, we found that none of our participants were meeting the aerobic exercise component of the CPAG at T0. This means our study population were similar to the 85% of Canadians that do not meet the aerobic exercise recommendations in the CPAG 3. Our MVPA 10min data at T0 for SC (21 ± 12 min/week) and CBEP (22 ± 8 min/week) was less than the MVPA Spor that an obese population accumulates (49 min/week) 103. Furthermore, there was no difference between SC and CBEP at any time point when we assessed MVPA AE-CPAG. In addition, the MVPA 10min data from the current study are similar to Marshall et al. 56, which showed no difference in MVPA 10min between step-based goals over a 12 week period. However, our MVPA Bouts10min at the completion of the intervention (e.g. T2) for SC (0.1 ± 0.1 bouts/day) and CBEP (0.2 ± 0.1 bouts/day) was less than the MVPA Bouts10min data in Marshall et al. 56 (1.25 bouts/day). We interpret these results as an indication that CBEP does not alter physical activity performed in 10 minute bouts. Even so, the CBEP intervention increased the self-reported motivation of the participants to be more physically active based on the information they provided from the follow-up meetings. Therefore, it appears that CBEP may be a strategy to help motivate participants to become more physically active, but the increased motivation may not translate into a change in physical activity behaviour. Recent literature has reported health benefits based on the accumulation of MVPA Spor (e.g., in bouts of 30 seconds or longer) Specifically, McGuire et al. 105 found a significant association between MVPA Spor and cardiorespiratory fitness (r=0.45) in obese adults. In addition, MVPA Spor was shown as an independent predictor of
107 88 cardiorespiratory fitness after controlling for age, BMI and intensity of physical activity 105. There is also evidence showing that an increase of MVPA Spor by 10 minutes per day can reduce the prevalence of obesity by 15% 104 and a 15 minute per day increase of MVPA Spor can reduce all-cause mortality by 4% (95% CI ) 106. However, our data failed to show that CBEP participants increased their MVPA Spor and Total Spor at any time. We compared our MVPA Spor data to the Wen et al. 106 study that evaluated the health benefits, mortality, and life expectancy of accumulating different volumes of physical activity in a large Taiwanese cohort. When compared to data from Wen et al. 106, both groups in the current study would be placed in the low-volume activity group because they are accumulating at least 90 minutes per week or 15 minutes a day of MVPA Spor. Theoretically, the participants in the current study have a 14% reduced risk of all-cause mortality as compared to individuals who perform less physical activity 106. Furthermore, our MVPA Spor data at T0 for SC (124 ± 21 min/week) and CBEP (139 ± 19 min/week) was similar to the MVPA Spor that an obese population accumulates (126 min/week) 103. However, it is unclear if the lack of change in MVPA Spor can be explained by the population characteristics in our cohort. It has been shown in the literature that achieving 10,000 steps per day can help people meet physical activity guidelines and obtain health benefits 107, 108. Specifically, a study by Le Masurier et al. 108 demonstrated that a greater proportion of people that did 10,000 steps or more met the physical activity guidelines of performing 30 minutes of moderate physical activity a day, as compared to people that did less than 10,000 steps per day. In addition, Iwane et al. 107 showed that walking 10,000 steps per day or more reduced blood pressure and sympathetic nerve activity and increased exercise capacity in
108 89 hypertensive patients. Even so, only 35% of Canadians are reaching 10,000 steps per day 3. This proportion, however, is a higher percentage than the 15% of Canadians meeting the CPAG recommended aerobic exercise 3. One reason for this discrepancy could be that people accumulate more of their Steps Total at a light intensity. Notably, one recent study by McClain et al. 99 validated the reliability of the Steps MVPA measurement using accelerometers in an adult population. Their results provided verification that Actigraph accelerometers are reliable and accurate at measuring both steps and activity counts by comparing the data from accelerometers worn on the right and left hip over a 24 hour period 99. To our knowledge, no one has evaluated Steps MVPA since McClain et al. 99 published their validity data. Therefore, we are the first to report Steps MVPA from an interventional trial. Our Steps (i.e. Steps MVPA and Steps Total ) data showed that Steps Total and Steps MVPA did not change over time between SC and CBEP. Based on Steps Total, only 7% and 6% of the participants were meeting Steps 10,000 in SC and CBEP at T0, respectively. Although participants reported that CBEP helped them to increase their motivation to become more active, the accelerometer parameters analyzed did not support the notion that the CBEP intervention was better than SC. A seasonal effect was not seen for total and MVPA steps per day. Seasonal effects have been shown in literature to have an effect on physical activity levels Specifically, people tend to be more active and take more steps in the summer than in the winter Based on the study conducted by Merchant et al. 117, 64% of Canadians are known to be inactive in the winter as compared to 49% in the summer 117. In addition, the number of people participating in a physical activity bout of
109 90 at least 15 minutes was 48% higher in the summer than in the winter 117. Specifically in Manitoba, the number of people participating in physical activity bouts lasting at least 15 minutes was higher in the spring (+24%), summer (+40%), and fall (+17%), as compared to winter 117. However, there is no study showing the impact of seasonal effects on Steps MVPA in any population. Our subgroup analysis of Steps Total (Steps Total at T0; Spring/Summer group, 6354 ± 542; Fall/Winter, 5511 ± 795; Appendix Y) and Steps MVPA (Steps MVPA at T0; Spring/Summer group, 1940 ± 232; Fall/Winter, 1761 ± 467; Appendix T) analyzed using a two-way ANOVA failed to detect a difference between the Spring/Summer group and Fall/Winter group. The observed results demonstrate that there was no seasonal effect on participants Steps Total and Steps MVPA over a 6 month period. This outcome differs from Dasgupta et al. 112 who reported a seasonal effect amongst a cohort of Type 2 diabetic patients, where they had daily step levels of 5659 ± 2611 steps/day in Spring/Summer that were even lower in the Fall/Winter (4901 ± 2464 steps/day). We also performed a three-way ANOVA for Steps Total and Steps MVPA where time (T0, T1, T2, and T3) was a repeated measure and the experimental groups (group [SC or CBEP] and season [Spring/Summer or Fall/Winter]) were between group comparisons. This 3-way ANOVA approach did not identify any effect for group, time, or season (Appendix Z). Overall, our various season analyses indicated that both season groups maintained Steps Total and Steps MVPA over time. Literature has shown that season changes occur in physical activity levels , but a season change did not occur in the current study. Moreover, Steps MVPA was not different between any of the season subgroups, but it is important for us to point out that the
110 91 sample size of the Spring/Summer group was 23; whereas, 9 participants were in the Fall/Winter group. This sample size issue could be the reason why the Steps MVPA at T3 between Spring/Summer group (1755 ± 228 steps/day) and Fall/Winter group (1178 ± 325 steps/day; Appendix T) was not statistically significant. If there were no sample size issue, then the Steps MVPA results may have shown a difference between Spring/Summer group and Fall/Winter group at T3. In addition, the same sample size issue could have affected Steps MVPA between Spring/Summer group and Fall/Winter group at T0, T1, and T2 as well. However, we are aware that a season change may not have appeared for Steps MVPA at T0 (Spring/Summer, 1940 ± 232 steps/day; Fall/Winter, 1761 ± 467 steps/day), T1 (Spring/Summer, 1911 ± 336 steps/day; Fall/Winter, 2033 ± 635 steps/day), and T2 (Spring/Summer, 1642 ± 236 steps/day; Fall/Winter, 1718 ± 843) because the participants in the Fall/Winter group were attending physical activity counselling sessions with a CSEP-CEP. The normal decrease in physical activity that we should have seen in the participants in the Fall/Winter groups could have been influenced by the CSEP-CEP physical activity counselling sessions. So it could be that the participants in the Fall/Winter group were more active at T0, T1, and T2 then they would normally have been without the physical activity counselling sessions. Furthermore, the mean difference in the number of Steps MVPA between the Spring/Summer group and Fall/Winter group was the biggest when the participants were no longer attending physical activity counselling sessions at T3. On the other hand, it appears that the Spring/Summer group was able to maintain their Steps MVPA over the 6 month period. Based on this data, it appears that the CSEP-CEP physical activity counselling sessions over the four month period may have been an intervention in itself
111 92 and may have been able to delay the onset of a seasonal effect in our data at T0, T1, and T2. However, our results were not able to statistically verify if the delayed onset of a seasonal effect did occur in our data due to our sample size difference between the Spring/Summer group and Fall/Winter group. Total steps and steps performed at a moderate-to-vigorous intensity were not affected by the baseline characteristics of the participants in our study population. Our study population was recruited from the ENCOURAGE study, which offered all participants physical activity counselling from a CSEP-CEP in a primary care setting and referrals to physical activity programs in the community. Evidence in scientific literature has shown that strategies to increase physical activity interventions integrated into primary care can increase self-report physical activity 36, 55, 78. However, Fortier et al. 55 showed no increase in minutes of MVPA per day measured by accelerometer after implementing a physical activity counsellor into primary care. Our results measured by accelerometer showed similar results to the Fortier et al. 55 study with no increase in MVPA 10min or MVPA Spor over time between experimental groups. Moreover, our Steps Total and Steps MVPA data showed no difference between CBEP and SC at any time point. Furthermore, we conducted several sub-analyses with our entire study population pooled together since all participants received physical activity counselling from the CSEP-CEP for Steps Total (Appendix U, V, W, X, Y) and Steps MVPA (Appendix P, Q, R, S, T) based on the median baseline characteristics of Gender, Age, Weight, BMI and Season, as discussed below. A systematic review evaluating the effectiveness of pedometer interventions for
112 93 increasing physical activity in sedentary adults conducted by Bravata et al. 68 had 85% of their population being female. Our sub-analysis for gender was similar with about 69% of our population being female. In Canada, males (9,500 steps per day) accumulate more steps then females (8,400 steps per day) 3. Our Steps Total data showed that males accumulated 6500 ± 1018 steps per day and females accumulated 5942 ± 473 steps per day at T0 (Appendix U). However, our Steps MVPA data showed a group effect (p<0.05), where females were more active and accumulated more Steps MVPA than males. The group effect was not observed in the Steps Total data (Appendix U). At T0, females accumulated 2199 ± 255 Steps MVPA, while males did only 1209 ± 264 Steps MVPA. These results show that although males and females accumulate similar Steps Total, females tend to accumulate more of their steps at a moderate-to-vigorous intensity than males. The difference in results could be due to our sample size (n=32) being smaller than that assessed by Colley et al. 3 (n=2,832). Additionally, the fact that our sample was recruited from a primary care setting rather than the broader Canadian population could account for the difference in results 3. Furthermore, our study population had a median BMI of 36 kg/m 2, with more than half of the participants being classified as obese, which may contribute to the different results from those of Colley et al. 3. Literature has shown that adults (20 to 65 years) take more total steps per day than adults older than 65 years 118, 119. In Canada, adults that are 20 to 59 years of age average 9,369 steps per day, while those that are 60 to 79 years of age average 7,420 steps per day 3. Our Steps Total results showed that Age young (e.g., below or equal to 52 years) accumulated 7187 ± 637 steps per day and Age old (e.g., above 52 years) accumulated 5046 ± 519 steps per day at T0 (Appendix V). Furthermore, our Steps Total
113 94 data (Appendix V) showed a group effect (p<0.05), where Age young were more active and accumulated more Steps Total than Age old. The group effect was not observed in the Steps MVPA data. At T0, Age young performed 2185 ± 244 Steps MVPA, while Age old did 1593 ± 330 Steps MVPA. These results show that Age young take more Steps Total compared to Age old, but both groups are able to maintain the number of daily steps they take at a moderate-to-vigorous intensity. A limitation could have been that we separated our groups based on the median to have equal sample sizes in both age groups, rather than following the ages for CPAG 9, 10. However, this would not be feasible because we only had one participant that was 65 years or older. In Canada, overweight or obese individuals take fewer steps per day (8,471 steps per day) than healthy adults (9698 steps per day) based on BMI classifications 3. The median BMI of 36 kg/m 2 of our study population showed that more than half of the participants were classified as obese. This is an alarming statistic because a high proportion of participants were at risk for developing chronic diseases, such as Type 2 Diabetes, cardiovascular disease, and more 61. Our Steps Total results showed that BMI under (e.g., BMI under or equal to 36 kg/m 2 ) accumulated 6103 ± 684 steps per day and BMI over (BMI over 36 kg/m 2 ) accumulated 6131 ± 600 steps per day at T0 (Appendix X). Even so, our Steps Total (Appendix X) and Steps MVPA results did not show a difference between BMI under and BMI over at any time points. At T0, BMI under took 1954 ± 323 Steps MVPA, while BMI over did 1825 ± 273 Steps MVPA. Similar results were observed for Steps Total (Appendix W) and Steps MVPA in the groups Weight under (e.g., weight under or equal to 103 kg) and Weight over (weight over 103 kg). At T0, Weight under accumulated 6089 ± 667 steps per day, while Weight over took 6144 ± 619 steps per day (Appendix
114 95 W). Furthermore, Weight under accumulated 2080 ± 355 Steps MVPA, while Weight over took 1699 ± 221 Steps MVPA at T0. The results may have shown a difference in Steps Total and Steps MVPA between the BMI and weight groups if we separated our groups based on ranges with specific cut-offs for classifications (e.g., BMI index), rather than the median. However, our small sample size prevented such an analysis. Overall, the baseline characteristics of our study population did not affect the Steps Total and Steps MVPA that our participants performed over time. These results support the Steps Total and Steps MVPA data between CBEP and SC that show Steps Total and Steps MVPA does not change over time. Furthermore, our data provides novel baseline Steps MVPA data for an obese and previously inactive adult population. Our Steps MVPA data can be used as a stepping stone for future research since no studies have evaluated Steps MVPA for interventions involving physical activity counselling led by a CSEP-CEP in primary care or for interventions that have utilized pedometers as a tool to promote physical activity. Using CBEP does not enhance the quality of life of participants The impact of integrating a physical activity counsellor into primary care may not influence quality of life 55. However, the literature has indicated that people with or without chronic conditions who increase their physical activity levels improve their quality of life For example, evidence from Ewald et al. 123 shows a relationship between pedometer use and improved quality of life in general health as steps per day increases 123. Furthermore, Kolt et al. 78 found significant improvements over time in quality of life for general health, vitality, physical functioning, and mental health in its
115 96 pedometer group. There are few data indicating the effectiveness of a CBEP on parameters of quality of life amongst inactive adults. Our study failed to show that CBEP enhances the physical and mental functioning components of the SF-12 quality of life questionnaire over time, as compared to SC. This outcome may have been influenced by the fact that our participants did not increase their physical activity levels above baseline levels. Our SF-12 mental functioning data contrasts that of Kolt et al. 78, where they reported that participants in both of their experimental groups improved mental health over time. Our data could have differed from the Kolt et al. 78 study because they had a larger sample size in their study (i.e. n=330), as compared to our smaller sample size. Limitations Our study did have limitations that we will address. First, our sample size may not have been large enough to detect differences in change in MVPA 10min measured by accelerometers. In addition, we did not detect differences in the additional outcome measures. However, trends towards significance were detected for relative change between different time points for other variables (e.g., SF-12 physical functioning) in CBEP, as compared to SC. These data make it difficult for future research involving pedometer interventions to conduct sample size calculations and power analyses. With regards to our study population, we are aware that a selection bias could have occurred with having 9 people decline to being in the CBEP group and consenting to be in the SC group. There results could be affecting our data because they chose to be in the SC group and may account for no differences being seen in any of the accelerometer
116 97 parameters. However, the 9 people that declined to being in the CBEP group did use pedometers, received the standard care intervention, and completed all the data collection meetings, which was the reason why we included them in the SC group. Our baseline characteristic data showed that there was no significant difference between SC and CBEP for weight; however, CBEP was about 8 kg heavier than SC. This limitation could be important because literature has shown normal weight adults (18.5 to 24.9 kg/m 2 ) do more physical activity than overweight (25.0 to 29.9 kg/m 2 ) and obese adults (30.0 kg/m 2 or more) 3, 111. However, both SC (36 ± 1 kg/m 2 ) and CBEP (39 ± 1 kg/m 2 ) had similar BMI s that would classify them both as a class II obese population 61. Moreover, our sub-analysis based on weight (i.e. Weight under and Weight over ) and BMI (i.e. BMI under and BMI over ) indicated that there was no difference in Steps Total (Appendix W, X) and Steps MVPA between the experimental groups at any time points. However, we did observe a significant difference for absolute change at T1 to T2 for Steps Total between Weight under (-178 ± 566 steps) and Weight over (-1741 ± 498 steps; p<0.05; Appendix W). In addition, there was a significant difference for Steps 10,000 in the weight category, where none of the Weight under (0%) group were classified as meeting the 10,000 steps per day recommendation but 31% of the Weight over subgroup did meet the 10,000 steps per day recommendation at T1 (p<0.05; Appendix W). These results differ from Colley et al. 3 that show Canadians with higher BMI s do less physical activity than those with lower BMI s. One reason why more participants in the Weight over group were reaching the 10,000 steps per day recommendation than the Weight under group at T1 could be the fact that 11 out of the 16 participants in the Weight over group were in the CBEP group (data not shown). The increased self-reported
117 98 motivation of the CBEP participants to be more physical active could account for this observation. However, the difference was observed at T1, which was before the implementation of the CBEP intervention. Therefore, CBEP was not the reason why more participants in the Weight over group were reaching the 10,000 steps per day recommendation than the Weight under group. We did consider, however, that a higher BMI and an increase in steps would increase the work of moving. This lead to our analysis between SC and CBEP and the weight sub-groups to evaluate the work of moving (i.e. BMI Steps ) by multiplying BMI and Steps Total (i.e. kg/m 2 * Steps Total ; Appendix X). During the SC and CBEP analysis, we found no group, time, and interaction effect for BMI Steps (Appendix X). However, when we analyzed the weight sub-groups, we found a group effect for BMI Steps, where BMI under < BMI over (p<0.05; Appendix X). Therefore, our results indicated that the participants in the BMI over group did more BMI Steps as compared to the BMI under group. On the other hand, Steps Total in the BMI sub-groups in Table 14 indicated that there was no difference between the groups at any time point. This means that the group effect seen in BMI Steps is because of the higher BMI in the BMI over group and not from an increase in Steps Total. There are several personal characteristics that we did not address during our data collection that could have affected our outcomes. For example, we could have collected information about sleeping behaviour, eating behaviour, and calcium consumption in our population because these factors have been linked to influence weight gain and the development of obesity 124. Furthermore, we could have assessed psychological characteristics that could have affected the outcomes in our study that were collected in the ENCOURAGE study, but not utilized in this project. For example, we could have
118 99 utilized the stage of behavioural change 89 data at each time point to see if participant subgroups changed their physical activity behaviour to a greater extent in CBEP, as compared to SC. However, our sample size was too small to support such an approach. Another limitation to our study was that we could not verify if participants were using the CBEP approach properly. We could have asked the participants to chart their steps during walking exercise and to provide us with their charts at their T2 and T3 follow-up appointments. Furthermore, we could have tested them with a 5 minute walk at T2 and T3 to evaluate if they were using CBEP properly and to compare their 5 minute walk results at T1, T2, and T3. We could have also utilized the Walk4life MVPA pedometers to better support participants so they would utilize the CBEP approach more effectively, as discussed in a later section of the document. However, to the best of knowledge, Walk4life MVPA pedometers were not available when this project was implemented. Certain aspects of our methods could have affected our outcomes as well. One limitation was the research staff was not blinded to the participants in SC and CBEP. Additionally, a better tool to support the CBEP intervention would have been to use Walk4life MVPA pedometers 125. The Walk4life MVPA pedometers can set cadence thresholds and can monitor participant s steps and time above and below the threshold 125. Using the Walk4life MVPA pedometers would allow us to design the CBEP to recommend the participant to walk above the cadence threshold continuously for a specified time. The monitoring aspect of CBEP would have been a lot easier for the participants to utilize than the approach utilized in this study. All of the participants in both the SC and CBEP groups used pedometers. This fact could be a limitation in the current study because it has been shown that the use of
119 100 pedometers are effective for increasing physical activity levels of sedentary adults 68, Therefore, we could have designed the study to include a group that did not utilize pedometers at all and then compare that group to both the SC and CBEP groups. However, given the fact that we designed this study to determine if CBEP was better than SC, we did not include the no pedometer reference group in our original design. In fact, all of the participants in both the SC and CBEP group were advised to accumulate 10,000 steps per day as a step goal by the CSEP-CEP during his physical activity counselling sessions. This could be a limitation because it has been shown that having any step based goal was a significant predictor of increased physical activity (p<0.0001) 68. Therefore, the participants in the SC group could have maintained their physical activity levels because they had a step based goal of 10,000 steps per day to follow. In addition, the participants in the CBEP group may not have increased their physical activity because they could have been confused with using the 10,000 steps per day goal and CBEP goal. One reason why they were confused between the two step goals is because 58% and 63% of the CBEP participants indicated that they wore the pedometer all day at the 2 and 6 week follow-up phone calls for the CBEP intervention meeting, respectively. This may account for no differences being seen in any of the accelerometer parameters. Moving forward, future pedometer interventions using CBEP may show differences in accelerometer parameters if the CBEP group received the cadenced-based step goals, while the SC group did not receive any step-based goals. Actigraph accelerometers are reliable and accurate at measuring both steps and activity counts 99. However, the way that the Actigraph accelerometers are programmed to collect data influences how that data is interpreted. In this study, we programmed the
120 101 accelerometers to measure physical activity in 30 second intervals. It is possible that participants were accumulating their MVPA in bouts less than 30 seconds, which may have limited our analysis because MVPA Spor activity was measured in bouts lasting 30 seconds or longer. In fact, published literature has reported that MVPA Spor was significantly higher when measured using shorter intervals (i.e. 5 and 10 second intervals), as compared MVPA Spor measured using longer intervals (i.e. 1 minute intervals) in adults and children 126, 127. Specifically, the Gabriel et al. 103 study compared 60 second and 10 second intervals in post-menopausal women and found that MVPA Spor was significantly higher using 10 second intervals (42.4 ± 22.4 minutes/day) compared to 60 second intervals (26.9 ± 20.1 minutes per day; p<0.001). Therefore, we could have analyzed our accelerometer data in 1, 2, 4, 5, or 10 second intervals rather than 30 second intervals to determine if more MVPA Spor and Steps MVPA were being accumulated in bouts less than 30 seconds. Shorter intervals would have provided us with more specific information on the participant s physical activity levels and behaviour. However, we needed to collect data for at least 7 days, so we used 30 second intervals because our accelerometers had limited capacity and intervals that were 15 seconds or shorter could not collect data for 7 days. A limitation that could have affected our results was that our inclusion for our accelerometer analysis was 3 valid accelerometer days or more, rather than the recommended 4 valid accelerometer days or more 3, 97. However, our analysis of the number of valid accelerometer days at each time point (Appendix AA) showed that participants in both SC and CBEP were completing between 5-7 valid accelerometer days at each time point. Specifically, there was a group effect for the number of valid
121 102 accelerometer days, where CBEP > SC (p<0.05; Appendix AA). Furthermore, a time effect for the number of valid accelerometer days was observed, where T0, T1 > T2, T3 (p<0.05; Appendix AA). Based on these results, the CBEP group was more likely to complete more valid accelerometer days as compared to the SC group. Moreover, these results show that participants in both SC and CBEP wore the accelerometers for 4 or more valid days. Another limitation was that we analyzed accelerometer data using 8 hours or more of wear time to define a valid accelerometer day, rather than the recommended 10 hours or more of wear time 3, 103, 128. However, a study conducted by Jerome et al. 103 showed that minimum wear times of 6 and 10 hours per day yielded similar results in an obese population for MVPA Spor (18.0 an 18.3 minutes per day) and MVPA 10min (6.7 and 6.9 minutes per day). Therefore, the use of a shorter wear time to define a valid accelerometer day was feasible to use for our obese population. In addition, we decided to analyze the length of wear times of valid accelerometer days that participants in SC and CBEP were completing (Appendix AA). Our results showed that at T0, the length of wear time for SC (12.4 ± 0.4 hours/day) and CBEP (13.1 ± 0.3 hours/day) was less than the wear time the average Canadian completes (14.0 hours/day) 3. However, our results show that both SC and CBEP completed about 12 hours per day of wear time on a valid accelerometer day at each time point, which is higher than the recommended 10 hours or more of wear time per day 3. The limitation of using 8 hours or more of wear time to define a valid accelerometer day would therefore have little effect on our accelerometer analyses.
122 103 The strategy that we utilized to analyse accelerometer data was to use standard cutpoints to measure physical activity performed at a moderate intensity. People reach moderate physical activity at different cadences, so they should have different cut-points thresholds for measuring moderate physical activity using accelerometers. Therefore, we conducted a sub-analysis of our accelerometer data to compare the 17 CBEP participants physical activity (i.e. TotalPA 10min, MVPA 10min, TotalPA Spor MVPA Spor, Steps Total, and Steps MVPA ) using standard and individualized cut-points, as described in Appendix BB. The standard cut-point threshold we used for moderate physical activity was 768 counts. In contrast, we calculated the individualized cut-point threshold for moderate physical activity for each CBEP participants and used it to analyze their accelerometer data. To calculate their individualized cut-point threshold for moderate physical activity, we divided their specific Cadence mod measured by the Garmin FR60 device during the 6MWT by the average Cadence mod (126 ± 2 steps/minute) of the CBEP group and then multiplied that proportion by the standard cut-point of 768 counts for moderate physical activity. The average individualized cut-point for moderate physical activity was 773 ± 12 counts (data not shown). The results showed that there was no difference between the CBEP groups accelerometer data analyzed using standard cut-points and individualized cut-points for physical activity (i.e. TotalPA 10min, MVPA 10min, TotalPA Spor MVPA Spor, Steps Total, and Steps MVPA ; Appendix BB). It would have been beneficial if we could have compared the physical activity data analyzed using individualized cut-points between CBEP and SC. Unfortunately, we could not individualize the cut-points for the SC group because they did not complete the 6MWT and their Cadence mod was not obtained in the current study.
123 104 It is difficult to determine if the increase in self-reported motivation to participate in more physical activity was because of CBEP or the extra attention/intervention meeting given additionally with the physical activity counselling sessions. However, our followups at two weeks after the CBEP intervention meetings indicate that it was both CBEP (53%) and the extra attention/intervention meeting (74%) that increased their motivation to be more physically active. Therefore, future pedometer interventions using CBEP should include more CBEP coaching completed in-person or over the phone, since the extra attention from the additional intervention meeting increased self-reported motivation of the participants to participate in more physical activity. A limitation of the CBEP intervention could be the feasibility of its implementation into a clinical setting. During the current study, we booked the CBEP intervention meetings for 60 minutes at the participant s preferred location where it was possible to walk for 30 consecutive minutes. In fact, the CBEP intervention meetings only took about 30 minutes to complete (data not shown). However, it is not feasible for a general practitioner to leave the clinic and perform the CBEP intervention meeting for 30 minutes and then return to the clinic. That method would not allow enough time for the general practitioner to assess the patient s needs for their visit. Therefore, it would be beneficial if the CBEP intervention meeting could be completed within 5 minutes. In addition, Swinburn et al. 36 showed that 5 minutes of verbal advice and written exercise prescription to increase physical activity levels from a general practitioner increases physical activity levels of inactive adults. One way to perform the CBEP intervention meeting in 5 minutes would require calculating the participant s target heart rate to reach 50% of HRR using Equation 2, Equation 3, and Equation 4 (n.b.; found in the
124 105 Heart Rate Monitor section of the document). The next step would include having the participant s wear the Garmin FR60 device. The general practitioner would then go for a walk down the hall with the participant and instructing them to walk as quickly as possible. The participant s cadence can be recorded when they reach their target HR at 50% of HRR (Cadence mod ). The general practitioner can then fill in the CBEP sheet for the participant to take home to monitor their intensity during walking exercise in their own environment using a pedometer. However, the general practitioner can instruct the participants who do not have a pedometer to remember how they felt when they reached their Cadence mod and to try feeling that way every time they walk for exercise. There would be no additional follow-up calls needed specifically for the CBEP intervention. The general practitioner could follow-up about CBEP during the participant s general follow-up phone calls or appointments. On the other hand, another way we could implement the CBEP intervention in 5 minutes or less would require conducting a future research study to create an algorithm to use to reduce the CBEP intervention calculations to something that would take 30 seconds or less, but that would be accurate for a variety of participant characteristics (i.e. ages, fitness levels, etc). Then the generally practitioner could provide a brief 3 minute instruction and demonstration on how to walk at that cadence using a pedometer. This would provide an easier method to implement the CBEP intervention and optimize the general practitioner s time during the participant appointments.
125 106 Summary Our data demonstrate that CBEP does not increase MVPA 10min to a greater extent, as compared to SC. Moreover, our accelerometer parameters showed no differences between SC and CBEP at T0, T1, T2, and T3. However, the CBEP intervention was well received by the participants as they reported liking the new method of tracking exercise intensity when using the pedometers. In addition, the CBEP participants felt the intervention motivated them to do more physical activity. The participants reported that the CBEP intervention meeting was motivational for them because it provided them with structure and specific goals to strive for. Specifically, it helped them determine their baseline physical activity levels. On the other hand, two participants reported having difficulty using CBEP for walking exercise because the CBEP was too hard to keep track of. With that in mind, the use of the Walk4Life MVPA pedometers 125 could be utilized with the CBEP intervention to help make CBEP easier for the participants to set cadence thresholds and to monitor time above and below the intensity threshold 125. In addition, our data demonstrate that CBEP is at least as effective as SC for maintaining physical activity levels of previously inactive adults. Based on this data, we suggest that future research could improve upon the CBEP approach described in this thesis to optimize the intervention for physical activity promotion initiatives to provide patients who prefer to walk for exercise with the information and skills so they can walk at a moderate-to-vigorous intensity. In fact, more research needs to be conducted to optimize the effectiveness of CBEP so it is easier to use from the participant s perspective. Likewise, more research needs to be conducted to minimize the time it takes for a health care provider to instruct patients how to utilize the CBEP intervention.
126 107 Conclusions To our knowledge, very few studies have utilized CBEP as a strategy to enhance the amount of MVPA 10min being performed by adults. Our study showed that CBEP did not significantly enhance MVPA 10min or MVPA Spor, as compared to SC. Moreover, CBEP did not increase Steps Total and Steps MVPA over time compared to SC. However, the individuals that received the CBEP intervention felt it motivated them to do more physical activity. This study provides novel data for Steps MVPA that establishes baseline data for this parameter to guide future physical activity research. Our study demonstrated the feasibility of utilizing CBEP to increase the motivation of participants to perform more activity at MVPA. However, CBEP did not support participants to increase their total physical activity levels or time spent performing MVPA, as compared to SC.
127 108 References 1. Lopez AD, Mathers CD, Ezzati M, Jamison DT, Murray CJ. Global and regional burden of disease and risk factors, 2001: systematic analysis of population health data. Lancet. 2006; 367: World Health Organization. Global health risks: mortality and burden of disease attributable to selected major risks Colley RC, Garriguet D, Janssen I, Craig CL, Clarke J, Tremblay MS. Physical activity of Canadian adults: accelerometer results from the 2007 to 2009 Canadian Health Measures Survey. Health Rep. 2011; 22: Physical Activity Guidelines Advisory Committee. Physical Activity Guidelines Advisory Committee Report Gregg EW, Gerzoff RB, Caspersen CJ, Williamson DF, Narayan KM. Relationship of walking to mortality among US adults with diabetes. Arch Intern Med. 2003; 163: Leitzmann MF, Park Y, Blair A, Ballard-Barbash R, Mouw T, Hollenbeck AR, Schatzkin A. Physical activity recommendations and decreased risk of mortality. Arch Intern Med. 2007; 167: Moore SC, Patel AV, Matthews CE, Berrington de Gonzalez A, Park Y, Katki HA, Linet MS, Weiderpass E, Visvanathan K, Helzlsouer KJ, Thun M, Gapstur SM, Hartge P, Lee IM. Leisure time physical activity of moderate to vigorous intensity and mortality: a large pooled cohort analysis. PLoS Med. 2012; 9: e Tremblay MS, Warburton DE, Janssen I, Paterson DH, Latimer AE, Rhodes RE, Kho ME, Hicks A, Leblanc AG, Zehr L, Murumets K, Duggan M. New Canadian physical activity guidelines. Appl Physiol Nutr Metab. 2011; 36: 36-46; Canadian Society for Exercise Physiologists. Canadian Physical Activity Guidelines for Adults Years. Available at: InfoSheets-adults-ENG.pdf. Accessed October/15, Canadian Society for Exercise Physiologists. Canadian Physical Activity Guidelines for Older Adults - 65 Years and Older. Available at: Accessed October/2012, Paterson DH, Warburton DE. Physical activity and functional limitations in older adults: a systematic review related to Canada's Physical Activity Guidelines. Int J Behav Nutr Phys Act. 2010; 7:
128 Bryan SN, Katzmarzyk PT. The association between meeting physical activity guidelines and chronic diseases among Canadian adults. J Phys Act Health. 2011; 8: Warburton DE, Charlesworth S, Ivey A, Nettlefold L, Bredin SS. A systematic review of the evidence for Canada's Physical Activity Guidelines for Adults. Int J Behav Nutr Phys Act. 2010; 7: Plotnikoff RC, Lippke S, Johnson ST, Hugo K, Rodgers W, Spence JC. Awareness of Canada's Physical Activity Guide to Healthy Active Living in a large community sample. Am J Health Promot. 2011; 25: Gornall A, Levesque L, Sigal RJ. A Pilot Study of Physical Activity Education Delivery in Diabetes Education Centres in Ontario. Canadian Journal of Diabetes. 2008; 32: Tremblay MS, Shephard RJ, Brawley LR. Research that informs Canada's physical activity guides: an introduction. Can J Public Health. 2007; 98 Suppl 2: S Canadian Society for Exercise Physiologists. Canadian Sedentary Behaviour Guidelines for Children Years. Available at: Children%20FINAL.pdf. Accessed October/2012, Canadian Society for Exercise Physiologists. Canadian Sedentary Behaviour Guidelines for Youth Years. Available at: Accessed October/2012, Mandic S, Myers JN, Oliveira RB, Abella JP, Froelicher VF. Characterizing differences in mortality at the low end of the fitness spectrum. Med Sci Sports Exerc. 2009; 41: Myers J, Prakash M, Froelicher V, Do D, Partington S, Atwood JE. Exercise capacity and mortality among men referred for exercise testing. N Engl J Med. 2002; 346: Liu-Ambrose TY, Khan KM, Eng JJ, Gillies GL, Lord SR, McKay HA. The beneficial effects of group-based exercises on fall risk profile and physical activity persist 1 year postintervention in older women with low bone mass: follow-up after withdrawal of exercise. J Am Geriatr Soc. 2005; 53: Stevens JA, Powell KE, Smith SM, Wingo PA, Sattin RW. Physical activity, functional limitations, and the risk of fall-related fractures in community-dwelling elderly. Ann Epidemiol. 1997; 7:
129 Boyle PA, Buchman AS, Wilson RS, Bienias JL, Bennett DA. Physical activity is associated with incident disability in community-based older persons. J Am Geriatr Soc. 2007; 55: Duvivier BM, Schaper NC, Bremers MA, van Crombrugge G, Menheere PP, Kars M, Savelberg HH. Minimal intensity physical activity (standing and walking) of longer duration improves insulin action and plasma lipids more than shorter periods of moderate to vigorous exercise (cycling) in sedentary subjects when energy expenditure is comparable. PLoS One. 2013; 8: e Manitoba Health. Primary Care. Available at: Accessed November/6, Kreuter MW, Chheda SG, Bull FC. How does physician advice influence patient behavior? Evidence for a priming effect. Arch Fam Med. 2000; 9: Wee CC, McCarthy EP, Davis RB, Phillips RS. Physician counseling about exercise. JAMA. 1999; 282: Hnatiuk J, Duhamel TA, Katz A, and Ready AE. Physical Activity Supports Provided by Healthcare Providers to Patients with Type 2 Diabetes. Canadian Journal of Diabetes. 2012; 36: McKenna J, Naylor PJ, McDowell N. Barriers to physical activity promotion by general practitioners and practice nurses. Br J Sports Med. 1998; 32: Patel A, Schofield GM, Kolt GS, Keogh JW. General practitioners' views and experiences of counselling for physical activity through the New Zealand Green Prescription program. BMC Fam Pract. 2011; 12: Elley CR, Kerse N, Arroll B, Robinson E. Effectiveness of counselling patients on physical activity in general practice: cluster randomised controlled trial. BMJ. 2003; 326: Tudor-Locke C, Myers A, Rodger N, et al. Towards acceptable exercise guidelines in type 2 diabetes: an examination of current standards and practices. Canadian Journal of Diabetes Care. 1998; Costello E, Leone JE, Ellzy M, Miller TA. Older adult perceptions of the physicians' role in promoting physical activity. Disabil Rehabil. 2013; 35: Eamranond PP, Davis RB, Phillips RS, Wee CC. Patient-physician language concordance and lifestyle counseling among Spanish-speaking patients. J Immigr Minor Health. 2009; 11: Lopez-Quintero C, Berry EM, Neumark Y. Limited English proficiency is a barrier
130 111 to receipt of advice about physical activity and diet among Hispanics with chronic diseases in the United States. J Am Diet Assoc. 2009; 109: Swinburn BA, Walter LG, Arroll B, Tilyard MW, Russell DG. The green prescription study: a randomized controlled trial of written exercise advice provided by general practitioners. Am J Public Health. 1998; 88: Statistics Canada. Canadian Community Health Survey - Assessing Success: Trends in Participation. Available at: Accessed November/1, Duncan GE, Anton SD, Sydeman SJ, Newton RL,Jr, Corsica JA, Durning PE, Ketterson TU, Martin AD, Limacher MC, Perri MG. Prescribing exercise at varied levels of intensity and frequency: a randomized trial. Arch Intern Med. 2005; 165: Tudor-Locke C, Barreira TV, Brouillette RM, Foil HC, Keller JN. Preliminary Comparison of Clinical and Free-Living Measures of Stepping Cadence in Older Adults. J Phys Act Health Abel M, Hannon J, Mullineaux D, Beighle A. Determination of step rate thresholds corresponding to physical activity intensity classifications in adults. J Phys Act Health. 2011; 8: Marshall SJ, Levy SS, Tudor-Locke CE, Kolkhorst FW, Wooten KM, Ji M, Macera CA, Ainsworth BE. Translating physical activity recommendations into a pedometerbased step goal: 3000 steps in 30 minutes. Am J Prev Med. 2009; 36: Bouchard DR, Langlois MF, Boisvert-Vigneault K, Farand P, Paulin M, Baillargeon JP. Pilot study: can older inactive adults learn how to reach the required intensity of physical activity guideline? Clin Interv Aging. 2013; 8: Ainslie P, Reilly T, Westerterp K. Estimating human energy expenditure: a review of techniques with particular reference to doubly labelled water. Sports Med. 2003; 33: Schoeller DA, Schoeller DA. Validation of habitual energy intake. Public Health Nutr. 2002; 5: Black AE, Prentice AM, Goldberg GR, Jebb SA, Bingham SA, Livingstone MB, Coward WA. Measurements of total energy expenditure provide insights into the validity of dietary measurements of energy intake. J Am Diet Assoc. 1993; 93: Rush EC, Valencia ME, Plank LD. Validation of a 7-day physical activity diary against doubly-labelled water. Ann Hum Biol. 2008; 35:
131 Schoeller DA. Limitations in the assessment of dietary energy intake by self-report. Metabolism. 1995; 44: Coward WA. Measurement of energy expenditure: the doubly-labelled-water method in clinical practice. Proc Nutr Soc. 1991; 50: Mann DV, Ho CS, Critchley L, Fok BS, Pang EW, Lam CW, Hjelm NM. Affordable measurement of human total energy expenditure and body composition using one-tenth dose doubly labelled water. Int J Obes (Lond). 2007; 31: Trost SG, McIver KL, Pate RR. Conducting accelerometer-based activity assessments in field-based research. Med Sci Sports Exerc. 2005; 37: S Crouter SE, Dellavalle DM, Horton M, Haas JD, Frongillo EA, Bassett DR,Jr. Validity of the Actical for estimating free-living physical activity. Eur J Appl Physiol. 2011; 111: Berlin JE, Storti KL, Brach JS. Using activity monitors to measure physical activity in free-living conditions. Phys Ther. 2006; 86: Puyau MR, Adolph AL, Vohra FA, Butte NF. Validation and calibration of physical activity monitors in children. Obes Res. 2002; 10: Colley RC, Garriguet D, Janssen I, Craig CL, Clarke J, Tremblay MS. Physical activity of Canadian children and youth: accelerometer results from the 2007 to 2009 Canadian Health Measures Survey. Health Rep. 2011; 22: Fortier MS, Hogg W, O'Sullivan TL, Blanchard C, Sigal RJ, Reid RD, Boulay P, Doucet E, Bisson E, Beaulac J, Culver D. Impact of integrating a physical activity counsellor into the primary health care team: physical activity and health outcomes of the Physical Activity Counselling randomized controlled trial. Appl Physiol Nutr Metab. 2011; 36: Marshall SJ, Nicaise V, Ji M, Huerta C, Haubenstricker J, Levy SS, Ainsworth B, Elder JE. Using step cadence goals to increase moderate-to-vigorous-intensity physical activity. Med Sci Sports Exerc. 2013; 45: Laukkanen RM, Virtanen PK. Heart rate monitors: state of the art. J Sports Sci. 1998; 16 Suppl: S Achten J, Jeukendrup AE. Heart rate monitoring: applications and limitations. Sports Med. 2003; 33: Jackson AS. Estimating maximum heart rate from age: is it a linear relationship? Med Sci Sports Exerc. 2007; 39: 821.
132 Gellish RL, Goslin BR, Olson RE, McDonald A, Russi GD, Moudgil VK. Longitudinal modeling of the relationship between age and maximal heart rate. Med Sci Sports Exerc. 2007; 39: Heyward VH. Advanced Fitness Assessment and Exercise Prescription. 6th ed. Burgess Publishing Company; Warburton DE, Nicol CW, Bredin SS. Prescribing exercise as preventive therapy. CMAJ. 2006; 174: Dauncey MJ, James WP. Assessment of the heart-rate method for determining energy expenditure in man, using a whole-body calorimeter. Br J Nutr. 1979; 42: Jeanes EM, Foster C, Porcari JP, Gibson M, Doberstein S. Translation of exercise testing to exercise prescription using the talk test. J Strength Cond Res. 2011; 25: Dunbar CC, Kalinski MI. Using RPE to regulate exercise intensity during a 20-week training program for postmenopausal women: a pilot study. Percept Mot Skills. 2004; 99: Kilpatrick MW, Kraemer RR, Quigley EJ, Mears JL, Powers JM, Dedea AJ, Ferrer NF. Heart rate and metabolic responses to moderate-intensity aerobic exercise: a comparison of graded walking and ungraded jogging at a constant perceived exertion. J Sports Sci. 2009; 27: Whaley MH, Woodall T, Kaminsky LA, Emmett JD. Reliability of perceived exertion during graded exercise testing in apparently healthy adults. J Cardiopulm Rehabil. 1997; 17: Bravata DM, Smith-Spangler C, Sundaram V, Gienger AL, Lin N, Lewis R, Stave CD, Olkin I, Sirard JR. Using pedometers to increase physical activity and improve health: a systematic review. JAMA. 2007; 298: De Cocker KA, De Bourdeaudhuij IM, Brown WJ, Cardon GM. Effects of "10,000 steps Ghent": a whole-community intervention. Am J Prev Med. 2007; 33: Trinh L, Wilson R, Williams HM, Sum AJ, Naylor PJ. Physicians promoting physical activity using pedometers and community partnerships: a real world trial. Br J Sports Med. 2012; 46: Tully MA, Cupples ME. UNISTEP (university students exercise and physical activity) study: a pilot study of the effects of accumulating 10,000 steps on health and fitness among university students. J Phys Act Health. 2011; 8: Miller R, Brown W, and Tudor-Locke C. But what about swimming and cycling?
133 114 How to 'count' non-ambulatory activity when using pedometers to assess physical activity. Journal of physical activity & health. 2006; 3: McArdle WD, Katch FI, and Katch VL. Exercise Physiology - Energy, Nutrition and Human Performance. 6th ed. Lippincott Williams & Wilkins; Tudor-Locke C, Lutes L. Why do pedometers work?: a reflection upon the factors related to successfully increasing physical activity. Sports Med. 2009; 39: Nemoto K, Gen-no H, Masuki S, Okazaki K, Nose H. Effects of high-intensity interval walking training on physical fitness and blood pressure in middle-aged and older people. Mayo Clin Proc. 2007; 82: Baker G, Gray SR, Wright A, Fitzsimons C, Nimmo M, Lowry R, Mutrie N, Scottish Physical Activity Research Collaboration (SPARColl). The effect of a pedometer-based community walking intervention "Walking for Wellbeing in the West" on physical activity levels and health outcomes: a 12-week randomized controlled trial. Int J Behav Nutr Phys Act. 2008; 5: Fitzsimons CF, Baker G, Gray SR, Nimmo MA, Mutrie N, Scottish Physical Activity Research Collaboration (SPARColl). Does physical activity counselling enhance the effects of a pedometer-based intervention over the long-term: 12-month findings from the Walking for Wellbeing in the west study. BMC Public Health. 2012; 12: Kolt GS, Schofield GM, Kerse N, Garrett N, Ashton T, Patel A. Healthy Steps trial: pedometer-based advice and physical activity for low-active older adults. Ann Fam Med. 2012; 10: Heron N, Tully MA, McKinley MC, Cupples ME. Steps to a better Belfast: physical activity assessment and promotion in primary care. Br J Sports Med Kreindler SA. Lifting the burden of chronic disease: what has worked? what hasn't? what's next? Healthc Q. 2009; 12: Tulloch H, Fortier M, Hogg W. Physical activity counseling in primary care: who has and who should be counseling? Patient Educ Couns. 2006; 64: Strokan KE, Fowles JR, Ginis KM, Miles S, Harris B, Murphy RJL. Improved Health and Wellbeing in Type 2 Diabetes Outpatients Involved in a Kinesiologist- Directed Training Program: :30 AM - 10:45 AM. Medicine and Science in Sports and Exercise. 2005; 37: S Canadian Society for Exercise Physiologists. CSEP Certified Exercise Physiologist Certification Guide. Ottawa, Ontario, Canada: Canadian Society for Exercise Physiologists; 2007.
134 Halas G, Katz, A., and Jin, D. Computer-based risk assessment: Evaluating use in primary care. Electronic Healthcare. 2010; 9: e Barr VJ, Robinson S, Marin-Link B, Underhill L, Dotts A, Ravensdale D, Salivaras S. The expanded Chronic Care Model: an integration of concepts and strategies from population health promotion and the Chronic Care Model. Hosp Q. 2003; 7: Cochrane T, Davey RC. Increasing uptake of physical activity: a social ecological approach. J R Soc Promot Health. 2008; 128: Sallis JF, Cervero RB, Ascher W, Henderson KA, Kraft MK, Kerr J. An ecological approach to creating active living communities. Annu Rev Public Health. 2006; 27: Stokols D. Establishing and maintaining healthy environments. Toward a social ecology of health promotion. Am Psychol. 1992; 47: Prochaska JO, Velicer WF, Rossi JS, Goldstein MG, Marcus BH, Rakowski W, Fiore C, Harlow LL, Redding CA, Rosenbloom D. Stages of change and decisional balance for 12 problem behaviors. Health Psychol. 1994; 13: Garmin. Garmin FR60. Available at: Accessed November/14, Garmin. Garmin FR60 Product Support Page. Available at: FR60. Accessed November/14, ATS Committee on Proficiency Standards for Clinical Pulmonary Function Laboratories. ATS statement: guidelines for the six-minute walk test. Am J Respir Crit Care Med. 2002; 166: Franklin BA, Whaley MH, Howley ET, Balady GJ, Berra KA, Golding LA, et al. ACSM's Guidelines for Exercise Training and Prescription. 7th ed. Baltimore: Lippencott and Wilkins; Burr JF, Bredin SS, Faktor MD, Warburton DE. The 6-minute walk test as a predictor of objectively measured aerobic fitness in healthy working-aged adults. Phys Sportsmed. 2011; 39: Warburton DE, Katzmarzyk PT, Rhodes RE, Shephard RJ. Evidence-informed physical activity guidelines for Canadian adults. Can J Public Health. 2007; 98 Suppl 2: S Hart TL, Swartz AM, Cashin SE, Strath SJ. How many days of monitoring predict physical activity and sedentary behaviour in older adults? Int J Behav Nutr Phys Act.
135 ; 8: Colley RC, Tremblay MS. Moderate and vigorous physical activity intensity cutpoints for the Actical accelerometer. J Sports Sci. 2011; 29: Behrens TK, Dinger MK. Comparisons of accelerometer and pedometer determined steps in free living samples. J Phys Act Health. 2011; 8: McClain JJ, Sisson SB, Tudor-Locke C. Actigraph accelerometer interinstrument reliability during free-living in adults. Med Sci Sports Exerc. 2007; 39: Resnick B, Nahm ES. Reliability and validity testing of the revised 12-item Short- Form Health Survey in older adults. J Nurs Meas. 2001; 9: Ware J,Jr, Kosinski M, Keller SD. A 12-Item Short-Form Health Survey: construction of scales and preliminary tests of reliability and validity. Med Care. 1996; 34: Casanova C, Celli BR, Barria P, Casas A, Cote C, de Torres JP, Jardim J, Lopez MV, Marin JM, Montes de Oca M, Pinto-Plata V, Aguirre-Jaime A, Six Minute Walk Distance Project (ALAT). The 6-min walk distance in healthy subjects: reference standards from seven countries. Eur Respir J. 2011; 37: Jerome GJ, Young DR, Laferriere D, Chen C, Vollmer WM. Reliability of RT3 accelerometers among overweight and obese adults. Med Sci Sports Exerc. 2009; 41: Glazer NL, Lyass A, Esliger DW, Blease SJ, Freedson PS, Massaro JM, Murabito JM, Vasan RS. Sustained and shorter bouts of physical activity are related to cardiovascular health. Med Sci Sports Exerc. 2013; 45: McGuire KA, Ross R. Incidental physical activity is positively associated with cardiorespiratory fitness. Med Sci Sports Exerc. 2011; 43: Wen CP, Wai JP, Tsai MK, Yang YC, Cheng TY, Lee MC, Chan HT, Tsao CK, Tsai SP, Wu X. Minimum amount of physical activity for reduced mortality and extended life expectancy: a prospective cohort study. Lancet. 2011; 378: Iwane M, Arita M, Tomimoto S, Satani O, Matsumoto M, Miyashita K, Nishio I. Walking 10,000 steps/day or more reduces blood pressure and sympathetic nerve activity in mild essential hypertension. Hypertens Res. 2000; 23: Le Masurier GC, Sidman CL, Corbin CB. Accumulating 10,000 steps: does this meet current physical activity guidelines? Res Q Exerc Sport. 2003; 74: Buchowski MS, Choi L, Majchrzak KM, Acra S, Mathews CE, Chen KY. Seasonal
136 117 changes in amount and patterns of physical activity in women. J Phys Act Health. 2009; 6: Chan CB, Ryan DA. Assessing the effects of weather conditions on physical activity participation using objective measures. Int J Environ Res Public Health. 2009; 6: Clemes SA, Hamilton SL, Griffiths PL. Summer to winter variability in the step counts of normal weight and overweight adults living in the UK. J Phys Act Health. 2011; 8: Dasgupta K, Joseph L, Pilote L, Strachan I, Sigal RJ, Chan C. Daily steps are low year-round and dip lower in fall/winter: findings from a longitudinal diabetes cohort. Cardiovasc Diabetol. 2010; 9: Hamilton SL, Clemes SA, Griffiths PL. UK adults exhibit higher step counts in summer compared to winter months. Ann Hum Biol. 2008; 35: Newman MA, Pettee KK, Storti KL, Richardson CR, Kuller LH, Kriska AM. Monthly variation in physical activity levels in postmenopausal women. Med Sci Sports Exerc. 2009; 41: Plasqui G, Westerterp KR. Seasonal variation in total energy expenditure and physical activity in Dutch young adults. Obes Res. 2004; 12: Tucker P, Gilliland J. The effect of season and weather on physical activity: a systematic review. Public Health. 2007; 121: Merchant AT, Dehghan M, Akhtar-Danesh N. Seasonal variation in leisure-time physical activity among Canadians. Can J Public Health. 2007; 98: Tudor-Locke C, Craig CL, Brown WJ, Clemes SA, De Cocker K, Giles-Corti B, Hatano Y, Inoue S, Matsudo SM, Mutrie N, Oppert JM, Rowe DA, Schmidt MD, Schofield GM, Spence JC, Teixeira PJ, Tully MA, Blair SN. How many steps/day are enough? For adults. Int J Behav Nutr Phys Act. 2011; 8: Tudor-Locke C, Craig CL, Aoyagi Y, Bell RC, Croteau KA, De Bourdeaudhuij I, Ewald B, Gardner AW, Hatano Y, Lutes LD, Matsudo SM, Ramirez-Marrero FA, Rogers LQ, Rowe DA, Schmidt MD, Tully MA, Blair SN. How many steps/day are enough? For older adults and special populations. Int J Behav Nutr Phys Act. 2011; 8: Cuesta-Vargas AI, Gonzalez-Sanchez M, Casuso-Holgado MJ. Effect on healthrelated quality of life of a multimodal physiotherapy program in patients with chronic musculoskeletal disorders. Health Qual Life Outcomes. 2013; 11:
137 Green AJ, Fox KM, Grandy S. Impact of Regular Exercise and Attempted Weight Loss on Quality of Life among Adults with and without Type 2 Diabetes Mellitus. J Obes. 2011; 2011: /2011/ Epub 2010 Sep Mummery K, Schofield G, Caperchione C. Physical activity dose-response effects on mental health status in older adults. Aust N Z J Public Health. 2004; 28: Ewald B, Attia J, McElduff P. How Many Steps are Enough? Dose Response Curves for Pedometer Steps and Multiple Health Markers in a Community Based Sample of Older Australians. J Phys Act Health Chaput JP, Leblanc C, Perusse L, Despres JP, Bouchard C, Tremblay A. Risk factors for adult overweight and obesity in the Quebec Family Study: have we been barking up the wrong tree? Obesity (Silver Spring). 2009; 17: I Walk4Life. Moderate to Vigorous Physical Acitivity Pedometer. Available at: Accessed July/30, Gabriel KP, McClain JJ, Schmid KK, Storti KL, High RR, Underwood DA, Kuller LH, Kriska AM. Issues in accelerometer methodology: the role of epoch length on estimates of physical activity and relationships with health outcomes in overweight, post-menopausal women. Int J Behav Nutr Phys Act. 2010; 7: Vale S, Santos R, Silva P, Soares-Miranda L, Mota J. Preschool children physical activity measurement: importance of epoch length choice. Pediatr Exerc Sci. 2009; 21: Colley R, Connor Gorber S, Tremblay MS. Quality control and data reduction procedures for accelerometry-derived measures of physical activity. Health Rep. 2010; 21:
138 119 Appendices A) CPAG for Adults Years B) CPAG for Older Adults 65 Years & Older C) Certified Exercise Physiologist (CEP) Scope of Practice and Competencies D) Risk Factor Identification Tool (RFIT) E) Pedometer Intervention Sheet F) Patient s Information Sheets G) Individualized Cadence-Based Pedometer Exercise Prescription Sheet H) Pedometer Intervention Follow-up Script I) Accelerometer Output Examples J) Table 15: Comparison of physical activity in 10 minute bouts with absolute changes between SC and CBEP K) Table 16: Comparison of physical activity in sporadic bouts with absolute changes between SC and CBEP L) Table 17: Comparison of total steps per day between SC and CBEP M) Table 18: Comparison of MVPA steps per day between SC and CBEP N) Table 19: Comparison of RFIT self-reported physical activity with absolute changes between SC and CBEP O) Table 20: Comparison of SF-12 health survey results with absolute changes between SC and CBEP P) Table 21: Comparison of MVPA steps per day with absolute changes in gender sub-groups
139 120 Q) Table 22: Comparison of MVPA steps per day with absolute changes in age subgroups R) Table 23: Comparison of MVPA steps per day with absolute changes in weight sub-groups S) Table 24: Comparison of MVPA steps per day with absolute changes in BMI sub-groups T) Table 25: Comparison of MVPA steps per day in seasonal sub-groups U) Table 26: Comparison of total steps per day in gender sub-groups V) Table 27: Comparison of total steps per day in age sub-groups W) Table 28: Comparison of total steps per day in weight sub-groups X) Table 29: Comparison of total steps per day in BMI sub-groups Y) Table 30: Comparison of total steps per day in seasonal sub-groups Z) Table 31: Comparison of total and MVPA steps per day between SC and CBEP separated into seasonal sub-groups AA) Table 32: Comparison of valid accelerometer days and length of wear times between SC and CBEP BB) Table 33: CBEP accelerometer data sub-analysis comparing standard and individualized cut-points
140 Appendix A: CPAG for Adults Years 121
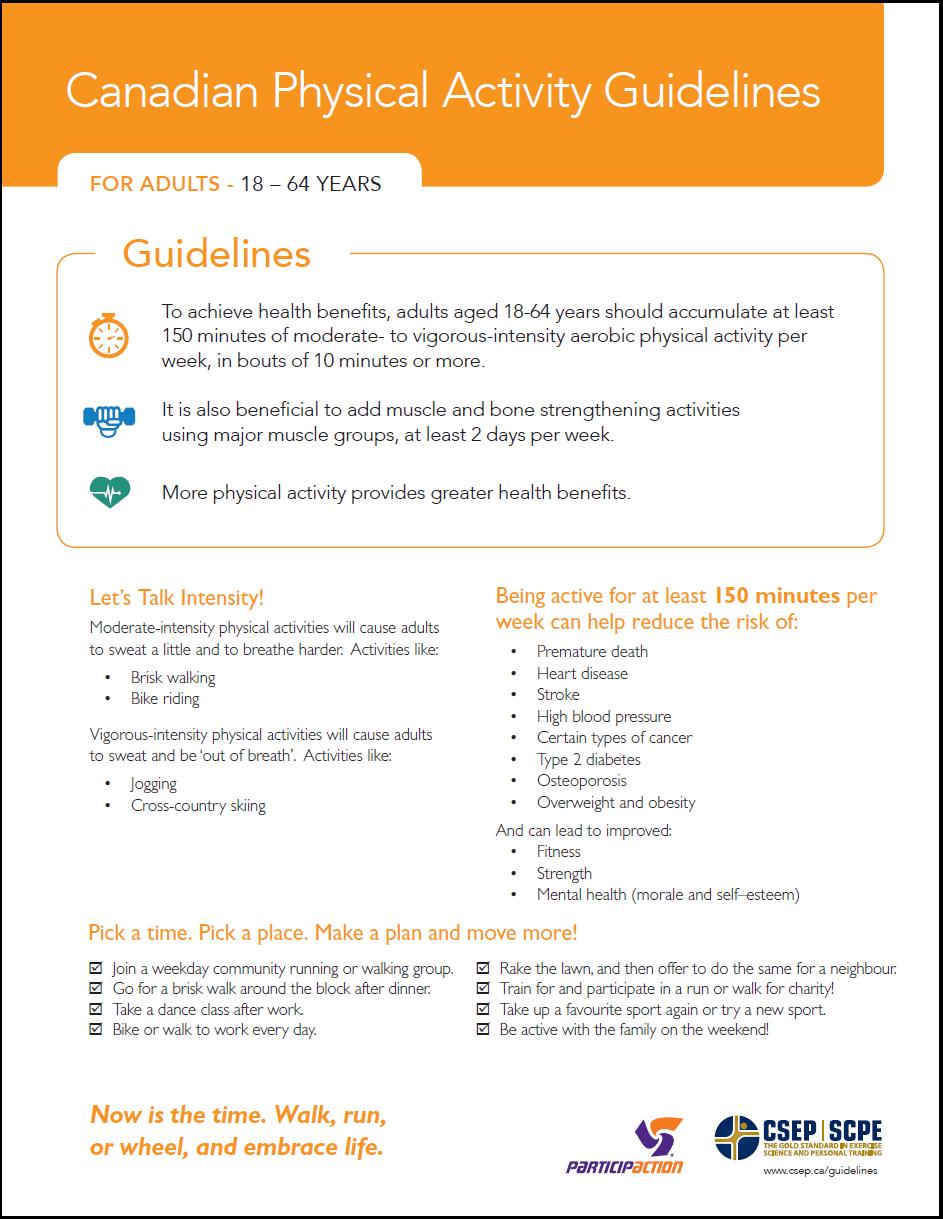
141 122
142 Appendix B: CPAG for Older Adults 65 Years & Older 123
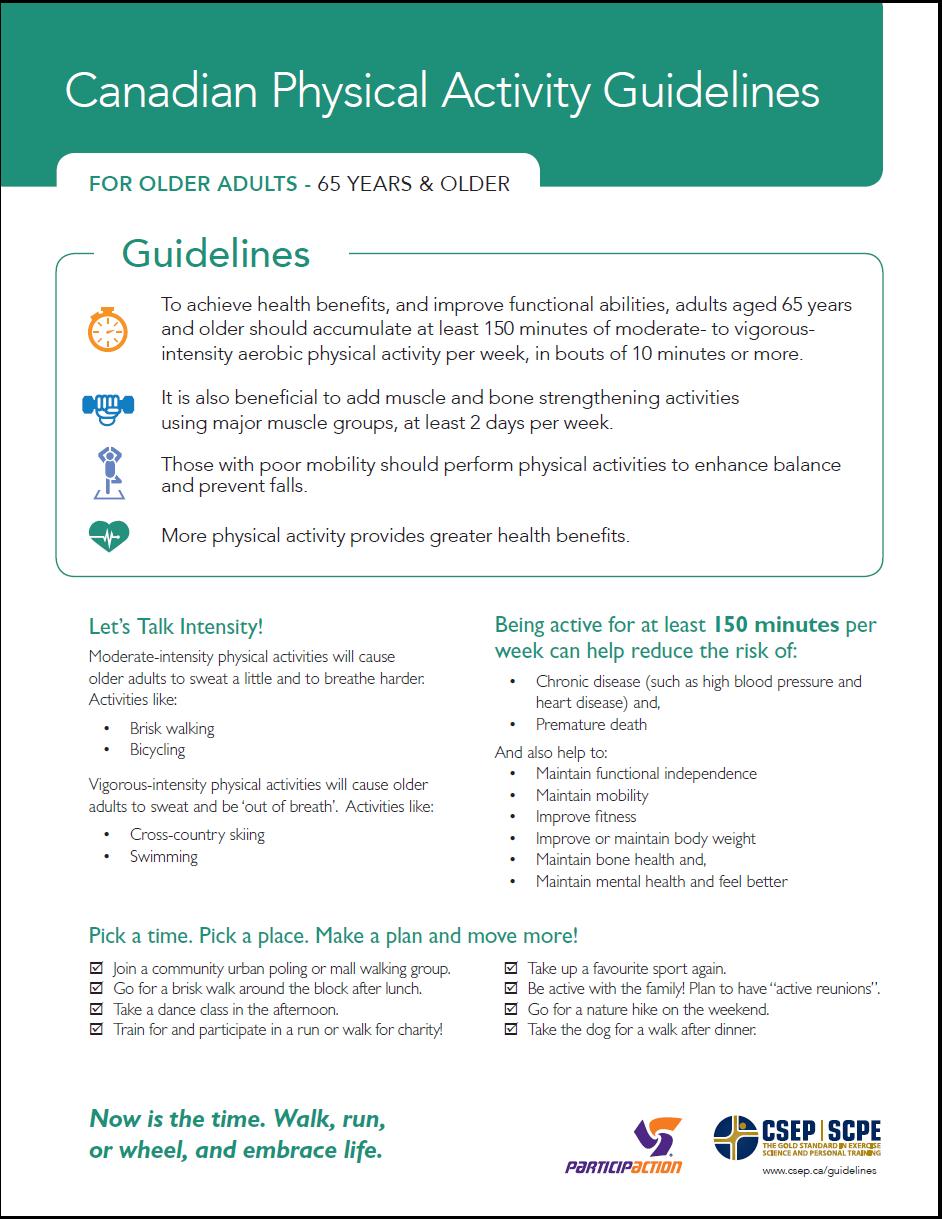
143 124
144 Appendix C: Certified Exercise Physiologist (CEP) Scope of Practice and Competencies 125
145 126
146 127

147 128
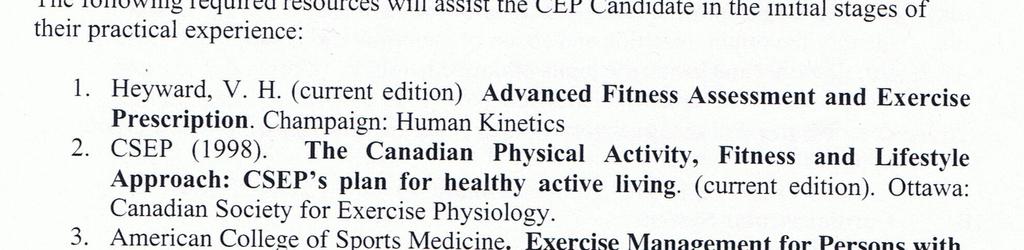
148 129
149 Appendix D: Risk Factor Identification Tool 130
150 131 Risk Factor Identification Tool Assessment Content The following list of questions provides an outline of the general content of the RFIT assessment. However, not all of these questions are asked and they do not follow the linear process in which they are presented. Rather, a unique algorithm produces a series of questions according to previous responses provided by each individual participant. Screen 1 - This is a Risk Factor Identification Tool This computer program will ask you questions about your health behaviours. A report will then be printed for you to keep for your information. The care you receive from your doctor will not be affected if you choose not to use this program or decide to quit the program. This is a touch screen. Press the Next button to find out more about RFIT Screen 2-Consent Your answers may be helpful to study different patient behaviours and how they affect health and wellness. Once you ve answered the questions on this computer, the information is coded for privacy and may be sent to a protected research database. It may also be linked to other research databases for future studies. Your personal information such as your name or health number will not be part of the research database. You can also continue with the survey without storing your information. Will you allow your responses to be sent to the research database? Yes No Screen 3: Instructions We re ready to begin Your responses [will / will not] be stored in the research database. Here is how you use the program: Each question can be answered by touching the screen. Once you have answered a question, press the Next button. By pressing the Back button you can go to the previous screen. To stop or exit the program at any time, press the Quit button.
151 132 To begin the program, please press the Next button now 1. Personal Health Information Number 2. Name 3. Date of Birth 4. Sex 5. Height 6. Weight 7. Self rated health present and one year ago 8. In the past 12 months, how many times have you consulted or visited a physician outside of this clinic? 9. Do you regularly take any medications (prescription or over-the-counter) that have not been prescribed by a physician at this clinic? 10. Do you see a dental professional regularly (i.e. Yearly or more often)? SMOKING 11. Check the answer that best describes you at the present time: I have never smoked I used to smoke but quit more than 10 years ago I used to smoke but quit more than 1 year ago I have quit smoking within the last year I have cut back on the amount I smoke I smoke regularly (i.e. daily, weekly, monthly or as a social smoker) 12. What strategy(s) did you use to quit smoking? (Select all that apply) 13. Assessment for readiness for change DIET 14. How difficult would it be for you to stop smoking? 15. Do you currently have a healthy diet? 16. In a typical day, how many servings of fruit and vegetables would you eat? 17. In a typical day, how many servings of grain products would you eat? 18. In a typical day, how many servings of milk or alternates would you have? 19. Are you lactose intolerant? 20. In a typical day, how many servings of meat or alternates would you eat? 21. Are you a vegetarian? 22. How often do you choose whole grain bread, crackers and/or high fiber cereal? 23. In the past 7 days, how often did you eat breakfast (aprox. within 1 hour of rising)? 24. Which of the following best describes how you feel about your present weight? 25. Assessment of readiness for change 26. How confident are you that you could make some changes to your daily diet? ALCOHOL USE/ABUSE 27. In a typical week, how many alcoholic drinks do you consume? 28. In a typical week, how many alcoholic drinks do you consume on one occasion? 29. Please select all the statements that describe you: I ve felt guilty or bad after drinking I ve needed a drink first thing in the morning to get going
152 It is time to cut down or stop drinking I get annoyed when someone criticizes how much I drink None of the above 30. Assessment of readiness for change PHYSICAL ACTIVITY 31. From the following list of physical activities, select the activities you do during your typical or usual week. (Choose as many as you like) Basketball or Volleyball Squash or Racquetball Soccer, Football, Rugby or Lacrosse Hockey Skiing or Snowboarding Running Skating or Rollerblading Martial Arts Boxing or Wrestling Swimming None of these 32. Your selected activity (from previous question) a. What is the TOTAL number of times per week you do this activity? b. What is the TOTAL number of minutes per week you spend doing this activity? 33. Select the activities you do during your typical or usual week. (Choose as many as you like) Household chores Baseball or cricket Dance or Aerobics Bowling Weightlifting or Circuit Training Tennis or Badminton Gardening/Lawn Care or Shoveling Snow Cycling Walking (for exercise) Golf Curling Other activities None of these activities 34. The activities you selected (from previous question) are listed below on the left hand side of the screen. When you are doing these activities, how hard are you breathing? Heavy (I can barely talk) Moderate (I can maintain a conversation) Light (I can speak easily) 35. Heavy breathing activities selected (from previous question) c. What is the TOTAL number of times per week you do these activities? d. What is the TOTAL number of minutes per week you spend doing these activities? 133
153 Moderate breathing activities selected e. What is the TOTAL number of times per week you do these activities? f. What is the TOTAL number of minutes per week you spend doing these activities? 37. Assessment of readiness for change 38. How difficult would it be for you to increase your physical activity level? 39. Does your physical health or pain limit your work or activities? 40. Does your activity level change according to the seasons? 41. When riding a bicycle outdoors, how often do you wear a bicycle helmet? 42. Do you wear sunscreen with an SPF of 15 or greater when you are in the sunshine? 43. How often do you wear a hat to protect against sun exposure? 44. Are you presently employed? 45. Think about your workplace and any physical, chemical or other potential causes for injury. Are you able to identify any potential hazards? 46. How often do you protect yourself against potential hazards at your workplace? The following questions are for patients over the age of Since last being seen by this doctor have you had a fall with an injury that caused you to limit your regular activities for at least one day or to go see a doctor? 48. Since last being seen by this doctor, have you been involved in more than 1 car crash or collision? 49. Which of the following statements are true for you? I have taken someone else s medication to help treat my ailment I sometimes miss a dose of my medication I sometimes take more or less of my medication depending on how I feel None of these statements apply to me Questionnaire COMPLETE Final Screen a- Thank you for completing this questionnaire Researchers are currently investigating ways of improving care for patients and addressing physical activity needs. You may be an eligible participant for a related study. May we contact you with more information? Yes No Final Screen b Using the keypad, please provide a phone number where research staff may call you to provide further information:
154 Appendix E: Pedometer Intervention Sheet 135
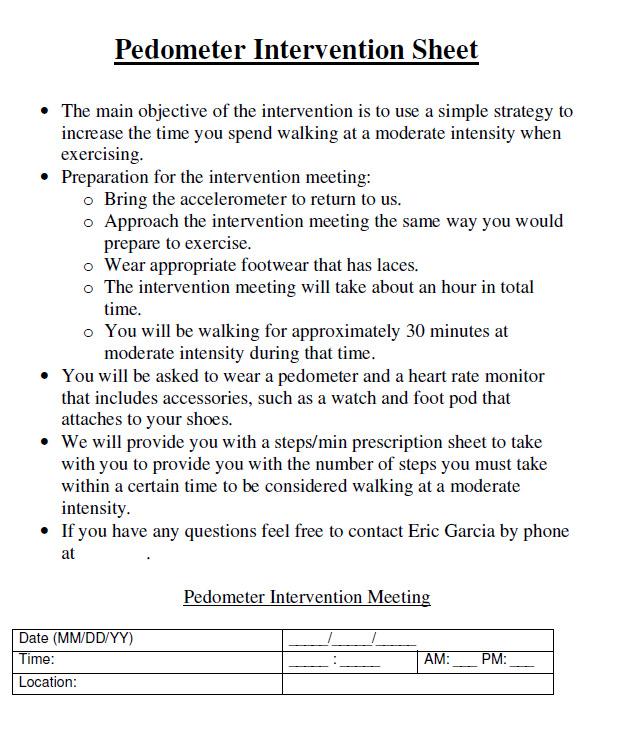
155 136
156 Appendix F: Patient s Information Sheets 137
157 138
158 139
159 140
160 Appendix G: Individualized Cadence-Based Pedometer Exercise Prescription Sheet 141
161 142
162 Appendix H: Pedometer Intervention Follow-up Script 143
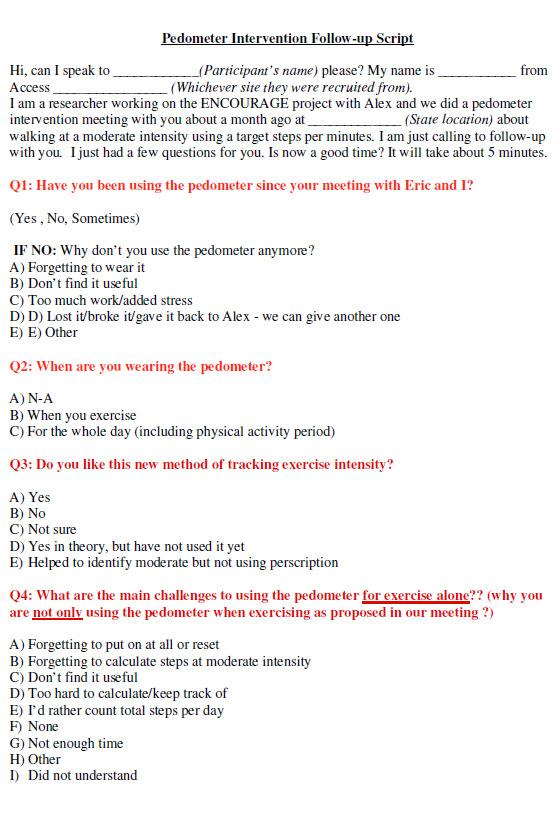
163 144
The Effect of a Seven Week Exercise Program on Golf Swing Performance and Musculoskeletal Screening Scores
 The Effect of a Seven Week Exercise Program on Golf Swing Performance and Musculoskeletal Screening Scores 2017 Mico Hannes Olivier Bachelor of Sport Science Faculty of Health Sciences and Medicine Bond
COMPARISON OF RESULTS OF AEROBIC POWER VALUE DERIVED FROM DIFFERENT MAXIMUM OXYGEN CONSUMPTION TESTING METHODS
 COMPARISON OF RESULTS OF AEROBIC POWER VALUE DERIVED FROM DIFFERENT MAXIMUM OXYGEN CONSUMPTION TESTING METHODS LI JIA A THESIS SUBMITTED IN PARTIAL FULFILLMENT OF THE REQUIREMENTS FOR THE MASTER DEGREE
University of Canberra. This thesis is available in print format from the University of Canberra Library.
 University of Canberra This thesis is available in print format from the University of Canberra Library. If you are the author of this thesis and wish to have the whole thesis loaded here, please contact
EvaluationoftheAARPRed HatSocietyStep&Stride WithRuby:AYear-Long WalkingProgram. ExecutiveSummary
 EvaluationoftheAARPRed HatSocietyStep&Stride WithRuby:AYear-Long WalkingProgram ExecutiveSummary July2008 EXECUTIVE SUMMARY Introduction In 2007, AARP developed a year-long walking program, Step & Stride
400 schemes across England deliver 1,800 weekly walks which are enjoyed by 24,000 participants each week and supported by 8,000 volunteers
 Helping people live happier and healthier lives through walking Every week we support thousands of people to experience the benefits of getting and staying active, improving their mental and physical wellbeing,
Clinical Study Synopsis
 Clinical Study Synopsis This Clinical Study Synopsis is provided for patients and healthcare professionals to increase the transparency of Bayer's clinical research. This document is not intended to replace
JEPonline Journal of Exercise Physiologyonline
 Walking Technique and Estimated VO 2 max Values 21 JEPonline Journal of Exercise Physiologyonline Official Journal of The American Society of Exercise Physiologists (ASEP) ISSN 1097-9751 An International
Global Physical Activity Questionnaire (GPAQ)
") Global Physical Activity Questionnaire (GPAQ) Department of Chronic Diseases and Health Promotion Surveillance and Population-Based Prevention World Health Organization 20 Avenue Appia, 1211 Geneva 27,
Global Physical Activity Questionnaire (GPAQ) Department of Chronic Diseases and Health Promotion Surveillance and Population-Based Prevention World Health Organization 20 Avenue Appia, 1211 Geneva 27,
The Effects of Chronic Creatine Supplementation on Performance and Body Composition of Female Athletes. by Megan Brenner
 The Effects of Chronic Creatine Supplementation on Performance and Body Composition of Female Athletes by Megan Brenner Thesis submitted to the Faculty of Virginia Polytechnic Institute and State University
Using Hexoskin Wearable Technology to Obtain Body Metrics During Trail Hiking
 Technical Note Using Hexoskin Wearable Technology to Obtain Body Metrics During Trail Hiking JEFF MONTES 1, TORI M. STONE 1, JACOB W. MANNING 2, DAMON MCCUNE 1, DEBRA K. TACAD 1, JOHN C. YOUNG 1, MARK
2009 New Brunswick Gambling Prevalence Study
 2009 New Brunswick Gambling Prevalence Study Prepared for: Government of New Brunswick Centennial Building P.O. Box 6000 Fredericton, NB E3B 5H1 Prepared by: TABLE OF CONTENTS EXECUTIVE SUMMARY... 1 STUDY
HHS Public Access Author manuscript Int J Cardiol. Author manuscript; available in PMC 2016 April 15.
 FITBIT : AN ACCURATE AND RELIABLE DEVICE FOR WIRELESS PHYSICAL ACTIVITY TRACKING Keith M. Diaz 1, David J. Krupka 1, Melinda J Chang 1, James Peacock 1, Yao Ma 2, Jeff Goldsmith 2, Joseph E. Schwartz 1,
Session 8: Step Up Your Physical Activity Plan
 Session 8: Step Up Your Physical Activity Plan In Session 4 you learned that both planned and spontaneous physical activities are important. Together they make up your total day-to-day activity level.
University of Canberra. This thesis is available in print format from the University of Canberra Library.
 University of Canberra This thesis is available in print format from the University of Canberra Library. If you are the author of this thesis and wish to have the whole thesis loaded here, please contact
Using Accelerometry: Methods Employed in NHANES
 Using Accelerometry: Methods Employed in NHANES Richard Troiano, Ph.D. David Berrigan, Ph.D. National Cancer Institute Overview NHANES Accelerometry Accelerometry Analytic Issues Decisions and data cleaning
VALIDATION OF THE PHYSICAL ACTIVITY INDEX (PAI) AS A MEASURE OF TOTAL ACTIVITY LOAD AND TOTAL KILOCALORIE EXPENDITURE
 AS A MEASURE OF TOTAL ACTIVITY LOAD AND TOTAL KILOCALORIE EXPENDITURE") VALIDATION OF THE PHYSICAL ACTIVITY INDEX (PAI) AS A MEASURE OF TOTAL ACTIVITY LOAD AND TOTAL KILOCALORIE EXPENDITURE DURING SUBMAXIMAL TREADMILL WALKING by Kimberly Anne Weary-Smith B.S. Slippery Rock
VALIDATION OF THE PHYSICAL ACTIVITY INDEX (PAI) AS A MEASURE OF TOTAL ACTIVITY LOAD AND TOTAL KILOCALORIE EXPENDITURE DURING SUBMAXIMAL TREADMILL WALKING by Kimberly Anne Weary-Smith B.S. Slippery Rock
Alberta Centre for Active Living ALBERTA SURVEY ON PHYSICAL ACTIVITY EXECUTIVE SUMMARY. Supported by:
 Alberta Centre for Active Living ALBERTA SURVEY ON PHYSICAL ACTIVITY EXECUTIVE SUMMARY Supported by: 2015 EXECUTIVE SUMMARY Background Canadians are recommended to engage in a minimum of 150 minutes of
The role of fitness testing in the evaluation of primary school running programmes
 The role of fitness testing in the evaluation of primary school running programmes Making Strides in School Symposium National Centre for Sport and Exercise Medicine 7 th September 2016 Prof. Stuart Fairclough
The Physical and Physiological Characteristics of 3x3. Results of Medical Study & Scientific Test
 The Physical and Physiological Characteristics of 3x3 Results of Medical Study & Scientific Test Prepared by Dr. Paul Montgomery & Brendan Maloney (Aspetar Orthopaedic Hospital) In cooperation with FIBA
EXPLORING MOTIVATION AND TOURIST TYPOLOGY: THE CASE OF KOREAN GOLF TOURISTS TRAVELLING IN THE ASIA PACIFIC. Jae Hak Kim
 EXPLORING MOTIVATION AND TOURIST TYPOLOGY: THE CASE OF KOREAN GOLF TOURISTS TRAVELLING IN THE ASIA PACIFIC Jae Hak Kim Thesis submitted for the degree of Doctor of Philosophy at the University of Canberra
The effectiveness of pedometers to increase physical activity: a systematic review and meta-analysis.
 The effectiveness of pedometers to increase physical activity: a systematic review and meta-analysis. Dan Mason (1), Laura Lamming, Ed Wilson, Vijay Singh GC, Sally Pears, Katie Morton, Maaike Bijker,
CHAPTER 1 INTRODUCTION TO RELIABILITY
 i CHAPTER 1 INTRODUCTION TO RELIABILITY ii CHAPTER-1 INTRODUCTION 1.1 Introduction: In the present scenario of global competition and liberalization, it is imperative that Indian industries become fully
Academic Grant CPR process monitors provided by Zoll. conflict of interest to declare
 Comparison of Bystander Fatigue and CPR Quality when Using Ui Continuous Chest Compressions Versus 30:2 Compressions to Ventilations: A Randomized Cross over over Trial CAEP Niagara Falls 2012 CAEP St
Evaluating the Influence of R3 Treatments on Fishing License Sales in Pennsylvania
 Evaluating the Influence of R3 Treatments on Fishing License Sales in Pennsylvania Prepared for the: Pennsylvania Fish and Boat Commission Produced by: PO Box 6435 Fernandina Beach, FL 32035 Tel (904)
Physical Activity. Assessment Why Physical Activity Is Important? Background Information Tips: Walking Steps Tips: Walking Minutes Goals
 Physical Activity Assessment Why Physical Activity Is Important? Background Information Tips: Walking Steps Tips: Walking Minutes Goals Assessment Walking Next, we will talk about physical activity. Before
University of Pretoria
 COMPARITIVE VALIDITY OF ICE-SKATING PERFORMANCE TESTS TO ASSESS AEROBIC CAPACITY by SUZAN MARY KUISIS University of Pretoria Submitted in fulfilment of the requirements for the degree DPHIL (Human Movement
In Australia, survey instruments for the
 Comparison of surveys used to measure physical activity Abstract Objective: To compare the level of agreement in results obtained from four physical activity (PA measurement instruments that are in use
Are We Driving Our Kids to Unhealthy Habits? 2013 Active Healthy Kids Canada Report Card on Physical Activity for Children and Youth
 Are We Driving Our Kids to Unhealthy Habits? 2013 Active Healthy Kids Canada Report Card on Physical Activity for Children and Youth Active Healthy Kids Canada is a national charitable organization established
60bbm and less 60-50bbm 50-30bbm 30-20bbm 20-10bbm (incorporates a significant aerobic component)
") TRAINING SPECIFICS IN RELATION TO AEROBIC & ANAEROBIC CONDITIONING OF SWIMMERS By Leigh Nugent, National Youth Coach Training specificity is a term mentioned often in the literature published on the physiological
TRAINING SPECIFICS IN RELATION TO AEROBIC & ANAEROBIC CONDITIONING OF SWIMMERS By Leigh Nugent, National Youth Coach Training specificity is a term mentioned often in the literature published on the physiological
Syllabus for HPE 098 Triathlon Training 1 Credit Hour Fall 2016
 Syllabus for HPE 098 Triathlon Training 1 Credit Hour Fall 2016 I. COURSE DESCRIPTION Designed for students who have demonstrated a high level of health fitness and desire to improve or maintain their
Syllabus for HPE 098 Triathlon Training 1 Credit Hour Spring 2016
 Syllabus for HPE 098 Triathlon Training 1 Credit Hour Spring 2016 I. COURSE DESCRIPTION Designed for students who have demonstrated a high level of health fitness and desire to improve or maintain their
This study investigated the amount of physical activity that occurred during
 Abstract This study investigated the amount of physical activity that occurred during work and total waking hours in a sample of New Zealand professional office workers. Data were collected over three
Using the Internet to Improve Physical Activity
 Using the Internet to Improve Physical Activity CAROLINE R. RICHARDSON, MD Associate Professor Department Of Family Medicine University Of Michigan Medical School VA Center For Clinical Management Research
Training Program. Definitions. Preparation for Training
 Training Program The attached 8 week program is designed for EXPERIENCED cyclists aiming for the Grafton to Inverell Cycle Classic 228km ride. It can be used as a guide to assist you prepare for the event
Physiological Assessment: Summary Report 11 December 2011
 Physiological Assessment: Summary Report 11 December 211 Katie Parry MD/LD Runner Athlete Test conducted and report compiled by: Dr Andi Drake England Athletics, Leeds Metropolitan University Headingley
Developing very brief interventions (VBIs) to promote physical activity in primary care
 to promote physical activity in primary care") Walk Walk Developing very brief interventions (VBIs) to promote physical activity in primary care Walk Walk Sally Pears BPS Division of Health Psychology Annual Conference, York 2014 Move Funder: NIHR
Walk Walk Developing very brief interventions (VBIs) to promote physical activity in primary care Walk Walk Sally Pears BPS Division of Health Psychology Annual Conference, York 2014 Move Funder: NIHR
Vector Rope Trainer Cardiovascular Program Fitness Level: GENERAL
 Cardiovascular Program Fitness Level: GENERAL These are exercise options. Mix and match as preferred during each workout session. Frequency: Two to three days per week Start with 3 minutes of light pace
Sedentary Behavior & Older Adults: The Role of Neighborhood Walkability
 Sedentary Behavior & Older Adults: The Role of Neighborhood Walkability Grantmakers in Aging Annual Conference 2013 "Growing Up, Growing Older: Working Together for Better Communities, Farhana Ferdous
Changes in a Top-Level Soccer Referee s Training, Match Activities, and Physiology Over an 8-Year Period: A Case Study
 Case Study International Journal of Sports Physiology and Performance, 2011, 6, 281-286 2011 Human Kinetics, Inc. Changes in a Top-Level Soccer Referee s Training, Match Activities, and Physiology Over
Evaluation of Living Streets' Walking Works Pathfinder Employers Scheme
 Loughborough University Institutional Repository Evaluation of Living Streets' Walking Works Pathfinder Employers Scheme This item was submitted to Loughborough University's Institutional Repository by
An Examination of the Effects of a Curriculum Based Pedometer Program in Two Age Groups: Adults and Pre-Adolescent Children
 1 of 5 5/5/2010 1:38 PM Home Current Issue Editorial Board Instructions for Authors Contact Lethbridge Undergraduate Research Journal ISSN 1718-8482 An Examination of the Effects of a Curriculum Based
A Re-Examination of Running Energetics in Average and Elite Distance Runners
 University of Colorado, Boulder CU Scholar Integrative Physiology Graduate Theses & Dissertations Integrative Physiology Spring 1-1-2013 A Re-Examination of Running Energetics in Average and Elite Distance
Collecting MVPA Data with FITStep Pro Pedometers
 Collecting MVPA Data with FITStep Pro Pedometers Robert Pangrazi Gopher Sport Professor Emeritus Arizona State University Professional Accountability The only outcome that all students can achieve regardless
2nd International Conference on Management Science and Industrial Engineering (MSIE 2013)
") 2nd International Conference on Management Science and Industrial Engineering (MSIE 2013) The Experimental Research of the Impact of Volleyball on the Physical and Mental Health for Female University Students
2nd International Conference on Management Science and Industrial Engineering (MSIE 2013) The Experimental Research of the Impact of Volleyball on the Physical and Mental Health for Female University Students
Why walk? Introducing Heart Foundation Walking! What is Heart Foundation Walking? Your role. Host Organisation
 An Introduction Why walk? It s an inexpensive form of physical activity It s easy doesn t require special skills or equipment It has psychological and community benefits improves mental health and social
NEURAL AND SENSORY APPLICATIONS OF INTERVENTION IN IMPROVING TECHNIQUE AT HIGH SPEED AND RACE PACE ASCTA CONFERENCE - BROADBEACH MAY 2014
 NEURAL AND SENSORY APPLICATIONS OF INTERVENTION IN IMPROVING TECHNIQUE AT HIGH SPEED AND RACE PACE ASCTA CONFERENCE - BROADBEACH MAY 2014 (as delivered to XIIth International Symposium on Biomechanics
QT2 - Coach s Reference
 QT2 - Coach s Reference Histograms and Long Term Planning (supra-macro) Buildup Rate The first week of each block should not exceed the highest week of the previous block during the base phase. During
Training Tip of the Week. MILK: It does the body builder good!
 Training Tip of the Week MILK: It does the body builder good! Believe it or not, milk has a great combination of the right nutrients that helps an athlete recover after a heavy competition or work-out.
2018 CON-SNP NATIONAL PEDOMETER CHALLENGE
 Acknowledgements Guide developed by Guelph University (2014 15) Modified by Western University (2015 16) Modified by York University (2016 17) Modified by University of Alberta (2017 18) Table of Contents
Half Triathlon. Training Plan 20 weeks
 Half Triathlon Training Plan 20 weeks Intro MI Titanium Triathlon Half Distances are as follows: Swim 1.2 miles Bike 56 miles Run 13.1 miles Training charts and accompanying information provided by AthleticMentors
Sledge Hockey NatioNal team FitNeSS testing guidelines
 Sledge Hockey National Team Fitness Testing Guidelines ABOUT THIS RESOURCE This manual is designed to serve as a guideline for sledge hockey players and coaches who are striving to take their game to the
Examining the Scope, Facilitators, and Barriers to Active Transportation Patterns in Kingston, Ontario: A Seasonal Analysis
 Examining the Scope, Facilitators, and Barriers to Active Transportation Patterns in Kingston, Ontario: A Seasonal Analysis Daphne Mayer, MPH, Kingston, Frontenac and Lennox & Addington Public Health Patricia
Physical Activity. Assessment Why Physical Activity Is Important? Background Information Tips: Walking Steps Tips: Walking Minutes Goals
 Physical Activity Assessment Why Physical Activity Is Important? Background Information Tips: Steps Tips: Minutes Goals 34 Assessment Next, we will talk about physical activity. Before getting started,
CONCLUSIONS AND RECOMMENDATIONS
 CHAPTER 5: CONCLUSIONS AND RECOMMENDATIONS 5.1 General This chapter presents the conclusions and main recommendations flowing from the analysis of level crossing systems and safety performance in several
OXYGEN POWER By Jack Daniels, Jimmy Gilbert, 1979
 1 de 6 OXYGEN POWER By Jack Daniels, Jimmy Gilbert, 1979 Appendix A Running is primarily a conditioning sport. It is not a skill sport as is basketball or handball or, to a certain extent, swimming where
A Study on Weekend Travel Patterns by Individual Characteristics in the Seoul Metropolitan Area
 A Study on Weekend Travel Patterns by Individual Characteristics in the Seoul Metropolitan Area Min-Seung. Song, Sang-Su. Kim and Jin-Hyuk. Chung Abstract Continuous increase of activity on weekends have
WALK this WAY. Leader s Guide
 Leader s Guide The Physical Activity Resource Centre (PARC) is the Centre of Excellence for physical activity promotion in Ontario and supports professionals working in public health, community health,
Lucy Gossage 12 Week. Desirable Triathlon Training Plan
 Lucy Gossage 12 Week Desirable Triathlon Training Plan Key points This is a 12 week training program aimed at novices working towards their first Olympic distance triathlon (1500m swim, 40km bike, 10km
RECRUITMENT HUNTERS A case-study approach to learning more about hunting among Hispanics and improving recruitment and retention of other hunters
 RECRUITMENT OF HISPANIC HUNTERS A case-study approach to learning more about hunting among Hispanics and improving recruitment and retention of other hunters A joint project of the McGraw Center for Conservation
NATIONAL STEPS CHALLENGE TM SEASON 4 STEP UP TO TAKE OFF WITH SINGAPORE AIRLINES GROUP CHALLENGE FREQUENTLY ASKED QUESTIONS
 NATIONAL STEPS CHALLENGE TM SEASON 4 STEP UP TO TAKE OFF WITH SINGAPORE AIRLINES GROUP CHALLENGE FREQUENTLY ASKED QUESTIONS General Information What is the Step Up To Take Off with Singapore Airlines Group
Fitbit s 100+ Billion Hours of Resting Heart Rate User Data Reveals Resting Heart Rate Decreases After Age 40
 NEWS RELEASE Fitbit s 100+ Billion Hours of Resting Heart Rate User Data Reveals Resting Heart Rate Decreases After Age 40 2/14/2018 Fitbit analysis of millions of global users also shows U.S. and Singapore
Walking for Heart Health in Rural Women
 Walking for Heart Health in Rural Women ELISABETH MARIGLIANO, BSN, RN 1, 2 PAMELA STEWART FAHS, PHD, RN 1 CRISTINA LUDDEN, MS 2 BINGHAMTON UNIVERSITY, STATE UNIVERSITY OF NEW YORK, DECKER SCHOOL OF NURSING
The Sustainability of Atlantic Salmon (Salmo salar L.) in South West England
 in South West England") The Sustainability of Atlantic Salmon (Salmo salar L.) in South West England Submitted by Sarah-Louise Counter to the University of Exeter as a thesis for the degree of Doctor of Philosophy in Biological
The Sustainability of Atlantic Salmon (Salmo salar L.) in South West England Submitted by Sarah-Louise Counter to the University of Exeter as a thesis for the degree of Doctor of Philosophy in Biological
COURSE SLO REPORT - HEALTH SCIENCES AND ATHLETICS DIVISION
 COURSE SLO REPORT - HEALTH SCIENCES AND ATHLETICS DIVISION COURSE SLO STATEMENTS - KINESIOLOGY Course ID Course Name Course SLO Title Course SLO Statement ECC: CH 1 Personal and Community Health Issues
SQUASH CANADA TECHNICAL AND FITNESS TESTING PROTOCOL MANUAL
 SQUASH CANADA TECHNICAL AND FITNESS TESTING PROTOCOL MANUAL Revised April 2010 Table of Contents Introduction to Squash Canada... 3 Need for Technical & Fitness Testing Protocols... 3 Long Term Player
Summary Report: Built Environment, Health and Obesity
 Research and education Built Environment Edmonton Project Summary Report: Built Environment, Health and Obesity Introduction In 2007 the Canadian Institutes of Health Research and the Heart and Stroke
Increasing physical activity levels among employees. Creating a physical activity policy for the workplace
 Increasing physical activity levels among employees Creating a physical activity policy for the workplace Introduction Adequate physical activity* reduces risk for several diseases and conditions, including
Sandra Nutter, MPH James Sallis, PhD Gregory J Norman, PhD Sherry Ryan, PhD Kevin Patrick, MD, MS
 Objectively Measured Environmental Correlates of Adolescent Physical Activity Sandra Nutter, MPH James Sallis, PhD Gregory J Norman, PhD Sherry Ryan, PhD Kevin Patrick, MD, MS San Diego State University
Promoting Physical Activity Using Walking Poles in Senior Citizens of Southern Vermont's Deerfield Valley Region
 University of Vermont ScholarWorks @ UVM Family Medicine Clerkship Student Projects College of Medicine 2016 Promoting Physical Activity Using Walking Poles in Senior Citizens of Southern Vermont's Deerfield
Recommendations for Pennsylvania's Deer Management Program and The 2010 Deer Hunting Season
 Recommendations for Pennsylvania's Deer Management Program and The 2010 Deer Hunting Season March 7, 2010 Prepared for The Pennsylvania Game Commission Board of Commissioners By John Eveland RECOMMENDATIONS
Chapter 20. Sampling the Recreational Creel
 Chapter 20 Sampling the Recreational Creel 20.1 Introduction - Creel Surveys Management requires information Environment in which fish lives Management requires information (cont.) *Other organisms with
National Survey for Wales Key Facts for Policy and Practice
 National Survey for Wales 2016-17 Key Facts for Policy and Practice Outdoor Recreation This bulletin describes the main findings of the Outdoor Recreation section of the 2016-2017 National Survey for Wales.
iworx Sample Lab Experiment HE-5: Resting Metabolic Rate (RMR)
") Experiment HE-5: Resting Metabolic Rate (RMR) Before Starting 1. Read the procedures for the experiment completely before beginning the experiment. Have a good understanding of how to perform the experiment
Experiment HE-5: Resting Metabolic Rate (RMR) Before Starting 1. Read the procedures for the experiment completely before beginning the experiment. Have a good understanding of how to perform the experiment
Health and Community Design: The Local Government Role in Promoting Active Living
 Health and Community Design: The Local Government Role in Promoting Active Living Rich Killingsworth, Director Active Living by Design National Program Office University of North Carolina School of Public
Aerobic Capacity. Need Additional Resources?
 Aerobic Capacity Aerobic capacity is perhaps the most important component of any fitness program. Research indicates that acceptable levels of aerobic capacity are associated with a reduced risk of high
10,000 Steps Working Paper Series Paper 2: Audit of 10,000 Steps Providers
 10,000 Steps Working Paper Series Paper 2: Audit of 10,000 Steps Providers Kelly Joyner Research Associate 10,000 Steps Central Queensland University For information on physical activity and 10,000 Steps
Chapter 3 - Research Methodology. 3.3 Conceptual framework (Research design)
") Chapter 3 - Research Methodology 3.1 Introduction This chapter describes the approach taken for data gathering and analysis. The findings discussed in the Literature Review are used as the basis for developing
Chapter 3 - Research Methodology 3.1 Introduction This chapter describes the approach taken for data gathering and analysis. The findings discussed in the Literature Review are used as the basis for developing
Validation of a Step Test in Children Ages 7-11
 Validation of a Step Test in Children Ages 7-11 Emilene Clark Aurora Fry Colleen Smith Tonya Thomas Primary Advisor: Jim Farris, PT, PhD April 20, 2011 Background Exercise Testing Maximal Testing Sub-maximal
WHAT CAN WE LEARN FROM COMPETITION ANALYSIS AT THE 1999 PAN PACIFIC SWIMMING CHAMPIONSHIPS?
 WHAT CAN WE LEARN FROM COMPETITION ANALYSIS AT THE 1999 PAN PACIFIC SWIMMING CHAMPIONSHIPS? Bruce Mason and Jodi Cossor Biomechanics Department, Australian Institute of Sport, Canberra, Australia An analysis
RELATION BETWEEN MAXIMAL ANAEROBIC POWER OUTPUT AND TESTS ON ROWING ERGOMETER
 Acta Facultatis Educationis Physicae Universitatis Comenianae Vol. 57 No 1 2017 RELATION BETWEEN MAXIMAL ANAEROBIC POWER OUTPUT AND TESTS ON ROWING ERGOMETER Matej Šmída, Michal Clementis, Dušan Hamar,
Perceptions of the Physical Environment Surrounding Schools & Physical Activity among Low-income, Urban, African American Adolescent Girls
 Perceptions of the Physical Environment Surrounding Schools & Physical Activity among Low-income, Urban, African American Adolescent Girls Erin Hager, PhD Candice Gormley, BS Laura Latta, MHS M. Reese
Physical activity has a number of benefits
 Health Policy Brief September 2018 Walking Among California Adults Susan H. Babey, Joelle Wolstein, and Allison L. Diamant SUMMARY: This policy brief describes two types of walking among California adults:
Effects of Age and Body Mass Index on Accuracy of Simple Moderate Vigorous Physical Activity Monitor Under Controlled Condition
 Received: May., 011 Accepted: Jul. 8, 011 Published online: Jul. 5, 011 Original Article Effects of Age and Body Mass Index on Accuracy of Simple Moderate Vigorous Physical Activity Monitor Under Controlled
A Scalable Park Prescription Model
 A Scalable Park Prescription Model Our MISSION is to ease the burden of chronic disease, increase health and happiness, and foster environmental stewardship by encouraging doctors to routinely prescribe
2001 REVIEW OF THE ATLANTIC STATES MARINE FISHERIES COMMISSION FISHERY MANAGEMENT PLAN FOR WEAKFISH (Cynoscion regalis)
") 2001 REVIEW OF THE ATLANTIC STATES MARINE FISHERIES COMMISSION FISHERY MANAGEMENT PLAN FOR WEAKFISH (Cynoscion regalis) Plan Review Team Rick Cole, DE Louis Daniel, NC Charles Lesser, DE Rob O Reilly,
2001 REVIEW OF THE ATLANTIC STATES MARINE FISHERIES COMMISSION FISHERY MANAGEMENT PLAN FOR WEAKFISH (Cynoscion regalis) Plan Review Team Rick Cole, DE Louis Daniel, NC Charles Lesser, DE Rob O Reilly,
PERSONALISED TRAVEL PLANNING IN MIDLETON, COUNTY CORK
 PERSONALISED TRAVEL PLANNING IN MIDLETON, COUNTY CORK Elaine Brick Principal Transport Planner AECOM Abstract Smarter Travel funding was awarded to the Chartered Institute of Highways and Transportation
bespoke In general health and rehabilitation Breath-by-breath multi-functional respiratory gas analyser In human performance
 Introduction Expired Gas Analysis or indirect calorimetry, can be used to measure ventilation and the fractions of oxygen and carbon dioxide in expired air. From these measurements, the body's oxygen consumption
Anxiety and attentional control in football penalty kicks: A mechanistic account of performance failure under pressure
 Anxiety and attentional control in football penalty kicks: A mechanistic account of performance failure under pressure Submitted by Greg Wood to the University of Exeter as a thesis for the degree of Doctor
SHIREMOOR PRIMARY SCHOOL PE AND SPORT PREMIUM
 SHIREMOOR PRIMARY SCHOOL PE AND SPORT PREMIUM 2017-18 At Shiremoor Primary, we receive 16,000 plus an additional 10 per child from Reception to Year 6. At Shiremoor Primary School we have split the funding
LIVELY Physical Activity Intervention in COPD Consultation Scripts for Health Professionals
 LIVELY Physical Activity Intervention in COPD Consultation Scripts for Health Professionals Preparation in Advance of Physical Activity Consultation (Appointment 1) Preparation in Advance of Physical Activity
iworx Sample Lab Experiment HE-5: Resting Metabolic Rate (RMR)
") Experiment HE-5: Resting Metabolic Rate (RMR) Before Starting 1. Read the procedures for the experiment completely before beginning the experiment. Have a good understanding of how to perform the experiment
Experiment HE-5: Resting Metabolic Rate (RMR) Before Starting 1. Read the procedures for the experiment completely before beginning the experiment. Have a good understanding of how to perform the experiment
A Pilot Trial of Three Very Brief Interventions for Physical Activity in Primary Care
 A Pilot Trial of Three Very Brief Interventions for Physical Activity in Primary Care M. Bijker, S. Pears, K. Morton, A. Prevost, E. Wilson, S. Sutton, W. Hardeman on behalf of the Very Brief Interventions
PEDOMETER HANDBOOK MAKING EVERY STEP COUNT!
 PEDOMETER HANDBOOK Congratulations on taking a step with pedometers to a healthier you! We hope this handbook will help you make walking part of your everyday life. This handbook includes information on:
Validity of Four Activity Monitors during Controlled and Free-Living Conditions
 Illinois State University ISU ReD: Research and edata Theses and Dissertations 8-27-2013 Validity of Four Activity Monitors during Controlled and Free-Living Conditions Joey Lee Illinois State University,
Is lung capacity affected by smoking, sport, height or gender. Table of contents
 Sample project This Maths Studies project has been graded by a moderator. As you read through it, you will see comments from the moderator in boxes like this: At the end of the sample project is a summary
Olympic Triathlon. Training Plan 16 weeks
 Olympic Triathlon Training Plan 16 weeks Intro Grand Rapids Triathlon Olympic Distances are as follows: Swim 1500 meters (1640 yards or just under 1 mile) Bike 40K (25 miles) Run 10K (6.2 miles) Plan designed
Interface Pressure Mapping (IPM) Clinical Use of the Literature
 Clinical Use of the Literature") Interface Pressure Mapping (IPM) Clinical Use of the Literature Laura Titus OT Reg.(Ont.), PhD Student, Jan Miller Polgar PhD, OT Reg.(Ont.), FCAOT SJHC-Parkwood Seating Program London Ontario Faculty
Interface Pressure Mapping (IPM) Clinical Use of the Literature Laura Titus OT Reg.(Ont.), PhD Student, Jan Miller Polgar PhD, OT Reg.(Ont.), FCAOT SJHC-Parkwood Seating Program London Ontario Faculty
Modal Shift in the Boulder Valley 1990 to 2009
 Modal Shift in the Boulder Valley 1990 to 2009 May 2010 Prepared for the City of Boulder by National Research Center, Inc. 3005 30th Street Boulder, CO 80301 (303) 444-7863 www.n-r-c.com Table of Contents
Using a Mixed-Method Approach to Evaluate the Behavioural Effects of the Cycling City and Towns Programme
 1 of 25 Using a Mixed-Method Approach to Evaluate the Behavioural Effects of the Cycling City and Towns Programme Kiron Chatterjee (Centre for Transport & Society, UWE) with acknowledgements to research
SWIMMING SCIENCE BULLETIN
 The Mechanisms of Ultra-short Training 1 SWIMMING SCIENCE BULLETIN Number 45g Produced, edited, and copyrighted by Professor Emeritus Brent S. Rushall, San Diego State University THE MECHANISMS OF ULTRA-SHORT