Salary correlations with batting performance
|
|
|
- Jeffry Martin
- 6 years ago
- Views:
Transcription
1 Salary correlations with batting performance By: Jaime Craig, Avery Heilbron, Kasey Kirschner, Luke Rector, Will Kunin Introduction Many teams pay very high prices to acquire the players needed to make that team the best it can be. While it often seems that high budget teams like the New York Yankees are often very successful, is the high price tag worth the improvement in performance? We compared many statistics including batting average, on base percentage, slugging, on base plus slugging, home runs, strike outs, stolen bases, runs created, and BABIP (batting average for balls in play) to salaries. We predicted that higher salaries will correlate to better batting performances. We also divided players into three groups by salary range, with the low salary range going up to $1 million per year, the mid-range salaries from $1 million to $10 million per year, and the high salaries greater than $10 million per year. We expected a stronger correlation between batting performance and salaries for players in the higher salary range than the correlation in the lower salary ranges. Low Salary Below $1 million In figure 1 is a correlation plot between salary and batting statistics. This correlation plot is for players that are making below $1 million. We see in all of the plots that there is not a significant correlation between salary and batting statistics. It is, however, evident that players earning the lowest salaries show the lowest correlations. The overall trend for low salary players--which would be expected--is a negative correlation between salary and batting performance. This negative correlation is likely a result of players getting paid according to their specific performance, or the data are reflecting underpaid rookies who have not bloomed in the major leagues yet.
2 Figure 1. Correlation plot of players with salaries under $1 million against offensive statistics Medium Salary Between $1-$10 million For medium salary players, who we categorized as getting paid $1-$10 million per year, it seems that salary has a relatively high correlation (see figure 2) with batting performance when compared with low salary and high salary players. The highest correlation for medium salary players is the "Runs Created (RC)" statistic, with homeruns (HR), slugging percentage (SLG) and on-base plus slugging (OPS) following closely behind. Statistics often used to represent batting performance, like batting average (AVG) and on-base percentage (OBP), showed little correlation with salary, suggesting that medium salary batters are getting paid for power hitting. Figure 2. Correlation plot of players with salaries between $1 million and $10 million against offensive statistics
3 High Salary Over $10 million We categorized high salary players as players who earned more than $10 million dollars each season. When examining correlations between salary and different offensive statistics, we find it surprising that a high salary is not necessarily indicative of strong offensive performance (figure 3). For this top level salary bracket, the highest correlations were for HR and "Runs Created". Both of these correlations were This correlation with HR can be explained since high HR hitters are generally considered stars and thus demand a higher salary. Additionally, Salary's correlation with "Runs Created" makes sense because teams place a great deal of value in runs. Interestingly the correlation between salary and HR and Runs Created is much lower than the same correlations for medium salary players. Figure 3. Correlation plot of players with salaries above $10 million against offensive statistics
4
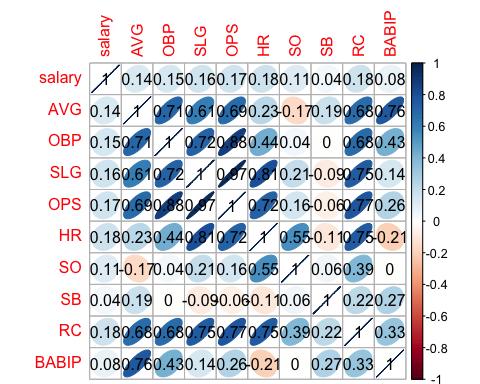
5 Figure 4. Correlation plot of all players with salaries against offensive statistics In the contemporary era, we found relatively low correlations with batting performance and salary even when segmented into three different salary ranges. The lowest correlation we found was in the salary ranging below one million annually; most hitting metrics in fact had negative correlations with salary. The highest correlation for batting performance was in the middle earning range, where runs created, home runs, on base plus slugging, and slugging percentage held the highest correlations. In the highest earning range ($10M+), these statistics correlate less than before; yet home runs, on base plus slugging, and on base percentages saw only slight drops. Runs created saw a significant drop in correlation from the middle range to the high range. Stolen bases also saw a significant drop in the high earning range. In the high salary range, batting average, on base percentage and home runs are most highly regarded as they are some of the highest predictive metrics and also show the lowest drop from the middle earning range. With the majority of Major League players earning in the middle range, we are able to see that clubs value run creation the most for these players, followed closely by home runs. This study also gives insight on what makes a high salary player earn what they do, and how they differentiate from the other salary ranges.while we
6 could compare correlation values between salary ranges and batting statistics, our data showed that there are no values remotely close to 1. The highest correlation value (0.35) we had was between salary and "runs created" in the combined correlation plot.
Pitching Performance and Age
 Pitching Performance and Age Jaime Craig, Avery Heilbron, Kasey Kirschner, Luke Rector and Will Kunin Introduction April 13, 2016 Many of the oldest and most long- term players of the game are pitchers.
Pitching Performance and Age
 Pitching Performance and Age By: Jaime Craig, Avery Heilbron, Kasey Kirschner, Luke Rector, Will Kunin Introduction April 13, 2016 Many of the oldest players and players with the most longevity of the
Major League Baseball Offensive Production in the Designated Hitter Era (1973 Present)
") Major League Baseball Offensive Production in the Designated Hitter Era (1973 Present) Jonathan Tung University of California, Riverside tung.jonathanee@gmail.com Abstract In Major League Baseball, there
Major League Baseball Offensive Production in the Designated Hitter Era (1973 Present) Jonathan Tung University of California, Riverside tung.jonathanee@gmail.com Abstract In Major League Baseball, there
The Rise in Infield Hits
 The Rise in Infield Hits Parker Phillips Harry Simon December 10, 2014 Abstract For the project, we looked at infield hits in major league baseball. Our first question was whether or not infield hits have
2013 National Baseball Arbitration Competition
 2013 National Baseball Arbitration Competition Dexter Fowler v. Colorado Rockies Submission on behalf of the Colorado Rockies Midpoint: $4.3 million Submission by: Team 27 Table of Contents: I. Introduction
2014 NATIONAL BASEBALL ARBITRATION COMPETITION ERIC HOSMER V. KANSAS CITY ROYALS (MLB) SUBMISSION ON BEHALF OF THE CLUB KANSAS CITY ROYALS
 SUBMISSION ON BEHALF OF THE CLUB KANSAS CITY ROYALS") 2014 NATIONAL BASEBALL ARBITRATION COMPETITION ERIC HOSMER V. KANSAS CITY ROYALS (MLB) SUBMISSION ON BEHALF OF THE CLUB KANSAS CITY ROYALS Player Demand: $4.00 Million Club Offer: $3.30 Million Midpoint:
2014 NATIONAL BASEBALL ARBITRATION COMPETITION ERIC HOSMER V. KANSAS CITY ROYALS (MLB) SUBMISSION ON BEHALF OF THE CLUB KANSAS CITY ROYALS Player Demand: $4.00 Million Club Offer: $3.30 Million Midpoint:
Dexter Fowler v. Colorado Rockies (MLB)
") 2013 NATIONAL BASEBALL ARBITRATION COMPETITION Dexter Fowler v. Colorado Rockies (MLB) SUBMISSION ON BEHALF OF: Dexter Fowler Club Offer: $4.0 million Midpoint: $4.3 million Player Request: $4.6 million
2013 NATIONAL BASEBALL ARBITRATION COMPETITION Dexter Fowler v. Colorado Rockies (MLB) SUBMISSION ON BEHALF OF: Dexter Fowler Club Offer: $4.0 million Midpoint: $4.3 million Player Request: $4.6 million
Chapter. 1 Who s the Best Hitter? Averages
 Chapter 1 Who s the Best Hitter? Averages The box score, being modestly arcane, is a matter of intense indifference, if not irritation, to the non-fan. To the baseball-bitten, it is not only informative,
Additional On-base Worth 3x Additional Slugging?
 Additional On-base Worth 3x Additional Slugging? Mark Pankin SABR 36 July 1, 2006 Seattle, Washington Notes provide additional information and were reminders during the presentation. They are not supposed
Team 10. Texas Rangers v. Nelson Cruz. Brief in support of Nelson Cruz
 Team 10 Texas Rangers v. Nelson Cruz Brief in support of Nelson Cruz Introduction In order for any team to succeed in the American League, it is vital that they have a lineup that is able to hit the ball.
Lorenzo Cain v. Kansas City Royals. Submission on Behalf of the Kansas City Royals. Team 14
 Lorenzo Cain v. Kansas City Royals Submission on Behalf of the Kansas City Royals Team 14 Table of Contents I. Introduction and Request for Hearing Decision... 1 II. Quality of the Player s Contributions
Correction to Is OBP really worth three times as much as SLG?
 Correction to Is OBP really worth three times as much as SLG? In the May, 2005 issue of By the Numbers, (available at www.philbirnbaum.com/btn2005-05.pdf), I published an article called Is OBP Really Worth
2014 National Baseball Arbitration Competition
 2014 National Baseball Arbitration Competition Eric Hosmer v. Kansas City Royals Submission on Behalf of Eric Hosmer Midpoint: $3.65 million Submission by: Team 26 Table of Contents I. Introduction and
2014 Tulane Baseball Arbitration Competition Eric Hosmer v. Kansas City Royals
 2014 Tulane Baseball Arbitration Competition Eric Hosmer v. Kansas City Royals Submission on behalf of Kansas City Royals Mid-Point: $3,650,000 Team 13 1 TABLE OF CONTENTS I. Introduction and Request for
2013 Tulane National Baseball Arbitration Competition
 2013 Tulane National Baseball Arbitration Competition Dexter Fowler vs. Colorado Rockies Submission on Behalf of Mr. Dexter Fowler Midpoint: $4.3 million Submission by Team 38 Table of Contents I. Introduction
2014 Tulane Baseball Arbitration Competition Eric Hosmer v. Kansas City Royals (MLB)
") 2014 Tulane Baseball Arbitration Competition Eric Hosmer v. Kansas City Royals (MLB) Submission on behalf of Kansas City Royals Team 15 TABLE OF CONTENTS I. INTRODUCTION AND REQUEST FOR HEARING DECISION...
2014 Tulane Baseball Arbitration Competition Eric Hosmer v. Kansas City Royals (MLB) Submission on behalf of Kansas City Royals Team 15 TABLE OF CONTENTS I. INTRODUCTION AND REQUEST FOR HEARING DECISION...
2015 NATIONAL BASEBALL ARBITRATION COMPETITION. Lorenzo Cain v. Kansas City Royals (MLB) SUBMISSION ON BEHALF OF KANSAS CITY ROYALS BASEBALL CLUB
 SUBMISSION ON BEHALF OF KANSAS CITY ROYALS BASEBALL CLUB") 2015 NATIONAL BASEBALL ARBITRATION COMPETITION Lorenzo Cain v. Kansas City Royals (MLB) SUBMISSION ON BEHALF OF KANSAS CITY ROYALS BASEBALL CLUB Salary Midpoint: $2.725 Submission by: Team 27 TABLE OF
2015 NATIONAL BASEBALL ARBITRATION COMPETITION Lorenzo Cain v. Kansas City Royals (MLB) SUBMISSION ON BEHALF OF KANSAS CITY ROYALS BASEBALL CLUB Salary Midpoint: $2.725 Submission by: Team 27 TABLE OF
Figure 1. Winning percentage when leading by indicated margin after each inning,
 The 7 th Inning Is The Key By David W. Smith Presented June, 7 SABR47, New York, New York It is now nearly universal for teams with a 9 th inning lead of three runs or fewer (the definition of a save situation
#35 CODY BELLINGER #58 EDWARD PAREDES
 #35 CODY BELLINGER #58 EDWARD PAREDES CODY BELLINGER // Infielder/Outfielder NON-ROSTER INVITEE 35 BATS: Left THROWS: Left HEIGHT: 6-4 WEIGHT: 213 OPENING DAY AGE: 21 ML SERVICE: 0.000 BORN: July 13, 1995
Running head: DATA ANALYSIS AND INTERPRETATION 1
 Running head: DATA ANALYSIS AND INTERPRETATION 1 Data Analysis and Interpretation Final Project Vernon Tilly Jr. University of Central Oklahoma DATA ANALYSIS AND INTERPRETATION 2 Owners of the various
Team Number 6. Tommy Hanson v. Atlanta Braves. Side represented: Atlanta Braves
 Team Number 6 Tommy Hanson v. Atlanta Braves Side represented: Atlanta Braves Table of Contents I. Introduction... 1 II. Hanson s career has been in decline since his debut and he has dealt with major
2014 National Baseball Arbitration Competition
 2014 National Baseball Arbitration Competition Eric Hosmer v. Kansas City Royals Submission on Behalf of Eric Hosmer Midpoint: $3,650,000 Submission by Team 2 Table of Contents I. Introduction and Request
2013 National Baseball Arbitration Competition. Tommy Hanson v. Atlanta Braves. Submission on behalf of Atlanta Braves. Submitted by Team 28
 2013 National Baseball Arbitration Competition Tommy Hanson v. Atlanta Braves Submission on behalf of Atlanta Braves Submitted by Team 28 1 TABLE OF CONTENTS I. INTRODUCTION AND REQUEST FOR DECISION...
OAKLAND ATHLETICS MATHLETICS MATH EDUCATIONAL PROGRAM. Presented by ROSS Dress for Less and Comcast SportsNet California
 OAKLAND ATHLETICS MATHLETICS MATH EDUCATIONAL PROGRAM EARN 2 VOUCHERS TO A 2015 REGULAR SEASON A s GAME! Good for select Monday Thursday home games (expires 9/9/2015) ELIGIBILITY Students from 1 st through
Package mlbstats. March 16, 2018
 Type Package Package mlbstats Marc 16, 2018 Title Major League Baseball Player Statistics Calculator Version 0.1.0 Autor Pilip D. Waggoner Maintainer Pilip D. Waggoner
2015 NATIONAL BASEBALL ARBITRATION COMPETITION. Mark Trumbo v. Arizona Diamondbacks. Submission on Behalf of Mark Trumbo. Midpoint: $5,900,000
 2015 NATIONAL BASEBALL ARBITRATION COMPETITION Mark Trumbo v. Arizona Diamondbacks Submission on Behalf of Mark Trumbo Midpoint: $5,900,000 Submission by: Team 15 Table of Contents I. Introduction and
Relative Value of On-Base Pct. and Slugging Avg.
 Relative Value of On-Base Pct. and Slugging Avg. Mark Pankin SABR 34 July 16, 2004 Cincinnati, OH Notes provide additional information and were reminders during the presentation. They are not supposed
Betaball. Using Finance to Evaluate. Baseball Contracts. Jamie O Donohue
 Betaball Using Finance to Evaluate Baseball Contracts Jamie O Donohue 4/21/2014 1 When I negotiated Bob Stanley s contract with the Red Sox, we had statistics demonstrating he was the third-best pitcher
MONEYBALL. The Power of Sports Analytics The Analytics Edge
 MONEYBALL The Power of Sports Analytics 15.071 The Analytics Edge The Story Moneyball tells the story of the Oakland A s in 2002 One of the poorest teams in baseball New ownership and budget cuts in 1995
2015 NATIONAL BASEBALL ARBITRATION COMPETITION
 2015 NATIONAL BASEBALL ARBITRATION COMPETITION Arizona Diamondbacks v. Mark Trumbo Submission on Behalf of Arizona Diamondbacks Midpoint: $5,900,000 Submission by Team: 5 Table of Contents I. Introduction
Matt Halper 12/10/14 Stats 50. The Batting Pitcher:
 Matt Halper 12/10/14 Stats 50 The Batting Pitcher: A Statistical Analysis based on NL vs. AL Pitchers Batting Statistics in the World Series and the Implications on their Team s Success in the Series Matt
Correlation and regression using the Lahman database for baseball Michael Lopez, Skidmore College
 Correlation and regression using the Lahman database for baseball Michael Lopez, Skidmore College Overview The Lahman package is a gold mine for statisticians interested in studying baseball. In today
2014 Tulane Baseball Arbitration Competition Josh Reddick v. Oakland Athletics (MLB)
") 2014 Tulane Baseball Arbitration Competition Josh Reddick v. Oakland Athletics (MLB) Submission on Behalf of the Oakland Athletics Team 15 Table of Contents I. INTRODUCTION AND REQUEST FOR HEARING DECISION...
2014 Tulane Baseball Arbitration Competition Josh Reddick v. Oakland Athletics (MLB) Submission on Behalf of the Oakland Athletics Team 15 Table of Contents I. INTRODUCTION AND REQUEST FOR HEARING DECISION...
A V C A - B A D G E R R E G I O N E D U C A T I O N A L T I P O F T H E W E E K
 A V C A - B A D G E R R E G I O N E D U C A T I O N A L T I P O F T H E W E E K P E R F O R M A N C E B E N C H M A R K S ( S T A T S ) F O R T H E R E S T O F U S KYLE MASHIMA, ROTATE23 AND SOLOSTATS23
Average Runs per inning,
 Home Team Scoring Advantage in the First Inning Largely Due to Time By David W. Smith Presented June 26, 2015 SABR45, Chicago, Illinois Throughout baseball history, the home team has scored significantly
Department of Economics Working Paper Series
 Department of Economics Working Paper Series Race and the Likelihood of Managing in Major League Baseball Brian Volz University of Connecticut Working Paper 2009-17 June 2009 341 Mansfield Road, Unit 1063
Monthly Indicators % + 8.2% % Market Overview New Listings Pending Sales. Closed Sales. Days on Market Until Sale. Median Sales Price
 Monthly Indicators 2018 Some economy observers are pointing to 2018 as the final period in a long string of sentences touting several happy years of buyer demand and sales excitement for the housing industry.
An Analysis of the Effects of Long-Term Contracts on Performance in Major League Baseball
 An Analysis of the Effects of Long-Term Contracts on Performance in Major League Baseball Zachary Taylor 1 Haverford College Department of Economics Advisor: Dave Owens Spring 2016 Abstract: This study
Predicting Season-Long Baseball Statistics. By: Brandon Liu and Bryan McLellan
 Stanford CS 221 Predicting Season-Long Baseball Statistics By: Brandon Liu and Bryan McLellan Task Definition Though handwritten baseball scorecards have become obsolete, baseball is at its core a statistical
JEFF SAMARDZIJA CHICAGO CUBS BRIEF FOR THE CHICAGO CUBS TEAM 4
 JEFF SAMARDZIJA V. CHICAGO CUBS BRIEF FOR THE CHICAGO CUBS TEAM 4 Table of Contents I. Introduction...1 II. III. IV. Performance and Failure to Meet Expectations...2 Recent Performance of the Chicago Cubs...4
TULANE UNIVERISTY BASEBALL ARBITRATION COMPETITION NELSON CRUZ V. TEXAS RANGERS BRIEF FOR THE TEXAS RANGERS TEAM # 13 SPRING 2012
 TULANE UNIVERISTY BASEBALL ARBITRATION COMPETITION NELSON CRUZ V. TEXAS RANGERS BRIEF FOR THE TEXAS RANGERS TEAM # 13 SPRING 2012 TABLE OF CONTENTS I. Introduction 3 II. III. IV. Quality of the Player
Do Clutch Hitters Exist?
 Do Clutch Hitters Exist? David Grabiner SABRBoston Presents Sabermetrics May 20, 2006 http://remarque.org/~grabiner/bosclutch.pdf (Includes some slides skipped in the original presentation) 1 Two possible
Raymond HV Gallucci, PhD, PE;
 PROOF OF PRINCIPLE FOR SITUATIONAL UNDERLYING VALUE (SUV) A Statistic to Measure Clutch Performance by Individuals in the Team Sports of Major League Baseball, Professional Football (NFL) and NCAA Men
Draft - 4/17/2004. A Batting Average: Does It Represent Ability or Luck?
 A Batting Average: Does It Represent Ability or Luck? Jim Albert Department of Mathematics and Statistics Bowling Green State University albert@bgnet.bgsu.edu ABSTRACT Recently Bickel and Stotz (2003)
Infield Hits. Infield Hits. Parker Phillips Harry Simon PARKER PHILLIPS HARRY SIMON
 Infield Hits Infield Hits PARKER PHILLIPS HARRY SIMON Parker Phillips Harry Simon What is an infield hit? AN INFIELD HIT IS A BASE HIT ON A BALL THAT DOES NOT LEAVE THE INFIELD Positives: Single. Not an
TULANE NATIONAL BASEBALL ARBITRATION COMPETITION 2012 NELSON CRUZ, PLAYER TEXAS RANGERS, TEAM BRIEF FOR TEXAS RANGERS, TEAM. Team no.
 TULANE NATIONAL BASEBALL ARBITRATION COMPETITION 2012 NELSON CRUZ, PLAYER V. TEXAS RANGERS, TEAM BRIEF FOR TEXAS RANGERS, TEAM Team no. 27 Representatives of Texas Rangers, Team INTRODUCTION Nelson Cruz
CS 221 PROJECT FINAL
 CS 221 PROJECT FINAL STUART SY AND YUSHI HOMMA 1. INTRODUCTION OF TASK ESPN fantasy baseball is a common pastime for many Americans, which, coincidentally, defines a problem whose solution could potentially
Effects of Incentives: Evidence from Major League Baseball. Guy Stevens April 27, 2013
 Effects of Incentives: Evidence from Major League Baseball Guy Stevens April 27, 2013 1 Contents 1 Introduction 2 2 Data 3 3 Models and Results 4 3.1 Total Offense................................... 4
to the Kansas City Royals for the purposes of an arbitration hearing governed by the Major
 I. Introduction and Request for Hearing Decision This brief identifies and analyzes the contributions made by center fielder Lorenzo Cain to the Kansas City Royals for the purposes of an arbitration hearing
2013 National Baseball Arbitration Competition Tulane University Law School
 2013 National Baseball Arbitration Competition Tulane University Law School Dexter Fowler v. Colorado Rockies Submitted on Behalf of the Colorado Rockies Midpoint: $4.3 million By: Team 24 1 TABLE OF CONTENTS
Dexter Fowler v. Colorado Rockies. Submission on Behalf of the Colorado Rockies. Team 18
 Dexter Fowler v. Colorado Rockies Submission on Behalf of the Colorado Rockies Team 18 I. Introduction The Colorado Rockies ( Rockies ), a Major League Baseball ( MLB ) team in the National League West
The Influence of Free-Agent Filing on MLB Player Performance. Evan C. Holden Paul M. Sommers. June 2005
 The Influence of Free-Agent Filing on MLB Player Performance by Evan C. Holden Paul M. Sommers June 2005 MIDDLEBURY COLLEGE ECONOMICS DISCUSSION PAPER NO. 05-07 DEPARTMENT OF ECONOMICS MIDDLEBURY COLLEGE
2015 National Baseball Arbitration Competition
 2015 National Baseball Arbitration Competition Lorenzo Cain vs. Kansas City Royals Submission of $3.35 million on Behalf of Lorenzo Cain Midpoint: $2.725 million By: Team 31 Table of Contents I. Introduction
A Database Design for Selecting a Golden Glove Winner using Sabermetrics
 , pp.38-42 http://dx.doi.org/10.14257/astl.2015.110.08 A Database Design for Selecting a Golden Glove Winner using Sabermetrics Wu-In Jang and Young-Ho Park *, Department of Multimedia Science, Sookmyung
An average pitcher's PG = 50. Higher numbers are worse, and lower are better. Great seasons will have negative PG ratings.
 Fastball 1-2-3! This simple game gives quick results on the outcome of a baseball game in under 5 minutes. You roll 3 ten-sided dice (10d) of different colors. If the die has a 10 on it, count it as 0.
BABE: THE SULTAN OF PITCHING STATS? by. August 2010 MIDDLEBURY COLLEGE ECONOMICS DISCUSSION PAPER NO
 BABE: THE SULTAN OF PITCHING STATS? by Matthew H. LoRusso Paul M. Sommers August 2010 MIDDLEBURY COLLEGE ECONOMICS DISCUSSION PAPER NO. 10-30 DEPARTMENT OF ECONOMICS MIDDLEBURY COLLEGE MIDDLEBURY, VERMONT
Small Business Dynamics and Job Creation. Small Business Numbers, Pretty Pictures and Not So Pretty Pictures
 Small Business Dynamics and Job Creation Or Small Business Numbers, Pretty Pictures and Not So Pretty Pictures Brian Headd Office of Advocacy U.S. Small Business Administration Employers 8,000,000 7,500,000
1. Answer this student s question: Is a random sample of 5% of the students at my school large enough, or should I use 10%?
 Econ 57 Gary Smith Fall 2011 Final Examination (150 minutes) No calculators allowed. Just set up your answers, for example, P = 49/52. BE SURE TO EXPLAIN YOUR REASONING. If you want extra time, you can
Gouwan Strike English Manual
 Gouwan Strike English Manual Number of Players 2 Set Description Game board 1 Ball piece 1 Bat piece 1 Count pieces/runner pieces 11 Pitcher cards 26 Pitching cards 64 Batter cards 24 Batting cards 6 Situation
JULY 2012 GREYSCALE Mathletics_Workbook_6-8.indd 1
 GITAL LOGO SHEET T S T SP ORTSNET FULL JULY 2012 COLOR 1B SP ORTS NET GREYSCALE 2013 Mathletics_Workbook_6-8.indd 1 1/10/13 2:54 PM EARN 2 VOUCHERS TO A 2013 A s GAME! ELIGIBILITY Students from 1st through
B. AA228/CS238 Component
 Abstract Two supervised learning methods, one employing logistic classification and another employing an artificial neural network, are used to predict the outcome of baseball postseason series, given
When Should Bonds be Walked Intentionally?
 When Should Bonds be Walked Intentionally? Mark Pankin SABR 33 July 10, 2003 Denver, CO Notes provide additional information and were reminders to me for making the presentation. They are not supposed
2017 PFF RUSHING REPORT
 WELCOME TO PRO FOOTBALL FOCUS 2017 RUSHING REPORT. Here, we break down each team s respective successes in each of the six core run-blocking concepts and give an overall scope of each NFL team s ability
A Comparison of Team Values in Professional Team Sports ( )
") A Comparison of Team Values in Professional Team Sports (2003 2012) The following charts, tables, and report are intended to provide insight into the changes in team values among the four major professional
A Comparison of Team Values in Professional Team Sports (2003 2012) The following charts, tables, and report are intended to provide insight into the changes in team values among the four major professional
CHAPTER 2 Modeling Distributions of Data
 CHAPTER 2 Modeling Distributions of Data 2.1 Describing Location in a Distribution The Practice of Statistics, 5th Edition Starnes, Tabor, Yates, Moore Bedford Freeman Worth Publishers Describing Location
TULANE BASEBALL ARBITRATION COMPETITION. Isaac Benjamin Davis. New York Metropolitan Baseball Club, Inc. ARBITRATION BRIEF FOR ISAAC BENJAMIN DAVIS
 TULANE BASEBALL ARBITRATION COMPETITION Isaac Benjamin Davis v. New York Metropolitan Baseball Club, Inc. ARBITRATION BRIEF FOR ISAAC BENJAMIN DAVIS Team 25 TABLE OF CONTENTS I. INTRODUCTION AND REQUEST
Lab 11: Introduction to Linear Regression
 Lab 11: Introduction to Linear Regression Batter up The movie Moneyball focuses on the quest for the secret of success in baseball. It follows a low-budget team, the Oakland Athletics, who believed that
George F. Will, Men at Work
 Part of baseball s charm is the illusion it offers that all aspects of it can be completely reduced to numerical expressions and printed in agate type in the sport section. George F. Will, Men at Work
The MLB Language. Figure 1.
 Chia-Yen Wu chiayen@avaya.com June 6, 2006 The MLB Language 1. Introduction The MLB (Major League Baseball) language is designed to help an interested party determine certain characteristics of a baseball
How to Make, Interpret and Use a Simple Plot
 How to Make, Interpret and Use a Simple Plot A few of the students in ASTR 101 have limited mathematics or science backgrounds, with the result that they are sometimes not sure about how to make plots
AggPro: The Aggregate Projection System
 Gore, Snapp and Highley AggPro: The Aggregate Projection System 1 AggPro: The Aggregate Projection System Ross J. Gore, Cameron T. Snapp and Timothy Highley Abstract Currently there exist many different
Internet Technology Fundamentals. To use a passing score at the percentiles listed below:
 Internet Technology Fundamentals To use a passing score at the percentiles listed below: PASS candidates with this score or HIGHER: 2.90 High Scores Medium Scores Low Scores Percentile Rank Proficiency
2014 Tulane National Baseball Arbitration Competition Jeff Samardzija v. Chicago Cubs (MLB)
") 2014 Tulane National Baseball Arbitration Competition Jeff Samardzija v. Chicago Cubs (MLB) Submission on behalf of Jeff Samardzija Team 15 TABLE OF CONTENTS I. Introduction and Request for Hearing Decision..
2014 Tulane National Baseball Arbitration Competition Jeff Samardzija v. Chicago Cubs (MLB) Submission on behalf of Jeff Samardzija Team 15 TABLE OF CONTENTS I. Introduction and Request for Hearing Decision..
2014 National Baseball Arbitration Competition
 2014 National Baseball Arbitration Competition Jeff Samardzija v. Chicago Cubs Submission on Behalf of Jeff Samardzija Midpoint: $4.9 million Submission by: Team 18 i Table of Contents I. Introduction
2015 National Baseball Arbitration Competition
 2015 National Baseball Arbitration Competition Lorenzo Cain v Kansas City Royals Submission on Behalf of Kansas City Royals Midpoint: 2.725 million Submission by Team 28 Table of Contents I. Introduction
NES-89-USA. The NES Files
 NES-89-USA This official seal is your assurance that Nintendo has reviewed this product and that it has met our standards for excellence in workmanship, reliability and entertainment value. Always look
One could argue that the United States is sports driven. Many cities are passionate and
 Hoque 1 LITERATURE REVIEW ADITYA HOQUE INTRODUCTION One could argue that the United States is sports driven. Many cities are passionate and centered around their sports teams. Sports are also financially
9.3 Histograms and Box Plots
 Name Class Date 9.3 Histograms and Box Plots Essential Question: How can you interpret and compare data sets using data displays? Explore Understanding Histograms Resource Locker A histogram is a bar graph
DO YOU KNOW WHO THE BEST BASEBALL HITTER OF ALL TIMES IS?...YOUR JOB IS TO FIND OUT.
 Data Analysis & Probability Name: Date: Hour: DO YOU KNOW WHO THE BEST BASEBALL HITTER OF ALL TIMES IS?...YOUR JOB IS TO FIND OUT. This activity will find the greatest baseball hitter of all time. You
Machine Learning an American Pastime
 Nikhil Bhargava, Andy Fang, Peter Tseng CS 229 Paper Machine Learning an American Pastime I. Introduction Baseball has been a popular American sport that has steadily gained worldwide appreciation in the
Billy Beane s Three Fundamental Insights on Baseball and Investing
 Billy Beane s Three Fundamental Insights on Baseball and Investing September 10, 2018 by Marianne Brunet How did Billy Beane come up with the moneyball approach to evaluating baseball players? Though Brad
Lesson 2 Pre-Visit Slugging Percentage
 Lesson 2 Pre-Visit Slugging Percentage Objective: Students will be able to: Set up and solve equations for batting average and slugging percentage. Review prior knowledge of conversion between fractions,
GUIDE TO BASIC SCORING
 GUIDE TO BASIC SCORING The Score Sheet Fill in this section with as much information as possible. Opposition Fielding changes are indicated in the space around the Innings Number. This is the innings box,
THE HOMESTAND AHEAD Toronto tries to play catch-up in Wild Card race as they host Seattle and Minnesota.
 TORONTO BLUE JAYS MEDIA NEWSLETTER VOLUME 2007, ISSUE 7 Released July 19, 2007 IN THIS ISSUE.. The Homestand Ahead: Jays try to play catch-up The Road Trip that Follows: Jays visit the Windy City and Sunshine
NUMB3RS Activity: Is It for Real? Episode: Hardball
 Teacher Page 1 NUMB3RS Activity: Is It for Real? Topic: Data analysis Grade Level: 9-10 Objective: Use formulas to generate data points. Produce line graphs of which inferences are made. Time: 20 minutes
AP Stats Chapter 2 Notes
 AP Stats Chapter 2 Notes 2.1 Measures of Relative Standing & Density Curves What is a percentile? On a test, is a student s percentile the same as the percent correct? Example: Test Scores Suppose the
4-3 Rate of Change and Slope. Warm Up. 1. Find the x- and y-intercepts of 2x 5y = 20. Describe the correlation shown by the scatter plot. 2.
 Warm Up 1. Find the x- and y-intercepts of 2x 5y = 20. Describe the correlation shown by the scatter plot. 2. Objectives Find rates of change and slopes. Relate a constant rate of change to the slope of
Regression Analysis of Success in Major League Baseball
 University of South Carolina Scholar Commons Senior Theses Honors College Spring 5-5-2016 Regression Analysis of Success in Major League Baseball Johnathon Tyler Clark University of South Carolina - Columbia
Gain the Advantage. Build a Winning Team. Sports
 Gain the Advantage. Build a Winning Team. Sports Talent scouts and team managers have traditionally based their drafting selections on seemingly obvious and common-sense criteria: observable skills and
Bouton Championship Dynasty CBA
 Bouton Championship Dynasty 2016-17 CBA 2016-17 Dynasty League Transition League Structure LEAGUE SIZE Maximum number of Yahoo! league teams permitted is twelve (12). Exception 2016 transition may result
The pth percentile of a distribution is the value with p percent of the observations less than it.
 Describing Location in a Distribution (2.1) Measuring Position: Percentiles One way to describe the location of a value in a distribution is to tell what percent of observations are less than it. De#inition:
Expansion: does it add muscle or fat? by June 26, 1999
 Expansion: does it add muscle or fat? David by W. Smith June 26, 1999 Many things in baseball generate mixed feelings and opinions, but expansion creates especially strong reactions. On the one hand, communities
Charlotte Region Monthly Indicators
 Charlotte Region Monthly Indicators A RESEARCH TOOL PROVIDED BY CHARLOTTE REGIONAL REALTOR ASSOCIATION FOR MORE INFORMATION CONTACT A REALTOR 2018 Some economy observers are pointing to 2018 as the final
2015 SAN DIEGO PADRES ADDITIONAL PLAYER BIOS
 2015 SAN DIEGO PADRES ADDITIONAL PLAYER BIOS 43 - Jon Edwards - RHP 46 - Craig Kimbrel - RHP 20 - Bud Norris - RHP 45 - Marc Rzepczynski - LHP 2 - Melvin Upton, Jr. - OF PLAYERS CRAIG KIMBREL RIGHT-HANDED
2018 Winter League N.L. Web Draft Packet
 2018 Winter League N.L. Web Draft Packet (WEB DRAFT USING YEARS 1981-1984) Welcome to Scoresheet Baseball: the 1981-1984 Seasons. This document details the process of drafting your 2010 Old Timers Baseball
2014 NATIONAL BASEBALL ARBITRATION COMPETITION
 2014 NATIONAL BASEBALL ARBITRATION COMPETITION Jeff Samardzija v. Chicago Cubs Submission on Behalf of Jeff Samardzija Midpoint: $4,900,000 Submission by Team 17 Table of Contents I. Introduction and Request
Background Information. Project Instructions. Problem Statement. EXAM REVIEW PROJECT Microsoft Excel Review Baseball Hall of Fame Problem
 Background Information Every year, the National Baseball Hall of Fame conducts an election to select new inductees from candidates nationally recognized for their talent or association with the sport of
2015 NATIONAL BASEBALL ARBITRATION COMPETITION
 2015 NATIONAL BASEBALL ARBITRATION COMPETITION Lorenzo Cain v. Kansas City Royals Submission on Behalf of Lorenzo Cain Midpoint: 2.725 Million Submission by Team 5 ` Table of Contents I. Introduction and
a) List and define all assumptions for multiple OLS regression. These are all listed in section 6.5
 List and define all assumptions for multiple OLS regression. These are all listed in section 6.5") Prof. C. M. Dalton ECN 209A Spring 2015 Practice Problems (After HW1, HW2, before HW3) CORRECTED VERSION Question 1. Draw and describe a relationship with heteroskedastic errors. Support your claim with
Prof. C. M. Dalton ECN 209A Spring 2015 Practice Problems (After HW1, HW2, before HW3) CORRECTED VERSION Question 1. Draw and describe a relationship with heteroskedastic errors. Support your claim with
Efficiency Wages in Major League Baseball Starting. Pitchers Greg Madonia
 Efficiency Wages in Major League Baseball Starting Pitchers 1998-2001 Greg Madonia Statement of Problem Free agency has existed in Major League Baseball (MLB) since 1974. This is a mechanism that allows