Ragnar Tveteras. University of Stavanger Norway
|
|
|
- Francis Griffin
- 6 years ago
- Views:
Transcription
1 Ragnar Tveteras University of Stavanger Norway Professor Ragnar Tveteras is a business economist at the University of Stavanger s Department for Industrial Economics, Risk Management and Planning. His research focuses primarily on aquaculture and seafood markets. As a writer and lecturer, he maintains relationships with authorities and private decision makers at the regional, national and international levels. 1
2 Fish Production Estimates & Trends, Ragnar Nystoyl Ragnar Tveteras
3 Acknowledgements Organizations: GAA, Urner Barry, Norwegian Seafood Council, Eurostat, FAO, Apromar, IMF. Darryl Jory, Paul S. Valle, Apostolos Tzoumas, Brian O Hanlon, Chris Calogeras, Dr. P.E.Vijay Anand, Jack Zhang Chunbin, Kevin Fitzsimmons, Liu Liping, M Siva Prasad, Mauricio Castro, Philip Shin, Ronald Cheong, Sergio Zimmermann, Tzyh-Chung Miaw, Sigbjorn Tveteras, and many anonymous sources. 3
4 Scope of Analysis Most focus on internationally traded species: Typically imported to USA, Europe & Japan. Production forecasts for 213 for all chosen species: But for some species only major producer countries/regions. Global production forecast for 214 almost all species. 4
5 Finfish Species Included in Freshwater Tilapia Analysis Barramundi Milkfish Catfish Pangasius Channel catfish, etc. Carp Diadromous Salmon & Trout Atlantic salmon Coho salmon Trout Marine Seabass & Bream Flatfishes Olive Flounder Atlantic Halibut Turbot Cobia Atlantic cod Bluefin tuna Grouper 5
6 FRESHWATER 6
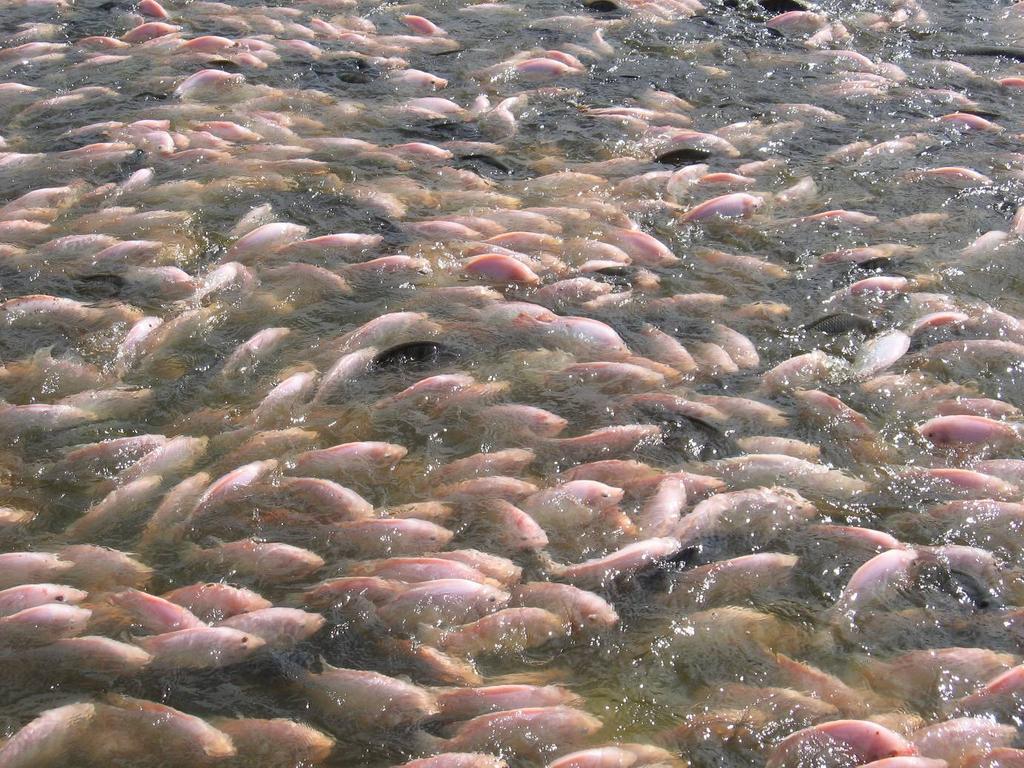
7 TILAPIA
8 Tilapia Global Aquaculture Production 1 METRIC TONNES REAL PRICE (USD/KG) Sources: : FAO; : Kevin Fitzsimmons ; Prices US import frozen fillet: NMFS. Note: Prices are January- December averages, except for 212 (January- August average) 8
9 Tilapia Countries production sorted by 212 figures China Indonesia Egypt Philippines Brasil Thailand Brazil Others Bangladesh Vietnam Taiwan Colombia Ecuador Mexico Malaysia 5, 1,, 1,5, 282,275 34, 237,55 254, 265, 123,333 16, 71, 57, 41,667 55,75 47, 587, , 1,312, Average of es\mates from several sources. 9
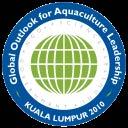

10 PANGASIUS
11 Pangasius Production in selected countries 3,, 2,5, Metric Tonnes 2,, 1,5, 1,, 5, 1,415,75 971, 92, 1,1, 423,15 486,622 56, 644, 313,333 35, 3, 34,667 Vietnam Thailand Indonesia India Bangladesh Sources: Kontali, Dr. P.E.Vijay Anand, M Siva Prasad and several anonymous. 11
12 1 Metric tonnes Pangasius Produc/on in Vietnam and EU import real import price (EUR kg) Real export price (EUR/kg) Sources: FAO ( ), miscellaneous sources ( ). Prices: Norwegian Seafood Council/Eurostat. 12
13 Produc/on in metric tonnes Total production of Catfish species Excl. pangasius Brazil Egypt Myanmar Others Cambodia Uganda Malaysia Thailand Nigeria USA Bangladesh Indonesia China Vietnam Sources: FAO, Kontali and miscellaneous anonymous. 13
14 Produc/on in metric tonnes Total production of Catfish species 4,, 3,5, 3,, 2,5, 2,, 1,5, 1,, 5, US unit import price catfish products 886,9 1,59,92 1,32,521 1,578,1 2,77,969 2,676,22 2,72,89 3,199,68 3,365,587 3,635, 3,685, 3,69, US D per kg Produc\on US Unit import price ca]ish Sources: FAO, Kontali. Prices: Urner Barry. 14
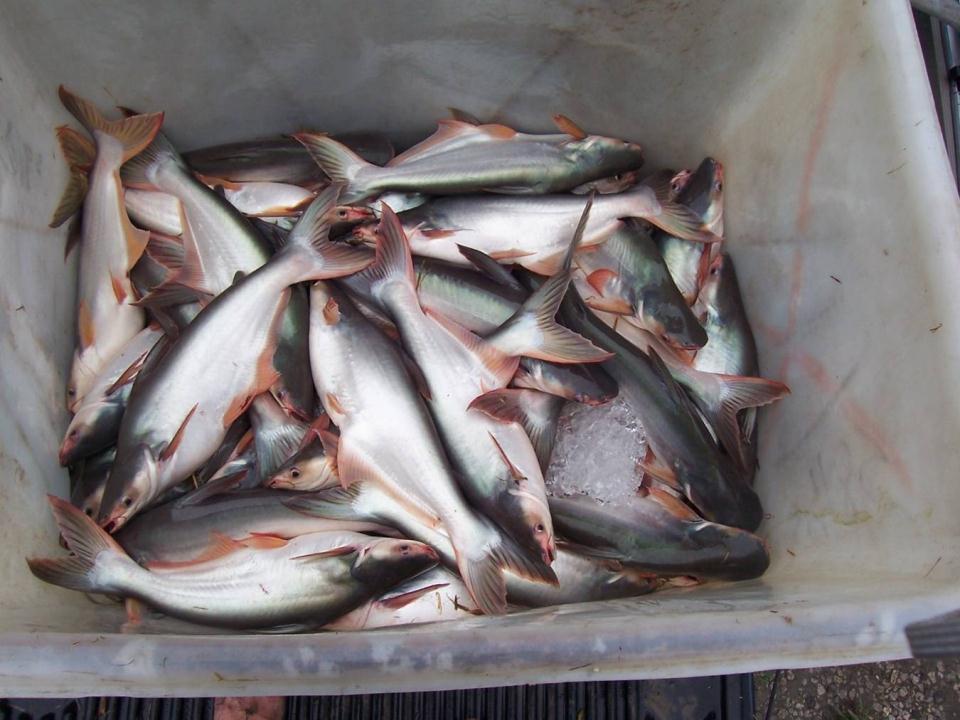
15 DIADROMOUS 15
16 SALMONIDS
17 Atlantic Salmon Production and EU15 real import price fresh gutted from Norway Production in metric tonnes 25 EU real import price (EUR/kg) , ,176 83, ,74 1,32,712 1,8,897 1,132,994 1,244,637 1,252, 1,272,1 1,399,7 1,497,5 1,468,9 1,446,2 1,622,9 1,98,4 2,13,3 2,74, Sources: FAO, Kontali, NSEC/Eurostat (prices). Note: Prices are annual averages. Price in 213 is January- July average. 17
18 Produc/on in Metric Tonnes Atlantic Salmon Production by country Norway Chile UK Canada Faroe Islands Australia Ireland USA Others Source: Kontali 18
19 Coho Salmon Total Production and Real Export Price on Chilean Coho Frozen Round Production in Metric Tonnes 2, 18, 16, 14, 12, 1, 8, 6, 4, 2, Production Real price 39,164 44,385 48,513 49,154 58,7 58,36 76,197 84,867 88,32 89,475 18,626 15, ,745 15,869 1, ,2 119,5 138,6 138, 18,4 125,2 147,7 167,9 179,8 141, Price in Real USD per Kilo Sources: FAO, Kontali,NSC 19
20 Produc/on in Metric Tonnes Coho Salmon Production by country Chile Japan Others Source: Kontali 2
21 4, Rainbow Trout Total Marine Production and Chilean frozen USD/kg (blue) and Norwegian fresh EUR/kg (red) real export prices 7 Metric tonnes 35, 3, 25, 2, 15, 1, 5, 33,567 34,321 47,512 57,175 69,748 8,593 13,9 125,73 145, , ,33 26,58 222,433 25,55 214, ,3 253,6 34,9 328,3 297,5 37,1 316,5 362,4 298,1 288, Real export price Sources: FAO, Kontali, NSC. Note: Prices are annual averages except 213 (January-July average). 21
22 Produc/on in Metric Tonnes Trout production in Latin America, excl. Chile Venezuela Peru Panama Mexico Costa Rica Colombia Sources: FAO ( ); Anonymous (212_215). 22

23 Barramundi / Asian Seabass
24 Barramundi Total production by major producing Countries Metric Tonnes Others Australia Indonesia Thailand Malaysia Taiwan Source: FAO 24
25 3 25 Barramundi Production forecasts for selected countries Taiwan Australia Indonesia Vietnam Metrc Tonnes Sources: FAO (22-21) and anonymous sources ( ) 25
26 MARINE 26

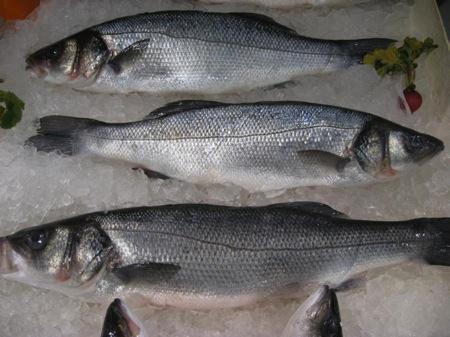
27 SEA BREAM AND BASS
28 Production in metric tonnes Seabass & Sea Bream Meditteranean Production 4 35 Sea Breams Sea Basses ,5 113,2 16,7 123,5 169,2 12,7 17,3 124,7 166,2 127,7 161,1 129,7 177,4 142,8 195,2 147,5 18,5 154,2 Source: FEAP, Kontali (26-213) 28
29 Seabass & Sea Bream Mediterranean Production & Real Italian Production Sea Basses and Breams Real price fresh Gilthead seabream Production (metric tonnes) 4, 35, 3, 25, 2, 15, 1, 5, 14, , , , ,4 23 Import Price 157, , , ,2 27 Real price fresh whole seabass 289, , , , ,2 212 Real Price (Euro per kilo) 342, , Source: FEAP, Kontali, Eurostat 29
30 FLATFISHES
31 Olive Flounder Production and real farmgate price Production in metric tonnes Japan Rep. of Korea Real price Rep. of Korea (USD/kg) Real price (USD/kg) Sources: FAO ( ), Philip Shin and anonymous ( ) 31
32 Turbot Production in selected countries excl. China Others Denmark France Real Farmgate Price Spain Norway Portugal Spain Metric Tonnes Real Price (EUR/Kg) 2 2 Sources: FAO, Kontali. 32
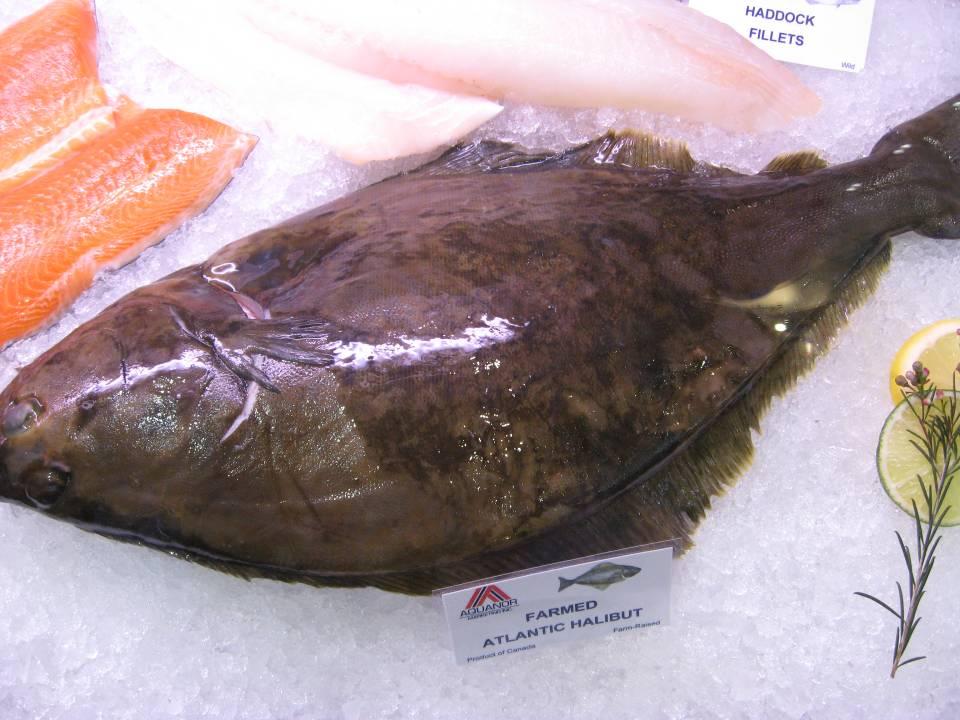
33 Atlantic Halibut Production Iceland UK Norway Real Export Price Norway Produc/on in metric tonnes Real Price (USD/kg) Source: FAO (21-24), Kontali (25-214), NSC (prices). Note: Prices are annual averages, price in 213is January- July average. 33
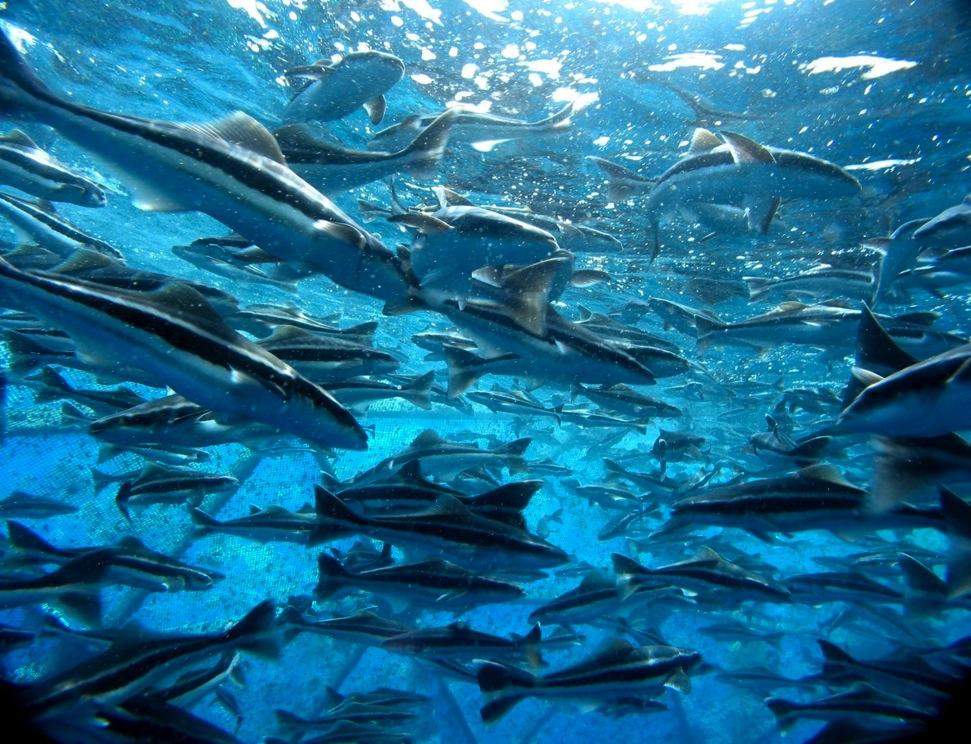
34 COBIA
35 Cobia Major Producing Countries until Metric Tonnes Real price Taiwan (USD/kg) Other Colombia Taiwan China Real price Taiwan Source: FAO 35
36 Farmed Cobia Estimates for Vietnam, Taiwan and Panama Metric Tonnes 4 Vietnam Taiwan Panama Source: FAO (211), Various sources ( ) 36

37 ATLANTIC COD
38 Atlantic Cod Total Farmed Production and Norwegian Produc/on in metric tonnes Export price Real price in Euro per kg Faroe Islands Canada UK Iceland Norway Export price fresh guted Cod Sources: Norwegian Directorate of Fisheries ( ), Kontali (25-213), Norwegian Seafood Council (Prices). Note: Prices are annual averages, price in 213 is Jan-July average. 38
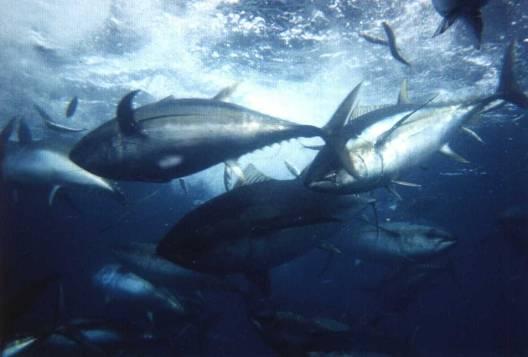
39 TUNAS
40 Bluefin Tuna Total Produc/on and US real import price fresh Metric tonnes Production US import price fresh Real price (USD/kg) Sources: Produc\on - Apostolos Tzoumas; import price- NMFS. Note: Prices are annual averages, price in 212 is January- August average. 4
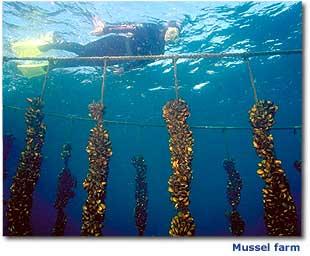
41 MUSSELS
42 Total Mussel Produc/on 1,82, 1,8, Metric Tonnes 1,78, 1,76, 1,74, 1,72, 1,7, 1,68, 1,727,638 1,81,541 1,797,9 1,79,986 1,83,65 1,811, Sources: Kontali and misc. sources 42
43 Summary Finfish 43
44 Aquaculture Production of Fish Species and 1-year growth rate Produc/on in Mill. metric tonnes Produc\on Double in a decade % growth % ten year growth rate Source: FAO 44
45 Aquaculture Production of Fish Species Produc/on in Mill. metric tonnes and Seafood Price Indices Produc\on Total price index Aquaculture price index Seafood price index (22-24=1) Source: FAO 45
46 Diadromous Species Annual Percent Growth Rates Milkfish, Philippines Barramundi (AU, IN, TW) Trout, La\n America Rainbow trout Coho salmon Atlan\c salmon
47 Freshwater Species Annual Percent Growth Rates Channel Ca]ish Pangasius, Vietnam Carp, China Tilapia
48 Marine Species Annual Percent Growth Rates Grouper Bluefin tuna Atlan\c cod. Atlan\c halibut Turbot, excl. China Olive flounder; Korea Rep Sea bass & bream, Medit
49 Production of Surveyed Species Excl. Carp in China, Produc/on in Mill. metric tonnes
50 Production of Surveyed Species Excl. Carp in China, Produc/on in Mill. metric tonnes Produc\on % growth % growth
51 Production of Surveyed Species Excl. Carp in China Mill. Metric Tonnes Marine Diadromous Freshwater
52 Growth Rates by Species Groups ( average growth rate in parenthesis) 35. % growth Freshwater (7.2%) Diadromous (5.8% Marine (6.9%)
53 Growth Rates by Species Groups 35. excl. Carp in China ( average growth rate in parenthesis) % growth Freshwater (13.5%) Diadromous (5.8% Marine (6.9%)
54 Production of Surveyed Whitefish Species Excluding Carp in China, Produc/on in Mill. metric tonnes
55 Production of Surveyed Whitefish Species Excluding Carp in China, Produc/on in Mill. metric tonnes Produc\on % growth % growth 55
56 Production of Surveyed Whitefish Species and Average Import Prices Frozen whole Excluding Carp in China, Produc/on in Mill. metric tonnes Produc\on USA aquaculture USA capture EU15 capture Average Import Price Source prices: Norwegian Seafood Council 56
57 Did they double in a decade? Percentage growth Pangasius, Vietnam Atlantic halibut Channel Catfish Trout, Latin America Barramundi (AU, IN, TW) Tilapia Atlantic cod Sea bass & bream, Medit. Turbot, excl. China Atlantic salmon Coho salmon Milkfish, Philippines Carp, China Rainbow trout Grouper Olive flounder; Korea Rep. Bluefin tuna Percent 57
58 Did they double in a decade? Percentage growth Marine Diadromous Freshwater ex. Carp China Freshwater 98.8 TOTAL EX. CARP CHINA TOTAL Percent 58
59 Thank You! 59
COMMODITY UPDATE. Freshwater fish
 COMMODITY UPDATE Freshwater fish August 2015 Tilapia, Pangasius, Nile Perch COMMODITY update The COMMODITY UPDATE reports contain information on prices, imports, exports and production by commodity. The
Shrimp Production Review
 Shrimp Production Review James L. Anderson Director, Institute for Sustainable Food Systems University of Florida Diego Valderrama University of Florida Darryl Jory Global Aquaculture Alliance James Anderson
GLOBAL SALMON PRODUCTION
 GLOBAL SALMON PRODUCTION Trends in Production and Market Development By Ragnar Nystoyl, Head of Analysis Kontali Analyse Vigo October 1st 2018 Agenda Supply Development Farmed Salmonids Wild-caught Salmon
OVERVIEW OF FISH PRODUCTION, UTILIZATION, CONSUMPTION AND TRADE
 FISHERY INFORMATION, DATA AND STATISTICS UNIT OVERVIEW OF FISH PRODUCTION, UTILIZATION, CONSUMPTION AND TRADE BASED ON 21 DATA by STEFANIA VANNUCCINI Fishery Statistician (Commodities) FAO, Fishery Information,
Freshwater fish. Carp, Perch, Pike, Burbot, Barb, Milkfish. Extract from GLOBEFISH Databank Prices - Exports - Imports - Production
 Commodity Update Freshwater fish Carp, Perch, Pike, Burbot, Barb, Milkfish Extract from GLOBEFISH Databank Prices - Exports - Imports - Production November 2012 Freshwater fish - Carp, Perch, Pike, Burbot,
08 / Industriveien 18 Phone: N Kristiansund Fax:
 Aquaculture Bulletin HEADLINES 08 / 2006 - a guideline for investors in the aquaculture business * Still high prices on the wholesale markets in the EU, with total supply of Atlantic salmon up with 4.6
Feeding fish to fish is this a responsible practice?
 Feeding fish to fish is this a responsible practice? Andrew Jackson Technical Director International Fishmeal & Fish Oil Organisation Humber Seafood Summit 15 July 2010 IFFO International Fishmeal and
Elements for the Biennial Review And Assessment of the World Timber Situation SELECTED DATA AND ANALYSIS.
 Elements for the Biennial Review And Assessment of the World Timber Situation 2015-2016 SELECTED DATA AND ANALYSIS Frances Maplesden Content Results of the 2016 Joint Forest Sector Questionnaire Secondary
STORM FORECASTS: The only independent source of animal health and animal agriculture historical market data and forecasts
 The only independent source of animal health and animal agriculture historical market data and forecasts June 2016 1 What is STORM FORECASTS? STORM FORECASTS is the only independent source of animal health
Facts and figures on the CFP. Basic data on the Common Fisheries Policy
 E D I T I O N 2 0 0 6 Facts and figures on the CFP Basic data on the Common Fisheries Policy Statistics were provided by Eurostat. A great deal of additional information on the European Union is available
Facts and figures on the CFP. Basic data on the Common Fisheries Policy
 Facts and figures on the CFP Basic data on the Common Fisheries Policy Edition 2004 Statistics were provided by Eurostat. A great deal of additional information on the European Union is available on the
World supply and demand of tilapia
 World supply and demand of tilapia by Helga Josupeit FAO Rome, October 2010 World tilapia production World tilapia production has been booming during the last decade, with output doubling from 830000 tonnes
Why is Aquaculture and Aquatic Animal Health so Important?
 OIE Workshop for Aquatic Animal Focal Points Dubrovnik, Croatia 16-18 November 2010 Why is Aquaculture and Aquatic Animal Health so Important? Barry Hill President OIE Aquatic Animal Health Standards Commission
Salmon Market Analysis 2007
 Salmon Market Analysis 2007 April 2008 Systemizing the World of Aquaculture and Fisheries Industriveien 18, NO-6517 Kristiansund N Norway Tel.: +47 71 68 33 00 Fax: +47 71 68 33 01 E-mail: mail@kontali.no
Bristol Bay and World Salmon Markets in 2016
 Bristol Bay and World Salmon Markets in 2016 Gunnar Knapp Professor Emeritus of Economics Institute of Social and Economic Research University of Alaska Anchorage Gunnar.Knapp@gmail.com January 24, 2017
TILAPIA AQUACULTURE 2016 AND WHERE WILL WE BE IN 2026
 TILAPIA AQUACULTURE 2016 AND WHERE WILL WE BE IN 2026 Kevin Fitzsimmons, Ph.D. University of Arizona, Professor of Environmental Science World Aquaculture Society, Past-President Aquaculture without Frontiers,
WP2 ECONOMIC PERFORMANCE AND PRICES PAUL STEINAR VALLE KONTALI ANALYSE AS. Annual meeting, Vilanova, 2017
 WP2 ECONOMIC PERFORMANCE AND PRICES PAUL STEINAR VALLE KONTALI ANALYSE AS Annual meeting, Vilanova, 2017 1950 1953 1956 1959 1962 1965 1968 1971 1974 1977 1980 1983 1986 1989 1992 1995 1998 2001 2004 2007
I. World trade in Overview
 I. Table I.1 Growth in the volume of world merchandise exports and production by major product group, 1995-3 ( change) 1995-21 22 23 World merchandise exports 7. -.5 3. 4.5 Agricultural products 3.5 2.5
Global Construction Outlook: Laura Hanlon Product Manager, Global Construction Outlook May 21, 2009
 Global Construction Outlook: Short-term term Pain, Long-term Gain Laura Hanlon Product Manager, Global Construction Outlook May 21, 2009 What This Means for You The world is set to be hit this year with
Facts and figures on the CFP BASIC DATA ON THE COMMON FISHERIES POLICY
 Facts and figures on the CFP BASIC DATA ON THE COMMON FISHERIES POLICY EDITION 2008 Statistics provided by Eurostat. Data on fleet, jobs and Community aid provided by the Directorate-General for Maritime
FAO Global Capture Production database updated to 2015 Summary information Fisheries and Aquaculture Department
 FAO Global Capture Production database updated to Summary information Fisheries and Aquaculture Department Table 1. World capture production in and million million Inland capture 11.3 11.5 1.1% Marine
Change, Challenges and Opportunities for Wild Fisheries
 Change, Challenges and Opportunities for Wild Fisheries Gunnar Knapp Professor of Economics University of Alaska Anchorage September 2002 This is a slightly modified version of a presentation which I gave
FISH TRADE AND CONSUMER TRENDS IN THE EU
 FISH TRADE AND CONSUMER TRENDS IN THE EU Ekaterina Tribilustova Eurofish International Organisation 12 th International Production and Scientific Conference on Aquaculture 24-25 November 216, Vukovar,
FAO Global Capture Production database updated to 2012 Summary information
 FAO Global Capture Production database updated to 2012 Summary information Table 1. World capture production in 2011 and 2012 2011 2012 million million Inland capture 11.1 11.6 4.5% Marine capture (excluding
We will be the global leader in providing innovative and sustainable nutritional solutions that best support the performance of fish and shrimp.
 We feed millions We will be the global leader in providing innovative and sustainable nutritional solutions that best support the performance of fish and shrimp. Nutritional solutions Active Nutrition
Fishmeal Production ,000 tonnes
 Fishmeal and fish oil production and its role in sustainable aquaculture 1 Dr Andrew Jackson Technical Director International Fishmeal & Fish Oil Organisation February 2009 Refuting the myths: No 1 Fishmeal
KINGDOM OF CAMBODIA NATION RELIGION KING 3
 KINGDOM OF CAMBODIA NATION RELIGION KING 3 TOURISM STATISTICS REPORT February 2018 MINISTRY OF TOURISM Statistics and Tourism Information Department No. A3, Street 169, Sangkat Veal Vong, Khan 7 Makara,
Reflections and Current Processes: Whole Fish Utilization in the Tilapia Industry in Chinese Taipei
 APEC Seminar on Strengthening Public-Private Partnership to Reduce Food Losses in the Supply Chain of Fishery and Livestock, Sept. 27, 2015 Reflections and Current Processes: Whole Fish Utilization in
THE WORLD COMPETITIVENESS SCOREBOARD 2011
 THE WORLD COMPETITIVENESS SCOREBOARD 2011 98.557 94.063 92.588 92.011 90.782 90.219 89.259 87.824 86.475 86.418 86.313 85.707 84.380 84.120 81.629 81.619 81.100 80.278 79.799 78.499 77.599 77.101 76.827
SQUID, OCTOPUS, HERRING & MACKEREL PANEL
 SQUID, OCTOPUS, HERRING & MACKEREL PANEL January 19, 2016 Miami, FL THE SQUID, OCTOPUS, HERRING & MACKEREL PANEL Ruth Levy Jim Kenny Mike Daniels Ferran Pauner Egil Sundheim Brady Schofield 2 OVERVIEW
Traits of a Global Market for Advanced Human Capital How can the Global Demand for Post-secondary Education be met...
 Traits of a Global Market for Advanced Human Capital How can the Global Demand for Post-secondary Education be met... Washington D.C. May 23, 2002 .why are we here? Economic and social development are
January Icelandic Seafood Market Report
 January 2018 Icelandic Seafood Market Report Publisher: Íslandsbanki Research: greining@islandsbanki.is Elvar Orri Hreinsson, + 354 440 4747 Albert Freyr Eiríksson +354 440 4638 Issue date: 22 January
UK Trade Statistics 2017
 Value ( million) Rate of Exchange (USD against GBP) ORNAMENTAL AQUATIC TRADE ASSOCIATION LTD. "The Voice of the Ornamental Fish Industry" 1 st Floor Office Suite, Wessex House 4 Station Road, Westbury,
Global aquaculture - the challenges of blue growth
 Global aquaculture - the challenges of blue growth Ragnar Tveterås Gothenburg, 14. April 2015 Egyptian fish farmer A fascina?ng sector with great diversity: Fish farmers A fascina?ng sector with great
Aquaculture in Emerging Markets
 Aquaculture in Emerging Markets Dr. Arjen Roem Frankfurt - November 11th 2014 Trouw Nutrition Hifeed Outline Skretting global leader Aquaculture trends Emerging markets - Vietnam - Egypt - Nigeria Seafood
CZECH REPUBLIC IN THE WORLD AND IN THE EU (2015, source: FAO and Eurostat)
") CZECH REPUBLIC IN THE WORLD AND IN THE EU (2015, source: FAO and Eurostat) The Czech Republic is a landlocked country with no marine fisheries, while it is the 11 th largest producer of aquaculture products.
CZECH REPUBLIC IN THE WORLD AND IN THE EU (2015, source: FAO and Eurostat) The Czech Republic is a landlocked country with no marine fisheries, while it is the 11 th largest producer of aquaculture products.
UK Trade Statistics 2016
 Value ( million) Rate of Exchange (USD against GBP) ORNAMENTAL AQUATIC TRADE ASSOCIATION LTD. "The Voice of the Ornamental Fish Industry" 1 st Floor Office Suite, Wessex House 4 Station Road, Westbury,
Sector Trend Analysis Fish and Seafood Trends In China
 MARKET ACCESS SECRETARIAT Global Analysis Report Sector Trend Analysis Fish and Seafood Trends In China March 2017 REPORT CONTENT SUMMARY This report looks to highlight the fish and seafood imports into
Agricultural Trade Office The U.S. Embassy, Seoul
 Agricultural Trade Office The U.S. Embassy, Seoul www.atoseoul.com Data Source: Global Trade Atlas (www.gtis.com), CIF Value Basis, This presentation tracks Korea s imports of agricultural products on
UK Seafood Value Chain 2017 Provisional
 UK Seafood Value Chain 2017 Provisional Sources: Nielsen ScanTrack GB Total Coverage including Discounters and Northern Ireland including Musgraves 30.12.17, Nielsen HomeScan GB 30.12.17, The NPD Group/CREST
Session 4. Growth. The World Economy Share of Global GDP Year 2011 (PPP)
") Session 4. Growth Stylized Facts on Standards of Living across Countries Characterizing Growth over 1 Years: The US Economy Growth Dynamics of the G7 Countries and the OECD Economies Characterizing Growth
Session 4. Growth Stylized Facts on Standards of Living across Countries Characterizing Growth over 1 Years: The US Economy Growth Dynamics of the G7 Countries and the OECD Economies Characterizing Growth
CMMI Maturity Profile Report. 30 June 2017
 CMMI Maturity Profile Report 30 June 2017 Executive Summary Appraisals increased 14% 1 Jan 30 Jun 17 Companies who reappraise continue to increase, currently at 74% 10% of reported appraisals are high
Prepared by: McDowell Group, Inc. Andy Wink CAP Meeting
 Prepared by: McDowell Group, Inc. Andy Wink CAP Meeting 7.28.15 Alaska Seafood Overview Fishery & Market Update Key Issues Ketchikan Seafood Industry Who and What is Alaska Seafood? About 60,000 fishermen,
Status and futures in the fishmeal industry
 Status and futures in the fishmeal industry By Gunn Strandheim Irish Pelagic Seminar Killybegs, Ireland 11th of November - 211 Global fishmeal production Subject. Resource situation in the fishmeal industry
BLUE GROWTH AQUACULTURE IN TURKEY: THE BEST MODEL FOR THE BLACKSEA REGION
 BLUE GROWTH AQUACULTURE IN TURKEY: THE BEST MODEL FOR THE BLACKSEA REGION Hayri DENİZ (Ph.D.) hayrideniz@hotmail.com Muğla Fish Farmers Association & KILIÇ Seafood Company International Conference on Fisheries
Fishery. Fishing vessels (Dept. of Finance)
") Fishery Fishing vessels (Dept. of Finance) The Newfoundland and Labrador fishery recorded a difficult year in 29 due to low market prices, continued pressure from low-cost producers, and an appreciating
Fishery Fishing vessels (Dept. of Finance) The Newfoundland and Labrador fishery recorded a difficult year in 29 due to low market prices, continued pressure from low-cost producers, and an appreciating
Global Economic Indicators: Global Growth Barometer
 Global Economic Indicators: Global Growth Barometer May 9, 2018 Dr. Edward Yardeni 516-972-7683 eyardeni@ Debbie Johnson 4-664-1333 djohnson@ Mali Quintana 4-664-1333 aquintana@ Please visit our sites
INTERNATIONAL STUDENT STATISTICAL SUMMARY Spring 2017 (Final)
") INTERNATIONAL STUDENT STATISTICAL SUMMARY Spring 2017 (Final) Prepared By: Mr. Jay Ward, Associate Director Office of International Programs San Francisco State University Non-Matriculated SP 17 SP 16
INTERNATIONAL STUDENT STATISTICAL SUMMARY Spring 2017 (Final) Prepared By: Mr. Jay Ward, Associate Director Office of International Programs San Francisco State University Non-Matriculated SP 17 SP 16
The Relationship of Freshwater Aquaculture Production to Renewable Freshwater Resources
 The Relationship of Freshwater Aquaculture Production to Renewable Freshwater Resources Claude E. Boyd Department of Fisheries and Allied Aquacultures Auburn University, Alabama USA Current and projected
GERMANY IN THE WORLD AND IN THE EU (2015, source: FAO and Eurostat) FISHING FLEET (2015, source: JRC and Annual Economic Report)
 FISHING FLEET (2015, source: JRC and Annual Economic Report)") GERMANY IN THE WORLD AND IN THE EU (2015, source: FAO and Eurostat) Germany is the EU s 6th largest producer of fisheries and 10th largest of aquaculture products. (1000 tonnes) World EU-28 Germany % World
GERMANY IN THE WORLD AND IN THE EU (2015, source: FAO and Eurostat) Germany is the EU s 6th largest producer of fisheries and 10th largest of aquaculture products. (1000 tonnes) World EU-28 Germany % World
Agricultural Trade Office The U.S. Embassy, Seoul
 Agricultural Trade Office The U.S. Embassy, Seoul www.atoseoul.com Data Source: Global Trade Atlas (www.gtis.com), CIF Value Basis, This presentation tracks Korea s imports of agricultural products on
Contents. Norwegian seafood production consumption and export 2. Fisheries and catches 8. Aquaculture 22. Research and innovation 30
 7 8 9 10 11 12 13 14 1 15 16 17 18 19 20 21 22 23 24 25 26 27 28 29 30 31 32 33 34 35 36 Facts about Fisheries and Aquaculture 2008 www.government.no Contents Norwegian seafood production consumption and
MALTA IN THE WORLD AND IN THE EU (2015, source: FAO and Eurostat) FISHING FLEET (2015, source: JRC and Annual Economic Report)
 FISHING FLEET (2015, source: JRC and Annual Economic Report)") MALTA IN THE WORLD AND IN THE EU (015, source: FAO and Eurostat) ranked low in the EU both for fisheries and for aquaculture production. (1000 tonnes) World EU- % World % EU- Catches 104.635 5.144 0,0%
MALTA IN THE WORLD AND IN THE EU (015, source: FAO and Eurostat) ranked low in the EU both for fisheries and for aquaculture production. (1000 tonnes) World EU- % World % EU- Catches 104.635 5.144 0,0%
Provide a brief introduction to the U.S. seafood industry
 Provide a brief introduction to the U.S. seafood industry Participants will gain a better understanding of the large variety of seafood products available. 3 Increase knowledge of the following: What is
AREA TOTALS OECD Composite Leading Indicators. OECD Total. OECD + Major 6 Non Member Countries. Major Five Asia. Major Seven.
 Reference series Composite leading indicators OECD Composite Leading Indicators AREA TOTALS 7-03- 19 OECD Total 19 OECD + Major 6 Non Member Countries 19 Major Seven 19 Major Five Asia 19 Euro area 19
IR-Pay Go Rates. There are three pricing groups for Pay Go rates for International Roaming as follows:
 IR-Pay Go Rates A. IR Pay Go Rate Summary There are three pricing groups for Pay Go rates for International Roaming as follows: Sr IR Pay Go Rate Group 1 Rs 2 2 2 2 Rs 10 10 10 3 Rs 50 600 25 Applicable
Inside the United Kingdom Seafood Trade
 International Markets Bureau MARKET INDICATOR REPORT JULY 2012 Inside the United Kingdom Seafood Trade Inside the United Kingdom Seafood Trade TRADE SUMMARY The United Kingdom (U.K.) is the eighth-largest
Some Facts About Output
 Some Facts About Output GNP as a Percentage of GDP in 2009 Country % Kuwait 110,38 United Kingdom 102 Japan 103,14 United States 99,24 China 100,87 Germany 101,41 Mexico 98,34 Poland 96,76 Ireland 81,19
Emerging Dominance of Aquaculture: The Future of the Seafood Market and Fisheries Management
 Emerging Dominance of Aquaculture: The Future of the Seafood Market and Fisheries Management James L. Anderson Department of Environmental and Natural Resource Economics University of Rhode Island Kingston,
State of Small pelagic Fish resources and its implications for Food Security and Nutrition
 State of Small pelagic Fish resources and its implications for Food Security and Nutrition Manuel Barange, Stefania Vannuccini, Yimin Ye, Malcolm Beveridge Food and Agriculture Organization of the UN,
IBSA Goalball World Rankings 31 December 2017 Men's Division
 IBSA Goalball World Rankings 31 December 2017 Men's Division Rank No v Oc t Se p Au g Ju l Team Region Score Goal Diff Results Gol p Gme Last Plyd Weight 1st 5 6 6 1 2 Brazil Americas 661.802 4.564 0.872
CASE STUDY CANNED TUNA IN SPAIN PRICE STRUCTURE IN THE SUPPLY CHAIN LAST UPDATE: JUNE Maritime Affairs and Fisheries
 CASE STUDY CANNED TUNA IN SPAIN PRICE STRUCTURE IN THE SUPPLY CHAIN LAST UPDATE: JUNE 2017 WWW.EUMOFA.EU Maritime Affairs and Fisheries Contents SUMMARY... 1 0. TASK REMINDER SCOPE AND CONTENT... 2 0.1
Aquaculture growth potential in Azerbaijan
 Aquaculture growth potential in Azerbaijan Policy brief for FAO TCP/AZE/372/C2 Assessment of state-owned fish farms for sustainable development of the aquaculture sector in Azerbaijan (prepared by Junning
June Deadline Analysis: Domicile
 June Deadline Analysis: Domicile Applicants by domicile at the 30 June deadline I.1.1 Applicants by domicile group Difference between cycle and 2017 cycle UK EU (excluding UK) Not EU All domiciles 10%
REQUEST FOR BIDS SEALED BIDS ARE REQUESTED FOR: 2018 SEAFOOD PURCHASES. Point Defiance Zoo & Aquarium 5400 N. Pearl St.
 REQUEST FOR BIDS SEALED BIDS ARE REQUESTED FOR: 2018 SEAFOOD PURCHASES by Point Defiance Zoo & Aquarium 5400 N. Pearl St. Tacoma, WA 98407 Seafood Bids will be received at the Point Defiance Zoo & Aquarium
Aquaculture of the Tilapias. Barry A. Costa-Pierce University of New England Biddeford, Maine USA
 Aquaculture of the Tilapias Barry A. Costa-Pierce University of New England Biddeford, Maine USA Dr. Ngege Social Ecology of Tilapia Aquaculture is Culture The common name tilapia is based on the name
Global Supply Conditions
 Species Calamari Global Supply Conditions Market Activity Loligo Chinensis. Catch volumes are down 25-30% this season, producers are not taking on any new business and are having dificulty finding raw
European Values Study & World Values Study - Participating Countries ( )
") GESIS Data Archive for the Social Sciences http://www.gesis.org/en/home/ ASEP/JD Data Archive http://www.jdsurvey.net/jds/jdsurvey.jsp European Values Study & World Values Study - Participating Countries
GESIS Data Archive for the Social Sciences http://www.gesis.org/en/home/ ASEP/JD Data Archive http://www.jdsurvey.net/jds/jdsurvey.jsp European Values Study & World Values Study - Participating Countries
Portuguese, English, and. Bulgarian, English, French, or
 Country Language Fiber Content Algeria Arabic Angola Portuguese, English, and French (optional) Optional Argentina Spanish Armenia Armenian Optional Australia English Austria German Bahrain Arabic or English
Full-Time Visa Enrolment by Countries
 Page 1 of 32 All Students Afghanistan Albania Algeria Andorra Antigua Argentina Armenia Australia Austria Azerbaidjan Bahamas Bahrain Bangladesh Barbados Belarus Belgium Belize Benin (Dahomey) Bermuda
Predicting the Markets: Chapter 12 Charts: Predicting Currencies
 Predicting the Markets: Chapter 12 Charts: October 5, 218 Dr. Edward Yardeni Chief Investment Strategist Mali Quintana Senior Economist info@yardenibook.com Please visit our sites at www. blog. thinking
SWEDEN IN THE WORLD AND IN THE EU (2015, source: FAO and Eurostat)
") SWEDEN IN THE WORLD AND IN THE EU (2015, source: FAO and Eurostat) Sweden is the EU s 8 th largest producers of fisheries and 15 th largest of aquaculture products. (1.000 tonnes) World EU-28 Sweden %
SWEDEN IN THE WORLD AND IN THE EU (2015, source: FAO and Eurostat) Sweden is the EU s 8 th largest producers of fisheries and 15 th largest of aquaculture products. (1.000 tonnes) World EU-28 Sweden %
Annex - tables. No.7/2016 MONTHLY HIGHLIGHTS
 Annex - tables No.7/2016 MONTHLY HIGHLIGHTS First sales 1.1. MONTHLY FIRST SALES IN 11 EU REPORTING MEMBER STATES AND NORWAY (volume in tonnes and value in million euro) BELGIUM 407 0,74 329 0,90 268 0,79
POLAND IN THE WORLD AND IN THE EU (2015, source: FAO and Eurostat)
") POLAND IN THE WORLD AND IN THE EU (2015, source: FAO and Eurostat) Poland is the EU s 10th largest producer of fisheries and 9th largest of aquaculture products. (1.000 tonnes) World EU-28 Poland % World
POLAND IN THE WORLD AND IN THE EU (2015, source: FAO and Eurostat) Poland is the EU s 10th largest producer of fisheries and 9th largest of aquaculture products. (1.000 tonnes) World EU-28 Poland % World
Fishery Products EU Fishery Marketing Report 2008
 GAIN Report Global Agriculture Information Network Template Version 2.09 Required Report - public distribution NL8009 Netherlands Date: 5/6/2008 GAIN Report Number: NL8009 Fishery Products EU Fishery Marketing
January Deadline Analysis: Domicile
 January Deadline Analysis: Domicile Applicants by domicile at the 15 January deadline D.1.1 Applicants by domicile group UK EU (excluding UK) Not EU All domiciles 20% 10% -0% -10% -20% -30% -40% -50% 2009
Global growth forecasts Key countries/regions,
 Global growth forecasts Key countries/regions, 2014-2018 Percent 7 6 5 4 3 2 1 0 Developing Asia Sub-Saharan Africa Middle East and North Africa Latin America and the Caribbean United States Euro area
Contents. Norwegian seafood production consumption and export 2. Fisheries and catches 8. Aquaculture 22. Research and innovation 30
 Facts about Fisheries and Aquaculture 2009 www.government.no Contents Norwegian seafood production consumption and export 2 Fisheries and catches 8 Aquaculture 22 Research and innovation 30 Norwegian seafood
New rules, new opportunities: a potential for growth
 #TV year New rules, new opportunities: a potential for growth June 19th, 2015 Jacques Balducci Eurodata TV Worldwide Deputy Sales Director Worldwide TV viewing remains strong World daily viewing time Average
TILAPIA 2015 KUALA LUMPUR VIETNAM TILAPIA 2015 : ACCELERATING START
 TILAPIA 2015 KUALA LUMPUR VIETNAM TILAPIA 2015 : ACCELERATING START Dr. Nguyen Huu Dzung Vice President Vietnam Association of Seafood Exporters and Producers (VASEP) Kuala Lumpur April 2-4, 2015 Vietnam
2019 MEDIA KIT CONNECTING YOU TO FISH HATCHERY MANAGERS AND PROFESSIONALS WORLDWIDE. NEW 6M RAS AT BIG TREE CREEK
 Southern Advantage: Dunkeld has established itself p.7 Pompano: Bred in Indian RAS p.6 hatcheryinternational.com Norway: Investment to allow for more research into RAS p.5 February 2018 NEW 6M RAS AT BIG
Fisheries and Aquaculture in Croatia
 Fisheries and Aquaculture in Croatia The World Trade Organization (WTO) and fisheries St. Petersburg, 29 31 October 2013 CROATIA Ministry of Agriculture Directorate of Fisheries Božena Vidović, bozena.vidovic@mps.hr
USA: World s Largest Tilapia Market
 USA: World s Largest Tilapia Market Kevin Fitzsimmons, Ph.D. University of Arizona, Professor of Environmental Science World Aquaculture Society, Past-President Aquaculture without Frontiers, Past-Chairman
Facts and figures on the Common. Fisheries Policy. Basic statistical data 2014 EDITION. Fisheries ISSN
 ISSN 1830-9119 Facts and figures on the Common Basic statistical data 2014 EDITION Fisheries Policy Fisheries Member States codes used in this publication Text completed in February 2014. For chapter 5,
Aquaculture, Fisheries and the
 Aquaculture, Fisheries and the Environment Frank Asche NAAFE, 2011 The Economics of Conflict and Co-existence in an Increasingly Crowded Ocean" We like to think of fishing as traditional and romantic,
SUSTAINABILITY CRITERIA FOR FISHERIES SUBSIDIES: THE LATIN AMERICAN CONTEXT
 SUSTAINABILITY CRITERIA FOR FISHERIES SUBSIDIES: THE LATIN AMERICAN CONTEXT 29-30 July 2009, Guayaquil, Ecuador The Sunken Billions Kieran Kelleher Fisheries Team Leader The World Bank The Economic Justification
PAN Share price Revenues
 PAN Share price Revenues 7000 90,00 6000 5000 4000 80,00 70,00 60,00 50,00 3000 2000 1000 40,00 30,00 20,00 10,00 0 Dec 95 Dec 96 Dec 97 Dec 98 Dec 99 Dec 00 0,00 Pan Fish Growth Aquaculture has grown
Consumers perception of aquaculture products OECD Paris 16 April 2010
 Consumers perception of aquaculture products OECD Paris 16 April 2010 Aquaculture products: consumers perception SEAFOODplus EU-FP6 integrated project 2004-2008 CONSENSUS EU-FP6 coordination action 2006-2008
Urbanization and sustainable development David Satterthwaite, IIED
 Urbanization and sustainable development David Satterthwaite, IIED How can urbanization be a problem if All rich nations are highly urbanized; all the poorest nations predominantly rural All the most successful
Russian seafood embargo What s next?
 Russian seafood embargo What s next? Introduction of speakers Historical update Rounds of sanctions and scope of the embargo What impacts for Russia and US+EU trade partners Scenarii for the future? Q&R
AQUACULTURE STATUS OF VIETNAM Han Mai Huong, Cairo, November 2011
 AQUACULTURE STATUS OF VIETNAM Han Mai Huong, Cairo, November 2011 VIETNAM Mainland Territory: 331,211.6 sq. km. Lying on the eastern part of the Indochinese peninsula, Vietnam is a strip of land shaped
ISSN Facts and figures on the common. fisheries policy. Basic statistical data 2018 EDITION. Fisheries
 ISSN 1977-3609 Facts and figures on the common fisheries policy Basic statistical data 2018 EDITION Fisheries Contents Printed by Imprimerie Centrale in Luxembourg. Manuscript completed in February 2018
Tuna (2017 Update) Market Insight Factsheet. January 2018
 Market Insight Factsheet. January 2018") Market Insight Factsheet Tuna (217 Update) January 218 This factsheet provides a summary of the UK s value chain performance for tuna in 216. It is intended to inform stakeholders of the UK seafood industry
Market Insight Factsheet Tuna (217 Update) January 218 This factsheet provides a summary of the UK s value chain performance for tuna in 216. It is intended to inform stakeholders of the UK seafood industry
Predicting the Markets: Chapter 15 Charts: Predicting Currencies
 Predicting the Markets: Chapter 15 Charts: March 3, 217 Dr. Edward Yardeni 516-972-7683 eyardeni@ Mali Quintana 48-664-1333 aquintana@ Please visit our sites at www. blog. thinking outside the box Table
MONTHLY HIGHLIGHTS. June Imports Exports
 June 2013 ISSN 2314-9671 MONTHLY HIGHLIGHTS CONTENTS First sales in the EU Imports Exports Global Supply Price structure: cod in Lithuania Macroeconomic context www.ec.europa.eu/fisheries/ market-observatory
Strategy for production and marketing of atlantic salmon and a comparison with the sea bass and sea bream industry
 Strategy for production and marketing of atlantic salmon and a comparison with the sea bass and sea bream industry By: Bjørn Myrseth Vitamar A.S. E-mail: bjorn.myrseth@vitamar.no Telephone +4790554963
Inside Germany Seafood Trade
 International Markets Bureau MARKET INDICATOR REPORT AUGUST 2012 Inside Germany Seafood Trade Inside Germany Seafood Trade TRADE SUMMARY Fish and seafood in Germany is an expanding market that relies heavily
Monthly Highlights No. 2 / 2019
 Monthly Highlights No. 2 / 2019 In this issue In ember 2018, first sales value and volume grew in Italy, Lithuania, Portugal, Sweden, and the UK over ember 2017. In the same period, they dropped in Belgium,
SLADE GORTON & CO SEAFOOD MARKET REPORT June 2014
 **June Feature** ICYBAY Baby Clam Meat ICYBAY meat is versatile, mild flavored and medium texture with excellent plate coverage. ICYBAY clam meat is all natural with no hormones, no antibiotics and no
MONTHLY HIGHLIGHTS CONTENTS
 p ISSN 2314-9671 No.4/2014 MONTHLY HIGHLIGHTS CONTENTS First sales in Europe: Coldwater shrimp and herring in Denmark Norway lobster and haddock in Sweden EU Imports Exports in 2013 Global Supply Case