Lake Ontario Fish Communities and Fisheries: 2017 Annual Report of the Lake Ontario Management Unit
|
|
|
- Gwenda Lawrence
- 5 years ago
- Views:
Transcription

1 Lake Ontario Fish Communities and Fisheries: 2017 Annual Report of the Lake Ontario Management Unit
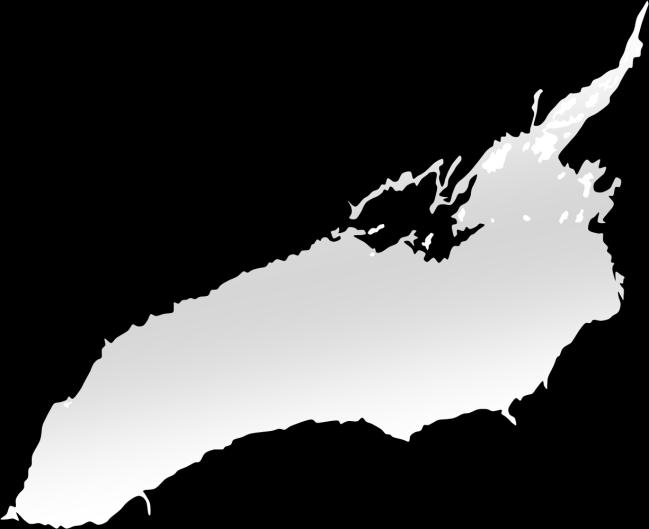
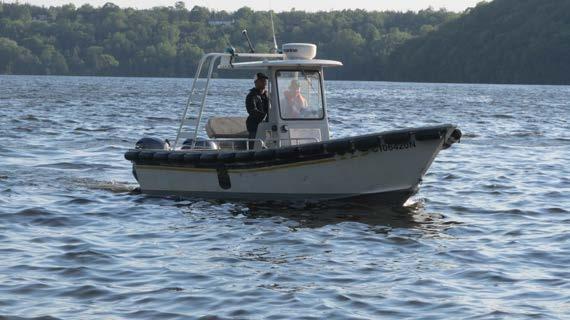
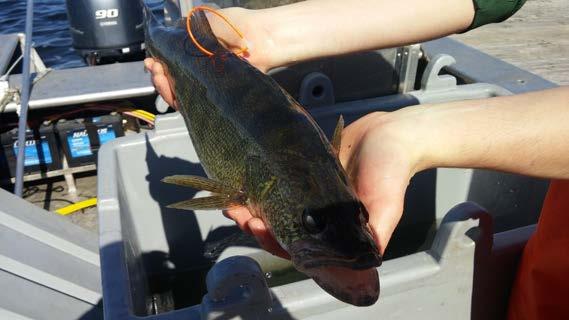
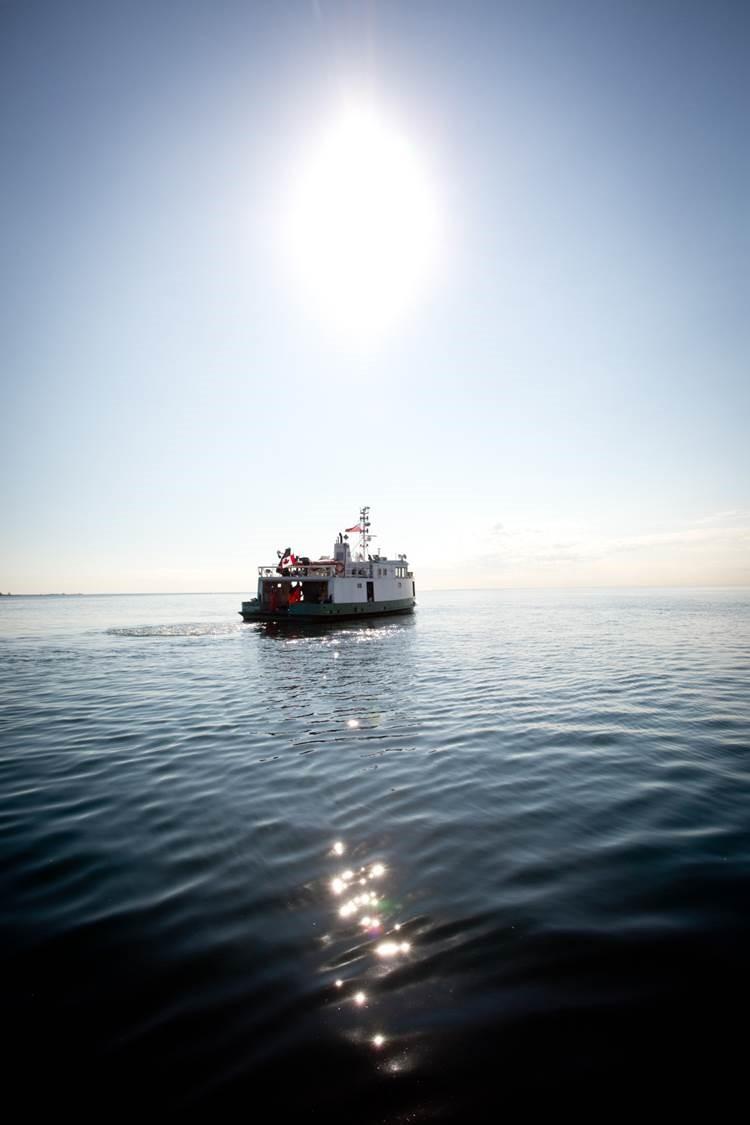
2 Cover Photos: (Left) MNRF s Ontario Explorer on Lake Ontario (Right top) Walleye equipped with acoustic telemetry transmitter and external tag, April 13, 2017 (Right bottom) LOMU field crew conducting Bay of Quinte angler survey, June 12, 2017
3 LAKE ONTARIO FISH COMMUNITIES AND FISHERIES: 2017 ANNUAL REPORT OF THE LAKE ONTARIO MANAGEMENT UNIT Prepared for the Great Lakes Fishery Commission Lower Lake Committees Meetings MARKHAM, ON, CA March 27-29, , Queen s Printer for Ontario Printed in Picton, Ontario, Canada March 2018 Report ISSN Please cite this report as follows: Ontario Ministry of Natural Resources and Forestry Lake Ontario Fish Communities and Fisheries: 2017Annual Report of the Lake Ontario Management Unit. Ontario Ministry of Natural Resources and Forestry, Picton, Ontario, Canada. This report is available online at:
4
5 TABLE OF CONTENTS Foreword... v 1. Index Fishing Projects 1.1 Ganaraska Fishway Rainbow Trout Assessment Lake Ontario and Bay of Quinte Fish Community Index Gill Netting Lake Ontario and Bay of Quinte Fish Community Index Trawling Lake Ontario Nearshore Community Index Netting Upper Bay of Quinte Boat Electrofishing Lake Ontario Summer Pelagic Prey Fish Survey St. Lawrence River Fish Community Index Netting Thousand Islands Credit River Chinook Salmon Spawning Index Juvenile Chinook Salmon Assessment Lake Ontario Spring Prey Fish Trawling Lake Ontario Fall Benthic Prey Fish Trawling Ganaraska River Fish Counter Recreational Fishery 2.1 Fisheries Management Zone 20 Council (FMZ20) / Volunteer Angling Clubs Bay of Quinte Open-water Angling Survey Bay of Quinte Volunteer Walleye Angler Diary Program Salmon and Trout Tournaments Commercial Fishery 3.1 Lake Ontario and St. Lawrence River Commercial Fishing Liaison Committee Quota and Harvest Summary Lake Whitefish Commercial Catch Sampling Cisco Commercial Catch Sampling Age and Growth Summary Contaminant Monitoring Stocking Program 6.1 Stocking Summary Chinook Salmon Net Pen Imprinting Project Stock Status 7.1 Chinook Salmon Rainbow Trout Lake Whitefish Walleye Yellow Perch Lake Ontario Prey Fish Species Rehabilitation 8.1 Introduction Atlantic Salmon Restoration
6 8.3 American Eel Restoration Deepwater Cisco Restoration Lake Trout Restoration Lake Sturgeon Research Activities 9.1 Station 81: long-term monitoring at the base of Lake Ontario s food web Movement and habitat use of a reintroduced fish species: Bloater (Coregonus hoyi) in Lake Ontario Using acoustic telemetry to investigate smolt survival and adult salmonid spatial habitat use with a focus on Atlantic Salmon Combining traditional ecological knowledge with cutting edge technology to inform Lake Trout restoration in Lake Ontario Post-surgical performance of acoustically tagged salmonids Vulnerability assessment of aquatic invasive species Selecting optimal models for predicting habitat suitability of invasive freshwater fishes Community level response to Zequanox molluscicide - a biocontrol for invasive mussels Migration and Spatial Ecology of Bay of Quinte-Eastern Lake Ontario Walleye Partnerships 10.1 Walleye Spawn Collection Environmental Indicators 11.1 Water Temperature Wind Water Clarity Tributary Water Flow Staff Operational Field and Lab Schedule Publications
7 v Lake Ontario Fish Communities and Fisheries: 2017 Annual Report of the Lake Ontario Management Unit Foreword The Lake Ontario Management Unit (LOMU) and the Lake Ontario research staff from the Aquatic Research and Monitoring Section are pleased to provide the 2017 Annual Report of monitoring, assessment, research and management activities. Lake Ontario fisheries are managed by the Lake Ontario Committee, consisting of the Ontario Ministry of Natural Resources and Forestry (MNRF) in partnership with New York State, under the auspices of the Great Lakes Fishery Commission. The Lake Ontario Fish Community Objectives (2013) provide bi-national fisheries management direction to protect and restore native species and to maintain sustainable fisheries. Our many partners include: New York State Department of Environmental Conservation (NYSDEC), Fisheries and Oceans Canada (DFO), the U.S. Fish and Wildlife Service (USFWS), U.S. Geological Survey (USGS) and many other Ontario provincial ministries and conservation authorities and U.S. state and federal agencies, universities and non-government partners. LOMU continues to deliver a comprehensive long-term base monitoring program while also incorporating new technologies to improve our understanding of the fish community. New in the 2017 Report are results from the first full year of assessment of migratory salmonids in the Ganaraska River using the Vaki Riverwatcher video fish counter. Also, Lake Sturgeon, American Eel, Walleye, Lake Whitefish and bass were implanted with acoustic telemetry tags to learn more about their movements and habitat use. We would like to express our sincere appreciation to the many partners and volunteers who contributed to the successful delivery of LOMU initiatives. Special thanks to the Ontario Federation of Anglers and Hunters and the many other partners committed to the Lake Ontario Atlantic Salmon restoration program. LOMU gratefully acknowledges the important contribution of the Lake Ontario Commercial Fishery Liaison Committee, the Fisheries Management Zone 20 Council (FMZ20) members, the Ringwood hatchery partnership with the Metro East Anglers, Chinook Net Pen Committee, Muskies Canada, the Ganaraska River Fishway Volunteers, Napanee and District Rod & Gun Club, and the participants in the angler diary and assessment programs. Our team of skilled and committed staff and partners delivered an exemplary program that provides long-term benefits to the citizens of Ontario. We are pleased to share the important information about the activities and findings of the Lake Ontario Management Unit from Andy Todd Lake Ontario Manager For more detailed information or copies of this report please contact: Lake Ontario Management Unit Ontario Ministry of Natural Resources and Forestry R.R. #4, 41 Hatchery Lane Picton, ON K0K 2T0 CAN Telephone: (613) FAX: (613) This Annual Report is available online at: lakecom/loc/mgmt_unit/index.html
8 vi
9 1 1. Index Fishing Projects 1.1 Ganaraska Fishway Rainbow Trout Assessment M.J. Yuille, Lake Ontario Management Unit The number of Rainbow Trout running-up the Ganaraska River during spring to spawn has been estimated at the fishway on Corbett Dam, Port Hope, ON since Prior to 1987, the Rainbow Trout counts at the fishway were based completely on hand lifts and visual counts. Between 1987 and 2016, fish counts were made with a Pulsar Model 550 electronic fish counter. Based on visual counts the Pulsar counter was about 85.5% efficient, and the complete size of the run was estimated accordingly. In years where no observations were made, the run was estimated with virtual population analysis. The counter is usually operated from mid to late-march until early May. In 2017, the Pulsar fish counter was installed on March 26th, 2017 and ran until March 28th, 2017, when the new Riverwatcher fish counting system was installed. The Riverwatcher actively counted and recorded fish from March 28th to May 2nd, 2017 when the Rainbow Trout spawning run ended. The new Riverwatcher fish counting system was the primary counter used for the majority of this year s spring Rainbow Trout spawning run on the Ganaraska. The system was brought online March 28th and continued to monitor fish activity in the Ganaraska fishway until November 8th, 2017 (Section 1.12). In 2017, 6,952 Rainbow Trout were observed passing through the Ganaraska fishway (Table 1.1.1). This is below the average for the previous 10 years (7,103 fish on average from 2007 to 2016). From 2009 to 2013, the Rainbow Trout run in the Ganaraska River increased; since this time it has declined (Fig ). The total estimated run size from 2017 increased 39% from 2016 and is 43% below the peak in 2013 (Table and Fig ). The 2017 spawning run estimate marks the first spawning run increase on the Ganaraska River since the 2013 peak. The fishway was most active mid-april, which is comparable to previous runs (Fig ). In just four days (April 10th April 13th, 2017), 51% of the Rainbow Trout counted passed through the fish counter (Fig ). Rainbow Trout were measured and weighed during the spawning run in most years since Rainbow Trout body condition was determined as the estimated weight of a 635 mm (25 inch) total length fish. In 2017, the condition of male (2,842 g) and female (2,981 g) Rainbow Trout were slightly higher than 2016 values and comparable to the previous 10- year average (Fig and Table 1.1.2). The proportion of Rainbow Trout with Lamprey marks in the Ganaraska River has been reported since TABLE Observed count and estimated run of Rainbow Trout moving upstream at the Ganaraska River fishway at Port Hope, Ontario during spring, Estimates for 1980, 1982, 1984, 1986, 1992, and 2002 were interpolated from adjacent years with virtual population analysis. Estimate for 2017 utilized the Riverwatcher fish counting system. Year Observed Estimated ,281 1, ,237 2, ,724 2, ,004 4, , ,306 7, , ,907 7, , ,188 14, , ,603 13, ,983 15, ,121 18, ,184 14, ,366 13, , ,233 8, ,249 7, ,859 9, ,084 9, ,696 8, ,808 5, ,706 6, ,382 4, ,365 6, , ,897 4, ,452 5, ,417 5, ,171 5, ,641 4, ,963 4, ,290 4, ,705 6, ,313 9, ,256 8, ,761 12, ,218 9, ,890 6, ,225 4, , Section 1. Index Fishing Projects
10 2 Number of fish Estimated Observed FIG Estimated and observed run of Rainbow Trout at the Ganaraska River fishway at Port Hope, Ontario during spring Daily Count 1200 (a) Rainbow Trout Counted (b) Mar-15 Apr-01 FIG Daily count (a) and cumulative count (b) of Rainbow Trout passing through the fish counter in the Ganaraska River fishway at Port Hope, Ontario during spring over the past three years. Apr-15 Date May-01 May-15 Section 1. Index Fishing Projects
11 3 Weight (kg) Female Male FIG Body condition (estimated weight at 635 mm total length) of Rainbow Trout at the Ganaraska River fishway at Port Hope, Ontario during spring Open and closed circles represent male and female Rainbow Trout (respectively) TABLE Body condition (estimated weight at 635 mm total length) of Rainbow Trout at the Ganaraska River fishway at Port Hope, Ontario during spring, Male Female Year Weight Sample Weight Sample (g) Size (g) Size , , , , , , , , , , , , , , , , , , , , , , , , , , , , , , , , , , , , , , , , , , , , , , , , , , , , , , , , , , , , , , , , , , , , Average 2,979 3, In 2017, 27% of fish had Lamprey marks (wound or scar), which is unchanged from 2016 (Fig ). Lamprey wounds on Ganaraska River Rainbow Trout in 2017 remain below the previous 10 year average (35%; Table 1.1.3). TABLE Lamprey marks on Rainbow Trout in spring , at the Ganaraska River fishway, at Port Hope, Ontario. Since 1990, A1 and A2 marks were called wounds and the remainder of marks were called scars to fit with historical classification *. Scars and Wounds / fish Year Wounds/ Scars/ Marks/ % with % with % with Sample fish fish fish wounds scars marks Size Scars Wounds FIG Trend in lamprey marks on Rainbow Trout during the spring , at the Ganaraska River fishway at Port Hope, Ontario. Since 1990, A1 and A2 marks (King and Edsall 1979) were called wounds and the remainder of marks were called scars to fit with historical classification. * King, E.L. Jr. and Edsall, T.A Illustrated field guide for the classification of sea lamprey attack marks on great lakes lake trout. GLFC Special Publication Section 1. Index Fishing Projects
12 4 1.2 Lake Ontario and Bay of Quinte Fish Community Index Gill Netting J. A. Hoyle, Lake Ontario Management Unit The Lake Ontario and Bay of Quinte annual gill netting program is used to monitor the abundance and biological characteristics of a diversity of warm, cool and cold-water fish species. Data from the program are used to help manage local commercial and recreational fisheries as well as for tracking long-term changes in the aquatic ecosystem. Gill net sampling areas are shown in Fig and the basic sampling design is summarized in Table Included in the design are fixed, single-depth sites and depthstratified sampling areas. In 2017, each site or area was visited from one to three times within specified time-frames, and with one to three gill net gangs set during each visit. The annual index gill netting field work occurs during the summer months. Summer was chosen based on an understanding of water temperature stability, fish movement/migration patterns, fish growth patterns, and logistical considerations. The time-frames for completion of field work varies among sampling sites/areas (Table 1.2.1). This increases the probability of encountering a wide-range of water temperatures across the depth ranges sampled, both seasonally and by geographic area. In 2017, the Bay of Quinte (Trenton, Belleville, Big Bay, Deseronto, and Hay Bay areas) was also sampled in late October/early November. Seasonal sampling at these Bay of Quinte sites will help better assess seasonal fish distribution and abundance patterns. Monofilament gill nets with standardized specifications are used (monofilament mesh replaced multifilament in 1992; only catches from 1992-present are tabulated below). Each gill net gang consists of a graded-series of ten monofilament gill net panels of mesh sizes from 38 mm (1½ in) to 152 mm (6 in) stretched mesh FIG Map of north eastern Lake Ontario. Shown are eastern Lake Ontario and Bay of Quinte fish community index gill netting sites. Section 1. Index Fishing Projects
13 5 TABLE Sampling design of the Lake Ontario fish community index gill netting program (Lake Ontario) including geographic and depth stratification, number of visits, number of replicate gill net gangs set during each visit (by gill net length), and the time-frame for completion of visits. Also shown is the year in which gill netting at a particular area/site was initiated and the number of prior years that netting has occurred. Region name Area Name (Area code) Design Site name Depth (m) Visits Replicates by net size feet 500 feet Site location (approx) Latitude (dec min) Longitude (dec min) Visits x Replicates Time-frame Northwestern Lake Ontario Port Credit (PC) Depth stratified area PC Jul 1-Jul Northwestern Lake Ontario Port Credit Depth stratified area PC Jul 1-Jul Northwestern Lake Ontario Port Credit Depth stratified area PC Jul 1-Jul Northwestern Lake Ontario Port Credit Depth stratified area PC Jul 1-Jul Northwestern Lake Ontario Port Credit Depth stratified area PC Jul 1-Jul Northwestern Lake Ontario Port Credit Depth stratified area PC Jul 1-Jul Northwestern Lake Ontario Port Credit Depth stratified area PC Jul 1-Jul Northwestern Lake Ontario Port Credit Depth stratified area Jul 1-Jul Northwestern Lake Ontario Port Credit Depth stratified area Jul 1-Jul Northwestern Lake Ontario Port Credit Depth stratified area Jul 1-Jul Northwestern Lake Ontario Port Credit Depth stratified area Jul 1-Jul Northeastern Lake Ontario Cobourg (CB) Depth stratified area CB Jul 1-Sep Northeastern Lake Ontario Cobourg Depth stratified area CB Jul 1-Sep Northeastern Lake Ontario Cobourg Depth stratified area CB Jul 1-Sep Northeastern Lake Ontario Cobourg Depth stratified area CB Jul 1-Sep Northeastern Lake Ontario Cobourg Depth stratified area CB Jul 1-Sep Northeastern Lake Ontario Cobourg Depth stratified area CB Jul 1-Jul Northeastern Lake Ontario Cobourg Depth stratified area CB Jul 1-Jul Northeastern Lake Ontario Cobourg Depth stratified area Jul 1-Jul Northeastern Lake Ontario Cobourg Depth stratified area Jul 1-Jul Northeastern Lake Ontario Cobourg Depth stratified area Jul 1-Jul Northeastern Lake Ontario Cobourg Depth stratified area Jul 1-Jul Northeastern Lake Ontario Brighton (BR) Depth stratified area BR Aug 1-Sep Northeastern Lake Ontario Brighton Depth stratified area BR Aug 1-Sep Northeastern Lake Ontario Brighton Depth stratified area BR Aug 1-Sep Northeastern Lake Ontario Brighton Depth stratified area BR Aug 1-Sep Northeastern Lake Ontario Brighton Depth stratified area BR Aug 1-Sep Northeastern Lake Ontario Middle Ground (MG) Fixed site MG Aug 1-Sep Northeastern Lake Ontario Wellington (WE) Depth stratified area WE Aug 1-Sep Northeastern Lake Ontario Wellington Depth stratified area WE Aug 1-Sep Northeastern Lake Ontario Wellington Depth stratified area WE Aug 1-Sep Northeastern Lake Ontario Wellington Depth stratified area WE Aug 1-Sep Northeastern Lake Ontario Wellington Depth stratified area WE Aug 1-Sep Northeastern Lake Ontario Rocky Point (RP) Depth stratified area RP Jul 21-Sep Northeastern Lake Ontario Rocky Point Depth stratified area RP Jul 21-Sep Northeastern Lake Ontario Rocky Point Depth stratified area RP Jul 21-Sep Northeastern Lake Ontario Rocky Point Depth stratified area RP Jul 21-Sep Northeastern Lake Ontario Rocky Point Depth stratified area RP Jul 21-Sep Northeastern Lake Ontario Rocky Point Depth stratified area Jul 1-Jul Northeastern Lake Ontario Rocky Point Depth stratified area Jul 1-Jul Northeastern Lake Ontario Rocky Point Depth stratified area Jul 1-Jul Northeastern Lake Ontario Rocky Point Depth stratified area Jul 1-Jul Northeastern Lake Ontario Rocky Point Depth stratified area Jul 1-Jul Northeastern Lake Ontario Rocky Point Depth stratified area Jul 1-Jul Kingston Basin (nearshore) Flatt Point (FP) Depth stratified area FP Jul 1-Jul Kingston Basin (nearshore) Flatt Point Depth stratified area FP Jul 1-Jul Kingston Basin (nearshore) Flatt Point Depth stratified area FP Jul 1-Jul Kingston Basin (nearshore) Flatt Point Depth stratified area FP Jul 1-Jul Kingston Basin (nearshore) Flatt Point Depth stratified area FP Jul 1-Jul Kingston Basin (nearshore) Grape Island (GI) Depth stratified area GI Jul 1-Jul Kingston Basin (nearshore) Grape Island Depth stratified area GI Jul 1-Jul Kingston Basin (nearshore) Grape Island Depth stratified area GI Jul 1-Jul Kingston Basin (nearshore) Grape Island Depth stratified area GI Jul 1-Jul Kingston Basin (nearshore) Grape Island Depth stratified area GI Jul 1-Jul Kingston Basin (nearshore) Melville Shoal (MS) Depth stratified area MS Jul 1-Jul Kingston Basin (nearshore) Melville Shoal Depth stratified area MS Jul 1-Jul Kingston Basin (nearshore) Melville Shoal Depth stratified area MS Jul 1-Jul Kingston Basin (nearshore) Melville Shoal Depth stratified area MS Jul 1-Jul Kingston Basin (nearshore) Melville Shoal Depth stratified area MS Jul 1-Jul Kinston Basin (offshore) Eastern Basin (EB) Fixed site EB Jun 20-Jul 17; Jul 18- Aug 14; Aug 15 Sep Kinston Basin (offshore) Eastern Basin (EB) Fixed site EB Kinston Basin (offshore) Eastern Basin (EB) Fixed site EB Kinston Basin (offshore) Eastern Basin (EB) Fixed site EB Kinston Basin (offshore) Eastern Basin (EB) Fixed site EB Kinston Basin (offshore) Eastern Basin (EB) Fixed site EB Start-up year Number years 4 Jun 20-Jul 17; Jul 18- Aug 14; Aug 15 Sep Jun 20-Jul 17; Jul 18- Aug 14; Aug 15 Sep Jun 20-Jul 17; Jul 18- Aug 14; Aug 15 Sep Jun 20-Jul 17; Jul 18- Aug 14; Aug 15 Sep Jun 20-Jul 17; Jul 18- Aug 14; Aug 15 Sep Section 1. Index Fishing Projects
14 6 TABLE (continued). Sampling design of the Lake Ontario fish community index gill netting program (Bay of Quinte) including geographic and depth stratification, number of visits, number of replicate gill net gangs set during each visit (by gill net length), and the timeframe for completion of visits. Also shown is the year in which gill netting at a particular area/site was initiated and the number of prior years that netting has occurred. Region name Area Name (Area code) Design Site name Depth (m) Visits Replicates by net size feet 500 feet Site location (approx) Latitude (dec min) Longitude (dec min) Visits x Replicates Time-frame Bay of Quinte Conway Depth stratified area CO Jul 21-Aug Bay of Quinte Conway Depth stratified area CO Jul 21-Aug Bay of Quinte Conway Depth stratified area CO Jul 21-Aug Bay of Quinte Conway Depth stratified area CO Jul 21-Aug Bay of Quinte Conway Depth stratified area CO Jul 21-Aug Start-up year Number years 4 Bay of Quinte Hay Bay (HB) 2 Depth stratified area HB Bay of Quinte Hay Bay Depth stratified area HB Bay of Quinte Deseronto (DE) Fixed site DE Bay of Quinte Big Bay (BB) Fixed site BB Bay of Quinte Belleville (BE) Fixed site BE Bay of Quinte Trenton (TR) Fixed site TR changed from a fixed site where the gillnet was set perpendicular to shore across contours to a depth stratified site with five depths in 1992 Jun 15-Jul 15 (1 visit); Jul 21-Aug 21 (2 visits); Oct 15-Nov 15 (1 visit) Jun 15-Jul 15 (1 visit); Jul 21-Aug 21 (2 visits); Oct 15-Nov 15 (1 visit) Jun 15-Jul 15 (1 visit); Jul 21-Aug 21 (1 visit); Oct 15-Nov 15 (1 visit) Jun 15-Jul 15 (1 visit); Jul 21-Aug 21 (2 visits); Oct 15-Nov 15 (1 visit) Jun 15-Jul 15 (1 visit); Jul 21-Aug 21 (1 visit); Oct 15-Nov 15 (1 visit) Jun 15-Jul 15 (1 visit); Jul 21-Aug 21 (1 visit); Oct 15-Nov 15 (1 visit) changed from a fixed site where the gillnet was set parallel and close to shore to a depth stratified area with two depths (sites) in two types of gillnet effort are used; both types consist of a graded series of mesh sizes attached in order by size from mm at 13 mm intervals; one type has 15 ft of 38 mm mesh and 50 ft of all nine other mesh sizes the second type has 50 ft of all mesh sizes 4 the basic sampling design of the program has been largely consistent since 1992; for years prior to 1992 consult field protocols and FISHNET project definitions for changes in sampling design. at 13 mm (½ in) intervals, arranged in sequence. However, a standard gill net gang may consist of one of two possible configurations. Either, all ten mesh sizes (panels) are 15.2 m (50 ft) in length (total gang length is m (500 ft)), or, the 38 mm (1½ in) mesh size (panel) is 4.6 m (15 ft) in length and the remaining mesh sizes are 15.2 m (50 ft) each in length (total gang length is m (465 ft)) (see Table 1.2.1). Note that use of the shorter 38 mm gill net panel is related to the processing time required to deal with large numbers of small fish (e.g., Alewife and Yellow Perch) caught in this small mesh size. Gill net gangs are connected in series (i.e., cork lines and lead lines attached), but are separated by a 15.2 m (50 ft) spacer to minimize "leading" of fish. The 152 mm (6 in) end of one gang is connected to the 38 mm (1 ½ in) gang of the adjoining gang. The entire gill net strap (all joined gangs) is set within 2.5 m of the site depth listed in Table Gill net set duration usually ranges from hr but can be up to three days for the deep-water Lake Ontario sites ( m) at Rocky Point, Cobourg and Port Credit. Catches were summed across the ten mesh sizes from 1½-6 inch. In the case where the 38 mm mesh size used was 4.6 m in length, the catch in this mesh was adjusted (i.e., multiplied by 15.2/4.6) prior to summing the ten mesh sizes. Therefore, all reported catches represent the total catch in a m (500 ft) gang of gill net. In 2017, 324 gill net samples were made from 19-Jun to 2-Nov. Thirty-two different species and over 37,000 individual fish were caught. About 82% of the observed catch was alewife (Table 1.2.2). Species-specific gill net catch summaries are shown by geographic area/ site in Tables Selected biological information is also presented below for Lake Whitefish, Cisco and Walleye. Lake Ontario Northeast (Brighton, Wellington and Rocky Point) and Kingston Basin (Melville Shoal, Grape Island and Flatt Point) Nearshore Areas (Tables inclusive) Six depth-stratified sampling areas (Melville Shoal, Grape Island, Flat Point, Rocky Point, Wellington and Brighton) that employ a common and balanced sampling design were used here to provide a broad picture of the warm, cool and cold-water fish community inhabiting the Section 1. Index Fishing Projects
15 7 TABLE Species-specific catch per gill net set in 2017 from June 19 to November 2. Standard catch is the observed catch expanded to represent the catch in a 50 ft panel length of 1 1/2 inch mesh size in cases where only 15 ft was used. A total of 324 gill nets were set and 32 species comprising 37,008 fish were caught. Species Observed catch Standard catch Mean weight (g) Sea Lamprey Longnose Gar ,552 Bowfin 1 1 1,982 Alewife 30,327 83, Gizzard Shad Chinook Salmon Rainbow Trout 2 2 1,805 Brown Trout 7 7 2,300 Lake Trout ,371 Lake Whitefish ,092 Cisco Rainbow Smelt Northern Pike ,201 White Sucker Silver Redhorse 5 5 1,225 Common Carp 3 3 7,959 Brown Bullhead Channel Catfish ,206 Burbot 4 4 2,463 White Perch 1,213 1, White Bass Morone sp Rock Bass Pumpkinseed Bluegill Smallmouth Bass Largemouth Bass Black Crappie Yellow Perch 2,363 6, Walleye ,588 Round Goby Freshwater Drum Deepwater Sculpin Lake Whitefish x Cisco 2 2 1,955 open-coastal waters out to about 30 m water depth in the eastern half of Lake Ontario. Results were summarized and presented graphically (Fig ) to illustrate abundance trends of the most abundant fish species. Many species showed peak abundance levels in the early 1990s followed by dramatic abundance decline. Alewife, the most common species caught, has occurred at very high abundance levels after 2008 until 2014 when abundance declined precipitously. Alewife abundance increased in 2015 and again in 2016, and remained stable in Yellow Perch abundance increased slightly in In 2014, Round Goby abundance declined after 2007, remained low in 2015, increased in 2016, and remained stable in Lake Trout abundance remained low in Walleye catch increased in Lake Whitefish remain at a very low abundance level. Rock Bass and Smallmouth Bass abundance increased in Chinook Salmon and Brown Trout abundance declined in Middle Ground (Table 1.2.9) Middle Ground represents one of our longest running gill netting locations. Nine species were caught at Middle Ground in Yellow Perch dominated the catch. Kingston Basin Deep Sites (EB02 and EB06; Tables and ) Two single-depth sites (EB02 and EB06) are used to monitor long-term trends in the deep water fish community the Kingston Basin. Results were summarized and presented graphically (Fig ) to illustrate abundance trends of the most abundant species (Alewife, Lake Trout, Lake Whitefish, Yellow Perch, Rainbow Smelt, Cisco, Chinook Salmon and Round Goby). Alewife catches were variable with high catches in some years: , 2010, 2012, 2016 and Lake Trout, Lake Whitefish, Rainbow Smelt, and Cisco abundance declined throughout the 1990s and remained low during the years that followed except that Cisco abundance increased markedly over the last three years. Chinook Salmon catches were relatively high in 2016 and Round Goby catch increased in Section 1. Index Fishing Projects
16 8 TABLE Species-specific catch per gillnet set at Brighton in Northeastern Lake Ontario, Annual catches are averages for 1-3 gillnet gangs set at each of 5 depths ( 7.5, 12.5, 17.5, 22.5 and 27.5 m) during each of 1-3 visits during summer. Mean catches for and time-periods are shown in bold. The total number of species caught and gillnets set each year are indicated mean mean Bowfin Alewife Gizzard Shad Coho Salmon Chinook Salmon Rainbow Trout Lake Trout Lake Whitefish Cisco (Lake Herring) Rainbow Smelt Northern Pike White Sucker Lake Chub Common Carp Channel Catfish American Eel Burbot White Perch Rock Bass Pumpkinseed Smallmouth Bass Yellow Perch Walleye Round Goby Freshwater Drum Number of species Brown Trout Round Whitefish Brown Bullhead Total catch Number of sets Section 1. Index Fishing Projects
17 9 TABLE Species-specific catch per gillnet set at Wellington in Northeastern Lake Ontario, Annual catches are averages for 1-3 gillnet gangs set at each of 5 depths ( 7.5, 12.5, 17.5, 22.5 and 27.5 m) during each of 1-3 visits during summer. Mean catches for and time-periods are shown in bold. The total number of species caught and gillnets set each year are indicated mean mean Alewife Gizzard Shad Chinook Salmon Rainbow Trout Lake Trout Lake Whitefish Cisco Rainbow Smelt Northern Pike White Sucker Lake Chub Common Carp Brown Bullhead Burbot White Perch Rock Bass Smallmouth Bass Yellow Perch Walleye Round Goby Freshwater Drum Total catch Number of species Brown Trout Round Whitefish Greater Redhorse Number of sets Section 1. Index Fishing Projects
18 10 TABLE Species-specific catch per gillnet set at Rocky Point (nearshore sites only) in Northeastern Lake Ontario, Annual catches are averages for 1-3 gillnet gangs set at each of 5 depths ( 7.5, 12.5, 17.5, 22.5 and 27.5 m) during each of 2-3 visits during summer. Mean catches for and time-periods are shown in bold. The total number of species caught and gillnets set each year are indicated mean mean Alewife Chinook Salmon Rainbow Trout Brown Trout Lake Trout Lake Whitefish Cisco Rainbow Smelt White Sucker Lake Chub Common Carp Brown Bullhead Channel Catfish Burbot White Perch Rock Bass Smallmouth Bass Yellow Perch Walleye Round Goby Freshwater Drum Total catch Number of species Atlantic Salmon Chub Stonecat Number of sets Section 1. Index Fishing Projects
19 11 TABLE Species-specific catch per gillnet set at Flatt Point in the Kingston Basin of Lake Ontario, Annual catches are averages for 1-3 gillnet gangs set at each of 5 depths ( 7.5, 12.5, 17.5, 22.5 and 27.5 m) during each of 2-3 visits during summer. Mean catches for and time-periods are shown in bold. The total number of species caught and gillnets set each year are indicated. mean mean Lake Sturgeon Alewife Chinook Salmon Rainbow trout Brown Trout Lake Trout Lake Whitefish Cisco (Lake Herring) Coregonus sp Rainbow Smelt Northern Pike White Sucker Brown Bullhead Stonecat Burbot White Perch Rock Bass Smallmouth Bass Yellow Perch Walleye Round Goby Freshwater Drum Total catch Number of species Number of sets Section 1. Index Fishing Projects
20 12 TABLE Species-specific catch per gillnet set at Grape Island in the Kingston Basin of Lake Ontario, Annual catches are averages for 1-3 gillnet gangs set at each of 5 depths ( 7.5, 12.5, 17.5, 22.5 and 27.5 m) during each of 2-3 visits during summer. Mean catches for and time-periods are shown in bold. The total number of species caught and gillnets set each year are indicated. mean mean Lake Sturgeon Alewife , , Chinook Salmon Brown Trout Lake Trout Lake Whitefish Cisco (Lake Herring) Rainbow Smelt Northern Pike White Sucker Silver Redhorse Brown Bullhead Channel Catfish Stonecat Burbot Threespine Stickleback White Perch Rock Bass Smallmouth Bass Yellow Perch Walleye Round Goby Freshwater Drum Total catch , , Number of species Number of sets Section 1. Index Fishing Projects
21 13 TABLE Species-specific catch per gillnet set at Melville Shoal in the Kingston Basin of Lake Ontario, Annual catches are averages for 1-3 gillnet gangs set at each of 5 depths ( 7.5, 12.5, 17.5, 22.5 and 27.5 m) during each of 2-3 visits during summer. Mean catches for and time-periods are shown in bold. The total number of species caught and gillnets set each year are indicated mean mean Lake Sturgeon Gizzard Shad Chinook Salmon Rainbow Trout Lake Trout Cisco Coregonus sp Rainbow Smelt Northern Pike White Sucker Greater Redhorse Moxostoma sp Common Carp Channel Catfish Stonecat Burbot White Perch Rock Bass Pumpkinseed Smallmouth Bass Yellow Perch Walleye Round Goby Freshwater Drum Total catch Number of species Alewife Brown Trout Lake Whitefish Number of sets Section 1. Index Fishing Projects
22 14 Catch per Gill Net Alewife Catch per Gill Net Yellow Perch Catch per Gill Net Round Goby Catch per Gill Net Lake Trout Walleye 4 Lake Whitefish Catch per Gill Net Catch per Gill Net Catch per Gill Net Rock Bass Catch per Gill Net Smallmouth Bass Chinook Salmon 0.8 Brown Trout Catch per Gill Net Catch per Gill Net FIG Abundance trends for the most common species caught in gill nets at six depth-stratified transects (nearshore out to 30 m) in northeastern Lake Ontario (Melville Shoal, Grape Island, Flatt Point, Rocky Point, Wellington and Brighton; see Fig ). Annual catch per gill net values are unweighted means. Dotted lines show 3-yr running averages (two years for first and last years graphed). Section 1. Index Fishing Projects
23 15 TABLE Species-specific catch per gill net set at Middle Ground in Northeastern Lake Ontario, (no sampling in 2012). Annual catches are averages for 2 gill net gangs set during each of 1-3 visits during summer. Mean catches for and time-periods are shown in bold. The total number of species caught and gill nets set each year are indicated mean mean Longnose Gar Alewife Gizzard Shad Lake Trout Northern Pike White Sucker Common Carp Brown Bullhead White Perch Rock Bass Pumpkinseed Bluegill Smallmouth Bass Largemouth Bass Yellow Perch Walleye Freshwater Drum Total catch Number of species Brown Trout Number of sets Section 1. Index Fishing Projects
24 16 TABLE Species-specific catch per gillnet set at EB02 in the Kingston Basin of Lake Ontario, Annual catches are averages for 3-8 gillnet gangs set during each of 2-3 visits during summer. Mean catches for and time-periods are shown in bold. The total number of species caught and gillnets set each year are indicated. mean mean Sea Lamprey Lake Sturgeon Alewife Chinook Salmon Rainbow Trout Atlantic Salmon Brown Trout Lake Trout Lake Whitefish Cisco Rainbow Smelt Burbot Trout-perch White Perch Rock Bass Smallmouth Bass Yellow Perch Walleye Round Goby Freshwater Drum Sculpin sp Total catch Number of species Number of sets Section 1. Index Fishing Projects
25 17 TABLE Species-specific catch per gillnet set at EB06 in the Kingston Basin of Lake Ontario, Annual catches are averages for 3-8 gillnet gangs set during each of 2-3 visits during summer. Mean catches for and time-periods are shown in bold. The total number of species caught and gillnets set each year are indicated mean mean Sea Lamprey Alewife Chinook Salmon Rainbow Trout Brown Trout Lake Whitefish Cisco Rainbow Smelt American Eel Burbot White Perch Yellow Perch Walleye Round Goby Lake Whitefish x Cisco Total catch Number of species Lake Sturgeon Lake Trout Common Carp Number of sets Section 1. Index Fishing Projects
26 18 FIG Abundance trends (annual means) for the most common species caught in gill nets at the Kingston Basin deep sites, in eastern Lake Ontario (EB02 and EB06; see Fig ). Dotted lines show 3-yr running averages (two years for first and last years graphed). Section 1. Index Fishing Projects
27 19 Kingston Basin (additional sites sampled in 2017; Table ) As in 2016, four additional Kingston Basin deep gill net sampling sites were netted in 2017; EB01, EB03, EB04 and EB05). The sampling included a seasonal component (Jun-Sep). Together, along with EB02 and EB06, this netting provided a more complete description of the Kingston Basin deep-water fish community (Table ). Overall, the dominant species were Alewife, Lake Trout, and Cisco; of note, Alewife catches were high in June and July, and low in August. Lakewide Depth Stratified Transects (Rocky Point, Cobourg, Port Credit; Tables ) In 2017, for the fourth consecutive year, three lake-wide depth-stratified gill net transects, spanning a wide depth range ( m), were sampled. Alewife, Chinook Salmon, Lake Trout, Round Goby, and Deepwater Sculpin were caught at three lake-wide transects. Cisco and Common Carp were caught only in the eastern-most transect (Rocky Point). Brown Trout was caught only at the central transect (Cobourg). Sea Lamprey, Gizzard Shad, Rainbow Trout and White Perch were caught only in the west at Port Credit. Rocky Point Deep Sites (Table ) Ten species have been captured at the Rocky Point deep sampling sites since Alewife and Lake Trout were the two most abundant species. Lake Trout abundance was relatively stable from , declined significantly through 2004 and recovered in the years following. Round Goby appeared for the first time in 2012 (at the 60 m site) and were captured again in 2015 and 2016 but not in Unlike Cobourg and Port Credit deep gill net sites (see below), Deepwater Sculpin had never been caught in the Rocky Point gill net sites but were caught in 2015 and in Cobourg (Tables and ) Nearshore sites ( m): Alewife dominated the catch at the Cobourg nearshore sites but the salmonid fish community was also well represented (Table ). Eight species were caught in Alewife catch declined significantly from , increased in 2015 and 2016, and remained high in Deep sites ( m): Four species were caught at the Cobourg deep sites in 2017: Alewife, Lake Trout, Round Goby and Deepwater Sculpin. Alewife abundance was high in 2017 (Table ). Port Credit (Tables and ) Port Credit was sampled for the first time in 2014; sampling occurred again each year since with two additional deep sampling depths added (40 and 50 m) in Nearshore sites ( m): Eleven species were caught in Alewife dominated the catch. Other species caught included Round Goby, White Sucker, Round Goby, Chinook Salmon and Brown Trout (Table ). Deep Sites ( m): Four species were caught at the Port Credit deep sites: Alewife, Lake Trout, Deepwater Sculpin, and Round Goby (Table ). Bay of Quinte (Conway, Hay Bay and Big Bay; Tables inclusive) Three sites are used to monitor long-term trends in the Bay of Quinte fish community. Big Bay is a single-depth site; Hay Bay has two depths and Conway five depths. Average summer catch for the three sites are summarized graphically in Fig to illustrate abundance trends of the most abundant species from Yellow Perch abundance peaked in 1998, declined gradually through 2013, and increased over the last four years. In 2014, White Perch abundance declined to its lowest level since 2001, and has recovered each year since. Alewife abundance increased from , declined from , and increased significantly through Alewife catch was low in Walleye abundance declined from but has remained very stable since. Freshwater Drum and Gizzard Shad catches show no remarkable trends. White Sucker abundance declined since 1992, gradually levelling off in recent years but spiked in Brown Bullhead abundance has declined precipitously to low levels. Bluegill and Pumpkinseed abundance increased in the late-1990s then declined through Thereafter, Bluegill catches increased but Section 1. Index Fishing Projects
28 20 TABLE Species-specific catch per gillnet set at six sites (EB01, EB02, EB03, EB04, EB05, EB06) in the Kingston Basin of Lake Ontario, Catches are averages for 3 gillnet gangs set during each of 3 visits during summer. The total number of species caught and gillnets set each year are indicated. EB01 EB02 EB03 EB04 EB05 EB06 Species Jun Jul Aug Jun Jul Aug Jun Jul Aug Jun Jul Aug Jun Jul Aug Jun Jul Aug Total Chinook Salmon Lake Trout Lake Whitefish Cisco Rainbow Smelt Yellow Perch Walleye Round Goby Lake Whitefish x Cisco Total catch Number of species Number of sets Alewife Brown Trout Section 1. Index Fishing Projects
29 21 TABLE Species-specific catch per gillnet set at Rocky Point in northeastern Lake Ontario by site depth, Catches are averages for 2 or 3 gill net gangs during each of 1 or 2 visits during summer. The total number of species caught and number of gill nets set are indicated. Northeast (Rocky Point) Site depth (m) Alewife Chinook Salmon Lake Trout Cisco White Sucker Common Carp Rock Bass Smallmouth Bass Yellow Perch Walleye Round Goby Deepwater Sculpin Total catch Number of species Number of sets TABLE Species-specific catch per gillnet set at Cobourg in north central Lake Ontario by site depth, Catches are averages for 2 or 3 gill net gangs during each of 1 or 2 visits during summer. The total number of species caught and number of gill nets set are indicated. North Central (Cobourg) Site depth (m) Alewife Chinook Salmon Brown Trout Lake Trout Smallmouth Bass Yellow Perch Walleye Round Goby Deepwater Sculpin Total catch Number of species Number of sets TABLE Species-specific catch per gillnet set at Port Credit in northwestern Lake Ontario by site depth, Catches are averages for 2 or 3 gill net gangs during each of 1 or 2 visits during summer. The total number of species caught and number of gill nets set are indicated. Northwest (Port Credit) Site depth (m) Sea Lamprey Alewife Gizzard Shad Chinook Salmon Rainbow Trout Brown Trout Lake Trout White Sucker White Perch Rock Bass Round Goby Deepwater Sculpin Total catch Number of species Number of sets Section 1. Index Fishing Projects
30 22 TABLE Species-specific catch per gillnet set at Rocky Point (deep sites only) in northeastern Lake Ontario, (no sampling in 2006, 2007 or 2010). Annual catches are averages for 2 or 3 gillnet gangs set at each of up to 6 depths (40, 50, 60, 80, 100 or 140 m) during each of 2 visits during early-summer. Mean catches for and time-periods are shown in bold. The total number of species caught and gillnets set each year are indicated mean mean Alewife Lake Trout Lake Whitefish Cisco (Lake Herring) Coregonus sp Rainbow Smelt Burbot White Perch Round Goby Slimy Sculpin Deepwater Sculpin Total catch Number of species Number of sets Section 1. Index Fishing Projects
31 23 TABLE Species-specific catch per gill net set at Cobourg (nearshore sites only) in northeastern Lake Ontario, Annual catches are averages for 2 gill net gangs set at each of 5 depths (7.5, 12.5, 17.5, 22.5 and 27.5 m) during each of 1-3 visits during summer. The total number of species caught and gill nets set each year are indicated Alewife Gizzard Shad Coho Salmon Chinook Salmon Rainbow Trout Brown Trout Lake Trout Lake Whitefish Cisco Round Whitefish Rainbow Smelt White Sucker Greater Redhorse Burbot Smallmouth Bass Yellow Perch Walleye Round Goby Freshwater Drum TABLE Species-specific catch per gill net set at Cobourg (deep sites only) in northeastern Lake Ontario, 1997, 1998, and Annual catches are averages for 2 or 3 gill net gangs set at each of 4-6 depths ( 40, 50, 60, 80, 100 and 140 m) during each of 1-2 visits during summer. The total number of species caught and gill nets set each year are indicated Alewife Brown Trout Lake Trout Cisco (Lake Herring) Rainbow Smelt Round Goby Slimy Sculpin Deepwater Sculpin Total catch Number of species Number of sets Total catch Number of species Number of sets TABLE Species-specific catch per gill net set at Port Credit (nearshore sites only) in northwestern Lake Ontario, Annual catches are averages for 2 gillnet gangs set at each of 5 depths ( 7.5, 12.5, 17.5, 22.5 and 27.5 m) during summer. The total number of species caught and gillnets set each year are indicated Sea Lamprey Alewife Gizzard Shad Chinook Salmon Rainbow Trout Atlantic Salmon Brown Trout Lake Trout Longnose Sucker White Sucker White Perch Rock Bass Round Goby TABLE Species-specific catch per gill net set at Port Credit (deep sites only) in northwestern Lake Ontario, Annual catches are averages for 3 gillnet gangs set at each of 4-6 depths (40, 50, 60, 80, 100, and 140 m) during summer. The total number of species caught and gillnets set each year are indicated Alewife Chinook Salmon Lake Trout Burbot Round Goby Deepwater Sculpin Total catch Number of species Number of sets Total catch Number of species Number of sets Section 1. Index Fishing Projects
32 24 TABLE Species-specific catch per gillnet set at Conway in the Bay of Quinte, Annual catches are averages for 2-3 gillnet gangs set at each of 5 depths ( 7.5, 12.5, 20, 30 and 45 m) during each of 2-3 visits during summer. Mean catches for and time-periods are shown in bold. The total number of species caught and gillnets set each year are indicated mean mean Sea Lamprey Lake Sturgeon Longnose Gar Alewife Gizzard Shad Chinook Salmon Rainbow Trout Brown Trout Lake Trout Lake Whitefish Cisco Rainbow Smelt Northern Pike White Sucker Moxostoma sp Common Carp Channel Catfish Stonecat Trout-perch White Perch White Bass Rock Bass Pumpkinseed Smallmouth Bass Yellow Perch Walleye Round Goby Freshwater Drum Total catch Number of species Atlantic Salmon Coregonus sp Silver Redhorse Brown Bullhead Burbot Morone sp Number of sets Section 1. Index Fishing Projects
33 25 TABLE Species-specific catch per gillnet set at Hay Bay in the Bay of Quinte, Annual catches are averages for 1-3 gillnet gangs set at each of 2 depths (7.5 and 12.5 m) during each of 1-3 visits during summer. Mean catches for and time-periods are shown in bold. The total number of species caught and gillnets set each year are indicated mean mean Sea Lamprey Lake Sturgeon Alewife Gizzard Shad Chinook Salmon Brown Trout Lake Trout Lake Whitefish Cisco Rainbow Smelt Northern Pike White Sucker River Redhorse Common Carp Golden Shiner Brown Bullhead Channel Catfish White Perch Rock Bass Pumpkinseed Bluegill Smallmouth Bass Black Crappie Yellow Perch Walleye Round Goby Freshwater Drum Total catch Number of species Longnose Gar Rainbow trout Coregonus sp Spottail Shiner Burbot White bass Number of sets Section 1. Index Fishing Projects
34 26 TABLE Species-specific catch per gillnet set at Big Bay in the Bay of Quinte, Annual catches are averages for 2 gillnet gangs set during each of 2-4 visits during summer. Mean catches for and time-periods are shown in bold. The total number of species caught and gillnets set each year are indicated. mean mean Lake Sturgeon Longnose Gar Alewife Gizzard Shad Lake Whitefish Northern Pike Mooneye White Sucker Silver Redhorse Shorthead Redhorse Moxostoma sp Common Carp Brown Bullhead Channel Catfish Burbot White Perch White Bass Rock Bass Pumpkinseed Bluegill Smallmouth Bass Largemouth Bass Black Crappie Yellow Perch Walleye Round Goby Freshwater Drum Total catch Number of species Number of sets Section 1. Index Fishing Projects
35 27 FIG Abundance trends (annual means) for the most common species caught in gill nets at three areas in the Bay of Quinte (Conway, Hay Bay and Big Bay; see Fig ). Dotted lines show 3-yr running averages (two years for first and last years graphed). Section 1. Index Fishing Projects
36 28 Pumpkinseed catches did not until 2016 and 2017 when Bluegill abundance was low. Cisco catches increased in the late-1990s then declined; most recently Cisco catch increased in 2015, 2016 and again in Bay of Quinte (additional gill netting in 2017; Table ) Three additional upper Bay of Quinte gill net sampling sites were netted in 2016 and The 2017 sampling included a seasonal component (June, August and October/November sampling). Together, along with Big Bay, this netting provided a more complete description of the upper Bay of Quinte fish community (Table ). Overall, the dominant species were Yellow Perch, White Perch, Walleye, Alewife, Gizzard Shad, Freshwater Drum and Longnose Gar. Alewife were abundant only in June. Species Highlights Lake Whitefish Thirty three Lake Whitefish were caught and were interpreted for age in the 2017 index gill nets (Table ). Fish ranged in age from 2-24 years. Fifteen year-classes were represented. Six (18%) whitefish were from the 2012 year-class. Cisco One hundred and fifty nine Cisco were caught and were interpreted for age in the 2017 index gill nets (Table ). Fish ranged in age from 1-15 years. Fifteen year-classes were represented. One hundred and four (65%) Cisco were from the 2014 year-class. Walleye Four hundred and six Walleye were caught and interpreted for age in the 2017 summer index TABLE Species-specific catch per gill net set at upper Bay of Quinte gill net site locations (Trenton, Belleville, Big Bay and Deseronto) in June and August, The total catch and the number of species caught and gill nets set are indicated. Trenton Belleville Big Bay Deseronto Species Jun Aug Oct Jun Aug Oct Jun Jul Aug Nov Jun Aug Nov Total Longnose Gar Bowfin Alewife Gizzard Shad Chinook Salmon Lake Whitefish Cisco Northern Pike White Sucker Silver Redhorse Common Carp Brown Bullhead Channel Catfish White Perch White Bass Rock Bass Pumpkinseed Bluegill Largemouth Bass Black Crappie Yellow Perch Walleye Freshwater Drum Lake Whitefish x Cisco Total catch Number of species Number of sets Section 1. Index Fishing Projects
37 29 gill nets (Table ). One hundred and thirty one Walleye (21%) were age-2 (2015 year-class) and 130 (21%) were age-3 (2014 year-class). In the Kingston Basin nearshore gill nets, 93% (258) of the 276 Walleye were age-5 or greater. TABLE Age distribution of 33 Lake Whitefish sampled from index gill nets, by region, during Also shown are mean fork length and mean weight. Age/year-class Total Region Northeast 1 1 Kingston Basin (nearshore) Kingston Basin (deep) Bay of Quinte Total aged Mean fork length (mm) Mean weight (g) TABLE Age distribution of 159 Cisco sampled from index gill nets, by region, Also shown are mean fork length and mean weight. Age/year-class Total Region Northeast Kingston Basin (nearshore) Kingston Basin (deep) Bay of Quinte Total aged Mean fork length (mm) Mean weight (g) TABLE Age distribution of 625 Walleye sampled from summer index gill nets, by region, Also shown are mean fork length, mean weight, mean GSI (females), and percent mature (females). GSI = gonadal somatic index calculated for females only as log10(gonad weight + 1)/log10(weight). Note that a GSI greater than approximately 0.25 indicates a mature female. Age/year-class Total Region Central 1 1 Northeast Middle Ground Kingston Basin (nearshore) Kingston Basin (deep) 1 1 Bay of Quinte Total aged Mean fork length (mm) Mean weight (g) Mean GSI (females) % mature Section 1. Index Fishing Projects
38 Lake Ontario and Bay of Quinte Fish Community Index Trawling J. A. Hoyle, Lake Ontario Management Unit Bottom trawling has been used to monitor the relative abundance of small fish species and the young of large-bodied species in the fish community since the 1960s. After some initial experimentation with different trawl specifications, two trawl configurations (one for the Bay of Quinte and one for Lake Ontario) were routinely employed (see trawl specifications Table 1.3.1). In the Kingston Basin of eastern Lake Ontario, six sites, ranging in depth from about 20 to 35 m, were visited about four times annually up until 1992 when three sites were dropped. From 1992 to 2015, three visits were made to each of three sites annually, and four replicate ½ mile trawls are made during each visit. After 1995, a deep water site was added outside the Kingston Basin, south of Rocky Point (visited twice annually with a trawling distance of 1 mile; about 100 m water depth), to give a total of four Lake sites (Fig ). In 2014, a second trawl site/ depth was added at Rocky Point (60 m) and two trawl sites at each of Cobourg and Port Credit (60 and 100 m depths at both locations). In 2015, the Lake Ontario trawling was expanded significantly to include several more sampling depths at each of Rocky Point, Cobourg, and Port Credit. In 2016 and 2017 the three Kingston Basin sites that were dropped in 1992 were added back in to the sampling design, and trawling was not done at Cobourg or Port Credit. [Note that these sites were sampled in spring and fall prey fish assessments (see Section 1.11 and 1.12)]. In the Bay of Quinte, six fixed-sites, ranging in depth from about 4 to 21 m, are visited annually on two or three occasions during mid to late-summer. Four replicate ¼ mile trawls are made during each visit to each site. The 2017 bottom trawl sampling design is shown in Table Thirty-three species and over 52,000 fish were caught in 78 bottom trawls in 2017 (19-Jun to 7-Sep, Table 1.3.3). White Perch (39%). Alewife (18%), Round Goby (17%) and Yellow Perch (10%), collectively made up 85% of the catch by number. Species-specific catches in the 2017 trawling program are shown in Tables TABLE Bottom trawl specifications used in Eastern Lake Ontario and Bay of Quinte Fish Community sampling. 3/4 Western (Poly) 3/4 Yankee Standard No. 35 (Bay Trawl) (Lake Trawl) Head Rope Length (m) Foot Rope Length (m) Side Brail Height (m) Mesh Size (front) 4" knotted black poly 3.5" knotted green nylon Twine Type (middle) 3" knotted black poly 2.5" knotted nylon Before Codend 2" knotted black poly 2" knotted nylon 1.5" knotted black nylon (chafing gear) 1" knotted black nylon Codend Mesh Size 0.5" knotted white nylon 0.5" knotless white nylon Remarks: Fishing height 2.0 m Fishing height 1.9 m FISHNET gear dimensions FISHNET gear dimensions as per Casselman 92/06/08 as per Casselman 92/06/08 GRLEN:length of net N/A N/A GRHT:funnel opening height 2.25 m 2.3 m GRWID:intake width 6.8 m 9.9 m GRCOL:1 wt,2 bl,3 gn 2 7 (discoloured) GRMAT:1 nylon,2 ploypr. 2 1 GRYARN:1 mono,2 multi 2 2 GRKNOT:1 knotless,2 knots 2 2 Section 1. Index Fishing Projects
39 31 FIG Map of north eastern Lake Ontario. Shown are eastern Lake Ontario and Bay of Quinte fish community index bottom trawling site locations. TABLE Sampling design of the Lake Ontario fish community index bottom trawling program including geographic stratification, number of visits, number of replicate trawls made during each visit, and the time-frame for completion of visits. Also shown is the year in which bottom trawling at a particular area was initiated and the number of years that trawling has occurred. Note that in 2017 three visits were made to EB03 (Sep) and 4 replicate trawls were conducted during the third visit. Region name Area Name (Area code) Site name Depth (m) Visits* Site location Replicates x duration Latitude Longitude Visits x reps Time-frame Kingston Basin Eastern Basin (EB) EB x 5 minute Jun 20-Sep 9 Kingston Basin Eastern Basin (EB) EB x 5 minute Jun 20-Sep Kingston Basin Eastern Basin (EB) EB x 5 minute Jun 20-Sep Kingston Basin Eastern Basin (EB) EB x 5 minute Aug 1-Sep Kingston Basin Eastern Basin (EB) EB x 5 minute Jun 20-Sep 9 Kingston Basin Eastern Basin (EB) EB x 5 minute Jun 20-Sep 9 Kingston Basin Eastern Basin (EB) EB x 5 minute Jun 20-Sep Rocky Point Rocky Point (RP) x 5 minute July Rocky Point Rocky Point (RP) x 5 minute July Rocky Point Rocky Point (RP) x 5 minute July Rocky Point Rocky Point (RP) x 5 minute July Rocky Point Rocky Point (RP) x 5 minute July Rocky Point Rocky Point (RP) x 5 minute July Rocky Point Rocky Point (RP) x 5 minute July Rocky Point Rocky Point (RP) x 5 minute July Bay of Quinte Conway (LB) BQ x 6 minutes Aug 1-Sep Bay of Quinte Hay Bay (MB) BQ x 6 minutes Aug 1-Sep Bay of Quinte Deseronto (UB) BQ x 6 minutes Aug 1-Sep Bay of Quinte Big Bay (UB) BQ x 6 minutes Aug 1-Sep Bay of Quinte Belleville (UB) BQ x 6 minutes Aug 1-Sep Bay of Quinte Trenton (UB) BQ x 6 minutes Aug 1-Sep * Note that each visit represents a different date. Start year Number years Section 1. Index Fishing Projects
40 32 TABLE Species-specific total bottom trawl catch in 2017 from 19-Jun to 7-Sep. Frequency of occurrence (FO) is the number of trawls, out of a possible 78, in which each species (33 species and 52,277 individual fish) was caught. Species FO Catch Biomass (kg) Mean weight (g) Alewife 43 9, Gizzard Shad Brown Trout ,552.1 Lake Trout Lake Whitefish Cisco Coregonus sp Rainbow Smelt White Sucker Silver Redhorse Common Carp Spottail Shiner 38 1, Brown Bullhead Channel Catfish American Eel Trout-perch 38 1, White Perch 41 20, White Bass Morone sp Sunfish Rock Bass Pumpkinseed 38 1, Bluegill Smallmouth Bass ,287.7 Largemouth Bass Black Crappie Lepomis sp Yellow Perch 49 5, Walleye Johnny Darter Logperch Tessellated Darter Brook Silverside Round Goby 40 8, Freshwater Drum Sculpin sp Slimy Sculpin Deepwater Sculpin 8 1, Totals 52, Lake Ontario Kingston Basin (Tables and 1.3.5) Bottom trawls were conducted at six sites from June to September Five species were caught with the most abundant species being Round Goby, Rainbow Smelt and Alewife. Round TABLE Species-specific catch per trawl at six sites (EB01, EB02, EB03, EB04, EB05, EB06) in the Kingston Basin of Lake Ontario, Catches are averages for the number of trawls indicated. The total number of fish and species caught and trawls conducted are indicated. Month Species Jun Jul Aug Total Alewife Lake Trout Coregonus sp Rainbow Smelt Yellow Perch Round Goby Sculpin sp Total catch Number of species Number of trawls Goby abundance increased through the summer; catches were lowest in June and highest in August. Alewife catches were highest in June and lowest in August. Trend through time catches for most common species are shown in Fig EB02 (Table 1.3.6). Four species: Round Goby, Alewife, Rainbow Smelt and Yellow Perch were caught at EB02 in Threespine Stickleback, having risen to high levels of abundance in the late 1990s, declined rapidly after 2003 and was absent in the EB02 catches for over 10 years. Slimy Sculpin, another formerly abundant species has also been absent for 10 years. EB03 (Table 1.3.7) Three species: Round Goby, Rainbow Smelt and Alewife were caught at EB03 in Round Goby, having first appeared in the EB03 catches in 2004, now dominate the total catch. Rainbow Smelt abundance was higher in the last three years. As was the case for EB02, Threespine Stickleback have been absent from the EB03 catches for over 10 years. EB06 (Table 1.3.8) Four species: Round Goby, Alewife and an unidentified sculpin were caught at EB06 in Rocky Point (Tables and ). Rocky Point (Tables and ) Six species: Deepwater Sculpin, Alewife, Section 1. Index Fishing Projects
41 33 TABLE Species-specific catch per trawl at six sites (EB01, EB02, EB03, EB04, EB05, EB06) by month in the Kingston Basin of Lake Ontario, Catches are averages for 1 to 4 trawls during each of 3 or 4 visits during summer. The total number of fish and species caught and trawls conducted are indicated. EB01 EB02 EB03 EB04 EB05 EB06 Species Jun Jul Aug Jun Jul Aug Jun Jul Aug Jun Jul Aug Jun Jul Aug Jun Jul Aug Alewife Lake trout Coregonus sp Rainbow smelt Yellow perch Round goby Sculpin sp Total catch Number of species Number of trawls Total Section 1. Index Fishing Projects
42 34 FIG Abundance trends (annual means) for the most common species caught in bottom trawls at three to six sites in the Kingston Basin, eastern Lake Ontario (EB01, EB02, EB03, EB04, EB05, EB06); see Fig ). Dotted lines show 3-yr running averages (two years for first and last years graphed). Section 1. Index Fishing Projects
43 35 TABLE Species-specific catch per trawl (12 min duration; 1/2 mile) by year in the fish community index bottom trawling program during summer at EB02, Kingston Basin, Lake Ontario. Catches are the mean number of fish observed for the number of trawls indicated. Total catch and number of species caught are indicated. mean mean Species Year Alewife Rainbow Trout Lake Trout Lake Whitefish Cisco (Lake Herring) Coregonus sp Rainbow Smelt Emerald Shiner Burbot Threespine Stickleback Trout-perch Yellow Perch Walleye Johnny Darter Round Goby Sculpin sp Slimy Sculpin Deepwater Sculpin Total catch Number of species Number of trawls Section 1. Index Fishing Projects
44 36 TABLE Species-specific catch per trawl (12 min duration; 1/2 mile) by year in the fish community index bottom trawling program during summer at EB03, Kingston Basin, Lake Ontario. Catches are the mean number of fish observed for the number of trawls indicated. Total catch and number of species caught are indicated. Species mean Year mean Alewife Gizzard Shad Chinook Salmon Lake Trout Lake Whitefish Cisco Rainbow Smelt White Sucker Common Carp Spottail Shiner American Eel Brook Stickleback Threespine Stickleback Trout-perch White Perch Pumpkinseed Smallmouth Bass Largemouth Bass Yellow Perch Walleye Johnny Darter Round Goby Freshwater Drum Sculpin sp Mottled Sculpin Slimy Sculpin Total catch Number of species Number of trawls Section 1. Index Fishing Projects
45 37 TABLE Species-specific catch per trawl (12 min duration; 1/2 mile) by year in the fish community index bottom trawling program during summer at EB06, Kingston Basin, Lake Ontario. Catches are the mean number of fish observed for the number of trawls indicated. Total catch and number of species caught are indicated. Species mean Year mean Alewife Lake Trout Lake Whitefish Cisco (Lake Herring) Rainbow Smelt Threespine Stickleback Trout-perch Yellow Perch Johnny Darter Round Goby Sculpin sp Slimy Sculpin Deepwater Sculpin Total catch Number of species Number of trawls Section 1. Index Fishing Projects
46 38 Slimy Sculpin, Rainbow Smelt, Brown Trout, and two unidentified Coregonus species were caught at Rocky Point in Deepwater Sculpin were most common at water depths greater than 90 m. Slimy Sculpin were common at depths less than 110 m. Bay of Quinte Conway (Table ) Twelve species were caught at Conway in The most abundant species were Round Goby, Yellow Perch, Rainbow Smelt and Troutperch. Hay Bay (Table ) Sixteen species were caught at Hay Bay in The most abundant species were Alewife, White Perch and Yellow Perch. Deseronto (Table ) Twenty-one species were caught at Deseronto in The most abundant species were White Perch, Alewife and Yellow Perch. Big Bay (Table ) Seventeen species were caught at Big Bay in The most abundant species were White Perch, Trout-perch, Spottail Shiner, Yellow Perch and Freshwater Drum. Belleville (Table ) Seventeen species were caught at Belleville in White Perch, Trout-perch, Yellow Perch, Pumpkinseed and Freshwater Drum were the most abundant species in the catch. Trenton (Table ) Seventeen species were caught at Trenton in The most abundant species were Yellow Perch, Pumpkinseed, White Perch, Alewife, Bluegill, Spottail Shiner and Freshwater Drum. Species Trends (Fig ). Bottom trawl results were summarized across the six Bay of Quinte sites and presented graphically to illustrate abundance trends for major species in Fig All species show significant abundance changes over the long-term. TABLE Species-specific catch per trawl (adjusted to 12 min duration; 1/2 mile) in the fish community index bottom trawling program during summer at Rocky Point (multiple water depths), Lake Ontario, Catches are the mean number of fish observed for the number of trawls indicated. Total catch and number of species caught are indicated. The most abundant species remain White Perch, Yellow Perch, Alewife and Gizzard Shad. White Perch abundance declined significantly in 2014, remained low in 2015, increased in 2016 and again in Yellow Perch remain abundant but did decline in 2017 reflecting a poor year-class that year. Alewife abundance remains high. Most centrarchid species are currently at moderate to high levels of abundance as are Trout -perch, Spottail Shiner, Round Goby and Walleye. Species currently at low abundance levels relative to past levels include Brown Bullhead, Rainbow Smelt, White Sucker, Lake Whitefish and Johnny Darter. Species Highlights Site depth (m) Site depth (m) Alewife Brown trout Coregonus sp Rainbow smelt Slimy sculpin Deepwater sculpin Total catch Number of species Number of trawls Catches of age-0 fish in 2017 for selected species and locations are shown in Tables for Lake Whitefish, Cisco, Yellow Perch and Walleye. Age-0 Lake Whitefish were caught at Conway but not Timber Island in 2017 (Table ). Except for the 2003 and 2005 yearclasses, age-0 Lake Whitefish catches have been low for more than a decade. Age-0 Cisco catches at Conway in 2017 were low to moderate relative to recent years (Table ). Age-0 catches of Yellow Perch were very low in 2017 (Table ). Following two poor year-classes in 2012 and 2013, the three year- Section 1. Index Fishing Projects
47 39 TABLE Species-specific catch per trawl (adjusted to 12 min duration; 1/2 mile) by year in the fish community index bottom trawling program during summer at Rocky Point, 100 m depth only), eastern Lake Ontario. Catches are the mean number of fish observed for the number of trawls indicated. Total catch and number of species caught are indicated. No sampling in Species Year mean mean Alewife Lake Trout Lake Whitefish Rainbow Smelt Threespine Stickleback Rock Bass Round Goby Slimy Sculpin Deepwater Sculpin Total catch Number of species Number of trawls Section 1. Index Fishing Projects
48 40 TABLE Species-specific catch per trawl (6 min duration; 1/4 mile) by year in the fish community index bottom trawling program at Conway (24 m depth), Bay of Quinte. Catches are the mean number of fish observed at each site for the number of trawls indicated. Total catch and number of species caught are indicated. Species mean Year mean Silver Lamprey Alewife Gizzard Shad Chinook Salmon Brown Trout Lake Trout Lake Whitefish Cisco Coregonus sp Rainbow Smelt White Sucker Moxostoma sp Spottail Shiner American Eel Burbot Threespine Stickleback Trout-perch White Perch White Bass Rock Bass Bluegill Yellow Perch Walleye Johnny Darter Round Goby Freshwater Drum Sculpin sp Mottled Sculpin Slimy Sculpin Total catch Number of species Number of trawls Section 1. Index Fishing Projects
49 41 TABLE Species-specific catch per trawl (6 min duration; 1/4 mile) by year in the fish community index bottom trawling program at Hay Bay (7 m depth), Bay of Quinte. Catches are the mean number of fish observed for the number of trawls indicated. Total catch and number of species caught are indicated. Species mean Year mean Alewife Gizzard Shad Lake Whitefish Cisco Rainbow Smelt Northern Pike White Sucker Common Carp Golden Shiner Common Shiner Fathead Minnow Brown Bullhead Channel Catfish American Eel Burbot Trout-perch White Perch White Bass Sunfish Rock Bass Pumpkinseed Bluegill Smallmouth Bass Largemouth Bass Black Crappie Lepomis sp Yellow Perch Walleye Johnny Darter Logperch Brook Silverside Round Goby Freshwater Drum Slimy Sculpin Total catch Number of species Number of trawls Section 1. Index Fishing Projects
50 42 TABLE Species-specific catch per trawl (6 min duration; 1/4 mile) by year in the fish community index bottom trawling program at Deseronto (5 m depth), Bay of Quinte. Catches are the mean number of fish observed for the number of trawls indicated. Total catch and number of species caught are indicated. Species mean Year mean Longnose Gar Alewife Gizzard Shad Rainbow Smelt Northern Pike White Sucker Lake Chub Common Carp Emerald Shiner Spottail Shiner Brown Bullhead Channel Catfish Ictalurus sp American Eel Trout-perch White Perch White Bass Sunfish Rock Bass Pumpkinseed Bluegill Smallmouth Bass Largemouth Bass Black Crappie Lepomis sp Yellow Perch Walleye Johnny Darter Logperch Brook Silverside Round Goby Freshwater Drum Total catch Number of species Number of trawls Section 1. Index Fishing Projects
51 43 TABLE Species-specific catch per trawl (6 min duration; 1/4 mile) by year in the fish community index bottom trawling program at Big Bay (5 m depth), Bay of Quinte. Catches are the mean number of fish observed for the number of trawls indicated. Total catch and number of species caught are indicated. Species mean Year mean Longnose Gar Alewife Gizzard Shad Rainbow Smelt Northern Pike White Sucker Moxostoma sp Common Carp Emerald Shiner Spottail Shiner Brown Bullhead Channel Catfish Ictalurus sp American Eel Trout-perch White Perch White Bass Sunfish Rock Bass Pumpkinseed Bluegill Smallmouth Bass Largemouth Bass Black Crappie Lepomis sp Yellow Perch Walleye Johnny Darter Logperch Brook Silverside Round Goby Freshwater Drum Total catch Number of species Number of trawls Section 1. Index Fishing Projects
52 44 TABLE Species-specific catch per trawl (6 min duration; 1/4 mile) by year in the fish community index bottom trawling program at Belleville (5 m depth), Bay of Quinte. Catches are the mean number of fish observed for the number of trawls indicated. Total catch and number of species caught are indicated. mean mean Species Year Sea Lamprey Longnose Gar Alewife Gizzard Shad Rainbow Smelt Northern Pike Mooneye White Sucker Common Carp Spottail Shiner Brown Bullhead Channel Catfish American Eel Burbot Trout-perch White Perch White Bass Sunfish Rock Bass Pumpkinseed Bluegill Smallmouth Bass Largemouth Bass Black Crappie Lepomis sp Yellow Perch Walleye Johnny Darter Logperch Brook Silverside Round Goby Freshwater Drum Sculpin sp Total catch Number of species Number of trawls Section 1. Index Fishing Projects
53 45 TABLE Species-specific catch per trawl (6 min duration; 1/4 mile) by year in the fish community index bottom trawling program at Trenton (4 m depth), Bay of Quinte. Catches are the mean number of fish observed for the number of trawls indicated. Total catch and number of species caught are indicated. Species mean Year mean Alewife Gizzard Shad Rainbow Smelt Northern Pike Mooneye White Sucker Shorthead Redhorse Minnow Common Carp Spottail Shiner Brown Bullhead Channel Catfish American Eel Banded Killifish Burbot Trout-perch White Perch White Bass Sunfish Rock Bass Pumpkinseed Bluegill Smallmouth Bass Largemouth Bass Black Crappie Lepomis sp Yellow Perch Walleye Johnny Darter Logperch Brook Silverside Round Goby Freshwater Drum Total catch Number of species Number of trawls Section 1. Index Fishing Projects
54 46 FIG Abundance trends (annual means) for the most common species caught in bottom trawls at six sites in the Bay of Quinte (Conway, Hay Bay, Deseronto, Big Bay, Belleville and Trenton; see Fig ). Values shown here are 3-yr running averages (two years for first and last years graphed). Section 1. Index Fishing Projects
55 47 FIG (continued). Abundance trends for the most common species caught in bottom trawls at six sites in the Bay of Quinte (Conway, Hay Bay, Deseronto, Big Bay, Belleville and Trenton; see Fig ). Values shown here are 3-yr running averages (two years for first and last years graphed). Section 1. Index Fishing Projects
56 48 TABLE Mean catch-per-trawl of age-0 Lake Whitefish at two sites, Conway in the lower Bay of Quinte and EB03 near Timber Island in eastern Lake Ontario, Four replicate trawls on each of two to four visits during August and early September were made at each site. Distances of each trawl drag were 1/4 mile for Conway and 1/2 mile for EB03. Conway classes from 2014 to 2016 Perch were high. N EB03 (Timber Island) N TABLE Mean catch-per-trawl of age-0 Cisco at Conway in the lower Bay of Quinte, Four replicate trawls on each of two to four visits during August and early September were made at the Conway site. Distances of each trawl drag was 1/4 mile. Conway N Following two exceptionally strong yearclasses in 2014 and 2015, the age-0 Walleye catch in 2016 was fair and in 2017 was poor (Tables and ). Round Goby first appeared in bottom trawl catches in the Bay of Quinte in 2001 and in the Kingston Basin of eastern Lake Ontario in The species was caught at all Bay of Quinte trawling sites by 2003, peaking in abundance, at each site, between 2003 and Catches have been quite variable since but remain high. Round Goby catches in the Kingston Basin remained high in Section 1. Index Fishing Projects
57 49 TABLE Mean catch-per-trawl of age-0 Yellow Perch at six Bay of Quinte sites, Four replicate trawls on each of two to three visits during August and early September were made at each site. Distance of each trawl drag was 1/4 mile. Trenton Belleville Big Bay Deseronto Hay Bay Conway Mean Number of trawls Section 1. Index Fishing Projects
58 50 TABLE Mean catch-per-trawl of age-0 Walleye at six Bay of Quinte sites, Four replicate trawls on each of two to three visits during August and early September were made at each site. Distance of each trawl drag was 1/4 mile. Big Hay Number Year Trenton Belleville Bay Deseronto Bay Conway Mean of trawls TABLE Age distribution of 208 Walleye sampled from summer bottom trawls, Bay of Quinte, Also shown are mean fork length and mean weight. Fish of less than 150 mm fork length were assigned an age of 0, fish between 150 and 290 mm were aged using scales; and those over 290 mm fork length were aged using otoliths. Age (years) Year-class Total Number of fish Mean fork length (mm) Mean weight (g) Section 1. Index Fishing Projects
59 Lake Ontario Nearshore Community Index Netting J. A. Hoyle, Lake Ontario Management Unit In 2017, Nearshore community index netting NSCIN projects were completed at three nearshore areas: East Lake, West Lake, Prince Edward Bay, and the upper Bay of Quinte (Fig ). NSCIN was first initiated on the upper Bay of Quinte (Trenton to Deseronto), West Lake and Weller s Bay in 2001, and was expanded to include the middle and lower reaches of the Bay of Quinte (Deseronto to Lake Ontario) in In 2006, the NSCIN program was conducted on Hamilton Harbour and the Toronto harbour area thanks to partnerships developed with the Fisheries and Oceans Canada and the Toronto and Region Conservation Authority. NSCIN was further expanded to other Lake Ontario nearshore areas in subsequent years as detailed in Table The NSCIN protocol uses 6-foot trap nets and is designed to evaluate the abundance and other biological attributes of fish species that inhabit the littoral area. Suitable trap net sites are chosen from randomly selected UTM grids that contain shoreline in the nearshore area netted. Ecosystem (i.e., Index of Biotic Integrity or IBI) and fish community (e.g., proportion of piscivore biomass or PPB) level measures have been developed to assess relative health of Lake Ontario s nearshore areas. These assessments are particularly useful to monitor the on-going status of impaired fish communities in Lake Ontario Areas of Concern (AOCs) such as Hamilton and Toronto Harbours. Survey information and basic catch statistics for the four embayments sampled in 2017 are given in Tables and respectively. Age distribution and length-at-age information is given in Tables and Abundance trends for all species are presented in Table and graphically for selected species in Fig East Lake Sixteen trap net sites were sampled on East Lake from Aug with water temperatures ranging from o C (Table 1.4.2). Eight hundred fish comprising 14 species were captured (Table 1.4.3). The most abundant species by number were Bluegill (448), Pumpkinseed (159), Brown Bullhead (47), Largemouth Bass (42), Rock Bass (38), Yellow Perch (21), and Walleye (15). West Lake Twenty-four trap net sites were sampled on West Lake from Aug 8-17 with water temperatures ranging from o C (Table 1.4.2). Nearly 2,200 fish comprising 19 species were captured (Table 1.4.3). The most abundant TABLE Annual NSCIN trap net schedule for Lake Ontario nearshore areas, The numbers of trap net samples at each area in each year are indicated. Year Hamilton Harbour Toronto Islands Presqu'ile Bay Weller's Bay West Lake East Lake Prince Edward Bay Upper Bay of Quinte Middle Bay of Quinte Lower Bay of Quinte North Channel Kingston Section 1. Index Fishing Projects
60 52 FIG Map of Lake Ontario indicating NSCIN trap net locations on East Lake, West Lake, Prince Edward Bay and the upper Bay of Quinte, TABLE Survey information for the 2017 NSCIN trap net program on East Lake, West Lake, Prince Edward Bay and the upper Bay of Quinte. Shown for each embayment are the survey dates, the range of observed surface water temperatures, the total number of trap net lifts, and the number of trap net lifts broken down by target sampling depth, and observed substrate and cover types. East Lake West Lake Prince Edward Bay Upper Bay of Quinte Survey dates Aug Aug 8-17 Sep Sep 5-22 Water temperature range ( o C) No. of trap net lifts No. of lifts by depth: Target (2-2.5 m) > Target < Target No. of lifts by substrate type: Hard Soft No. of lifts by degree of cover: None % % % Section 1. Index Fishing Projects
61 TABLE Species-specific catch in the 2017 NSCIN trap net program on East Lake, West Lake, Prince Edward Bay and the upper Bay of Quinte. Statistics shown include arithmetic and geometric mean catch-per-trap net (CUE), percent relative standard error of mean log10(catch+1), %RSE = 100*SE/mean, and mean fork or total length (mm). A total of 30 species were caught. Species Arithmetic mean East Lake Geometric mean Relative standard error (%) Mean length (mm) Arithmetic mean West Lake Prince Edward Bay Upper Bay of Quinte Geometric mean Relative standard error (%) Mean length (mm) Arithmetic mean Geometric mean Relative standard error (%) Mean length (mm) Arithmetic mean Geometric mean Longnose Gar Bowfin Alewife Gizzard Shad Rainbow Trout Northern Pike Muskellunge Chain Pickerel White Sucker Silver Redhorse Shorthead Redhorse Greater Redhorse River Redhorse Common Carp Golden Shiner Brown Bullhead Channel Catfish American Eel White Perch White Bass Sunfish Rock Bass Pumpkinseed Bluegill Smallmouth Bass Largemouth Bass Black Crappie Yellow Perch Walleye Freshwater Drum Total catch per net Number of species Number of nets Total catch 800 2, ,290 Relative standard error (%) Mean length (mm) 53 Section 1. Index Fishing Projects
62 54 Table Age distribution of selected species caught in on East Lake, West Lake, Prince Edward Bay and the upper Bay of Quinte, Age (years) / Year-class Location Species East Lake Pumpkinseed Bluegill Smallmouth Bass 1 2 Largemouth Bass Yellow Perch Walleye West Lake Northern Pike Pumpkinseed Bluegill Smallmouth Bass Largemouth Bass Black Crappie Yellow Perch Walleye Prince Edward Bay Northern Pike Chain Pickerel 1 Pumpkinseed Bluegill Smallmouth Bass Largemouth Bass Black Crappie Yellow Perch Walleye Upper Bay of Quinte Northern Pike Pumpkinseed Bluegill Smallmouth Bass Largemouth Bass Black Crappie Yellow Perch Walleye Table Mean fork length (mm) of selected species caught on East Lake, West Lake, Prince Edward Bay and the upper Bay of Quinte, Age (years) / Year-class Location Species East Lake Pumpkinseed Bluegill Smallmouth Bass Largemouth Bass Yellow Perch Walleye West Lake Northern Pike Pumpkinseed Bluegill Smallmouth Bass Largemouth Bass Black Crappie Yellow Perch Walleye Prince Edward Bay Northern Pike Chain Pickerel 598 Pumpkinseed Bluegill Smallmouth Bass Largemouth Bass Black Crappie Yellow Perch Walleye Upper Bay of Quinte Northern Pike Pumpkinseed Bluegill Smallmouth Bass Largemouth Bass Black Crappie Yellow Perch Walleye Section 1. Index Fishing Projects
63 55 TABLE Species-specific abundance trends (mean catch per trap net) on East Lake, West Lake, Prince Edward Bay and the upper Bay of Quinte. Annual total catch per net lift, number of net sets, and number of species are also indicated. East Lake West Lake Prince Edward Bay Upper Bay of Quinte Species Longnose Gar Bowfin Alewife Gizzard Shad Rainbow Trout Lake Trout 0.03 Lake Whitefish 0.03 Northern Pike Muskellunge Chain Pickerel 0.04 Mooneye 0.03 Quillback White Sucker Silver Redhorse Shorthead Redhorse Greater Redhorse River Redhorse Moxostoma sp Common Carp Golden Shiner Fallfish 0.03 Brown Bullhead Channel Catfish American Eel White Perch White Bass Sunfish 0.04 Rock Bass Pumpkinseed Bluegill Smallmouth Bass Largemouth Bass Black Crappie Yellow Perch Walleye Freshwater Drum Total catch Number of net lifts Number of species Section 1. Index Fishing Projects
64 56 Catch per trap Northern Pike East Lake West Lake Prince Edward Bay Upper Bay of Quinte Catch per trap Brown Bullhead East Lake West Lake Prince Edward Bay Upper Bay of Quinte Catch per trap Channel Catfish East Lake West Lake Prince Edward Bay Upper Bay of Quinte Catch per trap American Eel East Lake West Lake Prince Edward Bay Upper Bay of Quinte Catch per trap White Perch East Lake West Lake Prince Edward Bay Upper Bay of Quinte Catch per trap Pumpkinseed East Lake West Lake Prince Edward Bay Upper Bay of Quinte FIG Abundance trends for selected species caught in nearshore trap nets on East Lake, West Lake, Prince Edward Bay and the upper Bay of Quinte. Values shown are annual arithmetic means. Section 1. Index Fishing Projects
65 57 Catch per trap Bluegill East Lake West Lake Prince Edward Bay Upper Bay of Quinte Catch per trap Smallmouth Bass East Lake West Lake Prince Edward Bay Upper Bay of Quinte Catch per trap Largemouth Bass East Lake West Lake Prince Edward Bay Upper Bay of Quinte Catch per trap Black Crappie East Lake West Lake Prince Edward Bay Upper Bay of Quinte Catch per trap Yellow Perch East Lake West Lake Prince Edward Bay Upper Bay of Quinte Catch per trap Walleye East Lake West Lake Prince Edward Bay Upper Bay of Quinte FIG (continued) Abundance trends for selected species caught in nearshore trap nets in on East Lake, West Lake, Prince Edward Bay and the upper Bay of Quinte. Values shown are annual arithmetic means. Section 1. Index Fishing Projects
66 58 species by number were Bluegill (1,308), Pumpkinseed (305), Rock Bass (141), White Perch (106), Longnose Gar and Brown Bullhead (62), Black Crappie (55), Largemouth Bass (44), and Walleye (26). One American Eel was captured; total length of the eel was 918 mm and weight was 1,648 g. Prince Edward Bay Twenty-four trap net sites were sampled on Prince Edward Bay from Sep with water temperatures ranging from o C (Table 1.4.2). Over 800 fish comprising 22 species were captured (Table 1.4.3). The most abundant species by number were Brown Bullhead (299), Rock Bass (139), Pumpkinseed (104), Smallmouth Bass (84), Bowfin (60), Northern Pike (40), Largemouth Bass (34), and Black Crappie (23). One American Eel was captured; total length of the eel was 899 mm and weight was 1,854 g. Of note was both the capture of a Muskellunge (710 mm fork length to nearest 10 mm), and a Chain Pickerel (598 mm fork length, 2,023 g weight). Upper Bay of Quinte Thirty-six trap net sites were sampled on the upper Bay of Quinte from Sep 5-22 with water temperatures ranging from o C (Table 1.4.2). Nearly 4,300 fish comprising 25 species were captured (Table 1.4.3). The most abundant species by number were Bluegill (2,622), Pumpkinseed (346), Walleye (191), Black Crappie (184), Largemouth Bass (155), Brown Bullhead (132), White Perch (105), Longnose Gar (93), and Yellow Perch (91). Five American Eel were caught. The eel were 666, 768 and 915 mm total length and weighed 637, 1,242 and 1,807 g in weight, respectively. Northern Pike abundance declined from , increased significantly in 2010, declined from , remained steady until 2015, then increased in 2016 and again in Brown Bullhead and Channel Catfish declined from 2001 to 2009; Brown Bullhead abundance remained low through 2017 and Channel Catfish increased somewhat in 2016 and American Eel abundance has declined in 2015 compared to the previous two years but increased in 2016 and again in White Perch abundance was unusually high in 2013 but very few were caught in 2014 (7) and 2015 (11). In 2016, 93 were caught, and were caught. Pumpkinseed abundance increased in 2015 and deceased in 2016 and Bluegill abundance was similar to recent years. Smallmouth Bass abundance increased significantly in Largemouth Bass and Black Crappie abundance increased in Yellow Perch abundance declined slightly in Walleye abundance, having been unusually high in 2013, declined in 2014 and 2015, increased in 2016, and again in 2017 thanks to recruitment of very strong 2014 and 2015 yearclasses (Table and Fig ). Ecosystem Health Indices Indices have been developed based on the NSCIN trap netting to evaluate ecosystem health in Lake Ontario nearshore areas. The indices vary among nearshore areas with the degree of exposure of the nearshore area sampled to Lake Ontario, and therefore are presented separately below for sheltered and exposed embayments (Figs to 1.4.6). Piscivore Biomass A proportion of the fish community biomass comprised of piscivores (PPB) greater than 0.20 reflects a healthy trophic structure. The PPBs in 2017 were 0.29, 0.33, 0.68 and 0.41 in East Lake, West Lake, Prince Edward Bay, and the upper Bay of Quinte, respectively. The PPB in these embayments remains well above the 0.2 benchmark for healthy fish communities (Fig and 1.4.4). Index of Biotic Integrity The index of biotic integrity (IBI) is a measure of ecosystem health. IBI classes can be described as follows: 0-20 very poor, poor, fair, good, and excellent ecosystem health. The IBIs were 69 (good), 67 (good), 74 (good) and 71 (good) in East Lake, West Lake, Prince Edward Bay, and the upper Bay of Quinte, respectively. The IBIs in these embayments are indicative of healthy aquatic ecosystems (Fig and 1.4.6). Section 1. Index Fishing Projects
67 Target PPB > 0.2 PPB Hamilton Harbour Weller's Bay West Lake East Lake Upper Bay Middle Bay of Quinte of Quinte Sheltered Embayments FIG Proportion of total fish community biomass represented by piscivore species (PPB) in the nearshore trap net surveys in six sheltered Lake Ontario embayments ( ). A PPB>0.2 is indicative of a balanced trophic structure (depicted by a dashed line). Piscivore species included Longnose Gar, Bowfin, Northern Pike, Smallmouth Bass, Largemouth Bass, and Walleye. Error bars are +-2SE. PPB Toronto Islands Target PPB > 0.2 Presqu'ile Bay Prince Edward Bay IBI Toronto Islands Excellent Good Fair Poor Very Poor Presqu'ile Bay Prince Edward Bay Exposed Embayments Exposed Embayments FIG Proportion of total fish community biomass represented by piscivore species (PPB) in the nearshore trap net surveys in three exposed Lake Ontario embayments ( ). A PPB>0.2 is indicative of a balanced trophic structure (depicted by a dashed line). Piscivore species included Longnose Gar, Bowfin, Northern Pike, Smallmouth Bass, Largemouth Bass, and Walleye. Error bars are +-2SE. FIG Index of biotic integrity (IBI), as a measure of ecosystem health, in the nearshore trap net surveys in three exposed Lake Ontario embayments ( ). IBI classes can be described as follows: 0-20 very poor, poor, fair, good, and excellent ecosystem health. Error bars are +-2SE. IBI Hamilton Harbour Excellent Good Fair Poor Very Poor Weller's Bay West Lake East Lake Upper Bay Middle Bay of Quinte of Quinte Sheltered Embayments FIG Index of biotic integrity (IBI), as a measure of ecosystem health, in the nearshore trap net surveys in five sheltered Lake Ontario embayments ( ). IBI classes can be described as follows: 0-20 very poor, poor, fair, good, and excellent ecosystem health. Error bars are +-2SE. Section 1. Index Fishing Projects
68 Upper Bay of Quinte Boat Electrofishing J. A. Hoyle, Lake Ontario Management Unit Boat electrofishing was conducted by the Ontario Ministry of Natural Resources and Forestry in September 2017 to sample the upper Bay of Quinte (Trenton to Deseronto) nearshore fish community. The standard Fisheries and Oceans boat electrofishing 100 m shoreline transect protocol was followed. The objective of the survey was to compare fish population and community attributes measured by the electrofishing protocol with that measured by NSCIN trap nets (Nearshore Community Index Netting; see Section 1.4). These two gear types have been independently employed in the Bay of Quinte and other Lake Ontario nearshore areas to evaluate fish community status and ecosystem health generally using community attributes including IBIs (Indices of Biotic Integrity) and piscivore biomass. The boat electrofishing survey was conducted after sunset at the same locations sampled previously (about one week earlier) with NSCIN trap nets. Thirty-six 100 m shoreline sites were sampled from September 18 to 28. Mean water temperature at the 36 sites was 23.9 o C. A total of 1,571 fish (mean=44 fish per transect) comprising 29 species were captured (Table 5.1.1). Most abundant species included Yellow Perch (n=697), Brook Silverside (248), Bluegill (104), Largemouth Bass (77), Pumpkinseed (66), White Perch (55), Rock Bass (50), Logperch (45), American Eel (34), Golden Shiner (31), Brown Bullhead (27), Walleye (23), and Spottail Shiner (21). These most abundant species all had a relative standard error of the mean less than 30%. This result suggests that the sampling intensity (36 transects) was appropriate to describe the fish community of the upper Bay of Quinte as sampled by this boat electrofishing gear type. Finer geographic scale resolution may require more intensive sampling. Boat electrofishing and NSCIN trap net catches for 2017 (36 samples for each gear type) are contrasted in Table A total of 1,571 fish and 29 species was captured by boat electrofishing compared to 4,290 fish and 25 species by the trap nets (Table 5.1.2). Twenty species were common to both gear types. Nine unique species were captured by boat electrofishing including Alewife, Emerald Shiner, Blackchin Shiner, Spottail Shiner, Yellow Bullhead, Banded Killifish, Logperch, Brook Silverside, and Round Goby. Five unique species were captured by trap nets including Bowfin, Shorthead Redhorse, Greater Redhorse, White Bass, and Smallmouth Bass. Boat electrofishing TABLE Species-specific mean (geometric and arithmetic means) catches in the 2017 boat electrofishing program in the upper Bay of Quinte. Also shown is the relative standard error (%) of the geometric mean catch. Relative Geometric Arithmetic standard Species mean mean error (%) Longnose Gar Alewife Gizzard Shad Northern Pike White Sucker Silver Sedhorse River Redhorse Common Carp Golden Shiner Emerald Shiner Blackchin Shiner Spottail Shiner Yellow Bullhead Brown Bullhead Channel Catfish American Eel Banded Killifish White Perch Rock Bass Pumpkinseed Bluegill Largemouth Bass Black Crappie Lepomis sp Yellow Perch Walleye Logperch Brook Silverside Round Goby Freshwater Drum Total catch per sample Number of species Number of samples Total catch Section 1. Index Fishing Projects
69 61 TABLE Species-specific total catches in boat electrofishing and trap net (see Section 1.4 Nearshore Community Index Netting) gear types in the upper Bay of Quinte, Thirty-six common sampling sites were sampled by each gear type. Gear type Species Boat e-fishing Trap net Longnose Gar 6 93 Bowfin - 50 Alewife 4 - Gizzard Shad Northern Pike 3 22 White Sucker Silver Redhorse 2 31 Shorthead Redhorse - 16 Greater Redhorse - 8 River Redhorse 1 15 Common Carp 2 7 Golden Shiner 31 1 Emerald Shiner 1 - Blackchin Shiner 1 - Spottail Shiner 21 - Yellow Bullhead 1 - Brown Bullhead Channel Catfish 1 36 American Eel 34 5 Banded Killifish 1 - White Perch White Bass - 5 Rock Bass Pumpkinseed Bluegill 104 2,622 Smallmouth Bass - 23 Largemouth Bass Black Crappie Lepomis sp Yellow Perch Walleye Logperch 45 - Brook Silverside Round Goby 7 - Freshwater Drum Number species Unique species 9 5 Common species Total fish caught 1,571 4,290 tended to capture smaller species and smaller individual fish 76% of the catch was made up of fish between 60 and 170 mm in length compared to trap net gear. Trap nets tended to capture larger species and larger individual fish 73% of the catch was made up of fish between 110 and 200 mm in length compared to boat electrofishing (Fig ). Site-specific Indices of Biotic Integrity (IBI) were calculated for each gear type and a scatter plot presented for the 36 paired samples (Fig ). There was no correlation between IBI values calculated for each gear type. IBI values were 74.7 and 71.1 respectively for boat electrofishing and trap net gear types. Boat electrofishing IBI values ranged from and trap net IBI values ranged from (n = 36). Section 1. Index Fishing Projects
70 62 Proportion of catch Boat Electrofishing Proportion of catch Trap Netting Fork length (mm) FIG Size distribution (fork length in mm) of fish caught during boat electrofishing and trap netting programs in the upper Bay of Quinte, Indices of Biotic Intregrity NSCIN trap netting IBI Boat electrofishing IBI FIG Scatter plot of IBI measurements by two gear types from 36 paired sampling sites. IBIs were not significantly correlated (r 2 = 0.002, p = 0.796). Section 1. Index Fishing Projects

71 Lake Ontario Summer Pelagic Prey Fish Survey J. P. Holden, Lake Ontario Management Unit M. J. Connerton, Cape Vincent Fisheries Station, NYSDEC B. C. Weidel, Lake Ontario Biological Station, USGS Hydroacoustic assessments of Lake Ontario prey fish have been conducted since 1991 with a standardized mid-summer hydroacoustic survey first implemented in The survey is conducted jointly by the Ontario Ministry of Natural Resources and Forestry (MNRF), the New York State Department of Environmental Conservation (NYSDEC) and the US Geological Survey (USGS). Midwater trawling was routinely conducted during the early years of the survey but was discontinued in In 2016, midwater trawling was conducted in the eastern portion of the lake with an emphasis on assessing Cisco and Bloater. Efforts were expanded in 2017 to include a portion of the north shore around Cobourg. Midwater trawl catches are primarily used to inform apportionment of generalized abundance estimates obtained from hydroacoustics to species specific abundance. Acoustic analysis parameters are included in Table The index survey consists of five, northsouth, shore-to-shore transects in the main lake, and one transect in the Kingston Basin (Fig ). Additional near-shore assessment supplements the broader survey and provides greater detail on the spatial extent of Cisco. Hydroacoustic data were collected beginning at approximately one hour after sunset from 10 m of depth on one shore and running to 10 m of depth TABLE Description of midwater trawl. Component Description Vessel Tow Speed 3.5 kts Headrope length 18.3m Footrope length 18.3m Front Mesh 101 mm Cod End 12.7 mm Wing Spread 7 m Net Height 6 m Door Area 1.25 m 2 Note: 22.5 kg of weight were hung from each wing to spread the trawl on the opposite shore at or until approximately one hour before sunrise. Since 2005, transects have been randomly selected from within 15 km corridors. The corridor approach was adopted to include a random component to the survey while accommodating logistical constraints such as suitable ports. A dogleg at the southern portions of transects 3, 4 and 5 is used to increase the length of the transect that occurs in less than 100 m of water along the southern shore which has a much steeper slope than the northern shore. Temperature profiles were conducted at multiple intervals along each transect. Historical midwater trawling data (2000 to 2004) showed a thermal separation between the two primary species of interest, Alewife and Rainbow Smelt. Midwater tows in depths where water temperatures were 9 C or warmer were dominated by catches of Alewife (95% total catch weight of prey fish species) whereas tows in depths at temperatures below 9 C captured mostly Rainbow Smelt (84%). This thermal separation of the two dominant species coupled with target strengths thresholded to ranges consistent with prey fish species has been used as a means of species apportionment throughout the period when midwater trawling wasn t conducted. The survey transects included acoustic data collected over 311 km plus an additional 247 km collected paired with midwater trawl tows (Fig. FIG The Lake Ontario Lake-wide prey fish survey uses crosslake hydroacoustic transects. Transect corridors are logistically constrained but utilize a random starting point within the corridor for each annual survey. Section 1. Index Fishing Projects
72 ). The degree of coverage (Ʌ) for the survey transects was 0.18 and 0.41 when all acoustic data is included in the estimates. There were 58 midwater tows conducted which captured seven species of fish. A description of the midwater trawl gear is included in Table Alewife, Rainbow Smelt and Cisco were the most frequently caught and most abundant species (Table 1.6.2). Tows in the surface layer (at or above 10 C) were 99% Alewife. Tows in deep layer (below 10 C) were also 95% Alewife however we hypothesize that net contamination from the upper layer significantly impacts this interpretation. Headrope and footrope temperatures were not recorded on all tows and thus a fishing temperature of 9 C at the footrope and a net with a vertical opening of 5-7m is likely fishing some portion of the net in temperatures greater than 9 C water. In the future we expect to have temperature loggers on both the footrope and headrope to better quantify this potential bias. Additionally there is potential for vertical contamination during the let out and haul in portions of the tow as the net descends to the target fishing depth. During this period the net must pass through the warm portion of the water column in order to reach the cooler depths. A tow conducted in 2016 with no fishing time (trawl let out to 34 m fishing depth then immediately returned) captured Alewife, Cisco and Rainbow Smelt which indicates that the net fishes during at either or both the let out or haul in period of the tow. Catches of Rainbow Smelt and Cisco were predominantly (88% for each) caught in tows conducted in less than 9 C water. Summary size data for all species are presented in Table The length distribution shows a clear size separation between Cisco and both Alewife and Rainbow Smelt (Fig.1.6.3). The thermal separation between Alewife and Rainbow Smelt and the size difference between these species and Cisco supports the current approach FIG Spatial coverage of acoustic data collected in Transects are categorized as survey and nearshore to delineate the traditional survey transects from the additional near-shore acoustics that was paired with midwater trawling. TABLE Summary of catch data for all species captured in midwater trawls. Species name Catch total in trawls below 10 C Catch total in trawls 10 C and above Total catch all trawls Alewife Rainbow Smelt Cisco Chinook Salmon Round Goby Gizzard Shad Threespine Stickleback FIG Length frequency of Alewife, Rainbow Smelt and Cisco caught in midwater tows. TABLE Summary of biological data for species sampled in midwater trawls. Species name Number sampled Mean total length Max total length Min total length Mean weight Alewife Chinook Salmon Cisco Gizzard Shad Rainbow Smelt Round Goby Section 1. Index Fishing Projects
, see also Section 7.6).")
73 65 of species apportionment of acoustic density estimates (Table 1.6.4). Alewife index of abundance in 2017 (1.183 billion) increased relative to 2016 estimates (Fig ). The increase in population is likely explained by increases in the age-1 population of Alewife. Differences between target strength distributions over the most recent years, where recruitment to age-1 in 2014 and 2015 was low, supports this assumption (Fig ), see also Section 7.6). Alewife showed a bimodal distribution with bottom depth (Fig ). Distribution of Alewife throughout the lake during the survey period varies from year to year and no consistent spatial trend has been found. The inclusion of the additional shallow transects resulted in a marginally lower estimate (1.102 billion). Midwater trawl catches expanded to a whole-lake population (1.743 billion) suggest a slightly higher abundance than the acoustic estimate but was not conducted in a random fashion and is likely biased slightly high due to effort being concentrated in depths less than 70m where acoustic estimates show higher abundances. The acoustic abundance of Alewife is presented as an index of abundance as it produces a significantly lower abundance than spring trawl estimates. Vertical gillnets and towed up-looking acoustics show that a large proportion (on average 50%) of Alewife occupy the near-surface portion of the water column (<4 m depth) and are not detectable with the down-looking transducer used in the survey. While a significant proportion of the Alewife biomass is detected in this portion of the water column, the conversion still does not reconcile the difference between bottom trawl and acoustics population estimates. Stationary uplooking data is being analyzed to investigate the role that boat avoidance may contribute to explaining the differences. Rainbow Smelt abundance (15.1 million) in 2017 decreased relative to 2016 estimates (Fig ). Inclusion of the additional near-shore transects resulted in a larger population estimate (50.3 million). The largest midwater trawl catches of Rainbow Smelt occurred in the eastern portion of the Lake (Mexico Bay and Oak Orchard, NY). FIG Abundance index (in millions of fish) of yearling-andolder Alewife. Summer acoustic estimates were not conducted in 1999 and FIG Relative size distribution of Alewife inferred by target strength for surveys conducted from 2012 to TABLE Acoustic parameter settings and target strength thresholds used for the 2017 survey. Parameter Specification Sounder BioSonics DT-X Transducer frequency 120 khz split beam Ping Rate 1 ping per second Pulse Width 0.4 milliseconds Analytical Software Echoview (version 8.0) Alewife target threshold range -50 to -39dB, water temp. > 9 C Rainbow Smelt target threshold range -52 to -39dB, water temp. =< 9 C Cisco target threshold range -39 to -30dB, all water temps. FIG Relative distribution of Alewife (fish/ha) throughout the lake by bottom depth. Section 1. Index Fishing Projects
74 66 FIG Abundance (in millions of fish) of yearling-and-older Rainbow Smelt from Summer acoustic estimates were not conducted in 1999 and Only one Rainbow Smelt was caught in MNRF tows conducted near Cobourg. Cisco were infrequently caught during previous midwater trawling efforts ( ). Catches of Cisco were geographically confined to transects along the eastern shore of Lake Ontario in The majority of Cisco were caught within the same geographic area in 2017 although one Cisco was caught near Cobourg. Cisco catches in 2017 (N total = 15, mean CUE = 0.15 fish/5 min tow) were well below catches observed in 2016 (N total = 361, mean CUE = 3.83 fish/5 min tow). Acoustic estimates, using only the nearshore transects however show a mean density of 45 cisco/hectare which is higher than 2016 estimates. Section 1. Index Fishing Projects
75 St. Lawrence River Fish Community Index Netting Thousand Islands M.J. Yuille, Lake Ontario Management Unit Every other year in early fall, the Lake Ontario Management Unit conducts an index gillnet survey in the Thousand Islands. The catches are used to estimate abundance, measure biological attributes, and collect materials for age determination, stomach contents and tissues for contaminant analysis and pathological examination. The survey is part of a larger effort to monitor changes in the fish communities in four sections of the St. Lawrence River (Thousand Islands, Middle Corridor, Lake St. Lawrence, and Lake St. Francis), and it is coordinated with the New York State Department of Environmental Conservation (NYSDEC) to provide comprehensive assessment of the river s fisheries resources. In 2017, the survey was conducted between September 11th and September 28th. Forty eight sets were made, using standard gillnets consisting of 25-foot panels of monofilament meshes ranging from 1.5 to 6 inches in half-inch increments. The average set duration was 21 hours (range ). The overall catch was 1,745 fish comprising 19 species (summary in Table 1.7.1). The average number of fish per set was 36.4, which is higher than the previous survey in 2015 and comparable to the mean catch over the previous 10 years (34.8 fish per set; Fig ). Yellow Perch remained the dominate species caught in the nets followed by: Rock Bass and Smallmouth Bass (Fig ). Less common species included Walleye, Northern Pike and TABLE Catches per standard gillnet set in the Thousand Islands area of the St. Lawrence River, Catches from multifilament nets (all catches prior to 2001, and a portion of catches in ) were adjusted by a factor of 1.58 to monofilament netting standards initiated in Lake Sturgeon Longnose Gar Bowfin Alewife Gizzard Shad Chinook Salmon Rainbow Trout Brown Trout Lake Trout Cisco Chub Northern Pike Muskellunge Chain Pickerel White Sucker Silver Redhorse Shorthead Redhorse Greater Redhorse Moxostoma sp Common Carp Golden Shiner Brown Bullhead Channel Catfish White Perch White Bass Rock Bass Pumpkinseed Bluegill Smallmouth Bass Largemouth Bass Black Crappie Yellow Perch Walleye Round Goby Freshwater Drum Total Catch Section 1. Index Fishing Projects
76 68 Brown Bullhead; remaining species comprised the remaining 8% of the total catch (Fig ). Species Highlights In 2017, Yellow Perch catches increased from 12.4 fish per gillnet to 26.0 fish per gillnet and represented 71% of the total catch by number (Table 1.7.1; Fig and 1.7.3). In the 2017 Thousand Islands survey, average Yellow Perch catch per net (26.0) were above the average catch from the previous five netting surveys (average of 24.8 from 2007 to 2015). The centrarchids are represented by six species in the upper St. Lawrence: Rock Bass, Pumpkinseed, Bluegill, Smallmouth Bass, Largemouth Bass and Black Crappie (Fig and 1.7.5). While Rock Bass remain the most Catch per standard gillnet abundant of the centrarchids, catches in 2017 were 65% of the previous decade. Smallmouth Bass saw a small decrease in the 2017 catch and have been in decline since 2005 (Fig ). Growth as determined by mean lengths of age-1 (169 mm in 2017) and age-3 (302 mm in 2017) Smallmouth Bass increased from the previous survey and are above the long-term average (Tables and and Fig ). Size of age-5 Smallmouth Bass remains stable and above the long-term average (Table and Fig ) Pumpkinseed continue to decline in 2017 and Catch per standard gillnet FIG Yellow Perch catch per standard gillnet set in the Thousand Islands area of the St. Lawrence River, Rock bass 1990 Walleye 1% 1995 FIG Total number of fish (all species) per standard gillnet set in the Thousand Islands area of the St. Lawrence River, Rock bass 14% Other 6% Smallmouth bass 7% Northern pike 1% Catch per standard gillnet 10 5 Pumpkinseed Smallmouth bass 0 Yellow perch 71% FIG Species composition in the 2017 gillnet survey in the Thousand Island area of the St. Lawrence River. FIG Centrarchid catches per standard gillnet set in the Thousand Islands area of the St. Lawrence River, Section 1. Index Fishing Projects
77 Black crappie Catch per standard gillnet Bluegill Largemouth bass FIG Centrarchid catches per standard gillnet set in the Thousand Islands area of the St. Lawrence River, FIG Mean fork length (mm) of age-1 (square), age-3 (triangle) and age-5 (circle) Smallmouth Bass from 1997 to Dashed lines represent the average fork length from 1997 to 2017 for the aforementioned ages. TABLE Age distribution of selected species caught in the Thousand Islands, Year-class/Age Species Yellow Perch Walleye Northern Pike Smallmouth Bass TABLE Mean fork length (mm) of selected species caught in the Thousand Islands, Year-class/Age Species Yellow Perch Walleye Northern Pike Smallmouth Bass remain at the lowest level observed in this survey (Fig ). Bluegill, Largemouth Bass and Black Crappie were historically at much lower levels than the former three species, and remain so. While Largemouth Bass had a moderate increase over the last decade, the abundance in 2017 increased from the previous survey in 2015 (Fig ). Northern Pike remain at very low levels, reached after a slow steady decline spanning almost the entire history of the Thousand Islands survey (Fig ). Currently, Northern Pike abundance is at the lowest observed in this survey; roughly 5% of its peak observed in Condition as determined by mean lengths of age- 4, age-5 and age-6 Northern Pike has increased above the long-term average in the 2017 survey (Fig and Tables and 1.7.3). From the last survey in 2015, mean lengths at age-4, age-5 and age-6 Northern Pike increased 7%, 9% and 14% (respectively; Fig ). Section 1. Index Fishing Projects
78 70 6 Catch per standard gillnet FIG Northern Pike catch per standard gillnet set in the Thousand Islands area of the St. Lawrence River, FIG Mean fork length (mm) of age-4, age-5 and age-6 Northern Pike from 1997 to Dashed lines represent the average fork length from 1997 to 2017 for the aforementioned ages. Section 1. Index Fishing Projects
79 Credit River Chinook Salmon Spawning Index M.J. Yuille and J.P. Holden, Lake Ontario Management Unit The Credit River, below the Kraft Dam in Streetsville, has been the long-term sampling site for Chinook Salmon gamete collection. Chinook Salmon are captured during the fall spawning run at the beginning of October using electrofishing gear. LOMU staff have utilized the fish collections to index growth, condition and lamprey marking of Chinook Salmon. Weight and otoliths are collected from fish used in the spawn collection, which has the potential to be biased toward larger fish. To obtain a representative length sample of the spawning run, 50 fish per day were randomly selected, measured and check for clips prior to fish being sorted for spawn collection and detailed sampling. Detailed sampling included collecting data on length, weight, fin clips, coded-wire tag (CWT), lamprey marks and a subsample also had otoliths collected for age determination. Samples for the 2017 Chinook Salmon index were taken between October 10th 19th. Lengths were taken on 628 Chinook Salmon with detailed sampling occurring on 377 of these fish. Of the 628 Chinook Salmon selected for lengths, 45 (7.2%) Chinook Salmon were observed with an adipose clip. To increase the diversity of the Chinook Salmon egg collection, LOMU began collecting Chinook Salmon eggs and milt from the Ganaraska River in addition to the Credit River. Fish that were stocked into the Credit River that were collected from the Ganaraska River had their adipose removed prior to stocking. This allows LOMU staff to identify the stock origin (Credit River/Wild = adipose fin intact; Ganaraska = adipose removed/clip) of the mature Chinook Salmon in the Credit River during the spawn/egg collection. Stocking of Ganaraska River Chinook Salmon into the Credit River began in 2015, so fish observed with an adipose clip would be from the 2015 or 2016 stocking events (see Section 6.1). Of the 45 fish observed with an adipose clip, 29 were biologically sampled in detail. All fish were male and of the 29, 86% were from the 2016 stocking event (age- 1) and 14% were from the 2015 stocking event (age-2). In 2017, mean length of Chinook Salmon increased in age-2 males and females as well as age-3 males (Fig ). The mean length of age- 3 females declined slightly in 2017 (Fig ). The mean length of age-3 males (892 mm) 1100 Age-3 Female Age-2 Female 9.0 Female Age-3 Male Age-2 Male 8.5 Male Fork Length (mm) 900 Weight (kg) FIG Mean total length of age-2 and age-3 Chinook Salmon by sex, caught for spawn collection in the Credit River during the fall spawning run (approximately first week of October), FIG Condition index as the mean weight of a 914 mm / 36 inch (total length) Chinook Salmon in the Credit River during the spawning run (approximately first week of October), Section 1. Index Fishing Projects
80 72 increased from 2016 and is 1% below the long term average of 906 mm. Average length of age-3 females (859 mm) declined from 2016 and is 3% below the long-term mean (Fig ). Length of age-2 females (791 mm) and males (801 mm) increased from 2016 and both are now to at their respective long-term means (Fig ). The estimated weight (based on a log-log regression) of a 914 mm / 36 (total length) Chinook Salmon is used as an index of condition. In 2017, female condition was higher than 2016 values and has been increasing since 2015 (Fig ). A sharp decline in male condition was observed in 2017 (Fig ). Female condition in 2017 (7,910 g) is comparable to the average condition from 2007 to 2016 (7,796 g). Male condition (7,317 g) declined 8% and is 2% below the average condition over the past 10 years ( ). It should be noted that the absolute difference between maximum and minimum condition for female (1995 and 2007) and male (1995 and 2012) Chinook Salmon in this time series is 1,020 g and 1,280 g (respectively). Section 1. Index Fishing Projects
81 Juvenile Chinook Salmon Assessment M. J. Yuille, Lake Ontario Management Unit In recent years, the Lake Ontario Chinook Salmon Mass Marking Study indicated 40-60% of the Chinook Salmon in Lake Ontario originated from agency stocking programs and the remainder were of naturalized origin. In addition, many naturalized Chinook Salmon have been collected during electrofishing programs conducted in Lake Ontario tributaries. In 2014, a program was initiated to assess naturalized production of juvenile Chinook Salmon in Lake Ontario streams. This program was based on previous surveys conducted during spring 1997 to In 2017, modifications to the survey resulted in the sampling of six Lake Ontario tributaries, which included: Bronte Creek, Credit River, Duffins Creek, Wilmot Creek, Ganaraska River and Shelter Valley Creek. The Juvenile Chinook Salmon assessment program changed in Each of the six Lake Ontario tributaries were electrofished with the objectives of: providing presence/absence data regarding natural production of juvenile salmonids and collecting Chinook Salmon smolts for otolith microchemistry research. At a coarse level, this technique may be used to distinguish between stocked and naturalized fish based on the chemical composition of the otolith, allowing us to track the contribution of naturalized fish to the Lake Ontario recreational fishery without the need of fin clips. Once refined, this technique may allow the Lake Ontario Management Unit to determine which tributaries naturally produced salmon and trout originate. During 2017, juvenile Chinook Salmon were surveyed by electrofishing in six Lake Ontario tributaries (Table 1.9.1). The survey took place on three days during May 3rd to May 17th, With the exception of Shelter Valley Creek, only one site was visited per tributary. Age-0 Chinook Salmon were caught in all six tributaries visited (Table 1.9.1). Yearling Rainbow Trout as well as Age-0 and yearling Coho Salmon were observed at Wilmot Creek and Shelter Valley Creek. Age-0 Brown Trout were observed at the Credit River and Wilmot Creek. A single yearling Atlantic Salmon was observed on the Ganaraska River. This fish is a result of stocking yearling Atlantic Salmon up river from the electrofishing location prior to the Juvenile Chinook Salmon assessment program being conducted. In 2017, field crews targeted Chinook Salmon smolts for the otolith microchemistry project, thus only observed catches of salmon and trout have been reported (Table 1.9.1). The otoliths from these fish provide a microchemical baseline representing the tributary in which they were collected. Results will be made available in the following years. Year to year variability in abundance of Chinook Salmon in Lake Ontario streams is still not well understood. Moreover, a widespread increase in Chinook Salmon abundance across streams may be consistent with ecosystem changes in Lake Ontario over the last 20 years. Assessment of naturalized Chinook Salmon production in streams should provide additional insights into wild and naturalized fish production. Additionally, this program is providing essential baseline information for the development of a new assessment technique that will aid in estimating Chinook Salmon natural production in Lake Ontario. TABLE Location, sampling date and catch by species of fish in Lake Ontario tributaries during electrofishing surveys in Coho salmon Chinook salmon Rainbow trout Atlantic salmon Brown trout Site Latitude Longitude Date Age-0 1+ Age-0 1+ Age-0 1+ Age-0 1+ Age-0 1+ Bronte Creek BN ' ' May Credit River CR ' ' May Duffins Creek DU ' ' May Wilmot Creek WM ' ' May Ganaraska River GN ' ' May Shelter Valley Cr. SE ' ' May SE ' ' May Section 1. Index Fishing Projects
82 Lake Ontario Spring Prey Fish Trawling J. P. Holden, Lake Ontario Management Unit B.C. Weidel, Lake Ontario Biological Station, USGS M.J. Connerton, Cape Vincent Fisheries Station, NYSDEC Since 1978 the New York State Department of Environmental Conservation (NYSDEC) and the U.S. Geological Survey (USGS) have annually conducted bottom trawl tows, primarily in US waters in early spring, to provide an index of Alewife abundance as well as biological attributes such as age distribution and body condition. As the dominant prey species in Lake Ontario, understanding Alewife abundance and age structure is important for assessing predator/prey balance and establishing safe stocking levels of predator species (i.e. Chinook Salmon, Lake Trout). Since 2016, the survey has been expanded to Canadian waters with the Ontario Ministry of Natural Resources and Forestry (MNRF) trawling a portion of the Canadian sites. Trawling at Hamilton and shallow Toronto sites was conducted by the USGS, while deep Toronto sites, Oshawa, Cobourg, Prince Edward County, and in the Kingston Basin were sampled by MNRF (Fig ). A total of 204 sites conducted throughout the lake were sampled in 2017 (69 in Canadian waters, 135 in US waters) spanning bottom depths from 8-225m ( ft) between April 2th and May 27th. The increased effort in Canadian waters in 2017 (69 compared to 46 in 2016) is a result of 4 new transects being added (indicated by solid fill in Fig ). The survey generally samples depths in proportion to the lake area however there are differences in how those samples are distributed between jurisdictions. The south shore has well distributed coverage as most depths between m can be surveyed at each transect. Bottom trawling along the north shore is less uniform due to a lack of suitable trawl sites at shallower depths. Attempts to trawl at depths shallower than 80m at the current sites have consistently resulted in snags and torn trawl nets. During the day, in early spring, most Lake Ontario Alewife are found near the lake bottom in the warmer, deeper water (75 m 150 m) thus trawl sites at depths greater than 80 m provide suitable index sites for Alewife. Additionally, shallow tows (<40 m) in Ontario waters occur disproportionately in FIG Geographic distribution of trawl sites conducted by MNRF, USGS and NYSDEC. Solid fill indicates new transects added in TABLE Gear specifications for the polypropylene mesh bottom trawl referred to as 3N1, and equipped with rubber discs that elevate the footrope off bottom to minimize catches of dreissenid mussels. Component Headrope length Footrope length Codend mesh Gear height Fishing width Cookie sweep description Door weight Door area 0.93 m 2 Door height 1.2 m Description 20 m 22 m 15.2 mm knotless nylon 3.5 m 7 m Composed of 100 mm diameter rubber discs that sit 0.3 m below the footrope 125 kg the Kingston Basin. Efforts continue to identify suitable trawl locations along the north shore portion of the main Lake. All vessels followed a standard trawl protocol that utilized a polypropylene mesh bottom trawl referred to as 3N1 (see Table for trawl dimensions) equipped with rubber discs that elevate the footrope off bottom to minimize catches of dreissenid mussels. NYSDEC and USGS vessels used USA Jet slotted, metal, cambered trawl doors (1.22 m x 0.75 m) while MNRF used comparable Thyborne doors to spread the trawl. Trawl mensuration gear was used to record door spread, bottom time and Section 1. Index Fishing Projects
83 75 headrope depth. A target of 10 min tow time was set for the survey although trawl times were reduced on transects with large catches, and total catches were standardized to the 10-minute tow time. Species diversity varied between sites and depths. Overall 19 species of fish were captured in the survey however 11 species were caught in five or fewer trawls. Alewife, Rainbow Smelt, and Round Goby were the most commonly encountered species occurring in 55, 54 and 40% of the trawls respectively. The ten most common species are listed in Table Frequency of occurrence (the proportion of trawls a species is observed in) however is highly influenced by species and depth (Fig ). Alewife were captured in 100% of the trawls conducted in depths >60 m. Similarly, Deepwater Sculpin were captured in depths <60 m but captured in all tows >140 m. Rainbow Smelt occur more frequently in shallow depths and Round Goby and Slimy Sculpin occupying intermediate depths but with a more patchy distribution (i.e. not captured in all tows in a depth bin). Overall Alewife dominate the catches making up 95% of the catch (by numbers, 93% by weight, Table ). Deepwater Sculpin, a species not captured throughout most of the time series except in recent years, was the second most abundant species in the survey, although, the expansion of the survey throughout the lake has primarily focused on adding deep sites and large, shallower areas such as the Bay of Quinte have not been sampled in this survey. TABLE Ten most common species caught during the 2017 spring bottom trawl survey. Species Number of trawl sites Percentage of sites Alewife % Rainbow Smelt % Round Goby 81 40% Deepwater Sculpin 73 36% Slimy Sculpin 35 17% Yellow Perch 30 15% Lake Trout 23 11% Threespine Stickleback 19 9% Lake Whitefish 4 2% Spottail Shiner 4 2% FIG Frequency of occurrence by depth for Alewife (Alew), Deepwater Sculpin (DwScul), Rainbow Smelt (RbSm), Round Goby (RGoby), and Slimy Sculpin (SlScul). TABLE Total catch and weight of the ten most abundant species caught during the 2017 spring bottom trawl survey. Species Total number caught Total weight (kg) caught Alewife 671,868 8,176 Deepwater Sculpin 13, Round Goby 12, Rainbow Smelt 6, Yellow Perch Slimy Sculpin Trout-perch Spottail Shiner Threespine Stickleback Lake Trout Section 1. Index Fishing Projects
84 Lake Ontario Fall Benthic Prey Fish Trawling J. P. Holden, Lake Ontario Management Unit B. C. Weidel Lake Ontario Biological Station, USGS M. J. Connerton Cape Vincent Fisheries Station, NYSDEC The Lake Ontario offshore prey fish community was once a diverse mix of pelagic and benthic fish but by the 1970s the only native fish species that remained abundant was Slimy Sculpin. Recent invasions of Dressenid mussels and Round Goby have further changed the offshore fish community. The Lake Ontario Fall Benthic Prey Fish Assessment provides an index of how prey fish abundance, distribution and species composition has adapted through time in response to environmental change and species invasions. A benthic prey fish assessment in the main basin of Lake Ontario has historically only been conducted by the US Geological Survey (USGS). The survey assessed prey fish along six southernshore, US transects in depths from m. However, the restricted geographic and depth coverage prevented this survey from adequately informing important benthic prey fish dynamics at a whole-lake scale, including monitoring the reappearance of Deepwater Sculpin. In 2015, this program was expanded to include additional trawl sites conducted by MNRF and New York Department of Environmental Conservation (NYSDEC). This section will emphasize lake wide results and species specific trends are reported in the Status of Stocks section of this report (Section 7.6). The 2017 survey consisted of 137 trawls conducted from September 25 through October 12 throughout the entire lake (Fig ). The survey generally samples depths in proportion to the lake area however there are differences in how those samples are distributed between jurisdictions. Shallow tows (<40 m) in Ontario waters are largely confined to the Kingston Basin and were not conducted in Efforts continue to find suitable trawl locations along the north shore portion of the main lake to improve the spatial coverage of this survey. All vessels used a similar trawl (3/4 Yankee Standard, See Table for specifications) however doors varied between Fig Geographic distribution of trawl sites conducted by MNRF, USGS and NYSDEC. Filled shapes indicate new survey sites in vessels. Depth loggers and wing sensors were used on all trawls to provide estimates of true bottom time and net opening in order to standardize catches between vessels. Overall 25 fish species were captured in the survey however 13 species were encountered in five or fewer trawls. The sites with the greatest species diversity (max. = 12 species) were all near shore areas (bottom depth < 20 m) (Fig ). Alewife was the most common species encountered in catches (82% of trawls) followed by Rainbow Smelt (55%), Round Goby (55%), Deepwater Sculpin (47%) and Slimy Sculpin (35%) (Table ). Deepwater Sculpin, a species not detected in Lake Ontario for much of the current assessment era, was the most abundant species captured (by number of fish) followed by Round Goby, Alewife, Rainbow Smelt and Troutperch (Table ). The survey however does conduct more tows in deep water than shallow waters and avoids rocky areas that especially Round Goby are thought to inhabit at higher density. While not caught in as great of numbers compared to spring trawling (Section 1.10), Alewife are caught in a greater proportion of the nets and across a broader range of depths (Fig ). The distribution across a wider depth range is in part explained by a strong relationship Section 1. Index Fishing Projects
85 77 TABLE The ten most common species captured in the fall trawl survey. Species Number of Trawl Sites Percentage of Sites Alewife % Rainbow Smelt 76 55% Round Goby 76 55% Deepwater Sculpin 65 47% Slimy Sculpin 48 35% Lake Trout 18 13% Yellow Perch 18 13% White Perch 9 7% White Sucker 8 6% Carp 7 5% between size and depth (Fig , left panel) with small fish, including young-of-the-year, occurring in shallower depths (< 50 m). Deepwater Sculpin also exhibit a strong relationship with depth where larger fish occur at greater depths (Fig , right panel). TABLE The ten most abundant species captured in the fall trawl survey. Species Total number Caught Total weight (kg) caught Deepwater sculpin 15, Round goby 10, Alewife 6, Rainbow smelt 1, Trout-perch 1, Slimy sculpin 1, White perch Yellow perch Threespine stickleback White sucker FIG Frequency of occurrence by depth for Alewife (Alew), Deepwater Sculpin (DwScul), Rainbow Smelt (RbSm), Round Goby (RGoby), and Slimy Sculpin (SlScul). FIG Species diversity per trawl site. Points are scaled to number of species caught ranging from 1 to 12 species at the most diverse site. Section 1. Index Fishing Projects
86 78 FIG Mean individual weight of Alewife (Alew) and Deepwater Sculpin (DwScul) by bottom depth. Trend line is a loess fit. Section 1. Index Fishing Projects


87 Ganaraska River Fish Counter M.J. Yuille Lake Ontario Management Unit, MNRF Lake Ontario is home to a multi-million dollar recreational salmon and trout fishery and its tributaries provide spawning habitat to several migratory salmon and trout species, such as, Rainbow Trout, Brown Trout, Chinook Salmon and Coho Salmon. In the spring of 2016, the Lake Ontario Management Unit purchased new in-river fish counting technology to assess salmon and trout activity in the Ganaraska River fishway, Corbett Dam, Ganaraska River, Port Hope (Fig ). Understanding migration timing and patterns of these species is critical to evaluate the success of restoration efforts and to determine potential overlap between species when using FIG VAKI Riverwatcher fish counter and frame custom designed for the Ganaraska Fishway. essential spawning and nursery areas. Monitoring and counting these fish during their spawning migration provides LOMU with an index of the species population status in Lake Ontario. This fish counter technology (known as the Riverwatcher) automatically counts fish as they pass through the counting tunnel and records both a silhouette image and short, high resolution video for each individual fish (Fig ). The Riverwatcher was installed on March 28th, 2017 and continued to count fish through to November 8th, In this time, a total of 20,697 fish were observed moving upstream through the Ganaraska fishway (Fig ). This number is a conservative estimate. During periods of heavy rainfall river flows increased, making the water cloudy. As the water became less clear, the light from the infrared counting sensors could not penetrate through the water, thus fish could not be counted. During these periods of high flow and turbid water, we did not have the capacity to count fish as they moved through the fishway. Additionally, there were occasions throughout the monitoring period where the volume of fish moving through the fish counter exceeded the system s ability to count them individually. Calibration of the system using manual hand counts was initiated in 2017 and will be the focus of the 2018 season, to provide estimates of fish missed during these periods of high turbidity and FIG Silhouette and video image collected by the Riverwatcher fish counter, which automatically counts and lengths each fish as well as provides LOMU staff the opportunity to identify the fish species. Section 1. Index Fishing Projects
88 80 Fish Counted Fish Counted (X 100) (a) (b) Apr-01 Apr-15 May-01 May-15 FIG (a) Daily and (b) cumulative observed fish counts at the Ganaraska River fishway at Port Hope, Ontario from March 28th to November 8th, high fish volume. April 11th, 2017 marked the most active day on the fishway with a total of 1,228 Rainbow Trout observed migrating upstream through the Riverwatcher. In the fall, October 1st, 2017 recorded the most fish migrating upstream through the Riverwatcher with 877 salmon and trout (Figs and ). Throughout the monitoring period, data on Rainbow Trout, Chinook Salmon, Coho Salmon and Brown Trout were collected. The following paragraphs provide species specific observations. Rainbow Trout Jun-01 Jun-15 Jul-01 All Fish A total of 8,897 Rainbow Trout were identified migrating upstream through the Ganaraska Fishway from March 26th to November 8th, The spring Rainbow Trout run constitutes 78% of the total number of Rainbow Trout counted in For more information on the spring Rainbow Trout run, see Section marks the first year that the fishway has been monitored throughout the spring summer and fall seasons. A total of 1,945 Rainbow Trout migrated upstream through the Ganaraska Fishway after the spring run (Fig ). The majority of Rainbow Trout using the fishway in the fall were observed after both Chinook and Coho Salmon runs had subsided (Fig ). Jul-15 Date Aug-01 Aug-15 Sep-01 Sep-15 Oct-01 Oct-15 Nov-01 Nov-15 Fish Counted Apr-01 Apr-15 May-01 May-15 Chinook Salmon Jun-01 Jun-15 Jul-01 Jul-15 All Fish Coho Chinook Rainbow Brown Aug-01 Aug-15 Sep-01 Sep-15 Oct-01 Oct-15 Nov-01 Nov-15 FIG Daily counts of each species of salmon and trout observed migrating through the Ganaraska River fishway at Port Hope, Ontario from March 28th to November 8th, Fish Counted Fish Counted (X 100) (a) (b) Apr-01 Apr-15 May-01 May-15 Jun-01 Jun-15 Jul-01 Rainbow FIG (a) Daily and (b) cumulative observed counts of Rainbow Trout at the Ganaraska River fishway at Port Hope, Ontario from March 28th to November 8th, A total of 8,646 Chinook Salmon were identified migrating upstream through the Riverwatcher in The first Chinook Salmon was observed June 4th, 2017, however 92% of the run occurred between September 1st to October 10th, 2017 (Fig ). Staff sampled a total of 475 Chinook Salmon from October 2nd to October 18th, From the total, 60 fish were sampled in detail and the ages of these Chinook Salmon were interpreted from otoliths. Using this information, an age-length-key was created to assign ages to the remaining 415 Chinook Salmon. Through this process it was determined Jul-15 Date Aug-01 Aug-15 Sep-01 Sep-15 Oct-01 Oct-15 Nov-01 Nov-15 Section 1. Index Fishing Projects
89 81 that the 2017 fall Chinook run was comprised of 9% age-1 (all male), 36% age-2 (73% male and 27% female), 51% age 3 (50% male and 50% female) and 4% age-4 (all female; Fig ). In 2017, the average weight for age-2 males and females was 5,326 g and 6,807 g (respectively) and the average weight for age-3 males and females was 7,153 g and 7,865 g (respectively). Proportion Age-1 Age-2 Age-3 Age-4 Coho Salmon 20 The first Coho Salmon observed at the Ganaraska Fishway in 2017 was on August 19th. From that time, 1,325 Coho Salmon were identified moving upstream from the Corbett Dam (Fig ). The last Coho Salmon observed moving through Corbett Dam was on November 4th, There were three pulses of Coho Salmon, occurring over a few days in early September, mid-september and early October (Fig ). Brown Trout The first Brown Trout observed at the Ganaraska Fishway in 2017 was on May 30th. From that time, 149 Brown Trout were identified moving upstream from the Corbett Dam (Fig ). The last Brown Trout observed moving through Corbett Dam was on October 22nd, Of the Brown Trout identified passing through the fishway, the majority were observed in mid-july and early October (Fig ) (a) Chinook FIG Age distribution for Chinook Salmon (males and females pooled) sampled during the fall Ganaraska River Chinook Salmon Egg Collection, Ganaraska fishway at Port Hope, Ontario Fish Counted Fish Counted (X 100) (a) (b) Sep-01 Sep-15 Coho FIG (a) Daily and (b) cumulative observed counts of Coho Salmon at the Ganaraska River fishway at Port Hope, Ontario from August 19th to November 4th, Date Oct-01 Oct-15 Nov-01 Fish Counted Fish Counted (a) Brown 100 (b) 0 Fish Counted (X 100) Jun-01 Jun-15 Jul-01 Jul-15 Aug-01 Aug-15 Date FIG (a) Daily and (b) cumulative observed counts of Chinook Salmon at the Ganaraska River fishway at Port Hope, Ontario from June 4th to November 4th, Sep-01 Sep-15 Oct-01 Oct-15 Nov-01 Fish Counted (b) Jun-01 Jun-15 Jul-01 Jul-15 Aug-01 FIG (a) Daily and (b) cumulative observed counts of Brown Trout at the Ganaraska River fishway at Port Hope, Ontario from March May 30th to October 22nd, Aug-15 Date Sep-01 Sep-15 Oct-01 Oct-15 Section 1. Index Fishing Projects
90 82 2. Recreational Fishery 2.1 Fisheries Management Zone 20 Council (FMZ20) / Volunteer Angling Clubs C. Lake, Lake Ontario Management Unit Fisheries Management Zone 20 (FMZ20) Council provides recommendations to the Lake Ontario Manager regarding the management of the Lake Ontario recreational fishery. The FMZ 20 Council has spent many hours reviewing information, attending meetings, listening to issues, discussing options and providing advice. Some of the topics the council discussed in 2017 included: Northern Pike harvest management in the Bay of Quinte, adult Walleye harvest assessment in eastern Lake Ontario, and Largemouth and Smallmouth Bass angling seasons. Many of our volunteer clubs (councilaffiliated and others) also help with the physical delivery of several management programs. Multiple clubs help with planning and implementation of Lake Ontario s net pen rearing initiatives for Chinook Salmon (Section 6.2). Others help with the annual delivery of our stocking program through the operation of community based hatcheries. The Napanee Rod and Gun Club helps MNRF meet its stocking targets by rearing Brown Trout. The Credit River Anglers stock Rainbow Trout and Coho Salmon. The Metro- East Anglers, through their operation of the Ringwood hatchery, help the province meet its Rainbow Trout, Brown Trout, Atlantic Salmon, and Coho Salmon targets. Volunteers at the Ganaraska River-Corbett Dam Fishway assist MNRF staff install, maintain and operate the new fish counter. Numerous anglers / clubs also participate regularly by supplying catch and harvest information in our volunteer angler diary programs. Section 2. Recreational Fishery
 until December 10, 2017.")
91 Bay of Quinte Open-water Angling Survey J. A. Hoyle, Lake Ontario Management Unit The Bay of Quinte open-water recreational angling fishery was monitored from May 6 (Walleye angling opening-weekend ) until December 10, The last sampling day was December 3 but volunteer angler diaries (see Section 2.3) indicated that angling continued until December 10. A roving survey design was employed from Trenton to Lake Ontario ( upper gap ; Fig ). Angling effort was measured using on-water fishing boat activity counts. Boat angler interviews provided information on catch/ harvest rates and biological characteristics of the harvest. The survey consisted of sampling four days per week (two weekdays and both weekend days). Sampling was stratified by geographic area (18 areas; Fig ), season (five seasons: (1) May 6-7, (2) May 8-Jun 16, (3) Jun 17-Aug 13, (4) Aug 14-Oct 15 and (5) Oct 16-Dec 10, and day-type (weekdays and weekend days). A total of 4,281 anglers in 1,919 boats were interviewed by field crews during the survey (Table 2.2.1). Thirty-three percent of anglers interviewed were local, 59% were from Ontario (outside the local area), 4% were from elsewhere in Canada, and 4% were from the US. Total angling effort was estimated to be 279,005 angler hours for all anglers. Anglers caught 24 different species (Table 2.2.2). Eighty percent of anglers indicated that they were targeting Walleye, 23% were targeting Largemouth Bass, 7% were targeting Yellow Perch, and 5% were targeting Northern Pike. Fishing effort was 219,731 hours for anglers targeting Walleye, 64,649 hours for anglers targeting Largemouth Bass, 18,616 for anglers targeting Yellow Perch, and 14,627 for anglers targeting Northern Pike (Table and FIG Map of the Bay of Quinte showing angling survey areas. Section 2. Recreational Fishery
92 84 TABLE Total estimated angling effort (angler hours), number of boats checked and anglers interviewed, number of anglers per boat, and number of rods per angler for the open-water recreational fishery on the Bay of Quinte, Note that the use of 2-lines is only permitted east of Glenora (survey areas 90, 89, 88, 87, 86, 85; Fig ). Total angling effort (hours) 279,006 Number of boats checked 1,919 Number of anglers interviewed 4,281 Anglers per boat 2.23 Rods per angler 1.10 Table 2.2.3). Numbers of Walleye caught and harvested were 102,351 and 52,651 respectively. Numbers of Walleye caught and harvested per hour by anglers targeting Walleye were and 0.239, respectively. Numbers of Largemouth Bass caught and harvested were 36,997 and 8,580 respectively. Numbers of Largemouth Bass caught and harvested per hour by anglers targeting Largemouth Bass were and respectively. Anglers also caught 261,747 Yellow Perch, 5,027 Northern Pike and 28,160 White Perch (Table 2.2.2). TABLE Species-specific statistics for the open-water recreational fishery on the Bay of Quinte, Statistics shown are: targeted angling effort (angler hours), proportion of anglers targeting each species, catch and harvest by all anglers, proportion of catch caught by anglers targeting that species, proportion of fish kept, and the number of fish caught per angler hour (CUE) by anglers targeting that species. Angler effort Catch Species Hours Prop targeted Catch Prop targeted Harvest Prop kept CUE Longnose Gar Bowfin Alewife Gizzard Shad Chinook Salmon Brown Trout Lake Trout Lake Whitefish Northern Pike 14, , Common Carp Catfish , Brown Bullhead Channel Catfish White Perch 2, , , White Bass - 1, Sunfish ,379-1, Rock Bass , Pumpkinseed , Bluegill , Smallmouth Bass 5, , Largemouth Bass 64, , , Black Crappie Yellow Perch 18, , , Walleye 219, , , Round Goby Freshwater Drum 2, , Section 2. Recreational Fishery
93 85 TABLE Angling statistics for Walleye and Largemouth Bass by season surveyed during the open-water recreational fishery on the Bay of Quinte, "Targeted" statistics refer to anglers targeting the indicated species (Walleye or Largemouth Bass). Angling Statistic May 6-7 May 8- Jun 16 Season Jun 17- Aug 13 Aug 14- Oct 15 Oct 16- Dec 10 Total Walleye: Catch by All Anglers 1,783 53,627 34,833 7,857 4, ,351 Catch by Targeted Anglers 1,783 53,540 33,858 7,851 4, ,211 Harvest by All Anglers 1,276 24,401 19,781 4,657 2,536 52,651 Harvest by Targeted Anglers 1,276 24,314 19,715 4,657 2,497 52,460 Targeted Effort (angler hours) 12,477 77,462 55,463 39,333 34, ,731 Targeted Effort (rod hours) 12,477 77,497 55,463 43,292 48, ,976 All Effort (angler hours) 12,629 78,281 91,901 55,729 40, ,006 Targeted CUE All Anglers CUE Targeted HUE All Anglers HUE Largemouth Bass: Catch by All Anglers ,270 6,250 2,615 36,997 Catch by Targeted Anglers ,601 6,019 2,615 34,311 Harvest by All Anglers - - 5,387 1,386 1,806 8,580 Harvest by Targeted Anglers - - 5,126 1,386 1,806 8,319 Targeted Effort (angler hours) ,577 16,508 5,189 64,649 Targeted Effort (rod hours) ,577 16,694 4,571 64,216 All Effort (angler hours) 12,629 78,281 91,901 55,729 40, ,006 Targeted CUE All Anglers CUE Targeted HUE All Anglers HUE The seasonal and regional patterns of Walleye and Largemouth Bass angling effort are depicted in Fig and Fig Targeted Walleye angling is highest in May and June. Most Walleye angling effort occurs in the upper and middle regions of the Bay of Quinte but a spike in effort also occurs in the lower Bay from mid-october through December (Fig ). Some Walleye angling effort also occurs in August and September in Lake Ontario (area 85). Targeted Largemouth Bass angling is highest from June through August in the upper Bay of Quinte (Fig ). The size distributions of Walleye, Largemouth Bass and Yellow perch harvested by anglers and sampled by field crews are shown in Fig The size distribution (three categories: less than 19 inches total length, 19 to 25 inches and greater than 25 inches) reported to be released by anglers is shown in Fig The age distributions of Walleye and Largemouth Bass sampled are shown in Fig Age-2 and 3 year -old Walleye (2015 and 2014 year-classes respectively) dominated the harvest. Eleven percent of anglers interviewed after mid-october reported that they were participants in the Bay of Quinte Volunteer Angler Diary Program (see Section 2.3). Open-water angling fishery trend statistics from are shown graphically in Fig and from in Table Section 2. Recreational Fishery
94 86 Number of fish Number of fish Walleye n = Total length (inches) Largemouth Bass n = 96 FIG Targeted Walleye angling effort (hours, upper panel; hours per day, lower panel) by season and region surveyed in the open-water recreational fishery on the Bay of Quinte, 2017 (regions include the survey areas indicated in Fig as follows: Upper = 29, 30, 31, 32, 33, 34, 95, 96; Middle = 91, 92, 93, 94; Lower = 88, 89, 90; Lake = 85, 86, 87; note that the Lake areas were only sampled in season 4). Number of fish Total length (inches) Yellow Perch n = Total length (inches) FIG Size distributions of Walleye (n=706), Largemouth Bass (n=96) and Yellow Perch (n=157) sampled during the open-water recreational fishery on the Bay of Quinte, Number released n = 1483 Lake Lower Middle Upper FIG Targeted Largemouth Bass angling effort (hours, upper panel; hours per day, lower panel) by season and region surveyed in the open-water recreational fishery on the Bay of Quinte, 2017 (regions include the survey areas indicated in Fig as follows: Upper = 29, 30, 31, 32, 33, 34, 95, 96; Middle = 91, 92, 93, 94; Lower = 88, 89, 90; Lake = 85, 86, 87; note that the Lake areas were only sampled in season 4). 0 <19 inches inches >25 inches Size-class (total length) FIG Size distribution of Walleye (n=1,483; three size categories: less than 19 inches total length, 19 to 25 inches and greater than 25 inches) reported top be released by anglers during the open-water recreational fishery on the Bay of Quinte, Also depicted is the survey areas where the Walleye were sampled as follows: Upper is survey areas 29, 30, 31, 32, 33, 34, 95, 96; Middle is areas 93, 94, 92, 91; Lower is areas 90, 89, 88; and Lake is areas 86, 85 as illustrated in Fig Section 2. Recreational Fishery
95 87 Walleye Largemouth Bass Number of fish n = Age (years) Number of fish n = Age (years) FIG Age distributions of Walleye and Largemouth Bass sampled during the open-water recreational fishery on the Bay of Quinte, , ,000 Walleye catch (number) 300, , , , ,000 50,000 Released Harvested Effort 600, , , , , ,000 Angling effort (hours) FIG Trends in Walleye angling effort and catch (released and harvested), for the open-water recreational fishery on the Bay of Quinte. Section 2. Recreational Fishery
96 88 TABLE Bay of Quinte open-water angling fishery statistics, , including angling effort (angler hours), both for all anglers and targeted walleye anglers, walleye catch and harvest rates (number of fish per hour), walleye catch and harvest (number of fish), and the mean weight (kg) of harvested walleye. All anglers Walleye Anglers Total effort Effort Catch rate Harvest rate Catch Harvest Mean weight (kg) , , , , , , , , , , , , , , , , , , , , , , , , , , , , , , , , , , , , , , , , , , , , , , , , , , , , , ,875 96, , , , , , , ,672 82, , , ,489 52, , , ,562 33, , , ,004 22, , , ,512 28, , , ,813 17, , , ,706 34, , , ,155 24, , , ,031 25, , , ,966 36, , , ,710 24, , , ,208 27, , , ,370 15, , , ,211 52, Section 2. Recreational Fishery

97 Bay of Quinte Volunteer Walleye Angler Diary Program J. A. Hoyle, Lake Ontario Management Unit A volunteer angler diary program was conducted during late-summer and fall 2017 on the Bay of Quinte and eastern Lake Ontario. The diary program focused on the popular latesummer and fall recreational fishery for trophy Walleye, primarily on the middle and lower reaches of Bay of Quinte. Increasingly in recent years, a late summer fishery for mature Walleye occurs in the eastern Lake Ontario; this component of the fishery was also targeted for volunteer anglers. This was the sixth year of the diary program. Anglers that volunteered to participate were given a personal diary and asked to record information about their daily fishing trips and catch (see Fig ). A total of 23 diaries were returned as of February We thank all volunteer anglers for participating in the program. A map showing the distribution of volunteer addresses of origin is shown in Fig Objectives of the diary program included: engage and encourage angler involvement in monitoring the fishery; characterize fall Walleye angling effort, catch, and harvest (including geographic distribution); characterize the size distribution of Walleye caught (kept and released); characterize species catch composition. Three of the 23 returned diaries reported zero fishing trips. The number of fishing trips reported in each of the remaining 20 diaries ranged from two to 27 trips. Fishing trips were reported for 81 out of a possible 121 calendar days from Aug 12 to Dec 10, There were from one to eight volunteer angler boats fishing on each of the 81 days, and a total of 164 trip reports targeted at Walleye; 77 charter boat trips and 87 non-charter boat trips (Table 2.3.1). Of FIG Volunteer angler diary used to record information about daily fishing trips and catch. Section 2. Recreational Fishery

98 90 the 164 trips, 117 (68%) were made on Locations 2 and 3 (middle and lower reaches of the Bay of Quinte), and 54 trips (31%) were made in Location 4 (eastern Lake Ontario; see Fig ). The overall average fishing trip duration was 6.2 hours for charter boats and 6.0 hours for noncharter boats, and the average numbers of anglers per boat trip were 4.0 and 2.0 for charter and noncharter boats, respectively (Table 2.3.1). In Locations 3 and 4, where two lines are permitted, most anglers used two lines (1.8 rods per angler on average). Fishing Effort A total of 3,262 angler hours of fishing effort was reported by volunteer anglers (Table 2.3.2). The seasonal pattern of fishing effort is shown in Fig Most fishing effort occurred in Location 3 (42%; lower Bay) (Fig ). Location 4 (eastern Lake Ontario) showed increased fishing effort (20% of total effort) compared to previous years. Catch FIG Map showing the distribution of volunteer addresses of origin. Image courtesy of Google Earth. Seven species and a total of 703 fish were reported caught by volunteer anglers. The number of Walleye caught was 604; 350 (58%) kept and 254 (42%) released (Table 2.3.3). The next most abundant species caught was Freshwater Drum (58) followed by Northern Pike (9), White Bass (8), and Smallmouth Bass (8). Fishing Success The overall fishing success for Walleye in Table Reported total number of boat trips, average trip duration, and average number of anglers per trip for charter and noncharter Walleye fishing trips during fall on the Bay of Quinte. Year Trip type Total number of boat trips Average trip duration (hours) Average number of anglers per trip 2012 Charter Non-charter Charter Non-charter Charter Non-charter Charter Non-charter Charter Non-charter Charter Non-charter Section 2. Recreational Fishery
99 91 Table Reported total number of diaries (with at least one reported fishing trip), boat trips and effort, total angler effort, total number of Walleye caught, harvested, and released, average number of Walleye caught per boat fishing trip, average number of Walleye caught per boat hour, average number of Walleye caught per angler hour, and the "skunk" rate (percentage of trips with no Walleye catch) for Walleye fishing trips during fall on the Bay of Quinte. Year Statistic Number of diaries Number of boat trips Boat effort (hours) 1, ,375 1, ,001 Angler effort (hours) 5,915 3,093 5,164 5,266 1,602 3,262 Catch Harvest Released Fish per boat hour Fish per boat trip Fish per angler hour "Skunk rate" 36% 19% 27% 34% 44% 24% fall 2017 was 3.7 Walleye per boat trip or fish per angler hour of fishing (Table 2.3.2). Seventy-six percent of all boat trips reported catching at least one Walleye ( skunk rate 24%). Seasonal fishing success, for geographic Locations 2, 3 and 4 combined, is shown in Fig Success was highest in the second half of August through the first half of October, declined in the second half of October, and was high in the second half of November and early December (by angler hour). Fishing success was high in locations 2 (middle Bay; 4.2 Walleye per boat trip Boat trips FIG Seasonal breakdown (summarized by first and second half of each month from the first half of Aug to the first half of Dec) of fishing effort (boat trips and angler hours) reported by volunteer Walleye anglers during fall 2017 on the Bay of Quinte. Boat trips Boat trips (164) Angler effort (3,262 hours) Aug Sep Oct Nov Dec Boat trips (164) Angler effort (3,262 hours) Upper Bay Middle Bay Lower Bay Lake Ontario FIG Geographic breakdown of fishing effort (boat trips and angler hours) reported by volunteer Walleye anglers during fall 2017 on the Bay of Quinte ,600 1,400 1,200 1, Angler effort (hours) Angler effort (hours) TABLE Number of fish, by species, reported caught (kept and released) by volunteer anglers during the fall Walleye diary program, Species Kept Released Kept Released Kept Released Kept Released Kept Released Kept Released Longnose Gar Chinook Salmon Rainbow Trout Brown Trout Lake Trout Lake Whitefish Northern Pike White Perch White Bass Morone sp Sunfish Smallmouth Bass Largemouth Bass Yellow Perch Walleye Freshwater Drum Section 2. Recreational Fishery
100 92 or fish per angler hour) and 3 (lower Bay; 4.8 Walleye per boat trip or fish per angler hour). Length Distribution of Walleye Caught Ninety-five percent of Walleye caught by volunteer anglers were between 14 and 30 inches in total length (Fig ). Over the six years of the volunteer angler diary program 2,893 Walleye lengths have been reported (Fig ). The proportion of Walleye released was highest for smallest and largest fish and lowest for fish of intermediate size. Only 22% of fish caught that were between 16 and 25 inches were released. In contrast, 64% of fish less than 16 inches or greater than 25 inches were released. Catch per boat trip Catch per boat trip Catch per angler hour Aug Sep Oct Nov Dec FIG Walleye fishing success (catch per boat trip and per angler hour) reported by volunteer Walleye anglers in areas 2, 3 and 4 during fall 2017 on the Bay of Quinte (summarized by first and second half of each month from the first half of Aug to the first half of Dec) Catch per angler hour Number of fish Released Kept n= Total length (inches) FIG Length distribution of 589 Walleye caught (kept and released) by volunteer Walleye anglers during fall 2017 on the Bay of Quinte. Number of fish Released Kept Proportion released n=2, Proportion released Total length (inches) 0.0 FIG Length distribution of 2,304 Walleye caught (kept and released) by volunteer Walleye anglers during fall 2012 to 2017 on the Bay of Quinte. Also shown is the proportion of fish released (dotted line) Section 2. Recreational Fishery
101 Lake Ontario Chinook Salmon Tournament Sampling M. J. Yuille, Lake Ontario Management Unit Since 2010, the Lake Ontario Management Unit has been attending Lake Ontario fishing tournaments to sample Chinook Salmon throughout the summer. On average LOMU visits six tournaments a season and collects biological information on harvested angler caught fish. Initially, LOMU attended the tournaments to increase coded wire tag recovery during the Mass Marking Program (see Section 7.1). The program has continued as it provides insight into the age structure, condition and health of Lake Ontario salmon and trout throughout the summer months. With the exception of years when LOMU conducts the Western Basin Angler Survey (Section 7.1), these tournament sampling events provide the only window for viewing Chinook health and condition throughout the summer. In 2017, LOMU staff attended six tournaments (Table 2.4.1) and sampled 88 Chinook Salmon. The average total length and weight for a Chinook Salmon sampled in the 2017 tournaments was 824 mm (32 ) and 7,203 g (15.88 lbs), respectively (Table 2.4.2). The heaviest fish sampled by LOMU in the 2017 tournaments weighed 14,340 g (31.61 lbs). Chinook Salmon body condition was determined as the estimated weight (g) of a 914 mm (36 ) total length fish (Fig ). Overall, Chinook Salmon body condition declined from 2010 to 2014 to its lowest value in the time series (Fig ). Since 2014, Chinook Salmon body condition has increased to the highest value in the time series, which was observed in It should be noted that despite the variability observed from year to year, the absolute difference in body condition from 2010 to 2017 is 475 g (1 lb). The Lake Ontario Management Unit would like to thank all of the tournament organizers, volunteers and anglers involved in making this program a success over the past eight years. TABLE Tournaments attended by the Lake Ontario Management Unit in Date 03-Jun Jun Jun Jul Aug Tournament Strait Line Anglers Salmon Challenge 6th Annual Veteran's Salmon Derby Port Credit Pen Derby Bluffers Pen Tournament Bronte Pen Derby TABLE Summary of summer Chinook Salmon sampling on Lake Ontario, Year n Total Length (mm) Weight (g) Avg. Min. Max Weight (kg) FIG Body condition (estimated weight at 914 mm (36 ) total length) of Lake Ontario Chinook Salmon sampled through June to August, Section 2. Recreational Fishery
102 94 3. Commercial Fishery 3.1 Lake Ontario and St. Lawrence River Commercial Fishing Liaison Committee A. Todd and J.A. Hoyle, Lake Ontario Management Unit The Lake Ontario and St. Lawrence River Commercial Fishery Liaison Committee (LOLC) consists of Ontario Commercial Fishing License holders that are appointed to represent each of the quota zones, as well as representatives of the Ontario Commercial Fisheries Association, and MNRF. This committee provides advice to the Lake Ontario Manager on issues related to management of the commercial fishery and provides a forum for dialogue between the MNRF and the commercial industry. The committee met twice during 2017 (January 5 and October 26). Topics of discussion at these LOLC meetings included commercial harvest summaries, status of fish stocks (including Yellow Perch, Lake Whitefish, Sunfish, Walleye, and Black Crappie), quotas and pools, eel status and trap and transfer program, and Northern Pike harvest management. Section 3. Commercial Fishery
103 Quota and Harvest Summary J. A. Hoyle, Lake Ontario Management Unit Lake Ontario supports a commercial fish industry; the commercial harvest comes from the Canadian waters of Lake Ontario east of Brighton (including the Bay of Quinte, East and West Lakes) and the St. Lawrence River (Fig ). The waters west of Brighton (quota zone 1-8) currently have no commercial licences. Commercial harvest statistics for 2017 were obtained from the commercial fish harvest information system (CFHIS) which is managed, in partnership, by the Ontario Commercial Fisheries Association (OCFA) and MNRF. Commercial quota, harvest and landed value statistics for Lake Ontario, the St. Lawrence River and East and West Lakes, for 2017, are shown in Tables (base quota), (issued quota), (harvest) and (landed value). The total harvest of all species was 498,148 lb ($779,593) in 2017, up 59,322 lb (14%) from The harvest (landed value) for Lake Ontario, the St. Lawrence River, and East and West Lakes was 368,546 lb ($581,469), 88,751 lb ($153,247), and 40,851 lb ($49,824), respectively (Fig and Fig ). Yellow Perch, Lake Whitefish, Sunfish and Walleye were the dominant species in the harvest for Lake Ontario. Yellow Perch was dominant in the St. Lawrence River. Sunfish was the dominant fish in East and West Lakes. Major Fishery Trends Harvest and landed value trends for Lake Ontario and the St. Lawrence River are shown in Fig and Fig Having declined in the early 2000s, commercial harvest appeared to have stabilized over the time-period at about 400,000 lb and 150,000 lb for Lake Ontario (Fig ) and the St. Lawrence River (Fig ) respectively. In 2014, harvest declined FIG Map of Lake Ontario and the St. Lawrence River showing commercial fishing quota zones in Canadian waters. Section 3. Commercial Fishery
104 96 TABLE Commercial fish base quota (lb), by quota zone, in the Canadian waters of Lake Ontario and the St. Lawrence River, East and West Lakes (two Lake Ontario embayments), Lake Ontario St. Lawrence River East Lake West Lake Base Quota by Waterbody Species Lake Ontario St. Lawrence River Black Crappie 4,540 3,000 14,824 1, ,170 17,590 4,840 3,100 9,850 23,464 36,600 73,014 Bowfin Brown Bullhead Lake Whitefish 6,549 97,745 12,307 18, , ,883 Sunfish 28, ,600 18,080 28, ,810 Walleye 4,209 32, , , ,092 Yellow Perch 22,778 91,823 80,741 80, ,787 53,000 18, , , , ,651 Total 66, , , , ,957 70,590 22,888 18,596 30, , , ,450 Total TABLE Commercial fish issued quota (lb), by quota zone, in the Canadian waters of Lake Ontario and the St. Lawrence River, East and West Lakes (two Lake Ontario embayments), Lake Ontario St. Lawrence River East Lake West Lake Issued Quota by Waterbody Species Lake Ontario St. Lawrence River Black Crappie 2,270 1,500 10, ,085 8,795 4,840 3,100 9,850 14,758 20,720 48,428 Bowfin Brown Bullhead Lake Whitefish 2, ,797 7,628 10, , ,455 Sunfish 28, ,600 18,080 28, ,810 Walleye 2,523 10, , , ,373 Yellow Perch 15,085 51,853 84,568 80, ,441 48,701 18, , , , ,170 Total 50, , , , ,526 57,496 22,888 18,596 30, , , ,236 Total TABLE Commercial harvest (lb), by quota zone, for fish species harvested from the Canadian waters of Lake Ontario and the St. Lawrence River, East and West Lakes (two Lake Ontario embayments), Lake Ontario St. Lawrence River East Lake Species West Lake Lake Ontario Totals St. Lawrence River All Waterbodies Black Crappie , , ,890 4,963 2,109 9,962 Bowfin 0 0 3, ,258 1, ,113 2,836 6,976 Brown Bullhead , ,281 6, ,716 7,824 15,544 Common Carp ,237 6, , ,465 Freshwater Drum ,005 18, , ,379 Cisco ,546 1, , ,034 Lake Whitefish 0 66,348 1, , ,242 Northern Pike 4, ,018 1, , ,048 2,521 17,313 3,220 24,102 Rock Bass 2, ,206 1, , ,241 1,159 7,893 2,739 13,032 Sunfish 2, , , ,991 11,786 37,540 3,690 65,007 Walleye 565 1, , , ,741 White Bass , , ,569 White Perch ,979 2, ,310 7, ,814 White Sucker ,678 4, , ,307 Yellow Perch 4,226 8,349 54,879 47, ,661 27,427 16, , ,470 65, ,974 Total 15,366 77, , , ,654 33,361 23,736 15,833 25, ,546 88, ,148 Section 3. Commercial Fishery
105 97 TABLE Commercial harvest (lb), price per lb, and landed value for fish species harvested from the Canadian waters of Lake Ontario and the St. Lawrence River, and the total for all waterbodies including East and West Lakes, Species Lake Ontario Harvest Price per lb Landed value Seasonal whitefish harvest and biological attributes (e.g., size and age structure) information are reported in Section 3.3. Lake Whitefish priceagain in both major geographic areas. In 2015, harvest declined in the St. Lawrence River and increased slightly in Lake Ontario. Harvest increased significantly in both areas in 2016 and again in St. Lawrence River Harvest Price per lb Landed value All Waterbodies Harvest Price per lb Landed value Black Crappie 4,963 $3.25 $16,126 2,109 $2.66 $5,620 9,962 $3.05 $30,406 Bowfin 3,113 $0.35 $1,098 2,836 $0.67 $1,905 6,976 $0.53 $3,694 Brown Bullhead 7,716 $0.22 $1,693 7,824 $0.48 $3,778 15,544 $0.43 $6,706 Common Carp 10,020 $0.16 $1, $0.40 $116 10,465 $0.16 $1,651 Freshwater Drum 26,346 $0.11 $2, $0.10 $3 26,379 $0.11 $2,773 Cisco 3,014 $0.30 $ ,034 $0.30 $906 Lake Whitefish 68,242 $1.56 $106, ,242 $1.56 $106,703 Northern Pike 17,313 $0.30 $5,264 3,220 $0.37 $1,183 24,102 $0.30 $7,277 Rock Bass 7,893 $0.67 $5,261 2,739 $0.82 $2,243 13,032 $0.70 $9,178 Sunfish 37,540 $1.26 $47,233 3,690 $1.14 $4,207 65,007 $1.23 $79,867 Walleye 31,741 $2.66 $84, ,741 $2.66 $84,511 White Bass 7,568 $0.46 $3,484 1 $0.75 $1 7,569 $0.46 $3,493 White Perch 7,797 $0.46 $3, $0.40 $16 11,814 $0.49 $5,763 White Sucker 20,810 $0.11 $2, $0.11 $21 21,307 $0.11 $2,442 Yellow Perch 114,470 $2.61 $298,881 65,777 $2.04 $134, ,974 $2.37 $434,222 Total 368,546 $581,469 88,751 $153, ,148 $779,593 Quota was reduced 20% in 2017 in quota zones 1-1, 1-2, 1-4, 2-5, East and West Lakes, reduced 6% in quota zone 1-5, and left unchanged in quota zones 1-3 and 1-7. Harvest increased in 2017 in most quota zones (Fig ). Major Species For major species, commercial harvest relative to issued and base quota information, including annual trends, is shown in Fig to Fig Price-per-lb trends are also shown. Species-specific price-per-lb values are means across quota zones within a major waterbody (i.e., Lake Ontario and the St. Lawrence River). Yellow Perch Yellow Perch 2017 commercial harvest relative to issued and base quota by quota zone and total for all quota zones combined is shown in Fig Overall, 45% (182,975 lb) of the Yellow Perch base quota (402,651 lb) was harvested in 2017 up from only 28% harvested the previous year. The highest Yellow Perch harvest came from quota zones 1-3 and 1-4. Greater than 50% of base quota was harvested in five quota zones. Trends in Yellow Perch quota (base), harvest and price-per-lb are shown Fig Lake Whitefish Lake Whitefish 2017 commercial harvest relative to issued and base quota by quota zone and total for all quota zones combined is shown in Fig Overall, 51% (68,242 lb) of the Lake Whitefish base quota was harvested in Most of the Lake Whitefish harvest came from quota zone 1-2. Lake Whitefish is managed as one population across quota zones. Therefore, quota can be transferred among quota zones. Issued quota and harvest was significantly higher than base quota in quota zone 1-2 (Fig ). Relatively small proportions of base quota were harvested in quota zones 1-1, 1-3 and 1-4. Trends in Lake Whitefish quota (base), harvest and price-per-lb are shown in Fig Base quota remained unchanged in 2017 compared to In 2017, an additional 20% of base quota was issued to a pool on November 1. Section 3. Commercial Fishery
106 98 Lake Ontario Lake Ontario Lake Whitefish 18% Walleye 9% Sunfish 10% Yellow Perch 31% Freshwater Drum 7% White Sucker 6% Other 14% Total harvest: 368,546 lb Northern Pike 5% Common Carp 3% Rock Bass 2% White Perch 2% Other 7% Lake Whitefish 18% Yellow Perch 51% Walleye 15% Sunfish 8% Black Crappie 3% Other 3% Total value: $581,469 Northern Pike 1% Rock Bass 1% White Perch 1% White Bass 1% Freshwater Drum 0% Other 1% Brown Bullhead 9% St. Lawrence River Northern Pike 4% Sunfish 4% Bowfin 3% Rock Bass 3% Black Crappie 3% St. Lawrence River Black Crappie 4% Brown Bullhead Sunfish 2% Rock Bass 3% 1% Bowfin 1% Northern Pike 1% Yellow Perch 74% Common Carp 0% White Sucker 0% White Perch 0% Other 0% Yellow Perch 88% Other 0% Common Carp 0% White Sucker 0% White Perch 0% Other 0% Total harvest: 88,751 lb Total value $153,247 Northern Pike 9% White Perch 10% East Lake and West Lake Black Crappie 7% Sunfish 58% Yellow Perch 7% Other 1% Rock Bass 6% Bowfin 2% White Sucker 1% Common Carp 0% Cisco 0% Other 0% Black Crappie 18% East Lake and West Lake Sunfish 59% Yellow Perch 13% White Perch 4% Rock Bass 3% Northern Pike 2% Other 0% Bowfin 1% White Sucker 0% Common Carp 0% Cisco 0% Brown Bullhead 0% Total harvest: 40,851 lb Total value: $49,824 FIG Pie-charts showing breakdown of 2017 commercial harvest by species (% by weight) for Lake Ontario (quota zones 1-1, 1-2, 1-3, 1-4 and 1-8), the St. Lawrence River (quota zones 1-5, 2-5 and 1-7), and for East and West Lakes combined. per-lb increased somewhat in 2017 compared to Walleye Walleye 2017 commercial harvest relative to issued and base quota by quota zone and total for all quota zones combined is shown in Fig Walleye harvest increased in Overall, 66% (31,741 lb) of the Walleye base quota (48,092 lb) was harvested. The highest Walleye harvest came from quota zone 1-4. Very FIG Pie-charts showing breakdown of 2017 commercial harvest by species (% by landed value) for Lake Ontario (quota zones 1-1, 1-2, 1-3, 1-4 and 1-8), the St. Lawrence River (quota zones 1-5, 2-5 and 1-7), and for East and West Lakes combined. small proportions of base quota were harvested in quota zones 1-1 and 1-2. Walleye (like Lake Whitefish) is managed as one fish population across quota zones. Therefore, quota can be transferred among quota zones 1-1, 1-2 and 1-4. In 2017, this resulted in issued quota and harvest being considerably higher than base quota in quota zone 1-4 (Fig ). Trends in Walleye quota (base), harvest and price-per-lb are shown in Fig Quota has remained constant since the early 2000s (just under 50,000 lb for all quota zones combined). Section 3. Commercial Fishery
107 99 1,600,000 Lake Ontario $1,600,000 1,400,000 1,200,000 Harvest Value $1,400,000 $1,200,000 Harvest (lb) 1,000, , ,000 $1,000,000 $800,000 $600,000 Value ($) 400,000 $400, ,000 $200,000 - $ FIG Total commercial fishery harvest and value for Lake Ontario (Quota Zones 1-1, 1-2, 1-3,1-4 and 1-8) ,000 St. Lawrence River $500, , ,000 Harvest Value $450,000 $400,000 Harvest (lb) 350, , , , ,000 $350,000 $300,000 $250,000 $200,000 $150,000 Value ($) 100,000 $100,000 50,000 $50,000 - $ FIG Total commercial fishery harvest and value for the St. Lawrence River (Quota Zones 1-5, 2-5 and 1-7), Walleye price-per-lb has been trending higher for the last number of years. Black Crappie Black Crappie 2017 commercial harvest relative to issued and base quota by quota zone and total for all quota zones combined is shown in Fig Overall, only 14% (9,962 lb) of the Black Crappie base quota (73,314) was harvested in The highest Black Crappie harvest came from quota zones 1-3 and West Lake. Only a very small proportion of base quota was harvested in other quota zones. Trends in Black Crappie quota (base), harvest and price-per-lb are shown in Fig Black Crappie harvest has been trending down the Section 3. Commercial Fishery
108 100 Harvest/Quota (lb) 450, , , , , , , ,000 50,000 0 Yellow Perch 87% 182,974 Total 45% 52% Harvest/Quota (lb) 100,000 90,000 80,000 70,000 60,000 50,000 40,000 30,000 20,000 10,000 0 Yellow Perch Base Quota Issued Quota Harvest East Lake West Lake Lake Ontario St. Lawrence River Inland Lakes FIG Yellow Perch commercial harvest relative to issued and base quota (total for all quota zones combined; left panel) and by quota zone (right panel), ,000 Quota Zone 1-2 Yellow Perch ,000 Quota Zone 1-5 Yellow Perch 3.00 Quota or Harvest (lb) 180, , , , ,000 80,000 60,000 40, , Price per lb ($) Quota or Harvest (lb) 70, , ,000 40,000 30, , , Price per lb ($) Harvest Quota Price-per-lb Harvest Quota Price-per-lb 120,000 Quota Zone 1-3 Yellow Perch ,000 Quota Zone 2-5 Yellow Perch 3.00 Quota or Harvest (lb) 100,000 80,000 60,000 40,000 20, Price per lb ($) Quota or Harvest (lb) 100,000 80,000 60,000 40,000 20, Price per lb ($) Harvest Quota Price-per-lb Harvest Quota Price-per-lb 140,000 Quota Zone 1-4 Yellow Perch ,000 Quota Zone 1-7 Yellow Perch 3.00 Quota or Harvest (lb) 120, ,000 80,000 60,000 40,000 20, Price per lb ($) Quota or Harvest (lb) 25,000 20,000 15,000 10,000 5, Price per lb ($) Harvest Quota Price-per-lb Harvest Quota Price-per-lb FIG Commercial base quota, harvest and price-per-lb for Yellow Perch in Quota Zones 1-2, 1-3, 1-4, 1-5, 2-5 and 1-7, Section 3. Commercial Fishery
109 101 Harvest/Quota (lb) 160, , , ,000 80,000 60,000 40,000 Lake Whitefish 68,242 51% 50% Harvest/Quota (lb) 140, , ,000 80,000 60,000 40,000 20,000 Lake Whitefish Base Quota = 97,745 lb Base Quota Issued Quota Harvest 20,000 0 Total East Lake West Lake Lake Ontario St. Lawrence River Inland Lakes FIG Lake Whitefish commercial harvest relative to issued and base quota (total for all quota zones combined; left panel) and by quota zone (right panel), ,000 Quota Zone 1-1 Lake Whitefish ,000 Quota Zone 1-3 Lake Whitefish 2.00 Quota or Harvest (lb) 40, , , , , , , , Price per lb ($) Quota or Harvest (lb) , ,000 60,000 40, , Price per lb ($) Harvest Quota Price-per-lb Harvest Quota Price-per-lb 500,000 Quota Zone 1-2 Lake Whitefish ,000 Quota Zone 1-4 Lake Whitefish 2.00 Quota or Harvest (lb) 450, , , , , , , ,000 50, Price per lb ($) Quota or Harvest (lb) 120, ,000 80,000 60,000 40,000 20, Price per lb ($) Harvest Quota Price-per-lb Harvest Quota Price-per-lb FIG Commercial base quota, harvest and price-per-lb for Lake Whitefish in Quota Zones 1-1, 1-2, 1-3 and 1-4, last few years in quota zone 1-3 but remains steady n West Lake. Price-per-lb is currently high. Sunfish Sunfish 2017 commercial harvest relative to issued and base quota by quota zone and total for all quota zones combined is shown in Fig Only quota zones 1-1 (embayment areas only), East Lake and West Lake have quotas for Sunfish; quota is unlimited in the other zones. Most Sunfish harvest comes from quota zone 1-3, East Lake and West Lake. Trends in Sunfish quota (base), harvest and price-per-lb are shown in Fig In 2017, harvest increased in quota zone 1-3, East and West Lakes. Sunfish price-per-lb is currently high. Brown Bullhead Brown Bullhead 2017 commercial harvest by quota zone and total for all quota zones Section 3. Commercial Fishery
110 102 Harvest/Quota (lb) 60,000 50,000 40,000 30,000 20,000 10,000 0 Walleye 31,741 Total 66% Harvest/Quota (lb) 45,000 40,000 35,000 30,000 25,000 20,000 15,000 10,000 5,000 0 Walleye Base Quota = 9683 lb Base Quota Issued Quota Harvest East Lake West Lake Lake Ontario St. Lawrence River Inland Lakes FIG Walleye commercial harvest relative to issued and base quota (total for all quota zones combined; left panel) and by quota zone (right panel), ,000 Quota Zone 1-1 Walleye ,000 Quota Zone 1-4 Walleye 3.00 Quota or Harvest (lb) 7,000 6,000 5,000 4,000 3,000 2,000 1, Price per lb ($) Quota or Harvest (lb) 30,000 25,000 20,000 15,000 10,000 5, Price per lb ($) Harvest Quota Price-per-lb Harvest Quota Price-per-lb Quota or Harvest (lb) 70,000 60,000 50,000 40,000 30,000 20,000 10,000 Quota Zone 1-2 Walleye Harvest Quota Price-per-lb FIG Commercial base quota, harvest and price-per-lb for Walleye in Quota Zones 1-1, 1-2 and 1-4, combined is shown in Fig Quota was removed in quota zones 1-1, East Lake and West Lake in 2016 and is now unlimited in all zones. Highest Brown Bullhead harvest came from quota zones 1-3 and Price per lb ($) Current harvest levels are extremely low relative to past levels. Northern Pike Northern Pike 2017 commercial harvest by quota zone is shown in Fig Highest pike harvest came from quota zone 1-3. Trends in Northern Pike harvest and priceper-lb are shown in Fig In 2017, harvest declined in all quota zone 1-3 and increased in quota zones 1-1, 1-5, East and West Lakes. Trends in Brown Bullhead quota (base), harvest and price-per-lb are shown in Fig Section 3. Commercial Fishery
111 103 Harvest/Quota (lb) 80,000 70,000 60,000 50,000 40,000 30,000 20,000 10,000 0 Black Crappie 9,962 Total 14% 20% Harvest/Quota (lb) 20,000 18,000 16,000 14,000 12,000 10,000 8,000 6,000 4,000 2,000 0 Black Crappie Base Quota Issued Quota Harvest East Lake West Lake Lake Ontario St. Lawrence River Inland Lakes FIG Black Crappie commercial harvest relative to issued and base quota (total for all quota zones combined; left panel) and by quota zone (right panel), ,000 Quota Zone 1-1 Black Crappie ,000 Quota Zone 2-5 Black Crappie 3.00 Quota or Harvest (lb) 4,500 4,000 3,500 3,000 2,500 2,000 1,500 1, Price per lb ($) Quota or Harvest (lb) 25,000 20,000 15,000 10,000 5, Price per lb ($) Harvest Quota Price-per-lb Harvest Quota Price-per-lb 18,000 Quota Zone 1-3 Black Crappie ,000 Quota Zone 1-7 Black Crappie 3.00 Quota or Harvest (lb) 16,000 14,000 12,000 10,000 8,000 6,000 4,000 2, Price per lb ($) Quota or Harvest (lb) 6,000 5,000 4,000 3,000 2,000 1, Price per lb ($) Harvest Quota Price-per-lb Harvest Quota Price-per-lb 35,000 Quota Zone 1-5 Black Crappie ,000 Quota Zone West Lake Black Crappie 4.00 Quota or Harvest (lb) 30,000 25,000 20,000 15,000 10,000 5, Price per lb ($) Quota or Harvest (lb) 10,000 8,000 6,000 4,000 2, Price per lb ($) Harvest Quota Price-per-lb Harvest Quota Price-per-lb FIG Commercial base quota, harvest and price-per-lb for Black Crappie in Quota Zones 1-1, 1-3, 1-5, 2-5, 1-7 and West Lake, Section 3. Commercial Fishery
112 104 Harvest/Quota (lb) 70,000 60,000 50,000 40,000 30,000 20,000 Sunfish 65,007 Harvest/Quota (lb) 40,000 35,000 30,000 25,000 20,000 15,000 10,000 5,000 Sunfish Base Quota Issued Quota Harvest 10,000 0 Total East Lake West Lake Lake Ontario St. Lawrence River Inland Lakes FIG Sunfish commercial harvest relative to issued and base quota for quota zones 1-1, East Lake and West Lake, The remaining quota zones have unlimited quota. 30,000 Quota Zone 1-1 Sunfish ,000 Quota Zone 2-5 Sunfish 1.60 Quota or Harvest (lb) 25,000 20,000 15,000 10,000 5, Price per lb ($) Harvest (lb) 30,000 25,000 20,000 15,000 10,000 5, Price per lb ($) Harvest Quota Price-per-lb Harvest Price-per-lb 100,000 Quota Zone 1-3 Sunfish ,000 Quota Zone 1-7 Sunfish 1.60 Harvest (lb) 90,000 80,000 70,000 60,000 50,000 40,000 30,000 20,000 10, Price per lb ($) Harvest (lb) 25,000 20,000 15,000 10,000 5, Price per lb ($) Harvest Price-per-lb Harvest Price-per-lb Harvest (lb) 2,000 1,800 1,600 1,400 1,200 1, Quota Zone 1-4 Sunfish Harvest Price-per-lb Price per lb ($) Quota or Harvest (lb) 18,000 16,000 14,000 12,000 10,000 8,000 East Lake Sunfish 6, , , Harvest Quota Price-per-lb Price per lb ($) 80,000 Quota Zone 1-5 Sunfish ,000 West Lake Sunfish 1.40 Harvest (lb) 70,000 60,000 50,000 40,000 30,000 20,000 10, Price per lb ($) Quota or Harvest (lb) 20,000 15,000 10,000 5, Price per lb ($) Harvest Price-per-lb Harvest Quota Price-per-lb FIG Commercial base quota, harvest and price-per-lb for Sunfish in Quota Zones 1-1, 1-3, 1-4, 1-5, 2-5 and 1-7, East Lake and West Lake, Section 3. Commercial Fishery
113 105 18,000 Brown Bullhead 8,000 Brown Bullhead 16,000 15,544 7,000 Harvest (lb) 14,000 12,000 10,000 8,000 6,000 4,000 2,000 Harvest/Quota (lb) 6,000 5,000 4,000 3,000 2,000 1, East Lake West Lake 0 Lake Ontario St. Lawrence River Inland Lakes FIG Brown Bullhead commercial harvest by quota zone, Quota or Harvest (lb) 40,000 30,000 20,000 10,000 Quota Zone 1-1 Brown Bullhead Price per lb ($) Harvest (lb) 45,000 40,000 35,000 30,000 25,000 20,000 15,000 10,000 5,000 Quota Zone 2-5 Brown Bullhead Price per lb ($) Harvest Quota Price-per-lb Harvest Price-per-lb 180,000 Quota Zone 1-3 Brown Bullhead ,000 Quota Zone 1-7 Brown Bullhead 0.60 Harvest (lb) 160, , , , , , , , Price per lb ($) Quota or Harvest (lb) 80,000 70,000 60,000 50,000 40,000 30,000 20, , Price per lb ($) Harvest Price-per-lb Harvest Quota Price-per-lb 10,000 Quota Zone 1-4 Brown Bullhead ,000 East Lake Brown Bullhead 0.50 Harvest (lb) 9,000 8,000 7,000 6,000 5,000 4,000 3,000 2,000 1, Price per lb ($) Quota or Harvest (lb) 14,000 12,000 10,000 8,000 6,000 4,000 2, Price per lb ($) Harvest Price-per-lb Harvest Quota Price-per-lb 60,000 Quota Zone 1-5 Brown Bullhead ,000 West Lake Brown Bullhead 0.50 Harvest (lb) 50, ,000 30,000 20,000 10, Price per lb ($) Quota or Harvest (lb) , ,000 15,000 10, , Price per lb ($) Harvest Price-per-lb Harvest Quota Price-per-lb FIG Commercial base quota, harvest and price-per-lb for Brown Bullhead in Quota Zones 1-1, 1-3, 1-4, 1-5, 2-5 and 1-7, East Lake and West Lake, Section 3. Commercial Fishery
114 106 30,000 25,000 Northern Pike 24,102 12,000 10,000 Northern Pike Base Quota Issued Quota Harvest (lb) 20,000 15,000 10,000 Harvest (lb) 8,000 6,000 4,000 2,000 Harvest 5,000 0 Total East Lake West Lake Lake Ontario St. Lawrence River Inland Lakes FIG Northern Pike commercial harvest by quota zone, In quota zones 2-5 and 1-7 no harvest is permitted; all other zones have unlimited quota. 8,000 Quota Zone 1-1 Northern Pike ,000 Quota Zone 1-5 Northern Pike 0.40 Quota or Harvest (lb) 7,000 6,000 5,000 4,000 3,000 2,000 1, Price per lb ($) Quota or Harvest (lb) 12,000 10,000 8,000 6,000 4,000 2, Price per lb ($) Harvest Price-per-lb Harvest Quota Price-per-lb 4,000 Quota Zone 1-2 Northern Pike ,000 East Lake Northern Pike 0.35 Quota or Harvest (lb) 3,500 3,000 2,500 2,000 1,500 1, Price per lb ($) Quota or Harvest (lb) 2,500 2,000 1,500 1, Price per lb ($) Harvest Price-per-lb Harvest Quota Price-per-lb 30,000 Quota Zone 1-3 Northern Pike ,000 West Lake Northern Pike 0.35 Quota or Harvest (lb) 25,000 20,000 15,000 10,000 5, Price per lb ($) Quota or Harvest (lb) 7,000 6,000 5,000 4,000 3,000 2,000 1, Price per lb ($) Harvest Price-per-lb Harvest Quota Price-per-lb 5,000 Quota Zone 1-4 Northern Pike 0.35 Quota or Harvest (lb) 4,500 4,000 3,500 3,000 2,500 2,000 1,500 1, Price per lb ($) Harvest Price-per-lb FIG Commercial base quota, harvest and price-per-lb for Northern Pike in Quota Zones 1-1, 1-2, 1-3, 1-4, and 1-5, East Lake and West Lake, Section 3. Commercial Fishery
115 Lake Whitefish Commercial Catch Sampling J. A. Hoyle, Lake Ontario Management Unit Sampling of commercially harvested Lake Whitefish for biological information occurs annually. While total Lake Whitefish harvest can be determined from commercial fish Daily Catch Reports (DCRs; see Section 3.2), biological sampling of the catch is necessary to breakdown total harvest into size and age-specific harvest. Commercial Lake Whitefish harvest and fishing effort by gear type, month and quota zone for 2017 is reported in Table Cumulative daily commercial Lake Whitefish harvest relative to quota milestones is shown in Fig Total Lake Whitefish harvest for 2017 was 68,240 lbs; 50% of the issued quota. Most of the harvest was taken in gill nets, 98% by weight; 2% of the harvest was taken in impoundment gear. Ninety-seven percent of the gill net harvest occurred in quota zone 1-2. Eighty percent of the gill net harvest in quota zone 1-2 was taken in November and December. In quota zone 1-3 most impoundment gear harvest and effort occurred in November (Table 3.3.1). About 12,000 lbs were harvested before November 1, the date on which an additional 20% of base quota was issued to the pool (Fig 3.3.1). Biological sampling focused on the November spawning-time gill net fishery on the south shore of Prince Edward County (quota zone 1-2), and the October/November spawning-time impoundment gear fishery in the Bay of Quinte (quota zone 1-3). The Lake Whitefish sampling design involves obtaining large numbers of length tally measurements and a smaller length-stratified sub-sample for more detailed biological sampling for the lake (quota zone 1-2) and bay (quota zone 1-3) spawning stocks. Whitefish length and age distribution information is presented in Fig and Fig In total, fork length was measured for 2,550 fish and age was interpreted using otoliths for 194 fish (Table 3.3.2, Fig and 3.3.3). Lake Ontario Gill Net Fishery (quota zone 1-2) The mean fork length and age of Lake Whitefish harvested during the gill net fishery in quota zone 1-2 were 483 mm and 10.2 years respectively (Fig ). Fish ranged from ages 4-28 years. The most abundant age-classes in the fishery were aged 5-14 years which together comprised 88% of the harvest by number (96% by weight). TABLE Lake Whitefish harvest (lbs) and fishing effort (yards of gill net or number of impoundment nets) by gear type, month and quota zone. Harvest and effort value in bold italic represent months and quota zones where whitefish biological samples were collected. Harvest (lbs) Effort (number of yards or nets) Gear type Month Gill net Mar 3 80 Apr May , Jun 4,205 28,040 Jul 3,457 20,100 Aug 3,206 22,400 Sep , Nov 31, , Dec 22, , Impoundment Apr Jun 9 2 Oct Nov 1, Section 3. Commercial Fishery
116 ,000 Lake Whitefish Harvest (lb) Base quota + 20% 161,560 lb 140, ,000 Issued quota 137,455 lb Base quota 134,883 lb Harvest (lb) 100,000 80,000 60,000 Total harvest 68,240 lb 40,000 20, Jan 01-Feb 01-Mar 01-Apr 01-May 01-Jun 01-Jul 01-Aug 01-Sep 01-Oct 01-Nov 01-Dec FIG Cumulative daily commercial Lake Whitefish harvest (2017) relative to quota milestones. TABLE Age-specific vital statistics of Lake Whitefish sampled and harvested including number aged, number measured for length, and proportion by number of fish sampled, harvest by number and weight (kg), and mean weight (kg) and fork length (mm) of the harvest for quota zones 1-2 and 1-3, Age (years) Number aged Quota zone 1-2 (Lake stock) Quota zone 1-3 (Bay stock) Sampled Harvested Sampled Harvested Mean Mean Number Weight weight length Age Number Number Weight lengthed Proportion Number (kg) (kg) (mm) (years) aged lengthed Proportion Number (kg) Mean weight (kg) ,252 4, ,003 1, ,639 5, ,527 2, , ,798 2, , ,961 2, ,321 3, Total 118 2, ,352 30,095 Total Weighted Weighted mean mean Mean length (mm) Section 3. Commercial Fishery
117 109 Proportion of harvest Proportion of harvest Fork length (mm) Quota Zone 1-2 (Lake Stock) Mean fork length =483 mm (n = 2212) Quota Zone 1-2 (Lake Stock) Mean age = 10.2 years (n = 110) Age (years) FIG Size and age distribution (by number) of Lake Whitefish sampled in quota zone 1-2 during the 2017 commercial catch sampling program. Proportion of harvest Proportion of harvest Fork length (mm) Quota Zone 1-3 (Bay Stock) Mean fork length =462 mm (n = 338) Quota Zone 1-3 (Bay Stock) Mean age = 8.1 years (n = 84) Age (years) FIG Size and age distribution (by number) of Lake Whitefish sampled in quota zone 1-3 during the 2017 commercial catch sampling program. Bay of Quinte November Impoundment Gear Fishery (quota zone 1-3) Mean fork length and age were 462 mm and 8.1 years, respectively (Fig ). Fish ranged from ages 2-31 years. The most abundant age-classes in the fishery were aged 4-14 years which together comprised 96% of the harvest by number (94% by weight). Condition Lake Whitefish (Bay of Quinte and Lake Ontario spawning stocks; sexes combined) relative weight (see Rennie et al ) is shown in Fig Condition declined markedly in 1994 and remained low but stable. Relative weight (%) Body Condition Bay Stock Lake Stock FIG Lake Whitefish (Lake Ontario and Bay of Quinte spawning stocks and sexes combined) relative weight (see 1 Rennie et al. 2008), Rennie, M.D. and R. Verdon Development and evaluation of condition indices for the Lake Whitefish. N. Amer. J. Fish. Manage. 28: Section 3. Commercial Fishery
118 Cisco Commercial Catch Sampling J. A. Hoyle, Lake Ontario Management Unit Cisco appear to have increased in abundance in recent years (see Section 1.2 and 1.3). A small incidental commercial harvest of Cisco occurs in quota zone 1-3 where the species is taken in the fall Lake Whitefish targeted fishery. A sample of Cisco was taken in this fishery to examine age-class composition. In total, fork length was measured for 592 fish and age was interpreted using otoliths for 109 fish (Fig ). The mean fork length and age of Cisco harvested during the impoundment gear fishery in quota zone 1-3 were 327 mm and 4.3 years respectively (Fig ). Fish ranged from ages 2-15 years. The most abundant age-classes in the fishery were aged 3 and 4 years which together comprised 78% of the harvest by number. Age-3 fish from the 2014 year-class were very numerous. Proportion of harvest Proportion of harvest 0.18 Quota Zone 1-3 (Cisco) Mean fork length = 327 mm (n = 592) Fork length (mm) Quota Zone 1-3 (Cisco) Mean age = 4.3 years (n = 109) Age (years) FIG Size and age distribution (by number) of Cisco sampled in quota zone 1-3 during the 2017 commercial catch sampling program. Section 3. Commercial Fishery
119 Age and Growth Summary S. Kranzl and J. A. Hoyle, Lake Ontario Management Unit Biological sampling of fish from Lake Ontario Management Unit field projects routinely involves collecting and archiving structures used for such purposes as age interpretation and validation, origin determination (e.g. stocked versus wild), life history characteristics and other features of fish growth. Coded wire tags, embedded in the nose of fish prior to stocking, are sometimes employed to uniquely identify individual fish (e.g., to determine stocking location and year, when recovered). In 2017, a total of 3,051 structures were processed from 11 different field projects (Table 4.1). TABLE 4.1. Project-specific summary of age and growth structures interpreted for age (n=3,051) in support of 11 different Lake Ontario Management Unit field projects, 2017 (CWT, Code Wire Tags). Project Species Structure n Ganaraska Rainbow Trout Assessment Rainbow Trout Scales 103 Lake Ontario and Bay of Quinte Community Index Gillnetting Walleye Otoliths 625 Lake Whitefish Otoliths 33 Lake Trout Otoliths 106 Cisco Otoliths 159 Lake Trout CWT 81 Lake Ontario and Bay of Quinte Community Index Trawling Walleye Otoliths 4 Walleye Scales 130 Prince Edward Bay Nearshore Community Index Netting Northern Pike Cleithra 30 Chain Pickerel Cleithra 1 Pumpkinseed Scales 30 Bluegill Scales 7 Smallmouth Bass Scales 39 Largemouth Bass Scales 21 Black Crappie Scales 23 Yellow Perch Scales 12 Walleye Otoliths 8 Upper Bay of Quinte Nearshore Community Index Netting Northern Pike Cleithra 22 Pumpkinseed Scales 34 Bluegill Scales 46 Smallmouth Bass Scales 17 Largemouth Bass Scales 33 Black Crappie Scales 34 Yellow Perch Scales 27 Walleye Otoliths 37 TABLE 4.1. continued. East Lake Nearshore Community Index Netting Northern Pike Cleithra 5 Pumpkinseed Scales 29 Bluegill Scales 31 Smallmouth Bass Scales 3 Largemouth Bass Scales 29 Black Crappie Scales 1 Yellow Perch Scales 21 Walleye Otoliths 14 Bay of Quinte On Water Creel Largemouth Bass Scales 95 Walleye Scales 364 Thousand Islands Community Index Netting Northern Pike Cleithra 21 Smallmouth Bass Scales 82 Largemouth Bass Scales 16 Yellow Perch Scales 75 Walleye Otoliths 18 Credit River Chinook Assessment and Egg Collection Chinook Salmon Otoliths 51 Ganaraska Chinook Assessment and Egg Collection Chinook Salmon Otoliths 59 Commercial Catch Sampling Lake Whitefish Otoliths 195 Cisco Otoliths 109 Total 3051 Section 4. Age and Growth Summary
 cooperates annually with several agencies to collect fish samples for contaminant testing.")
120 Contaminant Monitoring S. Kranzl and J. A. Hoyle, Lake Ontario Management Unit Lake Ontario Management Unit (LOMU) cooperates annually with several agencies to collect fish samples for contaminant testing. In 2017, 328 contaminant samples were collected for Ontario s Ministry of the Environment and Climate Change (MOECC) Guide to Eating Ontario Fish program (Table 5.1). Samples were primarily collected using existing fisheries assessment programs on Lake Ontario, Bay of Quinte and the St. Lawrence. Fig. 5.1 is a map showing locations ( Blocks ) for contaminant sample collections. A summary of the number of fish samples collected by species, for contaminant analysis by the MOECC from 2000 to 2017 is shown in Table Upper Bay of Quinte open water from Trenton to County Road 49 Bridge 10. Middle Bay of Quinte from County Road 49 Bridge to Glenora 11. Lower Bay of Quinte/Eastern Lake Ontario from east of Glenora to Kingston as well as the open water from north of Main Duck Island to Wolfe Island and from across the Main Duck sill to Point Traverse. 12. Thousand Islands area St. Lawrence River from east of Kingston to Brockville FIG Map showing locations ( Blocks ) for contaminant sample collections. TABLE 5.1. Number of fish samples provided to MOECC for contaminant analysis, by region and species, Region Block Species Total Upper Bay of Quinte 9 Channel Catfish 10 Common Carp 8 Cisco 10 Freshwater Drum 10 Gizzard Shad 10 Lake Whitefish 2 Northern Pike 5 Pumpkinseed 10 Smallmouth Bass 7 Walleye 9 Yellow Perch 10 White Sucker 10 Middle Bay of Quinte 10 Cisco 10 Freshwater Drum 5 Lake Whitefish 1 Northern Pike 5 Walleye 10 Yellow Perch 10 White Sucker 10 Lower Bay of Quinte/ 11 Freshwater Drum 3 Eastern Lake Ontario Lake Trout 10 Lake Whitefish 8 Northern Pike 10 Pumpkinseed 10 Smallmouth Bass 10 Walleye 10 Yellow Perch 10 White Sucker 10 Thousand Islands area 12 Largemouth Bass 4 Northern Pike 15 Rock Bass 20 Smallmouth Bass 20 Walleye 16 Yellow Perch 20 Total 328 Section 5. Contaminant Monitoring
121 113 TABLE 5.2. Summary of the number of fish samples collected, by species, for contaminant analysis by the MOECC, Year Species Black Crappie Bluegill Brown Bullhead Brown Trout Channel Catfish Chinook Salmon Cisco Coho Salmon 1 3 Common Carp Freshwater Drum Gizzard Shad 7 10 Lake Trout Lake Whitefish Largemouth Bass Northern Pike Pumpkinseed Rainbow Smelt 3 Rainbow Trout Rock Bass Silver Redhorse 1 Smallmouth Bass Walleye White Bass 20 White Perch White Sucker Yellow Perch Total Section 5. Contaminant Monitoring
. Figure 6.1.2 shows stocking trends in the Ontario waters of Lake Ontario from 1968 to 2017.")
122 Stocking Program 6.1 Stocking Summary C. Lake, Lake Ontario Management Unit In 2017, MNRF stocked approximately 2 million fish into Lake Ontario (Table 6.1.1; Fig ). This number of fish equaled approximately 47,700 kilograms of biomass added to the Lake (Fig ). Figure shows stocking trends in the Ontario waters of Lake Ontario from 1968 to Table provides detailed information on fish stocking by both species and life-stage for A total of 495,685 (4,080 kg) Chinook Salmon spring fingerlings were stocked at various locations to provide put-grow-and-take fishing opportunities. This was slightly higher than the new interim target of 470,000 (25,685, or 5.5% over-target). The new target was set based on a 20% reduction from our previous target of 600,000. The new target was reduced by a further 10,000 to offset an increased allocation to the net pen program. The stocking reduction was done as a precaution in response to projected poor Alewife year-classes. Although we were slightly over our Chinook target for 2017, we only stocked 50% of our Coho target (see below). All Chinook Salmon for the Lake Ontario program were produced at Normandale Fish Culture Station. About 235,000 (47% of total stocking) Chinook Salmon were held in pens at eight sites in Lake Ontario for a short period of time prior to stocking. It is expected that penimprinting will help improve returns of mature adults to these areas in the fall, thereby enhancing local near shore and tributary fishing opportunities. See section 6.2 for a detailed report of the 2017 net pen program. Atlantic Salmon were stocked in support of an ongoing program to restore self-sustaining populations of this native species to the Lake Ontario basin (Section 8.2). Approximately 411,000 (14,899 kg) Atlantic Salmon of various life stages were stocked in 2017 into various TABLE Fish stocked into the Ontario waters of Lake Ontario in 2017, and targets for Numbers reflect both MNRFproduced fish, and those raised by community groups. Specific details can be found in Table Species Life Stage Atlantic Salmon Spring Fingerling 184, ,000 Fall Fingerling 80,359 89,500 Spring Yearling 142, ,000 Adult 4,316 Atlantic Salmon Total 411, ,500 Bloater Sub Adult 53,969 Fall Yearling 115, ,000 Adult 93 Bloater Total 169, ,000 Brown Trout Spring Fingerling 50,000 50,000 Spring Yearling 173, ,000 Fall Yearling 18,600 Brown Trout Total 242, ,000 Chinook Salmon Spring Fingerling 495, ,000 Coho Salmon Fall Fingerling 40,110 80,000 Lake Trout Fall Fingerling 19,878 Spring Yearling 345, ,000 Lake Trout Total 365, ,000 Rainbow Trout Spring Yearling 157, ,000 Sub Adult 1,097 Rainbow Trout Total 158, ,000 Walleye Non-feeding Fry 1 1,080,000 1,000,000 Summer Fingerling 100, ,000 Walleye Total 100, ,000 FIG TOP: Number of fish stocked into the Ontario waters of Lake Ontario in Total=1,982,508 fish. BOTTOM: Biomass of fish stocked into the Ontario waters of Lake Ontario in Total = 47,745 kg. Grand Total 1,982,508 2,121,500 1 Non-feeding fry not included in totals. Section 6. Stocking Program

123 115 FIG Trends in salmon and trout stocking in the Ontario waters of Lake Ontario; Section 6. Stocking Program
124 116 tributaries including: Credit River, Duffins Creek and Cobourg Brook. For the second consecutive year, the Ganaraska River was stocked with advanced life stages (spring yearlings and older), with the goal of establishing a fishery. MNRF is working cooperatively with the Ontario Federation of Anglers and Hunters and a network of other partners to plan and deliver this phase of Atlantic Salmon restoration, including setting stocking targets to help meet program objectives. Atlantic Salmon are produced at both MNRF and partner facilities. Three Atlantic Salmon brood stocks from different source populations in Nova Scotia, Quebec and Maine are currently housed at MNRF s Harwood and Normandale Fish Culture Stations. All fish have been genotyped to facilitate follow-up assessment on stocked fish and their progeny in the wild. Over 365,000 (10,726 kg) Lake Trout spring yearlings were stocked in the spring of 2017 as part of an established, long-term rehabilitation program, supporting of the Lake Trout Stocking Plan (Section 8.5). Three strains, originating from Seneca Lake, Slate Islands and Michipicoten Island are stocked as part of our annual target. The 2017 target was reduced by 20% in anticipation of possible poor Alewife year classes. Approximately 170,000 (4,186 kg) Bloater were stocked in This small relative of the Lake Whitefish was an important prey item for Lake Trout until the late 1950 s when both species were extirpated. A coordinated program involving staff from the US and Canada resulted in the initial stocking of approximately 15,000 Bloater in MNRF Fish Culture Section staff continue to work with our partner agencies to advance our understanding of the complicated process of rearing Bloater. See section 8.4 for a detailed description of this restoration effort. Rainbow Trout (158,000; 4,457 kg) and Brown Trout (242,000; 8,466 kg) were stocked at various locations to support shore and boat fisheries. Community hatcheries contribute to the stocking of both of these species see Table for details. Coho Salmon were produced by stocking partners Metro East Anglers (approximately 40,000 fall fingerlings; 885 kg) and the Credit River Angler Association (110 fall fingerlings). Walleye were stocked into Toronto Harbour in an effort to re-establish this native, predatory fish and to promote urban, near-shore angling. Walleye stocking is planned to alternate annually between Toronto Harbour and Hamilton Harbour (first stocked in 2012). Toronto Harbour received approximately 1,000,000 Walleye fry in the spring of 2017, followed by over 100,000 fingerlings stocked in July. MNRF remains committed to providing diverse fisheries in Lake Ontario and its tributaries, based on wild and stocked fish, as appropriate. Detailed information about MNRF s 2017 stocking activities is found in Table Section 6. Stocking Program
125 117 FIG Fish stocked in the Ontario waters of Lake Ontario and its tributaries during Species Lifestage Waterbody Site Month Stocked Hatchery Strain Age (Months) Weight (g) Biomass (kg) Marks Number ATLANTIC SALMON Atlantic Salmon Spring Fingerling Cobourg Br. Ball's Mill 5 Normandale Sebago ,787 Atlantic Salmon Spring Fingerling Cobourg Br. Hie - McNichol Properties 5 Normandale LaHave ,235 Atlantic Salmon Spring Fingerling Credit R. Black Cr. - 6th Line 5 Normandale LaHave ,000 Atlantic Salmon Spring Fingerling Credit R. Ellie's Ice Cream Parlour 5 Normandale LaHave ,982 Atlantic Salmon Spring Fingerling Credit R. Forks of the Credit 5 Normandale LaHave ,490 Atlantic Salmon Spring Fingerling Credit R. Forks of the Credit - Meadow 5 Normandale Lac Saint-Jean ,191 Atlantic Salmon Spring Fingerling Credit R. Forks of the Credit - Meadow 5 Normandale Sebago ,934 Atlantic Salmon Spring Fingerling Credit R. Forks of the Credit - Stuck Truck 5 Normandale LaHave ,690 Atlantic Salmon Spring Fingerling Credit R. Forks of the Credit Provincial Park 5 Belfountain Hatchery LaHave ,727 Atlantic Salmon Spring Fingerling Credit R. West Credit - Belfountain 5 Belfountain Hatchery LaHave ,027 Atlantic Salmon Spring Fingerling Credit R. West Credit - Belfountain 5 Normandale LaHave ,988 Atlantic Salmon Spring Fingerling Credit R. West Credit - Shaw's Creek Rd. 5 Belfountain Hatchery LaHave ,491 Atlantic Salmon Spring Fingerling Credit R. West Credit - Winston Churchill Blvd. 5 Belfountain Hatchery LaHave ,377 Atlantic Salmon Spring Fingerling Duffins Cr. East Duffins Cr. - Claremont Field Centre 5 Normandale LaHave ,006 Atlantic Salmon Spring Fingerling Duffins Cr. East Duffins Crk. - Durham Outdoor Centre 5 Normandale LaHave ,985 Atlantic Salmon Spring Fingerling Duffins Cr. West Duffins Cr. - Sideline 32 5 Normandale LaHave ,995 Atlantic Salmon Spring Fingerling Duffins Cr. West Duffins Cr. - Sideline 32 5 Normandale Sebago ,313 Sub total: ,218 Atlantic Salmon Fall Fingerling Cobourg Br. Danforth Rd. 10 Normandale LaHave ,000 Atlantic Salmon Fall Fingerling Credit R. Eldorado Park 10 Normandale LaHave AD 15,095 Atlantic Salmon Fall Fingerling Credit R. Norval 10 Normandale LaHave ,876 Atlantic Salmon Fall Fingerling Credit R. Terra Cotta 10 Normandale LaHave AD 14,995 Atlantic Salmon Fall Fingerling Duffins Cr. East Duffins Cr. - 5th Conc. 10 Normandale LaHave ,392 Atlantic Salmon Fall Fingerling Duffins Cr. West Duffins Cr. - Wixon Cr. 10 Normandale LaHave ,997 Atlantic Salmon Fall Fingerling Duffins Cr. West Duffins Cr. - Wixon Cr. 10 Normandale Sebago ,004 Sub total: 3,280 80,359 Atlantic Salmon Spring Yearling Cobourg Br. Danforth Rd. 4 Normandale LaHave ,959 Atlantic Salmon Spring Yearling Cobourg Br. Division St. 4 Normandale LaHave ,595 Atlantic Salmon Spring Yearling Cobourg Br. Hie - McNichol Properties 4 Normandale LaHave ,674 Atlantic Salmon Spring Yearling Credit R. Eldorado Park 4 Normandale Lac Saint-Jean AD 3,694 Atlantic Salmon Spring Yearling Credit R. Eldorado Park 3 Normandale LaHave ,994 Atlantic Salmon Spring Yearling Credit R. Eldorado Park 4 Normandale LaHave AD 2,938 Atlantic Salmon Spring Yearling Credit R. Glen Williams 4 Normandale LaHave ,002 Atlantic Salmon Spring Yearling Credit R. Inglewood 3 Normandale LaHave ,006 Atlantic Salmon Spring Yearling Credit R. Norval 7 Credit River Anglers Assoc. LaHave ,814 Atlantic Salmon Spring Yearling Credit R. Norval 4 Normandale LaHave ,201 Atlantic Salmon Spring Yearling Credit R. Norval 10 Normandale Sebago ,106 Atlantic Salmon Spring Yearling Credit R. Norval 4 Normandale Sebago AD 2,349 Atlantic Salmon Spring Yearling Credit R. Paper Mill 6 Credit River Anglers Assoc. LaHave ,495 Atlantic Salmon Spring Yearling Credit R. Terra Cotta 3 Normandale LaHave ,003 Atlantic Salmon Spring Yearling Duffins Cr. East Duffins Cr. - 5th Conc. 4 Normandale LaHave ,089 Atlantic Salmon Spring Yearling Duffins Cr. East Duffins Cr. - Paulynn Park 4 Normandale LaHave ,198 Atlantic Salmon Spring Yearling Ganaraska R. Newtonville Rd. 3 Ringwood (OFAH 2006) LaHave AD 1,085 Atlantic Salmon Spring Yearling Ganaraska R. Newtonville Rd. 3 Ringwood (OFAH 2006) Sebago AD 915 Atlantic Salmon Spring Yearling Ganaraska R. Shiloh Rd. 4 Normandale Lac Saint-Jean AD 7,964 Atlantic Salmon Spring Yearling Ganaraska R. Shiloh Rd. 4 Normandale Sebago ,806 AD 27,231 Atlantic Salmon Spring Yearling Ganaraska R. Shiloh Rd. 3 Ringwood (OFAH 2006) LaHave AD 6,510 Atlantic Salmon Spring Yearling Ganaraska R. Shiloh Rd. 3 Ringwood (OFAH 2006) Sebago AD 5,490 Sub total: 8, ,312 ATLANTIC SALMON (continued) Atlantic Salmon Adult Credit R. Forks of the Credit 4 Normandale Lac Saint-Jean AD 572 Atlantic Salmon Adult Credit R. Forks of the Credit - Stuck Truck 5 Normandale Lac Saint-Jean 39 2, Atlantic Salmon Adult Credit R. Forks of the Credit Provincial Park 4 Normandale Lac Saint-Jean AD 543 Atlantic Salmon Adult Credit R. Grange Sideroad 4 Normandale Lac Saint-Jean AD 511 Continued on next page Section 6. Stocking Program
126 118 FIG Fish stocked in the Ontario waters of Lake Ontario and its tributaries during 2017 continued. Atlantic Salmon Adult Credit R. McLaren Rd. 4 Normandale Lac Saint-Jean AD 608 Atlantic Salmon Adult Credit R. West Credit - Shaw's Creek Rd. 4 Normandale Lac Saint-Jean 46 2, Atlantic Salmon Adult Humber R. King Vaughan Line 4 Harwood Lac Saint-Jean 55 1, Atlantic Salmon Adult Ontario, L. Port Dalhousie East 12 Normandale Sebago AD 1,803 Sub total: 2,449 4,316 Spring Fingerling: ,218 Fall Fingerling: 3,280 80,359 Spring Yearling: 8, ,312 Adult: 2,449 4,316 Atlantic Salmon Total: 14, ,205 BLOATER Bloater Fall Yearling Ontario, L. Cobourg Chatsworth Lake Michigan ,192-54,021 Bloater Fall Yearling Ontario, L. Cobourg Harwood Lake Michigan ,671-61,407 Sub total: 2, ,428 Bloater Sub Adult Ontario, L. Cobourg White Lake Lake Michigan ,502 Bloater Sub Adult Ontario, L. Main Duck Isl. 11 White Lake Lake Michigan ,467 Bloater Adult Ontario, L. Main Duck Isl. 8 White Lake Lake Michigan Sub total: 1,323 54,062 Fall Yearling: 2, ,428 Sub Adult and Adults: 1,323 54,062 Bloater Total: 4, ,490 BROWN TROUT Brown Trout Spring Fingerling Ontario, L. Finkle's Shore Ramp 6 Springside Park Hatchery Ganaraska River ,000 Brown Trout Spring Fingerling Ontario, L. Millhaven Wharf 6 Springside Park Hatchery Ganaraska River ,000 Sub total: ,000 Brown Trout Spring Yearling Ontario, L. Athol Bay 3 Chatsworth Ganaraska River ,125-44,298 Brown Trout Spring Yearling Ontario, L. Bronte Harbour 3 Chatsworth Ganaraska River ,725-37,979 Brown Trout Spring Yearling Ontario, L. Humber Bay Park 3 Chatsworth Ganaraska River ,410 Brown Trout Spring Yearling Ontario, L. Lakefront Promenade 3 Chatsworth Ganaraska River ,750-36,406 Brown Trout Spring Yearling Ontario, L. Port Dalhousie East 3 Chatsworth Ganaraska River ,500-36,648 Sub total: 7, ,741 Brown Trout Fall Yearling Credit R. Norval 11 Credit River Anglers Assoc. Ganaraska River ,100 Brown Trout Fall Yearling Ontario, L. Whitby Harbour 10 Ringwood (OFAH 2006) Ganaraska River ,500 Sub total: ,600 Spring Fingerling: ,000 Spring Yearling: 7, ,741 Fall Yearling: ,600 Brown Trout Total: 8, ,341 Chinook Salmon Chinook Salmon Spring Fingerling Bronte Cr. 2nd Side Road Bridge 5 Normandale Lake Ontario ,999 Chinook Salmon Spring Fingerling Bronte Cr. 4th Side Road Bridge 5 Normandale Lake Ontario ,146 Chinook Salmon Spring Fingerling Credit R. Eldorado Park 4 Normandale Ganaraska River AD 54,026 Chinook Salmon Spring Fingerling Credit R. Eldorado Park 4 Normandale Lake Ontario ,790 Chinook Salmon Spring Fingerling Credit R. Norval 4 Normandale Lake Ontario ,838 Chinook Salmon Spring Fingerling Hamilton Harbour Grindstone Cr. 5 Normandale Lake Ontario ,476 Chinook Salmon Spring Fingerling Hamilton Harbour Grindstone Cr. 5 Normandale Lake Ontario ,479 Continued on next page Species Lifestage Waterbody Site Month Stocked Hatchery Strain Age (Months) Weight (g) Biomass (kg) Marks Number Section 6. Stocking Program
127 119 FIG Fish stocked in the Ontario waters of Lake Ontario and its tributaries during 2017 continued. Chinook Salmon Spring Fingerling Highland Cr. Colonel Danforth Park 5 Normandale Lake Ontario ,752 Sub total: 1, ,506 Chinook Salmon Spring Fingerling Ontario, L. Bluffer's Park - Netpen 5 Ontario, L. Lake Ontario ,981 Chinook Salmon Spring Fingerling Ontario, L. Bronte Harbour - Netpen 5 Ontario, L. Lake Ontario ,082 Chinook Salmon Spring Fingerling Ontario, L. Oshawa Harbour - Netpen 5 Ontario, L. Lake Ontario ,054 Chinook Salmon Spring Fingerling Ontario, L. Port Credit Marina - Netpen 5 Ontario, L. Lake Ontario ,009 Chinook Salmon Spring Fingerling Ontario, L. Port Dalhousie East - Netpen 5 Ontario, L. Lake Ontario ,029 Chinook Salmon Spring Fingerling Ontario, L. Port Darlington - Netpen 5 Ontario, L. Lake Ontario ,002 Chinook Salmon Spring Fingerling Ontario, L. Wellington Channel - Netpen 5 Ontario, L. Lake Ontario ,021 Chinook Salmon Spring Fingerling Ontario, L. Whitby Harbour - Netpen 5 Ontario, L. Lake Ontario ,001 Sub total: 2, ,179 Direct stocking: 1, ,506 Net Pen: 2, ,179 Chinook Salmon Total: 4, ,685 Coho Salmon Coho Salmon Fall Fingerling Credit R. Norval 11 Credit River Anglers Assoc. Lake Ontario AD 110 Coho Salmon Fall Fingerling Credit R. Norval 10 Ringwood (OFAH 2006) Lake Ontario AD 40,000 Coho Salmon Total: ,110 Lake Trout Lake Trout Fall Fingerling Ontario, L. Amherst Island 11 Harwood Seneca Lake LVAD 19,878 Sub total: ,878 Lake Trout Spring Yearling Ontario, L. Amherst Island 4 White Lake Seneca Lake ,516 RPAD 68,905 Lake Trout Spring Yearling Ontario, L. Brighton - Offshore 4 Harwood Seneca Lake ,831 RPAD 50,202 Lake Trout Spring Yearling Ontario, L. Cobourg Harbour Pier 4 North Bay Seneca Lake ,855 RPAD 65,097 Lake Trout Spring Yearling Ontario, L. Cobourg Harbour Pier 4 North Bay Slate Island ,197 RPAD 42,155 Lake Trout Spring Yearling Ontario, L. Jordan Harbour 3 Chatsworth Seneca Lake ,050 RPAD 69,015 Lake Trout Spring Yearling Ontario, L. Main Duck Isl. 4 Harwood Seneca Lake ,012 RPAD 26,185 Lake Trout Spring Yearling Ontario, L. Pt. Petre 4 Harwood Seneca Lake RPAD 24,000 Sub total: 10, ,559 Fall Fingerling: ,878 Spring Yearling: 10, ,559 Lake Trout Total: 10, ,437 Rainbow Trout Rainbow Trout Spring Yearling Bronte Cr. 2nd Side Road Bridge 5 Harwood Ganaraska River ,004 Rainbow Trout Spring Yearling Bronte Cr. 4th Side Road Bridge 5 Harwood Ganaraska River ,999 Rainbow Trout Spring Yearling Credit R. Eldorado Park 5 Harwood Ganaraska River ,000 Rainbow Trout Spring Yearling Credit R. Norval 3 Credit River Anglers Assoc. Ganaraska River ,925 Rainbow Trout Spring Yearling Credit R. Norval 5 Harwood Ganaraska River ,992 Rainbow Trout Spring Yearling Humber R. East Branch Islington 5 Harwood Ganaraska River ,905 Rainbow Trout Spring Yearling Humber R. King Vaughan Line 4 Harwood Ganaraska River ,000 Rainbow Trout Spring Yearling Ontario, L. Port Dalhousie East 5 Harwood Ganaraska River ,759 Rainbow Trout Spring Yearling Rouge R. Robinson Cr. 5 Ringwood (OFAH 2006) Ganaraska River ,500 Sub total: 4, ,084 Continued on next page Species Lifestage Waterbody Site Month Stocked Hatchery Strain Age (Months) Weight (g) Biomass (kg) Marks Number Section 6. Stocking Program
128 120 FIG Fish stocked in the Ontario waters of Lake Ontario and its tributaries during 2017 continued. Species Lifestage Waterbody Site Month Stocked Hatchery Strain Age (Months) Weight (g) Biomass (kg) Marks Number Rainbow Trout Sub Adult Credit R. Eldorado Park 6 Harwood Ganaraska River Rainbow Trout Sub Adult Credit R. Norval 6 Harwood Ganaraska River Sub total: 382 1,097 Spring Yearling: 4, ,084 Sub Adult: 382 1,097 Rainbow Trout Total: 4, ,181 Walleye Walleye Non-feeding Fry Ontario, L. Toronto Harbour - Unwin Ave. 5 White Lake Bay of Quinte ,080,000 Walleye Summer Fingerling Ontario, L. Toronto Harbour - Polson St. 7 White Lake Bay of Quinte ,059 Walleye Total (not including non-feeding fry): ,059 Section 6. Stocking Program

129 Chinook Salmon Net Pen Imprinting Project C. Lake, Lake Ontario Management Unit The net pen is a floating enclosure that is tied to a pier or other nearshore structure, and is used to temporarily house and acclimatize young Chinook Salmon prior to their release. The fish are held in the net pens for approximately 4-5 weeks, and are managed by local angler groups, who monitor the health of the fish and ensure the fish are fed and the pens are cleaned regularly. Several of the clubs also use the net pens as an outreach tool, involving their local community during delivery and/or release of the fish. Compared to fish released directly from the hatchery, net pen fish are larger, survive better and may have a greater degree of site fidelity, or imprinting, to the stocking site based on marking experiments conducted by the New York Department of Environmental Conservation (NYSDEC). As a result of their time in the net pens as young fish, it is expected that mature fish will return to the area and provide a quality near shore fall fishery for anglers. Net pens were first used in the Ontario waters of Lake Ontario in 2003, when pens were installed in Barcovan and Wellington. Beginning in 2008, the program expanded west across a number of locations. The program has evolved over the years, with some sites dropped while other sites have been added or expanded. A thorough review of the history of the program was described in the 2014 Annual Report Net Pen Program A total of 235,179 Chinook Salmon were held at 8 sites (18 net pens) in This represents 47% of the total number stocked (495,685; Fig a). Overall, fish growth and health was reported as good, with few mortalities. Fish were delivered to the pens at 3.8 g and weighed 9.45 g when released 33 days later (average values across all pen sites). Table shows site-specific details on fish size, duration of penning, and numbers released. Combination temperature/dissolved oxygen data loggers were deployed into one net pen per site so that the health and growth of the fish can be better understood. Degree days, a metric that incorporates site temperature and length of time in the pen, was calculated and included in Table Examining degree days helps make between-site comparisons easier when looking at fish growth. The net pen program has increased considerably over the years, with more net pen sites and a greater percentage of Chinook Salmon allocated to the program. In order to ensure good fish health and growth, a maximum density of 32 a) b) FIG a. Number of Chinook Salmon released ( ) from Ontario net pens versus those stocked directly. FIG b. Average density (g/l) of Chinook Salmon held per net pen. The guideline of 32 g/l is represented by the dashed line. Section 6. Stocking Program
130 122 g/l (grams of fish per liter of water) is used as a guide. The volume of the standard net pen is 4000 liters, so the maximum number of 8.0 g fish that should be held in an individual net pen is 16,000. Each location also deploys a temperaturedissolved oxygen sensor into the pen with the Chinook fingerlings for the duration of the project. The loggers are then downloaded and analyzed by MRNF staff. This information helps understand relative growth rates of the fish between various sites, and could be helpful in the event that unusual die-offs occur. The Ontario program has taken a conservative approach, generally stocking a maximum of 15,000 fish in a pen. Figure 6.2.1b shows the average density of fish (at time of release) in the net pens, with the guideline (32 g/l) denoted by the horizontal dotted line. The average net pen density has been below the guideline every year, but has increased in recent years. TABLE Summary data of the 2017 Chinook Salmon net pen program. Pen Site Volunteer Group # Stocked into pens Number of pens Date stocked Size at stocking ( g) Date released Volunteer Groups: CLOSA (Central Lake Ontario Salmon Anglers); HRSTA (Halton Region Salmon and Trout Assoc.); MEA (Metro East Anglers); PCSTA (Port Credit Salmon & Trout Assoc.); SCFGC (St. Catharines Fish & Game Club) Days held Degree days Size at release ( g) Growth in pen (g) Mort. (# fish) Mortality (%) Number released Bluffer's Park MEA 44,981 3 Apr May % 44,981 Bronte Harbour HRSTA 15,082 2 Apr May % 15,082 Oshawa Harbour MEA 25,054 2 Apr May % 25,054 Port Credit PCSTA 10,009 1 Apr May % 10,009 Port Dalhousie SCFGC 60,048 4 Apr May % 60,029 Port Darlington MEA 25,002 2 Apr May % 25,002 Wellington CLOSA 30,125 2 Apr May % 30,021 Whitby Harbour MEA 25,001 2 Apr May % 25,001 Average 29, % 29,397 Total 235, ,179 Section 6. Stocking Program
131 Stock Status 7.1 Chinook Salmon M. J. Yuille and J. P. Holden, Lake Ontario Management Unit Chinook salmon were stocked in Lake Ontario beginning in 1968 to suppress an overabundant Alewife population, provide a recreational fishery and restore predator-prey balance to the fish community. At present Chinook Salmon are the most sought after species in the main basin recreational fishery, which is supported by a mix of stocked and naturalized fish. Salmon returning to rivers to spawn also support an important shore and tributary fisheries. Ontario s Chinook Salmon stocking levels have remained relatively constant since 1985 (500,000 fish target; Fig ), however cuts to NY stocking rates were agreed upon during lake wide cuts in In 2017, stocking levels of Chinook Salmon were reduced 20% by both OMNRF and NYSDEC (Sections 6.1). Despite recent stable stocking levels, Chinook Salmon CUE in the Fish Community Index Gill Netting has been variable. Catches in 2017 declined from 2016, but are comparable to catches in 2015 (Fig ). Chinook Salmon mark and tag monitoring data were reported from five Lake Ontario Management Unit (LOMU) surveys: i) Western Lake Ontario Boat Angling Survey (Section 2.2 of 2016 Annual Report), ii) Chinook Salmon Angling Tournament and Derby Sampling (Section 2.4), iii) Lake Ontario Volunteer Angler Diary Program (Section 2.3 of 2016 Annual Report), iv) Eastern Lake Ontario and Bay of Quinte Fish Community Index Gill Netting (Section 1.2) and v) Credit River Chinook Salmon Spawning Index (Section 1.8). Community Index Gill Netting (Section 1.2) catches small Chinook Salmon and complements the angler based programs that catch larger fish (Fig ). The year 2016 marked the end of the Chinook Salmon coded wire tag (CWT) study. In general, the maximum age of a Lake Ontario Chinook Salmon is 4 years old. The last stocking event related to the Mark and Tag program was in 2011, thus all fish associated with this program left the Lake Ontario ecosystem in the fall of New York State Department of Environmental Conservation (NYSDEC) will be collaborating with the Lake Ontario Management 4000 NYSDEC OMNR Number Stocked (X 1,000) Catch per standard gillnet FIG Number of Chinook Salmon stocked by New York State Department of Environmental Conservation (NYSDEC) and MNRF from (Section 6.1) Year FIG Number of Chinook Salmon caught per gill net (CUE) from the Fish Community Index Gill Netting Program (see Section 1.2) from Section 7. Stock Status
132 124 Unit in writing a final report on the Chinook Salmon CWT study in the near future. CWTs were collected from the Chinook Salmon Mark and Tag program from 2009 to 2015 and have shown a mixed population of Chinook Salmon (natural reproduced, stocked by New York and stocked by Ontario) originating from geographically widespread stocking locations. The mark and tag monitoring program has confirmed that Chinook Salmon returns to the Credit River tend to originate from fish stocked in the Credit River with a few strays from Bronte Creek stocking locations. Currently, there are two assessment programs on Lake Ontario that involve adipose clipped Chinook Salmon. The Lake Ontario Management Unit continued to collect Chinook Salmon on the Ganaraska River in 2017 with the goal of diversifying Chinook Salmon gamete sources. In contrast to the Credit River, where adult returns are predominantly stocked fish, adult Chinook Salmon returning to the Ganaraska River to spawn are naturalized. Chinook Salmon stocked by LOMU into the Credit River that originated from the Ganaraska River Egg Collection (Sections 1.12 and 6.1) received an adipose clip prior to stocking. LOMU started collecting Chinook Salmon gametes on the Ganaraska River in 2015 and the first stocking event on the Credit River using these fish was in the spring of 2016 (Section 6.1). In addition, NYSDEC has been stocking Chinook and Coho Salmon with adipose clips and CWTs to assess the effectiveness of net pen stocking. Anglers that observed fish with an adipose clip in 2017 could be catching fish associated with either of the aforementioned programs. CUE (No./Ang-hr) CUE Effort FIG Catch rate (CUE) of Chinook Salmon and annual total effort (rod-hrs) in the Ontario waters of Lake Ontario (excluding the Eastern Basin), 1977 to Effort (Rod-hr X 10,000) 2000 (a) Number of Fish (b) Number of Fish Fork Length (mm) FIG Size distribution (fork length in mm) of Chinook Salmon caught (a) in the Fish Community Index Gill Netting Program from (Section 1.2) and (b) by anglers in the Western Lake Ontario Angler Survey from 1995 to Section 7. Stock Status
133 125 Western Basin Angler Survey 11 Salmon Tournament Sampling Credit River Spawning Index 10 Ganaraska River Spawning Index Weight (kg) 9 FIG Number of Chinook Salmon caught (closed circle) and harvested (open circle) annually in the Ontario waters of Lake Ontario (excluding he Eastern Basin), 1977 to Dashed line represents the mean catch and harvest from 1997 to Catch per unit effort (CUE), total catch and total harvest is assessed by the Western Lake Ontario Boat Fishery. This program is on a three-year rotation schedule and was last conducted in In 2016, total effort increased slightly from 2013 (Fig ), but total catch and harvest were 8% and 9% above the mean through 1997 to 2016 (Fig ). Release rates in both the Western Lake Ontario Boat Fishery and the Lake Ontario Volunteer Angler Program have generally increased through time. In 2016, the release rates in the Western Lake Ontario Boat Fishery declined to 50% from the 2004 to 2016 average of 59%. Chinook Salmon release rates reported in the Lake Ontario Volunteer Angler Program were lower in 2016 (55%) compared to 2015 (68%) and 2014 (65%). The condition of Lake Ontario Chinook Salmon has been evaluated through four separate LOMU programs: i) Credit River Chinook Salmon Spawning Assessment (Section 1.8), ii) Ganaraska River Salmonid Assessment (Section 1.12), iii) Chinook Salmon Tournament Sampling (Section 2.4) and iv) Western Lake Ontario Angler Survey. Chinook Salmon in the Credit River and Ganaraska River index have lower conditions relative to fish sampled in the lake during mid-summer when condition should be at a maximum. Overall, Chinook Salmon condition, evaluated using data from the Credit River Chinook Spawning Index Program (Section 1.8), has declined since 1995 (Fig ). In 2012, Credit River Chinook Salmon condition was the lowest in the time series, however, Chinook Salmon condition in the Credit River increased from 2012 to 2016, followed by a slight decline in The condition of Chinook Salmon on the FIG Condition index of Chinook Salmon from Credit River Spawning Index (triangle), Western Basin Angling Survey (square) and the Salmon Tournament Sampling (circle) from Condition index is the predicted weight (based on a log-log regression) of a 914 mm (36 ) total length Chinook Salmon. Ganaraska River has been measured over the past three years (2015 to 2017). On average, the condition of the Ganaraska River Chinook Salmon is lower than the Credit River (Fig ). In contrast, these overall trends were not observed in either the Western Lake Ontario Boat Fishery or the tournament sampling (Fig ). Despite the decline in Chinook Salmon condition from 2011 to 2013 in the Western Lake Ontario Boat Fishery, the 2016 condition index increased and is above the long-term 1995 to 2016 average. A similar decline in condition during 2011 to 2013 was observed in Chinook Salmon sampled in tournaments; however the condition value for Chinook Salmon sampled in 2017 tournaments has been the highest observed in the time series (Fig ). In 2017, LOMU operated the new Riverwatcher fish counting system in the Ganaraska River Fishway from March 28th to November 8th, This marks the longest period of continuous monitoring of migratory salmonids on that river and the first visual recordings of fish passage that cover the entire monitoring period. The first Chinook Salmon to migrate upstream through fishway was observed on June 4th, 2017 and a total of 8,646 Chinook Salmon were observed in 2017 (Fig ; Section 1.12). The Ganaraska River Salmonid Assessment will continue into the future allowing Section 7. Stock Status
134 126 Fish Counted Fish Counted (X 100) (a) (b) Jun-01 Jun-15 Jul-01 Jul-15 Aug-01 Chinook FIG (a) Daily and (b) cumulative observed counts of Chinook Salmon at the Ganaraska River fishway at Port Hope, Ontario from June 4th to November 4th, for the development of new indices on this recreationally important species. LOMU has purchased a second Riverwatcher fish counting system and it will be installed in the Streetsville Fishway on the Kraft Dam, Credit River, Mississauga, ON. This second system is expected to be in testing phase throughout 2018 and become fully operational in This fish counting system will augment current Chinook Salmon programs on the Credit River, providing more information on not only the Chinook Salmon spawning run, but also the spring Rainbow Trout run, and fall salmonid runs. Aug-15 Date Sep-01 Sep-15 Oct-01 Oct-15 Nov-01 With the exception of age-3 females, average length of adult Chinook Salmon returning to the Credit River increased significantly in 2017 (Section 1.8, Fig ). The condition of returning females increased slightly in 2017, however, condition of returning males declined significantly (Section 1.8, Fig ). Body condition of Chinook Salmon collected on the Credit River and Ganaraska River during the egg collection was comparable in 2017 (Fig ). Monitoring and assessment of both Credit River and Ganaraska River salmon and trout provides comparisons between fish populations that are predominantly of stocked origin (Credit River) and completely naturalized (Ganaraska River). Continued monitoring and assessment of these populations on the Credit and Ganaraska Rivers is critical in understanding the dynamic between stocked and naturalized fish populations as well as the success of the Lake Ontario Management Unit s diverse egg collection strategy with Chinook Salmon. Mean summer temperatures for Lake Ontario were above the long-term average in 2017; a sharp contrast to the 2014 and 2015 seasons, which marked the coldest mean summer water temperatures recorded since 2002 (Section 11.1). In addition, the winter 2016 was significantly less severe compared to the previous two years (Section 11.1). While, these two factors may not be the only ones behind the observed declines in Chinook Salmon size, they likely have a significant contribution, as cooler temperatures are associated with lower metabolic activity and growth. Section 7. Stock Status
135 Rainbow Trout M. J. Yuille, Lake Ontario Management Unit The Lake Ontario fish community is a mix of non-native and remaining native species. Rainbow Trout, a non-native species, was intentionally introduced to Lake Ontario in 1968 and has since become naturalized (naturally reproducing fish). Rainbow Trout are the primary target for tributary anglers, who take advantage of the seasonal staging and spawning runs of this species and Rainbow Trout are the second most sought-after species in the Ontario waters of the Lake Ontario offshore salmon and trout fishery. In addition, the spring and fall spawning runs attract high numbers of tourists to local tributaries to watch these fish jump at fishways and barriers along their spawning migration. For all of these reasons, Rainbow Trout are not only ecologically important but recreationally and economically important as well. The OMNRF stocks only Ganaraska River strain Rainbow Trout into Lake Ontario. Stocked numbers of Rainbow Trout were not affected in the 2017 stocking reduction and a total of 158,181 Rainbow Trout were stocked, slightly below the 2008 to 2017 average of 165,280 (Fig ). The spring spawning run of Rainbow Trout in the Ganaraska River has been estimated at the fishway at Port Hope since 1974 (Section 1.1). In 2017, the Lake Ontario Management Unit (LOMU) operated the new Riverwatcher fish counting system in the Ganaraska River Fishway Number Stocked (X 1,000) 1500 NYSDEC OMNR FIG Number of Rainbow Trout stocked by New York State Department of Environmental Conservation (NYSDEC) and OMNRF from (see Section 6.1). from March 28th to November 8th, This marks the longest period of continuous monitoring of migratory salmon and trout on the Ganaraska River and the first visual recordings of fish passage that cover the entire monitoring period. In 2017, the spring Rainbow Trout run in the Ganaraska River increased from 4,987 fish in 2016 to 6,952 fish, but remains below the previous 10 year average (7,392 fish from ; Fig ). Additionally, Rainbow Trout were observed after the spring monitoring period utilising the fishway. Through the entire monitoring period, a total of 8,897 Rainbow Trout were identified migrating upstream through the Ganaraska Fishway (Fig ). The spring run represents 78% of the total number of Rainbow Trout observed in 2017; the majority of the Rainbow Trout using the fishway in the fall were observed after both Chinook and Coho Salmon runs had subsided (Section 1.12). The Lake Ontario ecosystem has changed dramatically during this time series (e.g., phosphorus abatement, dreissenid mussel invasion, round goby invasion). During this time period (1974 to 2016), Rainbow Trout condition has declined (Fig a). With the exceptions of 1994 and 1996, the highest condition values occurred in the 1970 s, prior to invasion of Zebra Mussels, Quagga Mussels and Round Goby. Fish body condition declined through the 1980 s to a low point in From 1990 to 2017, the longterm trend shows slight decline in relative condition. Data on Rainbow Trout condition over the past 10 years are the most informative for the current population (Fig b). Rainbow Trout Number of fish FIG Estimated and observed spring run of Rainbow Trout at the Ganaraska River fishway at Port Hope, Ontario from Estimated Observed Section 7. Stock Status
136 128 condition declined to a low in 2008 then has increased up to 2013, the highest in the whole time series since In 2015, Rainbow Trout condition declined significantly, to the lowest point since Rainbow Trout condition has increased over the past three years; relative condition in 2017 (96%) is comparable to the previous 10 year average relative condition value (97% from 2008 to 2017; Fig b). After a sharp increase in catch per unit effort (CUE) from 1979 to 1984 (the highest in the 34 year time series), the CUE declined until 2004 in the Western Lake Ontario Boat Fishery (Fig ). After 2004 (the lowest CUE since1982), the CUE steadily increased to The Lake Ontario Management Unit, did not evaluate the Western Lake Ontario Boat Fishery in 2014 or 2015, but Rainbow Trout CUE in 2016 showed a significant decline, falling below the average CUE for both the time series ( ) and the past 10 years (2008 to 2016; Fig ). Effort in this fishery has remained fairly stable since 1994 (Fig ). Total numbers of Rainbow Trout caught and harvested in the Western Lake Ontario Boat Fishery naturally followed the same trends found in CUE with total harvest generally lower than total catch (Fig ) (a) Rainbow Relative Condition Relative Condition FIG Relative weight of Rainbow Trout sampled at the Ganaraska River fishway at Port Hope, Ontario for (a) the whole time series and (b) a 10 year average ( ; see Section 1.1). CUE (No./Ang-hr) (a) (b) CUE Effort Effort (Rod-hr X 10,000) Fish Counted FIG Catch rate (CUE) of Rainbow Trout and total effort (rodhrs) in the Ontario waters of Lake Ontario (excluding Kingston Basin), (b) Fish Counted (X 100) Apr-01 Apr-15 May-01 May-15 Jun-01 Jun-15 Jul-01 FIG (a) Daily and (b) cumulative observed counts of Rainbow Trout at the Ganaraska River fishway at Port Hope, Ontario from March 28th to November 8th, Jul-15 Date Aug-01 Aug-15 Sep-01 Sep-15 Oct-01 Oct-15 Nov-01 Nov-15 FIG Number of Rainbow Trout caught (closed circle) and harvested (open circle) annually by the boat fishery in the Ontario waters of Lake Ontario (excluding Kingston Basin), The dashed line represents the mean catch and harvest from 2000 to Section 7. Stock Status
137 Lake Whitefish J. A. Hoyle, Lake Ontario Management Unit Lake Whitefish is a prominent member of the eastern Lake Ontario cold-water fish community and an important component of the local commercial fishery. Two major spawning stocks are recognized in Canadian waters: one spawning in the Bay of Quinte and the other in Lake Ontario proper along the south shore of Prince Edward County. A third spawning area is Chaumont Bay in New York State waters of eastern Lake Ontario. Commercial Fishery Lake Whitefish commercial quota and harvest increased from the mid-1980s through the mid-1990s, declined through to the mid-2000s then stabilized at a relatively low level (Fig ). Quota and harvest averaged 122,000 lb and 80,000 lb respectively, over the time-period. In 2017, base quota was 134,883 lb, issued quota was 137,455 lb and the harvest was 68,242 lb (Section 3.2). In recent years, most of the harvest occurs in quota zone 1-2, eastern Lake Quota or Harvest (lb) 800, , , , , , , ,000 - Quota Harvest Year FIG Lake Whitefish commercial quota and harvest, Harvest (lb) 700, , , , , , , Year FIG Lake Whitefish commercial harvest by quota zone, Ontario (Fig ). Here, most of the harvest occurs at spawning time in November and early December (Fig ). Although harvest at other times of the year is less than at spawning time, considerable gill net fishing effort does occur. Highest harvest rates (HUE) occur at spawning time. The age distribution of Lake Whitefish harvested is comprised of many age-classes (Fig ). Most fish are age-5 to age-14. Abundance Lake Whitefish abundance is assessed in a number of programs. Summer gill net sampling is used to assess relative abundance of juvenile and adult fish in eastern Lake Ontario (Fig , and see Section 1.2). Young-of-the-year (YOY) abundance is assessed in bottom trawls (Section 1.3) at Conway (lower Bay of Quinte) and Timber Island (EB03 in eastern Lake Ontario) (Fig ). Lake Whitefish abundance, like Effort (yards) Harvest (lb) 450, , , , , , , ,000 50,000 Effort Spawn Other , , , , , , ,000 HUE 50,000 Harvest Spawn Other HUE Spawn Other FIG Commercial Lake Whitefish gill net fishing effort (top panel), harvest (middle panel), and harvest-per-unit-effort (HUE; bottom panel) in quota zone 1-2, Spawn includes November and December, and Other includes January through October. Section 7. Stock Status
138 130 Proportion of harvest Proportion of harvest FIG Lake Whitefish age distributions (by number) in the 2017 quota zones 1-2 (upper panel) and 1-3 (lower panel) fall commercial fisheries. commercial harvest, has been stable at a relatively low level for the last decade. Young-of-the-year catches have been highly variable. Growth Trends in length-at-age for Lake Whitefish caught during summer assessment gill nets for age -2, age-3, and age-10 (males and females) fish are shown in Fig Generally, fork length-at-age declined during the 1990s then stabilized in the early 2000s. Condition Quota Zone 1-2 (Lake Stock) Mean age = 10.2 years (n = 110) Age (years) Quota Zone 1-3 (Bay Stock) Mean age = 8.1 years (n = 84) Age (years) Trends in Lake Whitefish condition during summer and fall are shown in Fig Condition was high from , declined through Condition then increased to intermediate levels for Lake Whitefish sampled during summer but condition remained low for fish sampled during fall. Catch per gillnet Catch per trawl FIG Lake Whitefish abundance in eastern Lake Ontario assessment gill nets, (sub-adult and adult; upper panel) and bottom trawls, (young-of-the-year; lower panel). Fork length (mm) Age-2 Age-3 Age-10 Male Year Year Age-10 Female Year Bay of Quinte Lake Ontario FIG Trends in Lake Whitefish fork length-at-age for age-2, age-3, age-10 males and females, caught in summer assessment gill nets, Overall Status Following severe decline in abundance, commercial harvest, growth and condition, during the 1990s, the eastern Lake Ontario Lake Whitefish population appears to have stabilized at a much reduced but stable level of abundance, and condition. Section 7. Stock Status
139 Summer Relative weight (%) Relative weight (%) Fall Spawning Bay Stock Lake Stock FIG Condition (relative weight) of Lake Whitefish sampled during summer assessment gill net surveys in eastern Lake Ontario (upper panel error bars ±2SE) and fall commercial catch sampling (lower panel) in the Bay of Quinte ( Bay Stock ) and the south shore Prince Edward County ( Lake Stock ), Section 7. Stock Status
140 Walleye J. A. Hoyle, Lake Ontario Management Unit Walleye is the Bay of Quinte fish community s primary top piscivore and of major interest to both commercial (Section 3.2) and recreational fisheries (Section 2.2). The Walleye population in the Bay of Quinte and eastern Lake Ontario is managed as a single large stock. The Walleye s life history-specific movement and migration patterns between the bay and the lake determines the seasonal distribution patterns of the fisheries. Understanding Walleye distribution is also crucial to interpret summer assessment netting results (Sections 1.2 and 1.3). After spawning in April, mature Walleye migrate from the Bay of Quinte toward eastern Lake Ontario to spend the summer months. These mature fish return back up the bay in the fall to over-winter. Immature Walleye generally remain in the bay year-round. In 2017 a multi-year acoustic telemetry project was initiated to describe Bay of Quinte-eastern Lake Ontario Walleye movement at a finer scale than currently exists (Section 9.9). Recreational Fishery The recreational fishery consists of a winter ice-fishery and a three season (spring/summer/ fall) open-water fishery. Most Walleye harvest by the recreational fishery occurs in the upper and middle reaches of the Bay of Quinte during the winter ice-fishery (Fig ) and the spring/early summer open-water fishery. All sizes of fish are caught during winter while mostly juvenile fish (age-2 and age-3) are caught during spring and summer. A popular trophy Walleye fishery occurs each fall based on the large, migrating fish in the middle and lower reaches of the Bay of Quinte at that time (see Section 2.3). Increasingly in recent years, there is also a late-summer fishery in eastern Ontario targeted at these large Walleye prior to their return to the Bay of Quinte. Trends in the open-water fishery are shown in Fig (see also Section 2.2). Annual Walleye angling effort and catch (ice and open-water fisheries combined) has been relatively stable averaging over 330,000 hours and 63,000 fish caught during the last decade. Walleye catch and harvest spiked in the 2017 open-water fishery (102,351 and 52,651 fish, respectively) as two very strong yearclasses (age-2 and 3) recruited to the fishery (see Section 2.2). Walleye catch (number) FIG Bay of Quinte recreational angling effort and walleye catch (released and harvested) during the winter ice-fishery, No data for 2006, 2008, , 2015 or Walleye catch (number) 60,000 50,000 40,000 30,000 20,000 10, , , , , , ,000 50,000 - FIG Bay of Quinte recreational angling effort and walleye catch (released and harvested) during the open-water fishery, No data for 2007, , or Commercial Fishery Walleye harvest by the commercial fishery is highly regulated and restricted. No commercial Walleye harvest is permitted in the upper and middle reaches of the bay (Trenton to Glenora). A relatively modest Walleye commercial quota (48,092 lbs; Fig ) is allocated in the lower Bay of Quinte and Lake Ontario with additional seasonal, gear, and fish-size restrictions. The commercial harvest of Walleye was 31,741 lbs in Commercial Walleye harvest has shifted location from quota zone 1-2 to 1-4 over the last decade (Fig ). This shift has likely resulted in smaller, younger Walleye being harvested but this has not been measured. Annual Harvest Released Harvested Effort Released Harvested Effort , , , , , , ,000 50, , , , , , , ,000 Total annual Walleye harvest in the recreational and commercial fisheries (by number and weight) over the last decade ( ) is given in Table The recreational fishery takes about 80% of the annual harvest with the open-water component of the recreational fishery - - Angling effort (hours) Angling effort (hours) Section 7. Stock Status
141 133 Quota or Harvest (lb) 90,000 80,000 Harvest Quota 70,000 60,000 50,000 40,000 30,000 20,000 10, Year FIG Walleye commercial quota and harvest, TABLE Mean annual Walleye harvest by major fishery over the last decade ( ). Recreational Number of fish Walleye harvest lbs % by number % by weight ice-fishery 9,245 29,724 19% 27% open-water fishery 30,131 57,572 61% 51% Commercial 9,902 24,755 20% 22% 40, Total 49, , % 100% Harvest (lb) 30,000 20,000 10,000 - FIG Walleye commercial harvest by quota zone, making up 61% (by number) of total annual harvest. Abundance Year Walleye abundance is assessed in a number of programs. Summer gill net sampling (Section 1.2) is used to assess relative abundance of juvenile (Bay of Quinte) and adult (eastern Lake Ontario) fish (Fig ). Fig shows the 2017 Walleye age distribution in these two geographic areas. Young-of-the-year (YOY) abundance is assessed in Bay of Quinte bottom trawls (Fig ; Section 1.3). Except for an unusually high catch in 2013, juvenile abundance in the Bay of Quinte has been relatively stable since 2001 (Fig ). The 2017 catch was high with a large contribution of age-2 and 3 fish. In eastern Lake Ontario index gill nets, after an unusually low catch in 2013, Walleye abundance in eastern Lake Ontario increased to a level similar to that observed in the previous few years. The 2017 catch was high (Fig ). The 2014 catch of YOY Walleye in bottom trawls was the highest since 1994 (Fig ) and the 2015 year-class was also very large. The 2016 yearclass was of moderate strength, and the 2017 year -class was poor. Nonetheless, these recent yearclasses foreshadow continued stability in the Walleye population and fisheries. Catch per gill net Catch per gill net Bay of Quinte Year Eastern Lake Ontario Year FIG Walleye abundance in summer gill nets in the Bay of Quinte, (upper panel) and eastern Lake Ontario, (lower panel). Also shown (dotted line) is the Bay of Quinte FMP (Fisheries Management Plan) target for these two components of the Walleye population. Number of fish Number of fish Bay of Quinte Age (years) Eastern Lake Ontario Age (years) FIG Walleye age distribution in 2017 summer gill nets in the Bay of Quinte (upper panel) and Lake Ontario (lower panel). Section 7. Stock Status
142 134 Catch per trawl FIG Young-of-the-year (Age-0) Walleye catch per trawl in the Bay of Quinte, Also shown (dotted line) is the Bay of Quinte FMP (Fisheries Management Plan) target catch per trawl. Growth Walleye length-at-age for age-2 and age-3 juvenile fish and age-10 mature fish (males and females separated) is shown in Fig Length -at-age increased for juvenile (age-2 and 3) fish in 2000 and remained stable since. For mature fish (age-10), length-at-age has remained stable with females being larger than males. Condition Age-0 Walleye Year-class Walleye condition (relative weight) is shown in Fig Condition has remained stable in Bay of Quinte fish (immature) and showed an increasing trend in Lake Ontario (mature fish) until 2014 when condition declined sharply; condition increased in 2015 and 2016 and held steady in Other Walleye Populations Target The Bay of Quinte/eastern Lake Ontario Walleye population is the largest on Lake Ontario; smaller populations exist in other nearshore areas of the Lake Ontario. Walleye in these other areas are regularly assessed with a standard trap net program (Nearshore Community Index Netting; see Section 1.4). Mean Walleye trap net catches ( compared to time-periods) in 8 geographic nearshore areas are shown in Fig Highest Walleye abundance occurs in the Bay of Quinte, East Lake, West Lake, Weller s Bay and Hamilton Harbour. Walleye abundance increased in Hamilton Harbour after stocking efforts began in Fork length (mm) Age-10 Female FIG Trends in Walleye fork length-at-age for age-2, age-3, age-10 males and females, caught in summer assessment gill nets, Relative weight (Wr) Walleye Stocking Walleye were stocked into Toronto Harbour (see Section 6.1) in an effort to reestablish this native, predatory fish and to promote urban, near-shore angling. Approximately 1 million fry were stocked in the spring of 2017, followed by over 100,000 fingerlings stocked in July. Walleye stocking is planned to alternate annually between Toronto Harbour and Hamilton Harbour (first stocked in 2012). Overall Status Bay of Quinte Lake Ontario Year Age-2 Age-3 Age-10 Male Year FIG Trends in Walleye condition (relative weight), caught in summer assessment gill nets in the Bay of Quinte (fish <500 mm fork length) and Lake Ontario (fish >500 mm fork length), The overall status of Lake Ontario Walleye is good. The Bay of Quinte/eastern Lake Ontario population did decline during the 1990s but stabilized at levels that still supports a high quality fishery, and recent recruitment levels are positive. Section 7. Stock Status
143 135 Fish per trap net Hamilton Harbour Toronto Harbour Presqu'ile Bay Weller's Bay West Lake East Lake Prince Edward Bay Upper Bay of Quinte FIG Walleye abundance (mean annual number of fish per trap net) in 8 geographic nearshore areas of Lake Ontario arranged from west (Hamilton Harbour) to east (Upper Bay of Quinte). Catches are annual means for all sampling from and time-periods with individual areas having been sampled from one to six years within a time-period. Section 7. Stock Status
. The species support important recreational and commercial fisheries (see Sections 2.2 and 3.")

144 Yellow Perch J. A. Hoyle, Lake Ontario Management Unit Yellow Perch is one of the most ubiquitous and abundant species in the Lake Ontario and St. Lawrence River warm and coolwater fish community (see Sections 1.2, 1.3 and 1.7). The species support important recreational and commercial fisheries (see Sections 2.2 and 3.2), and are prey for nearshore predators. Recreational Fishery The most significant Yellow Perch recreational fishery occurs on Lake St. Francis, below the Cornwall dam on the St. Lawrence River. The most recent angling survey of this fishery estimated that anglers caught and harvested 363,217 (9.1 perch per hour by anglers targeting Yellow Perch) and 144,925 perch, respectively from May 10 to Oct 4, On the Bay of Quinte in northeastern Lake Ontario, large numbers of Yellow Perch are caught by anglers that are otherwise primarily targeting Walleye. In a 2017 openwater angler survey on the Bay of Quinte, an estimated 261,747 perch were caught (2.1 perch per hour for anglers targeting Yellow Perch) but only 16,497 were harvested (see Section 2.2). Commercial Fishery Yellow Perch was the most important species, in terms of both total weight (182,974 lb) and landed value ($434,222), in the 2017 Lake Ontario and St. Lawrence River commercial fisheries (see Section 3.2). Most of the harvest was taken in the Bay of Quinte and the St. Lawrence River. Total annual Yellow Perch commercial harvest declined to a low point in 2015 and commercial quota was decreased in 2016 and again in Harvest and landed value increased in 2016 and 2017 (Fig ). Abundance Yellow Perch abundance is assessed in a number of index netting programs (see Sections 1.2, 1.3, 1.4 and 1.7). Long-term trends in Yellow Perch biomass in assessment gillnets (Section 1.2) is shown in Fig Overall biomass was low through the 2012 to 2015 time-period and increased in 2016 and again in Abundance targets set in the Bay of Quinte FMP (Fisheries Management Plan) for the Bay of Quinte and eastern Lake Ontario are shown in Fig Yellow Perch abundance is currently below target values in both areas, particularly in eastern Lake Ontario; abundance appears to be increasing in the Bay of Quinte. FIG Yellow Perch commercial harvest, quota and landed value trends for the Lake Ontario (including East and West Lakes) and the St. Lawrence River, Yellow Perch abundance in the Thousand Islands area of the upper St. Lawrence River increased in 2017 (see Section 1.7, Fig, 1.7.3). FIG Yellow Perch biomass trends at multiple sampling areas in eastern Lake Ontario (from Brighton in central Lake Ontario east to Melville Shoal near the mouth of the St. Lawrence River) and the Bay of Quinte, See map in Section 1.2 (Fig ). Section 7. Stock Status
145 137 FIG Yellow Perch abundance trends in the Bay of Quinte and eastern Lake Ontario, Also shown (dotted lines, ) are target abundance levels established in the Bay of Quinte FMP (Fisheries Management Plan). Section 7. Stock Status
146 Lake Ontario Prey Fish B.C. Weidel Lake Ontario Biological Station, USGS J.P. Holden Lake Ontario Management Unit M.J. Connerton Cape Vincent Fisheries Station, NYSDEC Managing Lake Ontario fisheries in an ecosystem-context requires prey fish community and population data. The abundance of current and future prey fish resources provides important context for establishing Salmon and Trout stocking levels and managing for sustainable recreational fisheries. The historical prey fish community was thought to have been dominated by cisco species (Cisco and deepwater forms such as Bloater). Alewife and to a lesser extent, Rainbow Smelt have been the dominant species throughout the modern era (1900s to present). The off-shore benthic fish community was largely a mix of sculpin species (Deepwater, Spoonhead and Slimy Sculpin) while Spottail Shiner, Johnny Darter, and Trout-perch were abundant closer to shore. The recent establishment of Round Goby and recovery of Deepwater Sculpin populations have further changed the diversity within the benthic prey fish community. Bottom trawls have been the primary prey fish assessment gear for the majority of the data series. Bottom trawling in the Bay of Quinte and Kingston Basin has been conducted annually (except 1989) since 1963 (Section 1.3 for additional details). In US waters, an extensive, multi-season trawl program began in These programs operated independently of each other for most of the survey history. In 2015 the US fall trawl program was expanded to a whole-lake survey with the addition of multiple sites in Canadian waters conducted by OMNRF and USGS (Section 1.11). The US spring survey was similarly expanded in 2016 (Section 1.11). The acoustic program has supplemented Alewife and Rainbow Smelt assessment since 1997 with a greater emphasis on conducting mid-water trawling targeting Cisco and Bloater beginning in 2016 (Section 1.6). Alewife Alewife are the dominant prey fish in Lake Ontario and are the primary prey item for important pelagic predators (e.g. Chinook Salmon, Rainbow Trout) as well as other recreationally important species such as Walleye and Lake Trout. It is important to monitor Alewife abundance because significant declines in their abundances in Lakes Huron and Michigan lead to concurrent declines in Alewife-dependent species such as Chinook Salmon. However, having Alewife as the principal prey item can lead to a thiamine deficiency in fish that eat Alewife, which has been linked to undesirable outcomes like reproductive failure in Lake Trout as well as Early Mortality Syndrome (EMS). Adult Alewife (age-2 and older) mean abundance in the spring trawl survey increased in US waters relative to 2016 but declined in Canadian waters (Fig ). The 2016 US adult Alewife abundance index value is likely the lowest ever observed since contemporary surveys began in A slightly lower value was observed in 2010 but subsequent cohort analyses indicate that value was biased low. The 2016 value resulted from two concurrent years of low reproductive success in 2013 and 2014, which is illustrated in Fig as low numbers of Age-1 Alewife captured in 2014 and The spring survey targets Alewife at a time when their demersal, winter behavior maximizes their susceptibility to bottom trawls. Depth distribution differs throughout the other programs as does the overall catch numbers (Fig ). Cisco Cisco were thought to be the historically dominant native fish species in Lake Ontario prior to European colonization. Even throughout the early part of the 20th century Cisco supported important commercial fisheries. Cisco are the only remaining form of a diverse flock that included four other forms. At present Cisco represent only small fraction of the lake-wide pelagic prey fish community. Population dynamics show declining commercial catches from the 1950s. All surveys show an increase in abundance in the late 1980s to early 1990s followed by a period of low abundance. The most recent years indicate a period of higher abundance Section 7. Stock Status
147 139 FIG Lake Ontario spring bottom trawl-based abundance indices for adult Alewife (age-2 and older, left panel) and age-1 Alewife (right panel). Values represent a stratified, area weighted mean number of Alewife captured in a 10 minute trawl. Error bars represent a standard error of the mean. Trawling in Canadian waters was included in 2016 but to maintain comparisons, separate indices are illustrated for Canadian and US waters which constitute 52% and 48% of lake by area respectively. (Fig ). Fish community changes had already occurred before the establishment of the current assessment programs therefore we lack a historical CUE information from when Cisco dominated the system to provide context to contemporary CUE. Lake Superior, a system where Cisco still dominate the fish community, provides a biological reference point for Lake Ontario. Acoustic estimates (0.5 kg/ha in 2016, 1.2 kg/ha in 2017) (are still well below comparable Lake Superior estimates (5.5 kg/ha). Other Pelagic Fishes FIG Alewife size and distributions from spring bottom trawl surveys conducted in US waters of Lake Ontario, Each Alewife year class (all the fish born in a given year) are represented by a consistent color or pattern. The low catches of Age-1 fish in 2015 and 2016 (2nd and 3rd panels) contributed to management concerns for Alewife population that resulted in salmonid stocking reductions in 2017 and The catch of Age-1 fish in 2017 (2016 year class, bottom panel) was the largest ever observed in the survey. Rainbow Smelt abundance declined through the 2000s but appears to have established a new lower equilibrium (Fig ). Smelt fishing during the spring spawning period was a popular activity throughout Lake Ontario when populations were at much higher levels. High abundance of Rainbow Smelt however has been thought to negatively impact native species. For example, the decline of the native Cisco population in the 1940s coincided with high abundance of Rainbow Smelt. While still the second most abundant pelagic species, Alewife still contributes the majority of fish biomass in predator diets. Section 7. Stock Status
148 140 FIG Lake Ontario Alewife catch varies substantially across sampling depths across seasons. Individual values represent Alewife weight according to the area of lake bottom swept by the bottom trawls. Note, different trawls are used on the spring (left) and fall (right) survey and the summer index is derived from hydroacoustics (center). Threespine Stickleback catches were high for a brief period in the late 1990s but are now caught only infrequently. Emerald Shiner catches are have had brief periods of moderately higher abundance however their catches in the trawl surveys are generally quite low even at peak abundance. Benthic Fishes In 2017, Deepwater Sculpin were the most abundant benthic prey fish since Round Goby abundance declined sharply from 2016 (Fig ). Deepwater Sculpin were once thought to be extirpated from Lake Ontario, but their abundance and biomass indices have increased steadily in annual surveys since Slimy Sculpin density continues to decline as the 2017 biomass index for US waters was the lowest ever observed. Prior to Round Goby proliferation, juvenile Slimy Sculpin comprised ~10% of the catch, but since 2004 the average of that value is less than 0.5%, suggesting Round Goby are limiting Slimy Sculpin reproduction. FIG Lake Ontario Cisco time series including gillnet catch per unit effort for two surveys, bottom trawl catch per effort from US waters and commercial catch statistics for Ontario and New York. Section 7. Stock Status
149 141 FIG Abundance indices for other Lake Ontario pelagic prey fishes based on bottom trawls in U.S. and Canadian waters, Error bars represent one standard error. FIG Lake Ontario prey fish trends for demersal or bottom-oriented species from (left panels) and (right panels). Survey is conducted in late-september and early-october and error bars represent one standard error. Sampling in Canadian waters began in Separate 20m stratified, lake area-weighted means are calculated separately for tows in US and Canadian waters to maintain comparability across the US index time series. Section 7. Stock Status
150 Species Rehabilitation 8.1 Introduction A. Mathers, Lake Ontario Management Unit OMNRF works with many partners government agencies, non-government organizations and interested individuals at local, provincial and national levels to monitor, protect and restore the biological diversity of fish species in the Lake Ontario basin (including the lower Niagara River and the St. Lawrence River downstream to the Quebec-Ontario border). Native species restoration is the center piece of LOMU's efforts to restore the biodiversity of Lake Ontario. The sections following describe the planning and efforts to restore Atlantic Salmon, American Eel, Bloater, Lake Trout, and Lake Sturgeon. Some of these species have been extirpated while others were once common but are now considered rare, at least in some locations in the lake. Successful restoration of these native species would be a significant milestone in improving Ontario s biodiversity and help to address Ontario s commitments under the GLFC s Fish Community Objectives and commitments identified in the Great Lakes Water Quality Agreement. Section 8. Species Rehabilitation
151 Atlantic Salmon Restoration M.D. Desjardins, Lake Ontario Management Unit Atlantic Salmon were extirpated from Lake Ontario by the late 1800s, primarily as a result of spawning and nursery habitat loss in streams. As a top predator, they played a key ecological role in the offshore fish community. They were also a valued food resource for aboriginal communities and early Ontario settlers. As such, Atlantic Salmon are recognized as an important part Ontario s natural and cultural heritage. Originating as a small stocking program in 1987, the Lake Ontario Atlantic Salmon Restoration Program has developed into a significant partnership combining the efforts of the Ontario Ministry of Natural Resources and Forestry (MNRF), the Ontario Federation of Anglers and Hunters (OFAH), and many corporate and community partners. Since 2006, significant progress has been made through enhancements in fish production, community involvement, research and assessment, and habitat enhancement. However, progress toward some program benchmarks has not kept pace. Specifically, the program has failed to generate sufficient numbers of returning adult fish to achieve program goals. In 2015, the program steering committee developed a revised five-year plan ( ) with new priorities and performance measures designed to accelerate restoration with emphasis on improving adult returns. One new program objective was to advance the creation of a recreational tributary fishery in hopes of garnering more support for the program. To implement this objective, catch and release Atlantic salmon seasons were implemented in zones 16 and 17 in 2016 and a portion of our current restoration stocking allotment has been diverted toward the Ganaraska River to create an Atlantic Salmon destination fishery. Since 2016, roughly 50 thousand yearling Atlantic salmon have been stocked annually in the Ganaraska River (Section 6.1). To help monitor progress, a new state of the art fish counter /camera has been installed in the fish way on Corbett s Dam. This new technology will also provide valuable information on the migratory patterns for other species running up the Ganaraska River. This past field season served as a trial year to fine tune operational and analytical requirements. Although it is still too premature to see a response from our stocking efforts, results have been encouraging (Section 1.12) and provide confidence in the technology to detect Atlantic Salmon when the begin to show-up in the Ganaraska. Plans are in place to install an additional unit in the Credit River in This new technology will vastly improve our ability to monitor returning salmon and trout species in Lake Ontario tributaries. Section 8. Species Rehabilitation
152 American Eel Restoration A. Mathers, Lake Ontario Management Unit Background The American Eel (Anguilla rostrata) was historically an important predator in the nearshore fish community of Lake Ontario and the upper St. Lawrence River (LO-SLR). They also functioned as an important component of the LO-SLR commercial fishery during the latter part of the 20th century, and are highly valued by indigenous peoples. American Eel abundance declined in the LO-SLR system as a result of the cumulative effects from a variety of factors including: mortality during downstream migration due to hydro-electric turbines, reduced access to habitat imposed by man-made barriers to upstream migration, commercial harvesting, contaminants, and loss of habitat. By 2004, American Eel abundance in Ontario had declined to levels that warranted closure of all commercial and recreational fisheries in the province. In 2007, American Eel was identified as Endangered under Ontario s Endangered Species Act (ESA). In 2012 the Committee on the Status of Endangered Wildlife in Canada (COSEWIC) recommended that American Eel be identified as Threatened under the Canadian Species at Risk Act. These events led to additional efforts to protect and restore the American Eel. This section describes the current status of American Eel in LO-SLR as well as actions taken by the Lake Ontario Management Unit and its partners to reverse the decline of American Eel populations in Lake Ontario and the St. Lawrence River. Indices of Eel Abundance Moses Saunders Eel Ladder Operation The largest barriers to both upstream and downstream migration of American Eels into the Lake Ontario system are power dams in the St. Lawrence River. One of these dams, the Moses Saunders Power Dam (MSPD), is located on the upper St. Lawrence River between Cornwall, Ontario and Massena, New York. In 1974, an eel ladder (Saunders Ladder) was put in place on the Ontario portion of the dam in order to aid in the upstream passage of American Eel. The maintenance and operation of the ladder has been maintained and upgraded through collaborations between OMNRF and Ontario Power Generation (OPG) in the years since, and OPG took full responsibility of the operation and maintenance of the ladder in In 2017, the Saunders eel ladder was in operation 24 hours a day from June 15 to October 15. Over the course of these four months, passive integrated transponder (PIT) tag readers and an electronic fish counter were used to monitor the use of the ladder and quantify the number of eels passing upstream. The PIT tag reader and counter operated uninterrupted throughout the season. In 2017, a total of 77 eels successfully passed through the OPG eel ladder (Fig ) which represents the lowest number of eels passed ever recorded. The majority of eels passed through the ladder during a six week period from early July to late August and all eels exited the ladder during hours of darkness from 22:00 to 06:00. The number of eels passed through the OPG ladder during 2017 was far lower than the number of eels that passed through a second eels ladder (Moses Ladder) on the New York portion of the MSPD where 6,644 eels successfully exited. The Moses Ladder has been in operation since 2006 and has been maintained by the New York Power Authority (NYPA). During 2012 to 2017, the NYPA ladder passed somewhat more eels than the OPG ladder and made up 53% of the total number that passed. The combined number of eels that passed through both ladders (6,721 eels) was the lowest since 2003 when only the OPG ladder was in operation. During 2001 to 2011 there was an annual increase in the number exiting the ladder (s) but since 2011 the numbers have been declining annually by approximately 8,000 fish per year. The number of eels ascending the ladders in 2017 is less than 1% of the level of recruitment identified as a long-term indicator in the Lake Ontario Fish Community Objectives for American Eel (FCO 1.3; at least one million eels ascending the ladders annually). Section 8. Species Rehabilitation
153 145 The year 2017 was a year of record high water levels on the Great Lakes due to a great deal of snow melt and rain. To reduce these high water levels, record high flows were passed at both the MSPD and the Long Sault Dam. This passage of water through Long Sault Dam appears to have resulted in upstream migrating juvenile eels following this flow past the west end of the MSPD another 6 km upstream through the South Channel bypass reach to the base of the Long Sault Dam. This movement upstream to Long Sault Dam bypasses the entrance to the OPG ladder, located at the east end of MSPD. The Moses ladder would be more likely encountered by upstream migrating eels at the confluence of the South Channel with the tailrace of MSPD. An analysis of NYPA eel passage data strongly suggests that eel passage at the American facility was inversely related to flows through Long Sault Dam. Both the OPG ladder and the NYPA ladder saw increased in eel passage immediately following the closing of the gates at Long Sault Dam. Biological characteristics were recorded on 75 eels collected from the OPG ladder during The average length (419.8 ± 88.2 mm, n=75, range: mm) and average weight (105.9 ± 75.0g, n=75, range: g) was similar to what has been observed in recent years with a trend for slightly larger fish since These values are also similar to the average length (430.6 mm, n=529) and weight (113.3g, n=529) recorded from the NYPA ladder. Lake Ontario and Upper St. Lawrence River Assessment programs In 2017, the abundance of larger yellow eels in the LO-SLR was measured with several assessment programs. Bottom trawling in the Bay of Quinte has been conducted since 1972 as part of the fish community index program. The average catch of American Eel in 511 trawls conducted (June-September at sites upstream of Glenora) between 1972 and 1996 was 2.0 eels per trawl. No eels were captured in the 360 trawls conducted between 2003 and 2011 and less than 3 eels have been captured during the forty bottom trawls conducted annually between 2012 and Total number of eels Moses Saunders FIG Total number of eels ascending the eel ladders at the Moses-Saunders Dam, Cornwall, Ontario from During 1996, the ladder operated however no counts were made. Section 8. Species Rehabilitation
154 146 Nearshore trap netting was conducted using the NSCIN fish community index protocol (see Section 1.4). During 2017, one eel was captured in 24 nets set in West Lake, one eel was captured in 24 nets set in Prince Edward Bay, no eels were captured in the 24 nets set in East Lake, and five eels were captured in 36 nets set in the Upper Bay of Quinte. Tail Water Survey In 2017, surveys were conducted by OPG to collect dead eels in the Canadian water from the tail water of the MSPD. The surveys followed standardized routes which extended approximately 10 km downstream of the dam along the Canadian shoreline. Tail water surveys were conducted from twice weekly on each Tuesday and Friday from June 13 to September 28, Investigators working in a boat searched the specified area for dead and injured American Eels that were floating or submerged along or near the shoreline. In 2017, OPG observed a total of 35 eels were collected during 32 surveys, an average of 2.0 eels per day while NYPA observed 1.1 eels per day during their survey of US waters below the MSPD (Fig ). The average length of whole eels (n=7) collected by OPG was 910 ± 70 mm (mean ± SD) (Fig ). Abundance of collected eels was highest in September with 12 eels collected. Most eels (91%) were collected when water temperatures were greater than or equal to 20 C. These results are similar to those of previous years, although fewer eels were collected in 2017 as compared to 2016 (n=64). Average number per day NYPA OPG Method 1 OPG Method FIG Average number of eels observed per day in the tailwaters of the Moses-Saunders Dam Note that the OPG sampling methodology and route changed in Restoration Efforts Effectiveness Monitoring of Stocked Eels In one component of the OPG Action Plan for Offsetting Turbine Mortality of American Eel, over 4 million glass eels were stocked into the LO -SLR between 2006 and All stocked eels were purchased from commercial fisheries in Nova Scotia and were marked with oxytetracycline to distinguish them from eels that migrated naturally. Prior to stocking, health screening for a wide variety of fish pathogens (including Anguillicolodes crassus) was conducted at the Atlantic Veterinary College. As prescribed in the current Action Plan, eels have not been stocked since DFO and OPG have collaborated to monitor the effectiveness of American Eel stocking through the night-time electrofishing of pre-established transects in the St. Lawrence River (Jones Creek, Grenadier Island, and Rockport) the Bay of Quinte (Deseronto, Big Bay, and Hay Bay) and Prince Edward Bay. In the spring of 2017, one hundred and sixty 100 m long electrofishing transects were sampled in these areas and a total of 130 eels were enumerated. Of the 130 American Eels observed or netted, 48 were captured, 2 were measured and weighed before being released, and 46 were sacrificed for age, growth, and origin assessment. Spring density estimates during 2017 were much lower in all three survey areas relative to the peak density in 2013 (Fig ). In 2017, density estimates fell by half in the St. Lawrence River (39.3 ± 7.6 eels/hectare) and by two-thirds in the Bay of Quinte (32.0 ± 5.8 eels/hectare). Density estimates in the control sites in Prince Length (cm) Length Age FIG Length (mean ± standard deviation) and age (mean ± standard deviation) of eels collected in the tail-waters of the Moses- Saunders Dam Age (years) Section 8. Species Rehabilitation
155 147 Edward Bay (14.0 +/- 12.1) fell by half in 2017, after having remained quite stable over the previous 4 years. The decline in overall density is not surprising as natural recruitment remains low, stocking has not occurred since 2010, and the number of eels out-migrating is increasing. Following the large declines in density estimates, the spring biomass estimates declined in all locations (Fig ). During 2017, biomass estimates were nearly identical in the Bay of Quinte and the upper St. Lawrence River. Ages were determined for 46 fish (25 from the St. Lawrence River and 20 from the Bay of Quinte and one eel from Prince Edward Bay). For the St. Lawrence River location, included only fish from the 2009 and 2010 stocking years. All of the year-classes stocked in the Bay of Quinte ( ) were present. Given the current growth rates, it is estimated that the majority of stocked eels will out-migrate within the next 4 years. Trap and Transport Safe downstream passage past hydro turbines during the eel s spawning migration is an obstacle to restoration of eel that is identified in the OPG Action Plan. Trap and Transport (T&T) of large yellow eels was initiated in 2008 as an OPG pilot project to investigate this alternative for mitigating mortality of eels in the turbines at the Saunders Hydroelectric Dam. The project also involved local commercial fishers and the Québec Ministère des Forêts, de la Faune et des Parcs (MFFP). LOMU staff assisted OPG in the collection of eels captured in local commercial Mean density (eels/ha) Upper St Lawrence River Bay of Quinte Prince Edward Bay FIG Mean eels per hectare ± standard error of stocked American eel enumerated in spring transects, by study area. fisheries and transport of these fish from LO-SLR to Lac St. Louis (a section of the St. Lawrence River below all barriers to downstream migration). During , only eels collected during the spring commercial fishery were included in T&T. Since 2014, eels collected during the fall commercial fishery were also included in the T&T project in an effort to increase the numbers of eels transported. A total of 4,970 large yellow eels (912 and 56 from Lake St. Francis (LSF) in the spring and fall respectively, and 1,781 and 2,221 from above the Moses-Saunders Dam during the spring and fall respectively) were released into Lac St. Louis immediately downstream of the Beauharnois Hydroelectric Dam as part of the T&T program (Fig ). During release, all T&T eels were observed to be in good health and swam away from the release site and down towards the substrate. The mortality of large yellow eels during both the spring (5 eels died) and fall (9 eels died) capture phases of the program was low in MFFP Silver Eel Fishery Monitoring To monitor the abundance of stocked eels in the out-migration to the spawning grounds, staff from MFFP monitored the silver eel weir fishery in the St. Lawrence River estuary. MFFP estimated the total commercial landings of the 11 fishermen at 14.8 tons or 9,933 silver eels during the fall of Harvest was observed between September 29 and November 18 with the peak numbers occurring during the weeks of October 13th and 20th. The CPUE was 3.0 kg/m of tidal weir, which was one of the lowest ever recorded Mean biomass (kg/ha) Upper St Lawrence River Bay of Quinte Prince Edward Bay FIG Mean biomass (mean kg per hectare ± standard error) of eels captured in the Upper St. Lawrence River and the Bay of Quinte using electrofishing from Sampling took place in the spring and fall from and only in the spring from Section 8. Species Rehabilitation
156 148 for this fishery. Eels originating from stocking are smaller and younger than the natural migrants; however since 2015 stocked fish have increased in size. The largest stocked individual during 2017 was 1,039 mm long. During 2017 the abundance of eels originating from stocking was estimated to be 36,169, which represents 33.5% of the total migration (107,967 fish). These eels originated from elvers stocked in the Richelieu River and LO-SLR between 2005 and MFFP anticipates that the occurrence of stocked eels will increase further over the next few years due to the large number of stocked individuals in the last three years of the experimental program. The exotic swimbladder parasite Anguillicoides crassus was found in six eels for a prevalence rate of 1.6% and an mean intensity of 2.0 (± 0.9) parasites. Three of the six parasitized eels were of natural origin, proving that the parasite now completes its life cycle in this new habitat. Acoustic Telemetry to Track Movement Since the fall of 2015, 191eels collected in the T&T program were implanted with acoustic tags and released into the Bay of Quinte (Table 8.3.1). Data from acoustic telemetry receivers in the Bay of Quinte, Lake Ontario, Iroquois Dam (upper SLR) and at various locations in the lower St. Lawrence River provide information that tracks eels movements downstream on the way to their spawning grounds in the North Atlantic Ocean. To date, all 191 tagged eels have been detected after release, but based on lack of movement of some it is presumed that 5 tags have died. Of the 178 eels tagged since the spring of 2016, 86 (50% after accounting for dead tags) have been detected at the Iroquois Dam array, and 57 (33%) have been detected in Quebec waters of the SLR (Table 8.3.1). In addition, 6 of the released eels have been detected on the Cabot Strait receiver array in the North Atlantic Ocean (between Cape Breton and Newfoundland) which is maintained by the Ocean Tracking Network. The US Fish and Wildlife Service maintained and monitored the Iroquois Dam array and eels were detected between July 23 and December 3, 2017 (Fig ). Fifty-seven eels from four different tagging sessions were detected. The peak abundance of eels moving through the array occur during the second week of November approximately one month after the peak numbers were observed in the silver eel fishery downstream. Additionally, movement seems to take place predominantly at night where 87% of detections were collected in darkness which is defined as the time between1 hour after sunset and 1 hour before sunrise. The eels generally moved quickly through the array with the duration of detections for 41 eels (72%) lasting less than 30 minutes. Future work in this area is focused on VEMCO Positioning Information around the Iroquois Dam in order to determine if there is a particular path through the dam that the eels tend to favor (Fig ). If there is an overall similarity in the path that the eels follow, this information could be used to understand their behaviour during migration and potentially lead to methods of guiding eels safely around dams. 20 Number of Eels Fall LO-SLR Spring LO-SLR Fall LSF Spring LSF FIG Total number of eels collected in the Trap and Transport program from Each total is divided into the locations at which the eels were captured in commercial fishery nets. # Eels per week Jul Spring 2016 Fall 2016 Spring 2017 Fall Jul 6-Aug 13-Aug 20-Aug 27-Aug 3-Sep 10-Sep 17-Sep 24-Sep FIG Number of eels observed per week during 2017 at the Iroquois Water Control Structure on the upper St. Lawrence River. The session where the eels were tagged (Spring 2016, Fall 2016, Spring 2017 and Fall 2017) are identified in the figure legend. Data were provided by Scott Schlueter (USFWS). 1-Oct 8-Oct 15-Oct 22-Oct 29-Oct 5-Nov 12-Nov 19-Nov 26-Nov 3-Dec Section 8. Species Rehabilitation

157 149 TABLE Fate of tags implanted in American Eels during the 5 tagging sessions between the fall of 2015 and the fall of Fate Fall 2015 Spring 2016 Eel Passage Research Center Fall 2016 Spring 2017 Fall 2017 Total # Tags "Dead" tags Iroquois detection Quebec detection Cabot Strait detection Since 2013, the Eel Passage Research Center (EPRC) has conducted research to evaluate potential techniques to concentrate outmigrating eels for downstream transport around turbines at Moses-Saunders and Beauharnois Hydroelectric Dams to mitigate mortality in turbines. EPRC is coordinated by Electric Power Research Institute and primary funders of the research include OPG, Hydro Quebec, and the United States Fish and Wildlife Service (through a funding arrangement from NYPA). EPRC activities during 2017 included: A White Paper investigation of the use of sound to guide out-migrating American Eels, Anguilla rostrata, near Iroquois Dam and the Beauharnois Power Canal was completed during 2017 and will be published in An investigation of the use of electricity to guide out-migrating eels was continued during The North American Eel Science Symposium was held at the OPG Visitor Centre and attracted 85 participants (from North America and Europe) with 32 presentations. Future Work In 2018, many of the projects described above will continue. The OPG and Quebec MFFP will monitor the presence of stocked eels in the silver eel fishery in the estuary of the St. Lawrence River. The OPG and OMNRF Trap and Transport program is scheduled again for spring and fall At the Moses-Saunders Dam, the Tail water surveys and the operation of the Eel Ladder will also occur again in Restoration of American Eel in Lake Ontario and the St. Lawrence River has been identified as a Fish Community Objective for Lake Ontario. The abundance of eels moving into the system via the ladders at the Moses-Saunders Dam and the number of mature eels leaving the system are much lower than the FCO long-term indicators. However, the mortality rate of eels migrating downstream towards the spawning grounds has decreased as a result of the Trap and Transport project. In addition, a collaborative effort to develop methods of reducing mortality of eels during their downstream migration has been initiated. Although the Fish Community Objective related to American Eels has not been achieved, the activities summarized in this report show that some progress has been made. FIG Image of Iroquois Water Control Structure (located just above St01 to St03) in the upper St. Lawrence River. St01 to St19 are the locations of the acoustic receivers. Dots are individual positions determined with VPS analysis of the receiver data ( vps/). Lines represent the tracks of tagged eels during September to December Figure from S. Schuelter and J. Ecret (USFWS). Section 8. Species Rehabilitation
, Kiyi (C.")
158 Deepwater Cisco Restoration J. P. Holden and C. Lake, Lake Ontario Management Unit Prior to the mid-1950s, Lake Ontario was home to a very diverse assemblage of deepwater ciscoes including Bloater (Coregonus hoyi), Kiyi (C. kiyi), and Shortnose Cisco (C. reighardi). Currently, only the Lake Herring (C. artedi) remains in Lake Ontario. Re-establishing selfsustaining populations of Bloater in Lake Ontario is the focus of a cooperative, international effort between the Ontario Ministry of Natural Resources and Forestry (OMNRF), the New York State Department of Environmental Conservation (NYSDEC), the U.S. Fish and Wildlife Service (USFWS), the U.S. Geological Survey (USGS) and the Great Lakes Fishery Commission (GLFC). The Lake Ontario Committee has set a goal to establish a self-sustaining population of Bloater in Lake Ontario within 25 years. The objectives and strategies for the establishment of Bloater are specified in a draft strategic plan, which is currently under review. The plan addresses: sources of gametes, culture facilities, culture capacity, stocking, detection of wild fish, increasing our understanding of ecological consequences, research needs, and public education. Potential long-term benefits of restoring Bloater include restoring historical food web structures and function in Lake Ontario, increasing the diversity of the prey fish community, increasing resistance of the food web to new species invasions, increasing wild production of salmon and trout by reducing thiaminase impacts of a diet based on Alewife and Rainbow Smelt, and supporting a small commercial fishery. Potential risks associated with the reintroduction of Bloater relate to the unpredictability of food web interactions in an evolving Lake Ontario ecosystem. Accepting some risk and uncertainty, doing the necessary science to increase understanding and minimize risk, and adapting management strategies accordingly are prerequisites for successful restoration of Bloater in Lake Ontario. In 2017, there were 169,000 fall yearling (age-1) Bloater were stocked by MNRF at two stocking locations. 12,000 were stocked near Main Duck Island (in the trench ) to support ongoing research activities along with an additional 119 older fish (see Section 9.2). The remaining 157,000 were stocked in deep water south of Cobourg. As production numbers increase the stocking strategy will focus on putting these fish in 80m-100m depths south of Cobourg. This area minimizes the delivery time from the hatcheries and the on vessel delivery time due to the close proximity to suitable depths. Several of the assessment programs have the potential to capture and assess Bloater survival and population levels. Bloater can be easily be misidentified as Cisco so extra care is taken to collect morphometrics and DNA tissue to verify suspected catches of Bloater. On July 5, 2017 a trawl in 90 m south of Rocky Point captured what is believed to be a Bloater. Measurements of fin length ratios are consistent with baseline measurements made on stocked Bloater. Results from the DNA analysis have not yet been conducted. Additionally, the bones analyzed by USGS showed the presence of chemical marks applied while in the hatchery indicating it was a US stocked fish. The fish was 130 mm (TL, 119 mm fork length) long and weighed 14 grams (Fig ). FIG Suspected Bloater caught in a bottom trawl at Rocky Point in 90 m water depth on July 7, The fish is pinned with the fins stretched out so that the measurements from specific reference points can be conducted to aid in species determination. Section 8. Species Rehabilitation


159 Lake Trout Restoration J. P. Holden and M. J. Yuille, Lake Ontario Management Unit Lake Trout were extirpated in Lake Ontario in the 1950s. The loss of this top predator and valued commercial species caused both ecological and economic damage. Rehabilitation of Lake Trout in Lake Ontario began in the 1970s with Sea Lamprey control and stocking of hatchery fish. The first joint Canada/U.S. plan outlining the objectives and strategies for the rehabilitation efforts was formulated in 1983 (referred to henceforth as the strategy ), and revisions in 1990, 1998, and most recently in 2014 were made to evaluate the methodology and the progress of rehabilitation. The two objectives of the strategy are: 1) increase abundance of stocked adult lake trout to a level allowing for significant natural reproduction and 2) improve production of wild offspring and their recruitment to adult stock. Prior to 1996, Lake Trout were monitored with a targeted bi-national Lake Trout netting program. Since 1996, in Canadian waters of Lake Ontario the Lake Trout targets have been evaluated based on catches in a subsample of sites in the Fish Community Index Gill Netting (Section 1.2). Relative abundance is tracked across three areas of the survey: Kingston Basin (Grape Island, Melville Shoal, EB02, EB06, and Flatt Point), Main Lake (Rocky Point, Brighton and Wellington), and Deep Main Lake (Rocky Point deep sites) at sites where the water temperature on lake bottom is below 12 C. Pre-1996 indices back to 1992 from the Fish Community Index Gill Netting program (Section 1.2) have been added to the current status report for context. Lake Trout abundance experienced a significant period of decline that began in the early 1990s and reached a low point in 2005 (Fig ). Since 2005, there has been a gradual increase in the relative abundance of adult Lake Trout although catches are still well below those seen in the 1990s. The strategy specifically identifies the abundance of female Lake Trout greater than 4000 g as an important indicator of the health of the spawning stock. The current catch per unit effort (CUE, number per 24 hr gill net set) is on an increasing trend since 2005; however, it has been relatively stable since 2013 and decreased in Kingston Basin sites (Lake Deep Excluded Index) (Fig ). Survival of juvenile Lake Trout was identified as one factor contributing to the decline in abundance. Catches of age-3 fish per half million fish stocked is used as an index of juvenile survival. Survival to age- 3 of the 2014 cohort (sampled in 2017) is well below the target of 1.5 identified in the strategy (Fig ). This index has become increasingly variable in recent years and evaluation of alternative methods of assessing year-class strength based on catches of adults over multiple years is on-going. As a measure of improved production of wild offspring and recruitment to the adult life stage, the strategy sets a target of wild fish to levels greater than observed between 1994 and 2011 (Ontario target = 13.6 wild fish per 100 standard gill net sets). The occurrence of wild Lake Trout is measured through catches of fish that do not bear hatchery fin clips (i.e., unclipped). Stable isotope analysis suggested that more than 90% of unclipped fish were of wild origin. Catches of wild Lake Trout remain below target (Fig ). Catches of small Lake Trout in the Fish Community Index Trawling (Section 1.3) are generally low but can provide some additional insight on wild recruitment. Small numbers of wild young-of-year (YOY) fish have been occurring more frequently in recent years and 2016 is the highest combined catch of FIG Catch per unit effort of mature Lake Trout by area. Inset shows mean trend of the three areas combined since FIG Relative abundance of mature female Lake Trout greater than 4000 g. Trend is present with and without Lake Deep sites as they were not conducted in all years. Section 8. Species Rehabilitation
.")

160 152 wild age-0 and age-1 fish in the time series (Fig ). The effectiveness of Sea Lamprey control is monitored through the number of A1 wounds (fresh with no healing) observed on Lake Trout. The strategy sets a target of less than two A1 wounds per 100 Lake Trout. The target has been consistently met since 1996 with the exception of 2012 (Fig ). Since 1998, Lake Trout stocked by MNRF have been clipped with multiple fin clips (an adipose clip and one other), and contain no coded wire tags (CWT). US stocked fish have continued to use only adipose clips paired with CWT. This difference in marking allows for an evaluation of fish straying although CWT detection rates and past Ontario stocking of fish with adipose only clips creates a range in expected values. CWT returns alone over the past 3 years suggests 23% (mean, range: 20 to 25%) of the total number of Lake Trout captured in Fish Community Index Gill Netting originated from US stocking while catches of adipose clip only fish suggest a higher immigration rate (mean 32%, range: 30 to 35%). Catch location and stocking sites are mapped in Fig The body condition of Lake Trout is reported as the predicted weight, based on a log-log regression, of a 680 mm (fork length) Lake Trout. While below the peak condition index observed in 2011 and 2013, Lake Trout condition (4.64 kg) in remains above the average (4.46 kg) for the time series (Fig ). Catch and harvest of Lake Trout in the recreational fishery is assessed through the Western Lake Ontario Boat Angling Survey (last conducted in 2016). The estimated recreational catch of Lake Trout in the Ontario waters of Lake Ontario was 6,814 fish in 2016; a significant decline (47%) from the previous 2013 catch estimate (Fig ). Harvest in 2016 (12% of catch) was higher than 2013 (4% of catch), but remains just below the average harvest rate since 2000 (15% of catch; Fig ). Of the salmon and trout species targeted in Lake Ontario, Lake Trout was the third most frequently caught species behind Chinook Salmon and Rainbow Trout, although the majority of the catch in 2016 was isolated in the western end of Lake Ontario (Niagara and Hamilton Areas). Of the Lake Trout sampled by creel technicians, it was determined that the majority of fish were of hatchery origin (89%) and 78% were stocked in U.S. waters (based on clip data). An angler survey was conducted in the Kingston Basin in 1992 and suggested that Lake Trout catches were 3.5 times higher in the Kingston Basin compared to catches FIG Catch per unit effort (CUE) of age-3 Lake Trout standardized to 500,000 stocked. The Lake Trout Management Strategy target has established a target CUE = 1.5. FIG Catches of age-0 and age-1 Lake Trout in the Fish Community Index Trawling (Section 1.3). Catches are standardized to a 32 tow trawl program. FIG Catch of unclipped Lake Trout per 100 standardized nets. Dotted line indicates Lake Trout Management Strategy target of 13.7 fish per 100 standardized nets. FIG Sea Lamprey scarring rate. Dotted line indicates the Lake Trout Management Strategy target of a maximum of two A1 wounds (fresh with no healing) per 100 Lake Trout. Section 8. Species Rehabilitation
 approaching the strategy s maximum recommended harvest of")
 provide an opportunity to contrast new sites with the established index sites Overall, the size distribution of Lake Trout captured at western gill net sites was similar to the traditional index")
 was variable within zones but the general trend is that Conway and Kingston Basin sites had a slightly higher median catch than the main lake")
161 153 observed in the Western Lake Ontario Boat Angling Survey. Scaling the 2016 western basin harvest to account for Kingston Basin harvest results in 3,667 Lake Trout per year being harvested. Commercial fishers report by-catch of fewer than 1000 Lake Trout annual resulting in a total harvest (recreational and commercial combined) approaching the strategy s maximum recommended harvest of 5,000 fish from Ontario waters. The expanded transects and depths in the Fish Community Index Gill Netting (Sections 1.2) provide an opportunity to contrast new sites with the established index sites Overall, the size distribution of Lake Trout captured at western gill net sites was similar to the traditional index sites (Fig ). Gill Net catch per standard set (standardized to 24hrs) was variable within zones but the general trend is that Conway and Kingston Basin sites had a slightly higher median catch than the main lake sites (Fig ). Noteworthy, however, is that comparisons of CUE between Zones is complicated by unbalanced sampling, and how CUE is influenced by depth (Fig ) and bottom temperature (Fig ). FIG Estimated catch and harvest of Lake Trout in the Western Lake Ontario Boat Angling Fishery survey. FIG Percentage of Lake Trout released in the Western Lake Ontario Boat Angling Fishery. FIG Catch and generalized origin location of US stocked Lake Trout captured in Fish Community Index Gill Netting (Section 1.2) gill net sets. Black circles indicate the catch location. Open circles indicate the generalized stocking area. FIG Lake Trout Condition Index is the predicted weight of a 680 mm (fork length) Lake Trout. Error bar indicate the 95% confidence intervals. FIG Comparison of size distribution across Lake Ontario of Lake Trout captured in Fish Community Index Gill Netting (Section 1.2). Median value is indicated by the solid line. Boxes and whiskers capture 50% and 95%, respectively, of the values. Values beyond the 95% quantile are represented individually as solid circles. Specific transects have been assigned to broader groups (LakeWest = Port Credit, Cobourg, Brighton and Wellington; LakeEast = Rocky Point; KBasin= EB sites, Flatt Point, Grape Island and Melville Shoal; Conway = Conway). Section 8. Species Rehabilitation
162 154 FIG Comparison of catches of Lake Trout per standardized 24hr set time Lake Ontario captured in Fish Community Index Gill Netting (Section 1.2). Median value is indicated by the solid line. Boxes and whiskers capture 50% and 95%, respectively, of the values. Values beyond the 95% quantile are represented individually as solid circles. Specific transects have been assigned to broader groups (LakeWest = Port Credit, Cobourg, Brighton and Wellington; LakeEast = Rocky Point; KBasin= EB sites, Flatt Point, Grape Island and Melville Shoal; Conway = Conway). FIG Relationship between net depth of bottom set gill nets and Lake Trout catch per standardized 24hr gill net set combined for all sites in Fish Community Index Gill Netting (Section 1.2). The trend line has been fitted with a non-linear loess fit. FIG Relationship between water temperature at net depth of bottom set gill nets and Lake Trout catch per standardized 24hr gill net set combined for all sites in Fish Community Index Gill Netting (Section 1.2). The trend line has been fitted with a non-linear loess fit. Section 8. Species Rehabilitation
163 Lake Sturgeon C. Lake and M. Hanley, Lake Ontario Management Unit Lake Sturgeon (Acipenser fulvescens) were a key component of the fish community in Lake Ontario and the Upper St. Lawrence river in the past, but are now listed as threatened under the Endangered Species Act (ESA) in this area. The goal of the Lake Sturgeon Recovery Strategy (RS) is to maintain existing Lake Sturgeon populations throughout their current range and where feasible, to restore, rehabilitate or reestablish, self-sustaining Lake Sturgeon populations which are viable in the long term within their current habitat and/or within habitats they have historically occupied, in a manner consistent with maintaining ecosystem integrity and function. In order to achieve the goals set out in the RS for Lake Sturgeon, more information is needed related to their current distribution and abundance. Over two weeks during the spring of 2017, Lake Sturgeon were targeted with various gears in the Lower Trent River. The main goal of the project is to determine presence of Lake Sturgeon in the system, and if possible, implant an acoustic tag into captured Sturgeon to determine range and timing of movement in the Bay of Quinte and Lake Ontario. This information will help to address key knowledge gaps identified in the RS and will contribute to the continued rehabilitation of this species. Acoustic tags deployed in the program take advantage of other large-scale acoustic tracking programs being conducted throughout the Bay of Quinte and Eastern Lake Ontario (see Section 9 of this report for details on these projects). The 2017 Lake Sturgeon survey took place in the Trent River, downstream of Lock 1 to the mouth of the Bay of Quinte from April 25 to May 4. Various gears were used, including baited hook lines, large-mesh multifilament gill net (20 m x 203mm, 254 mm, 279 mm mesh size) and boat electrofishing (Table 8.6.1). The baited hook lines and large-mesh gill nets caught very few fish (8 fish total; hook lines - 1 Common Carp, gill nets - 5 Walleye, 1 Greater Redhorse, 1 Common Carp). The electrofishing boat resulted in the observation of over 5,000 fish, and for the more numerous species, numbers were only estimated. A detailed summary is given in LOA Trent River Lake Sturgeon Survey Walleye were extremely abundant during the survey, accounting for roughly a third of the fish observed. On the last day of the survey (May 4), two Lake Sturgeon were encountered. The first was too large (estimated 1.8 m length) to net into the boat, despite being temporarily immobilized by the electrofishing boat. Shortly after the first Lake Sturgeon was observed, a second was observed and captured. This fish was retained long enough to record length and weight, and a quick surgery was conducted to implant an acoustic tag (Table 8.6.2). Some preliminary acoustic tracking data were obtained in 2017, prior to the receivers being retrieved for the winter (Fig ). The tagged Lake Sturgeon was first detected at the mouth of the Trent River on October 2 (approximately 3 kilometers from the tagging site, 152 days after tagging). It then moved east past other receivers over the next 10 days (approximately 21 kilometers). The long battery life of the tag will hopefully ensure that this fish continues to provide valuable data for some time to come. TABLE Summary effort data (means and SD) for the various gears used from April 25 May 4, Gear Sets Mean effort duration Total effort Depth (m) Temperature Min Max ( C) Hook lines ± 0.58 hr hr 1.9 ± ± ± 0.5 Gillnet ± 0.98 hr hr 2.4 ± ± ± 0.5 Electrofishing ± 10.2 min min ± 0.5 Section 8. Species Rehabilitation
 Girth: Sex: 48 cm unknown FIG. 8.6.1. Detections of tagged Lake Sturgeon at receivers in the Upper Bay of Quinte during the fall of 2017.")
164 156 TABLE Summary biological and tagging data for Lake Sturgeon captured May 4, 2017 in the Trent River. Weight: 12.6 kg External Tag: Fluorescent green Floy tags (x2) Total Length: 1.29 m Internal Tag: Vemco V16 (10 yr. battery life) Girth: Sex: 48 cm unknown FIG Detections of tagged Lake Sturgeon at receivers in the Upper Bay of Quinte during the fall of Juvenile Lake Sturgeon Survival Study The Lake Ontario Management Unit (LOMU), in partnership with the Springside Community Hatchery (operated by the Napanee and District Rod & Gun Club), released 20 juvenile Lake Sturgeon into the Napanee River on August 15, The fish were 3 years old and approximately 30 cm long. All fish were PITtagged; five also had acoustic tags implanted internally. Students from the Mohawks of the Bay of Quinte Community Well Being Day Camp participated, releasing individual fish from small buckets into the Napanee River. Approximately three weeks after the initial release event, three more juvenile Lake Sturgeon were released. These fish had received internal acoustic tags later than the ones released initially, and required the extra time to recover prior to release. This brought the total number of Lake Sturgeon released to twenty-three (15 PIT-tagged only; 8 PIT-tagged and tagged with an internal acoustic transmitter tag). The Lake Sturgeon were hatched from eggs collected in the upper St. Lawrence River in 2014 by US Fish and Wildlife Services and raised by the New York State Department of Environmental Conservation Oneida Lake fish culture station. Since that time, approximately 40 sturgeon have been held on the Canadian side at the Glenora Fisheries Station and White Lake Fish Culture Station. One week prior to release, sturgeon were moved to the Springside Community Hatchery to acclimatize to the temperature of the Napanee River. Data from the acoustically tagged sturgeon have been uploaded to the Great Lakes Acoustic Telemetry Observation System (GLATOS) so that we may track the overwinter movement of these fish in the river, or if they move into the lake. We have confirmed some limited movement of several fish within the Napanee River with the use of a mobile hydrophone. The data collected will inform future management strategies for Lake Sturgeon recovery. Section 8. Species Rehabilitation
165 Research Activities 9.1 Station 81: long-term monitoring at the base of Lake Ontario s food web Project Leads: Mary Hanley, Carolina Taraborelli, Brent Metcalfe, Tim Johnson (OMNRF-ARMS) Collaborators: Lake Ontario Management Unit, Fisheries and Oceans Canada Funding: OMNRF Special Purposes Account, Great Lakes Protection Act / Canada-Ontario Agreement Long-term sampling of lower trophic levels allows for the monitoring of changes in the physical, chemical, and biological aspects of a lake ecosystem. From , Fisheries and Oceans Canada (DFO) collected this information from Station 81 (Fig ) in eastern Lake Ontario. In 2007, the OMNRF Aquatic Research and Monitoring Section (ARMS) resumed sampling at Station 81, and in 2017 added two more sampling sites to the program: T4L and NYSDEC (Fig ). The NYSDEC site is part of a long-term, U.S.-lakewide biomonitoring program conducted by several U.S. agencies & Cornell University; our observations will supplement their efforts. The collection of information on physical, chemical and lower trophic levels was completed at all three sites between May and October, 2017 in collaboration with the Lake Ontario Management Unit (LOMU) and Fisheries and Oceans Canada. Station 81 is located in the centre of the eastern basin ( N, W; 34 m water depth; Fig ), while the other two sites are located farther offshore. These additional sites were chosen to provide more information about the variation in lake conditions to support the Bloater restoration project (Section 9.2). T4L represents a site with greater depth than Station 81 lying just outside of the eastern basin proper ( N, W; 57 m water depth; Fig ). NYSDEC is also a deeper site but is situated within the acoustic array used to inform Bloater restoration efforts ( N, W; 53 m water depth; Fig ). In 2017, stratification of the water column was first observed on June 19th at all three of the sites and was still observed during the last visit on October 2nd. Average depth of the thermocline was similar for both Station 81 and T4L, but was FIG Map of Lake Ontario showing the locations of all three sampling sites. Section 9. Research Activities
166 158 much deeper in the water column at NYSDEC (Table 9.1.1). At Station 81, Secchi depth varied between 3 m and 15 m. The mean daily water temperature ranged from 5.2 C to 16.3 C with the highest average temperature observed on August 21. At T4L, Secchi depth varied between 4.5 m and 17 m. The mean daily water temperature ranged from 4.1 C to 13.4 C with the highest average temperature observed on September 12. At NYSDEC, the mean daily water temperature ranged from 6.3 C to 16.3 C with the highest average temperature observed on August 10. Nutrient, phytoplankton, and zooplankton samples are currently being analyzed. TABLE Average, maximum, and minimum depths of the thermocline at all three sampling sites in Lake Ontario. All data was collected from May 4 October 2, STN 81 T4L NYSDEC Mean Max Min Long-term monitoring of lower trophic levels at sites like Station 81 provides information to scientists on the effects of various ecological, physical, and chemical stressors on ecosystem health. In addition, continual monitoring allows for the identification of natural variation and the development of normal ranges of values for measured parameters. Adding more sampling locations to this long term monitoring allows scientists to compare new sites to others that have been observed for several years to look for variation among sites and obtain a more complete picture of the lake. Section 9. Research Activities
 in Lake Ontario Project Leads: Natalie Klinard, Scott Colborne, Aaron Fisk (Great Lakes Institute for Environmental")

 were once present in the Great Lakes basin, four of which occurred in Lake Ontario.")
167 Movement and habitat use of a reintroduced fish species: Bloater (Coregonus hoyi) in Lake Ontario Project Leads: Natalie Klinard, Scott Colborne, Aaron Fisk (Great Lakes Institute for Environmental Research, University of Windsor); Tim Johnson, Brent Metcalfe (OMNRF-ARMS) Collaborators: Lake Ontario Management Unit, Fisheries and Oceans Canada, New York State Department of Environmental Conservation Funding: Great Lakes Fishery Commission, Great Lakes Protection Act / Canada-Ontario Agreement Deepwater ciscoes (Coregonus spp.) are a diverse group of fish that were an integral part of the native fish community of the Great Lakes. A total of seven deepwater cisco species (C. hoyi, C. reighardi, C. alpenae, C. zenithicus, C. johannae, C. kiyi, C. nigrippinis) were once present in the Great Lakes basin, four of which occurred in Lake Ontario. Currently, most deepwater ciscoes are extinct or have suffered local extirpations that restrict them to Lake Superior, while the shallowwater form of cisco (C. artedi) persists throughout the Great Lakes. An exception to this is Bloater (C. hoyi), a deepwater cisco that remains in Lakes Huron, Michigan, and Superior. Until the mid- 1950s, Bloater were an abundant forage fish in Lake Ontario but became scarce in the 1960s as a result of a dramatic population decline associated with competition with invasive Rainbow Smelt (Osmerus mordax) and Alewife (Alosa pseudoharengus), overharvesting, and Sea Lamprey (Petromyzon marinus) induced mortality. Although Bloater persisted in Lake a) Ontario longer than the other three deepwater ciscoes (C. reighardi, C. kiyi, C. nigripinnis), the last documented catch was in OMNRF and New York State Department of Environmental Conservation have developed an initiative to re-establish a self-sustaining population of deepwater ciscoes in Lake Ontario by stocking juvenile hatchery-reared Bloater (see Section 8.4). However, as with most stocked fishes, we have little knowledge of their behaviour and survival following stocking. Questions include: Where do fish go after they re stocked? What habitats do they use and how does this change over time? How many of them survive after stocking? Do they school together and move in groups? All of these questions can be answered through the use of acoustic telemetry, which involves surgically implanting Bloater with acoustic transmitters and releasing them as part of a normal stocking event. This update provides further analyses of data obtained between November 2015 and May 2017; the next scheduled download of the receivers is in May In November of 2015, we tagged 70 yearling Bloater (mean length 174 mm) with either Vemco V7- or V9-69kHz tags, and released those fish with ~40,000 fingerlings and yearlings into the centre of an acoustic array in eastern Lake Ontario (Fig a). The receiver array (n = 80 Vemco 69 khz receivers) detected 68 of the 70 tagged Bloater, amounting to 577,361 detections over 6.5 months. The Bloater were released in November and showed variation in residence patterns during the first week after release (Fig. b) FIG Bathymetric maps of eastern Lake Ontario featuring the acoustic receiver array for (a) and (b) where white dots represent individual receivers, white triangles indicate range test receivers, white diamonds represent thermistor strings, and red stars show the release site. Section 9. Research Activities
 and another at the mouth of the Niagara")
168 ). Residence time of Bloater in the array ranged from less than a day to 57 days with an average of 8.8 days, indicating relatively quick dispersal. However, individuals were detected beyond the main receiver array with one tagged Bloater being detected in the Bay of Quinte (~74 km from release location) and another at the mouth of the Niagara River (~220 km from release location). Preliminary analyses of fate indicated the majority (51%) of Bloater emigrated from the array shortly after release, moving either towards the main basin or further into the St. Lawrence Channel. The 200-day survival of Bloater was estimated to be about 5%. Predation by salmon and trout is likely the primary source of mortality, and this is being investigated using specialised predation tags and by tracking the behaviour and movements of the dominant predators (see Section 9.4). Receivers downloaded in May 2016 were redeployed, along with 23 additional receivers to continue to track the behaviour and survival of tagged Bloater (Fig b). In November 2016, 161,680 Bloater were stocked by MNRF including 24 tagged fish. Half of these tagged Bloater contained V9 detection tags, while the other half contained V9-pt tags that record the depth and temperature of the fish when it is detected. An additional 27 Bloater were tagged with V9 and V9-pt tags in March 2017 and released in April 2017 as part of a smaller stocking event. The array was downloaded in May 2017 and expanded to include a total of 105 receivers (Fig ). However, the November 2016 and April 2017 stocking events were each associated with technical issues which generated concerns about the reliability of these data to represent true Bloater behaviours. In November 2017, 109 Bloater were tagged with V9 and V9-pt tags and released with 12,560 untagged Bloater in the array (an additional 156,930 Bloater were stocked near Cobourg, see Section 8.4). The receiver array will next be downloaded in May 2018, and those detections, in combination with in situ environmental and biological data being collected throughout eastern Lake Ontario will help to inform our knowledge of Bloater ecology and their potential to re-establish in Lake Ontario. FIG Residence Index (RI) by acoustic receiver station across the first receiver deployment of the study period (9 November June 2016). Orange circles represent the mean RI for all tagged Bloater (n = 70). Section 9. Research Activities
 consists of 105 69-kHz receivers used to assess the post-stocking behaviour and survival of Bloater, Coregonus hoyi.")
169 161 FIG Acoustic receiver arrays in the St. Lawrence Channel of eastern Lake Ontario in May The deepwater cisco array (shown in red) consists of kHz receivers used to assess the post-stocking behaviour and survival of Bloater, Coregonus hoyi. Other receiver arrays shown in green, blue and purple assist in gathering detection data for tagged Bloater. Section 9. Research Activities
170 Using acoustic telemetry to investigate smolt survival and adult salmonid spatial habitat use with a focus on Atlantic Salmon Project leads: Sarah Larocque, Aaron Fisk (Great Lakes Institute for Environmental Research, University of Windsor), Tim Johnson (OMNRF-ARMS) Collaborators: Fisheries and Oceans Canada, OMNRF- Fish Culture Section, U.S. Fish and Wildlife Service, Great Lakes Acoustic Telemetry Observation System (GLATOS) Funding: NSERC Strategic Partnership Grant, Great Lakes Protection Act / Canada-Ontario Agreement Atlantic Salmon (Salmo salar) once abundant in Lake Ontario were extirpated in the 1890s. The Lake Ontario Atlantic Salmon Restoration Program was developed in 2006 and significant efforts have been made to reintroduce Atlantic Salmon into Lake Ontario. However, there have been limited adult returns to date which is presenting challenges to the restoration effort. For instance, it is uncertain if the smolts are successfully reaching Lake Ontario, and once in the lake, as adults, whether there is interspecies competition for space and food resources with the five other salmonids present. It is particularly important to know whether the life stage at which Atlantic Salmon are stocked (e.g. as yearlings ready to smolt or as fingerlings that remain in the river prior to smolting) affects their ability to successfully migrate from the lake tributaries. An improved understanding of the movements and habitat preferences of adult salmonids in the lake would help discern whether competition in the lake environment is limiting Atlantic Salmon performance and ultimately the number of adults returning to the rivers to spawn. Smolts Atlantic Salmon smolt migration success was assessed in the Credit River (a river that is stocked with both Atlantic Salmon fingerlings and yearlings) using acoustic telemetry. Using small acoustic transmitters (hereafter called tags; Vemco V5-180 khz), both wild (stocked as fingerlings the year prior in the river; n = 8) and hatchery yearlings (n = 32) were tagged on the West Credit River (a tributary of the Credit River near the headwaters) in April The migration to Lake Ontario is approximately 75 river km and involves passing two dams. Acoustic receivers (n = 27) were deployed throughout the river from the tagging location to Lake Ontario, and into Lake Ontario around the river mouth. Overall, 50% of the fish reached Lake Ontario. Of those fish, the migration started at the beginning of May and reached the lake by mid-late May. However, some differences were seen between the wild and hatchery yearlings. The wild yearlings were 100% (n = 8) successful in reaching the lake, compared to 37.5% (n = 12) of hatchery yearlings. Also, of those that were successful, wild yearlings began migrating sooner and faster than the hatchery yearlings (Table 9.3.1). Although this is a preliminary analysis of the Atlantic Salmon smolt migration, it appears that hatchery yearlings are not as successful as those that were initially stocked as fingerlings and spent a year in the river before migrating. We will continue to assess migration success with increased sample sizes and continued monitoring of environmental variables in 2018 as the high flows in the spring of 2017 may have influenced the success rates. Adults Understanding fish migrations and movements in a lake as large as Lake Ontario can be challenging. However, with acoustic telemetry becoming more prevalent amongst researchers, the receiver coverage in the eastern and western basins increased in 2017 making it possible to begin to understand large-scale movements and habitat use of fish. By the end of 2017, there were approximately 120 and 50 acoustic receivers in the eastern and western basins, respectively, with none in the central basin. With such coverage in the lake, efforts have begun to tag all six salmonid species in Lake Ontario and look at large-scale movements and habitat use. Four salmonid species were captured, tagged (Vemco V13 69 khz), and released in the western basin near Port Credit in June 2017 (Lake Trout: n = 5; Rainbow TABLE Atlantic Salmon smolt migratory details based on acoustic telemetry movements of wild (stocked as fingerlings in the river) and hatchery yearlings from the Credit River to Lake Ontario in Wild Hatchery Mean Min Max Mean Min Max Start Date 02-May 28-Apr 14-May 07-May 23-Apr 23-May End Date 09-May 05-May 22-May 18-May 01-May 28-May Duration Section 9. Research Activities
 and subsequently released near Port Dalhousie in late December, 2017.")
171 163 Trout: n = 5; Coho Salmon: n = 5; Chinook Salmon: n = 7; Fig ). Atlantic Salmon are difficult to catch in the lake, so 2-year-old brood stock hatchery Atlantic Salmon were tagged (n = 19) and subsequently released near Port Dalhousie in late December, Currently, no Brown Trout have been tagged. Also of note, from a previous study with pdst tags in 2016 (see section 9.2 in the 2016 Annual Report), hatchery Atlantic Salmon (N = 20) were simultaneously tagged and released near Glenora (Bay of Quinte area) in April 2016 (Fig ). Although relatively few fish have been tagged, and the number of acoustic receivers remains limited to the eastern and western basins, some interesting movements have been seen. Three of the seven Chinook Salmon captured and tagged in the western basin were detected in the eastern basin with one being captured by an angler (Fig ). Lake Trout (3 of 5) tagged in the western basin appear to be moving towards the Niagara River in the fall of 2017 (Fig ). And three of the Atlantic Salmon released from Glenora, moved out of the Bay of Quinte, into the eastern basin and were then detected in the western basin (Fig ). Although these are preliminary results based on a partial download of receivers in the lake, we are beginning to see evidence of large forays made by some of the salmonids including potential seasonal spawning movements of Lake Trout. Next year, we anticipate increasing the number of tagged fish (including Brown Trout), using tags with sensors to discern depth and temperature use, and downloading all the receivers (many fish were tagged after receivers were downloaded in 2017) with the potential to further expand the acoustic receiver array. Over the next few years, we will obtain important new information on lakewide and seasonal movements and behaviours of coexisting salmonids, including an improved understanding of potential overlap in distribution and of their over-wintering habitat. FIG Overview of acoustic receiver locations and detections in Lake Ontario, Panels A. and B. show the western and eastern basin detections of individual salmonids, respectively. Section 9. Research Activities
172 Combining traditional ecological knowledge with cutting edge technology to inform Lake Trout restoration in Lake Ontario Project Leads: Silviya Ivanova, Aaron Fisk (Great Lakes Institute for Environmental Research, University of Windsor); Tim Johnson, Brent Metcalfe (OMNRF-ARMS) Collaborators: New York State Department of Environmental Conservation Funding: Great Lakes Protection Act / Canada- Ontario Agreement Evidence from diets suggests trout and salmon show considerable overlap with respect to food preference. However, we do not know the degree to which spatial and temporal interactions are driving this dietary overlap. Knowing how much species interact, and potentially compete for shared resources, would better inform management planning with respect to restoration plans and stocking strategies. Lake Ontario is home to six salmonid species attracting recreational anglers from across North America. Currently, a number of different fish species, including Lake Trout (Salvelinus namaycush) and Chinook Salmon (Oncorhynchus tshawytscha) are being stocked in Lake Ontario in an effort to support economically important recreational fisheries, provide predatory control for largely non-native prey fishes, and promote restoration of historically important species such as Lake Trout. The Lake Ontario Lake Trout population was decimated in the 1900s due to Sea Lamprey, habitat loss and overfishing. Efforts to rehabilitate the population have been on-going for over 40 years. Chinook Salmon are the most sought after species by anglers largely driving the open lake recreational and charter boat fishery. Understanding the spatial and temporal interactions of Lake Trout with other top predators such as Chinook Salmon is critical to understanding the potential for restoration of Lake Trout in Lake Ontario and elsewhere. Little is known of Lake Trout and Chinook Salmon seasonal movements and preferred depth and temperature in Lake Ontario. However, acoustic telemetry provides a means to begin to understand these behaviours. We are using both a fixed-station receiver array in the east and west ends of Lake Ontario, and an autonomous underwater vehicle (self-propelled mini-sub) to track the movements and behaviour of Lake Trout and Chinook Salmon that have been surgically implanted with acoustic tags. Both Lake Trout and Chinook Salmon will be tagged each year starting in 2016 and ending in The first set of data will become available for analysis in May This work contributes directly to Lake Trout, Atlantic Salmon and Bloater restoration, and thus, to maintaining biodiversity in Lake Ontario. The results may aid management in optimising the numbers and mix of species stocked into the Great Lakes. Furthermore, the proposed research will contribute new insights on the spatial interactions of top predator fish in large lake ecosystems helping us develop more adaptive stocking strategies and management plans. Section 9. Research Activities
; Tim Johnson (OMNRF-")
173 Post-surgical performance of acoustically tagged salmonids Project Leads: Andrew Darcy, Aaron Fisk (Great Lakes Institute for Environmental Research, University of Windsor); Tim Johnson (OMNRF- ARMS) Collaborators: OMNRF Fish Culture Section; Graham Raby, Trevor Pitcher (Great Lakes Institute for Environmental Research, University of Windsor), Funding: Canada Research Chairs Program, Great Lakes Protection Act / Canada-Ontario Agreement, Alex S. Davidson Great Lakes Stewardship Award Acoustic telemetry is changing our understanding of fish ecology in the Great Lakes, but there are a lack of tagging studies on smaller fish and younger life stages such as juvenile salmonids commonly stocked by resource management agencies. It is assumed that tagged fish will provide accurate estimates of movement, growth, and survival. However, the act of tagging may impair functions (e.g. survival, growth, swimming performance) depending on the size of tags relative to the fish. Larger tags increase the detection range and have a longer battery life, thus allowing for greater scope to studies. A tag burden of less than 2% body mass is the generally accepted standard which, given available tag sizes, limits the application for smaller fish. Additionally, there may be species-specific variation in burden limits. Technological advances continue to see further miniaturization of tags and users continue to push the limits of tag burden with smaller fish. It is therefore important to identify whether this 2% rule is still applicable, and to identify ideal tag burden ratios for juvenile fishes that are staples of the provincial fish culture program. To this end, we have initiated laboratory experiments using a variety of salmonid species (e.g. Rainbow Trout, Lake Trout, Chinook Salmon, and Atlantic Salmon) to measure tag burden effects in sizes typically stocked by OMNRF. Preliminary results with juvenile Rainbow Trout (13-36 g) revealed subtle, but not statistically different, reductions in growth rate (Fig ) and statistically lower critical swimming speed (Fig ) in tagged vs untagged fish. Additional results on metabolic performance have yet to be analysed. The other fish species will be similarly evaluated over the next several months allowing comparison in performance among species. FIG Average % increase in weight (grams) per day for juvenile Rainbow Trout over the eight-week study period, based on treatment group (i.e. CONTROL (n=3), SHAM (n=26), PIT (n=24), and DAT (dead acoustic tag) [VEMCO V5 (n=5) and V6 (n=16)]). Rainbow Trout were grams and millimetres in fork length at the initial weigh-in, and grams and millimetres at the final weigh-in. CONTROL = untagged fish, SHAM = surgery but no tag, PIT = g [pit tag only], DAT-V5 = 0.67 gram tag ( % tag burden at final weigh-in), DAT-V6 = 0.97 gram tag ( % tag burden at final weigh-in). FIG Critical swimming speed (Ucrit) in fork lengths per second (FL/s) of juvenile Rainbow Trout (~ millimetres) from UNTAGGED (n=9) and TAGGED (n=10) (DAT) (V5 and V6 tags pooled together) treatment groups 4 to 8 weeks after surgery. The untagged group experienced no tag burden, and the tagged treatment group represented a range of tag burden (DAT-V5 = 0.67 gram tag ( % tag burden), DAT-V6 = 0.97 gram tag ( % tag burden)). The results will provide novel insights into the interplay between surgically implanted acoustic tag burden with fish performance and physiology (i.e. metabolism and behaviour). These insights have important implications for future tagging studies and our understanding of how tag burden affects different sizes and species of fish. Acoustic telemetry is increasingly being used to understand post-stocking behaviour and survival of economically important fishes (e.g. walleye, salmon, trout) and restoration initiatives (e.g. Atlantic Salmon, American Eel, and Bloater) described in sections 8.2, 8.3, 8.4, and 9.3 of this report. Section 9. Research Activities
 Collaborators: Len Hunt (OMNRF-CNFER); Andrew Drake (Fisheries and Oceans Canada) Funding:")
174 Vulnerability assessment of aquatic invasive species Project Leads: Jeff Buckley, Tim Johnson (OMNRF-ARMS) Collaborators: Len Hunt (OMNRF-CNFER); Andrew Drake (Fisheries and Oceans Canada) Funding: Great Lakes Protection Act / Canada- Ontario Agreement, OMNRF Natural Heritage Policy Section Invasive species pose a threat to the function and diversity of native aquatic communities. Over 200 species of fish, plants, and invertebrates are currently listed as potential aquatic invaders to Ontario and neighbouring jurisdictions in Canada and the U.S. In collaboration with researchers at the Centre for Northern Forest Ecosystem Research and the Department of Fisheries and Oceans Canada, we are developing a vulnerability assessment of Ontario and the Great Lakes to the spread and establishment of aquatic invasive species. Recent work in this project has focused on developing measures of habitat suitability for invasive fish. Suitable habitat was defined by relating species-specific measures of thermal tolerance to important stages of invasion: survival and establishment. Metrics were chosen to represent the ability of an invader to survive, grow, and reproduce in a particular thermal environment. These metrics included upper incipient lethal temperature, optimal growth temperature, and optimal spawning temperature. Both volume of thermal habitat and its duration through the year were considered when calculating suitability. Using detailed water temperature data, the suitability of lakes in the Broad-scale Monitoring database (n = 782) were calculated for a number fish species. Known distributions of native species based on Broad-scale Monitoring data were used as an initial evaluation of the suitability model. For example, Brown Bullhead, a native warm water species, was found to have more suitable habitat concentrated in the southern end of the province (Fig ). Following this preliminary validation of the habitat suitability models with the Broad-scale Monitoring data, we estimated suitability for invasive species. Suitability values were FIG Suitability of habitat for brown bullhead (Ameiurus nebulosus) in Ontario. Darker colours indicate greater suitability. Points show lakes sampled through the Broad-Scale Monitoring program in which brown bullhead were present. calculated with water temperature data based on current climate conditions (Fig a, Fig e). To assess potential changes in suitability given the warming effects of climate change, suitability was also calculated from temperatures derived from climate projections over three future time periods ( , , ) and three potential climate change scenarios (Fig b-d, Fig f-h). Changes in suitable habitat differ among species; however, the effects of climate change generally will lead to a decrease in suitable habitat for cool water invaders in the northern regions of the province, while suitable habitat for warm water invaders is likely to increase throughout the province. These changes are particularly noticeable in scenarios in which little is done to mitigate climate change. In the coming year we expect to complete the habitat suitability modelling for the Great Lakes and to begin to explore habitat suitability for invasive plants and invertebrates. We will also begin to incorporate the human dimensions pathway analyses with the habitat suitability work to provide a more complete perspective on the risk of establishment and spread of aquatic invasive species in Ontario. Section 9. Research Activities
. Figures b-d and f-h are based on future protections of climate conditions (1971 2100).")
175 167 a b c d e f g h FIG Suitability of habitat for a warm water (Red Shiner (Cyprinella lutrensis)) and a cool water (Ruffe (Gymnocephalus cernua)) invasive species. Darker colours indicate greater suitability. Figures a & e are based on current climate conditions ( ). Figures b-d and f-h are based on future protections of climate conditions ( ). Mitigation level indicates the amount of worldwide action taken to lessen the effects of climate change (e.g. reduction of carbon emissions). Section 9. Research Activities
176 Selecting optimal models for predicting habitat suitability of invasive freshwater fishes Project Leads: Caleb Yee, Shelley Arnott (Queen s University); Tim Johnson (OMNRF- ARMS) Funding: Great Lakes Protection Act / Canada- Ontario Agreement; Queen s University Invasive species are a significant threat to ecosystem function and health. Understanding where invaders are likely to occur can help direct proactive measures for invasive species control. Areas with suitable habitat for an invader are more vulnerable to invasion. Habitat suitability is often determined using species distribution models (SDM). SDMs are a group of analytical procedures that describe habitat suitability by comparing habitat characteristics (e.g. water temperature, rainfall, etc.) where the species is known to occur, to the available habitat conditions in the target area. The more similar the habitat conditions between regions of known occurrences and the target region the more suitable the habitat. Habitat suitability predictions are most useful prior to species invasion. This requires a spatial transfer of model predictions to areas where they were not trained. How well an SDM performs is assessed by its ability to assign species occurrences to areas of high habitat suitability and non-occurrences to areas of low habitat suitability. Since predictions of habitat suitability are most desirable prior to a species invasion, when there are no occurrences to evaluate the model in the target range, models are often assessed using cross-validation. In crossvalidation, occurrence points from the native range are divided into groups and all but one group are used to train the model with the remaining group being used to test the model performance. Confidence in a models performance is based on these cross-validated results, however, little work has been done comparing cross-validated model performance to target area performance. This project assesses 1) how well three different SDM techniques (MaxEnt, Domain, and Bioclim) predict habitat suitability in North America for freshwater fishes, when fish occurrences from North America are not used to train the models and, 2) evaluates the relationship between cross-validated and North American performance assessments. Five species of fish (Brown Trout Salmo trutta, Lake Trout Salvelinus namaycush, Burbot Lota lota, Common Carp Cyprinus carpio, and Northern Pike Esox lucius) were selected because they have a trans-atlantic distribution and a long introduction history in both the eastern and western hemispheres. Potential invasive fish were not used for this project because many lack species occurrences in North America to assess model predictions and most invaders are currently undergoing range expansion which makes model assessment difficult. The predictions for the trained models were assessed by comparing how well they predicted North American occurrences. True Skill Statistic (TSS), a measure of how well a model can discriminate between suitable (occurrence) and unsuitable habitat (non-occurrence), was the metric used to evaluate model performance. SDMs create continuous predictions of habitat suitability ranging from 0 (low suitability) to 1 (high suitability) but TSS requires a binary prediction of either suitable or unsuitable habitat. To transform model predictions to suitable or unsuitable, the lowest suitability score in training that had a species occurrence was used as the boundary between suitable (the lowest suitability score and higher) and unsuitable (less than the lowest suitability score). The performance of modelling techniques varied by species with no single technique consistently outperforming the others (Fig ). Burbot was best modeled by Bioclim, Brown Trout by Domain, and Lake Trout by MaxEnt. All SDM techniques used showed a poor ability to discriminate between suitable and unsuitable habitat for Common Carp and Northern Pike. When TSS in North America is compared to cross -validated TSS (Fig ) a positive relationship is seen, and cross-validation tends to under estimate model performance in North America. However, many models that show some ability to discriminate between suitable and unsuitable habitat (cross-validated TSS 0) in cross-validated assessments show no ability to discriminate in North America (North American TSS 0). Preliminary results for this project indicate the best performing models may be species specific. Cross-validated TSS can provide some Section 9. Research Activities
177 169 indication of model performance in North America but there is substantial variation. These results suggest that no single model should be applied to all species for habitat suitability assessments; instead models should be selected based on their performance in training. TSS in training shows some ability to select the best performing models but is not always accurate. Using multiple assessment metrics together may increase our ability to differentiate between well and poorly performing models in training. Further work selecting the best performing models using multiple assessment metrics is currently being undertaken. FIG Comparison of True Skill Statistic Scores (TSS) by modelling techniques and species identity calculated at the lowest suitability score in training. Species bar plots show the highest TSS for a modelling technique. The all species plot shows the median (black line), 25th and 75th percentiles (bottom and top of the box) TSS of all models. 16 models using the three modelling techniques were created for each species. Models using the same techniques differed in how sampling bias was corrected and how model coefficients were selected. FIG Mean TSS in North America compared to cross-validated TSS for all models (n=80). As mean cross-validated TSS increases TSS in North America generally increases. Many models (n=42) show a TSS<0 in North America. The outlier model in the bottom right of the plot is a Domain model for Lake Trout. The red line equates to perfect agreement between cross-validated and North American assessment. Points below the line are over estimating model performance, points above the line are under estimating model performance. Section 9. Research Activities
178 Community level response to Zequanox molluscicide - a biocontrol for invasive mussels Project Leads: Michele Nicholson, Shelley Arnott (Queen s University), Tim Johnson (OMNRF- ARMS) Partners: Marrone Bio Innovations Funding: Invasive Species Centre, Great Lakes Protection Act / Canada-Ontario Agreement, Queen s University, NSERC Zebra and quagga mussels (Dreissena spp.) are European freshwater clams that have invaded most major inland water systems across North America. Their invasion has resulted in billions of dollars in damages and losses to fisheries, recreational water use, infrastructure, and industry each year. Zequanox molluscicide, a biopesticide made from soil bacteria, has been advertised as dreissenid-selective and environmentally safe. Health Canada has approved the use of Zequanox in hydroelectric facilities, which may lead to open-water use in Canada, as has occurred in the United States and Ireland. Data from single-species assays indicate that exposure to Zequanox concentrations near those recommended for open-water applications may cause mortality in fish and invertebrates. In some cases, these assays were conducted with exposure times exceeding those in the field. Further, little is known about the non-target impacts of applying Zequanox in an open-water setting, given that toxicants can behave differently in natural versus laboratory environments and because single-species tests are unable to characterize indirect effects such as pesticidemediated changes to inter-species interactions like competition and predation. Using a six-week-long replicated aquatic mesocosm experiment, we simulated open-water applications of Zequanox (100 mg/l of the active ingredient) to determine the responses of primary producers, zooplankton, and macroinvertebrates to Zequanox exposure in a complex aquatic environment. Short-term increases occurred in algal (phytoplankton and periphyton) biomass ( % of controls), abundance of large zooplankton (cladoceran grazers) (700% of controls), and insect emergence (490% of controls). Large declines initially occurred among small cladoceran zooplankton (88 94% reductions in Chydorus sphaericus, Ceriodaphnia lacustris, and Scapheloberis mucronata), but abundances recovered within three weeks. Declines also occurred in scuds Hyalella azteca (mean abundance 77% less than controls) and snails Viviparus georgianus (survival 73 ±16%), which did not recover during the experiment. Short-term impacts to water quality included a decrease in dissolved oxygen (minimum 1.2 mg/l), despite aeration of the mesocosms. This research may assist regulators and managers in assessing the ecological risks of using Zequanox in open-water systems and support informed decision-making about dreissenid control, including for established infestations, rapid response to new invasions, and efforts under the Species at Risk Act to protect and restore native mussel habitats that have been threatened and damaged by dreissenid invasion. Section 9. Research Activities
179 171 FIG Comparison of mean responses of the biological community and zebra mussels (Dreissena polymorpha) in 587 L mesocosms, over the course of 43 days after Zequanox treatment (100 mg a.i./l at time=0) versus no-zequanox controls. Top row: algal community, total and edible chlorophyll a (µg/l) and periphyton total chlorophyll a (mg/m 2 ). Concentrations of total and edible chl a have been multiplied by 5 to improve visibility of the data. Second row: crustacean zooplankton community, cladoceran and copepod abundances. Third row: abundance of Hyalella azteca amphipods, survival (%) of Viviparus georgianus snails, and emergence rates of midges. Bottom row: percent mortality of zebra mussels. All bars represent the geometric mean (as response data were log transformed to increase normality of residuals and reduce unequal variances among treatment groups), except for large cladoceran abundance and zebra mussel mortality, which represent the arithmetic mean. n=24 for each bar except in the bottom row where n=12 for each bar. Section 9. Research Activities
 are the dominant piscivorous fish in the Bay of Quinte-eastern Lake Ontario nearshore waters and are known to be")
180 Migration and Spatial Ecology of Bay of Quinte-Eastern Lake Ontario Walleye E.N. Brown 1, B. Tufts 2 and J.A. Hoyle 1 Lake Ontario Management Unit 1 ; Queens University 2 Walleye (Sander vitreum) are the dominant piscivorous fish in the Bay of Quinte-eastern Lake Ontario nearshore waters and are known to be highly migratory. Historical mark-recapture studies and age-specific geographical and seasonal distributions suggest that movements are related to spawning habitat, temperature regimes, and foraging opportunities. This population supports important recreational, commercial, and First Nations fisheries. In 2017, 79% of Bay of Quinte anglers were targeting Walleye during the recreational open-water season, with effort varying over season and space. In recent years, an increase in anglers targeting trophy Walleye during August and September has been observed in eastern Lake Ontario (Section 2.2 and Section 2.3). The goal of this multi-year acoustic telemetry project is to describe Bay of Quinteeastern Lake Ontario Walleye movement at a finer scale than currently exists, and subsequently, to better understand the mechanisms which influence aspects of Walleye life history. We hypothesise that after spawning, mature Bay of Quinte Walleye migrate to the Lake to improve fitness associated with foraging opportunities, and that once individuals leave the Bay, variation in distribution over time will be observed to reflect this. Within the first year of this project, we present early insight into seasonal distribution and movement patterns of mature Walleye in Bay of Quinte-eastern Lake Ontario, highlight areas of Walleye seasonal aggregation, and discuss areas of future work. Twenty six mature Walleye (>2½ lbs) were captured in the spring of 2017 at the time of spawning. Fish were captured from three locations within the Bay of Quinte (Trent River, Big Bay, and Glenora) using trap netting or boat electrofishing. External identification tags were applied and surgical techniques were used to equip fish with Vemco V16 69 khz internal acoustic transmitters (5 year life span) (Fig ). In the summer of 2017, ten additional mature Walleye were capture by angling in eastern Lake Ontario, east of Long Point, and tagged in a similar manner as was done in the spring. All Walleye were released near the area which they were captured, with no apparent mortality at the time of release. OMNRF, Queens University and USFWS have established arrays of Vemco 69 khz acoustic receivers in the Bay of Quinte-eastern Lake Ontario (Fig ). Together, these arrays provided information on individual detection events and frequency, which were then used to describe Walleye movement. Data from receivers downloaded in 2017 were retrieved from the Great Lakes Acoustic Telemetry Observation System (GLATOS). Individual detection histories and frequency of detections were examined over space and time. Of the 26 Walleye tagged in the spring, one individual was never detected and two were removed from the tagged population by the recreational fishery. The distribution of tagged fish by month is shown in Figure After spawning in the Bay of Quinte, tagged Walleye FIG OMNRF Lake Ontario Management Unit staff used boat electrofishing to capture mature Bay of Quinte Walleye during the spawn (left) and surgical techniques to implant Vemco acoustic transmitters (middle; right). Fish were marked with external tag, displaying individual fish numbers and OMNRF contact information (middle; right). Section 9. Research Activities
.")
181 173 migrated towards eastern Lake Ontario (April- May). The majority of Walleye left the Bay within one month of being tagged, passing through the gap between Prince Edward County and Amherst Island. Several individuals migrated to New York waters within 1-2 weeks of leaving the bay (May-June). Tagged Walleye were detected throughout eastern Lake Ontario during the late-spring and summer, with some areas of aggregation noted (June-July). Aggregation near Timber and False Duck Islands was observed in August and September, with signs of movement back towards the Bay in October. Detections of Walleye tagged during the summer are not reported here. LOMU, in partnership with Queens University, will continue acoustic tagging efforts and receiver retrievals in Spring efforts will be focused on the Trent and Napanee River, with additional mature walleye tagged in eastern Lake Ontario during June and August. Additional years of detection information paired with information collected from LOMU s assessment program is expected to provide a compressive look at Walleye migration and spatial ecology in the Bay of Quinte-eastern Lake Ontario. FIG Active acoustic receiver arrays in the Bay of Quinte-eastern Lake Ontario during 2017 (OMNRF, Queens University and USFWS). See Fig for a more detailed depiction of the eastern Lake Ontario acoustic receiver array. Section 9. Research Activities

182 174 April N T = 20; N 0 = 2 May N T = 26; N 0 = 2 June N T = 26; N 0 = 5 July N T = 26; N 0 = 8 August N T = 26; N 0 = 7 September N T = 26*; N 0 = 7 October N T = 25; N 0 = 7 FIG Overview of acoustic receiver locations and detections in the Bay of Quinte-eastern Lake Ontario, separated by month, in The number of tagged fish detected (N) at each receiver is visualized by colour saturation. Smaller circles with no colour indicates receivers which were active and were downloaded at the time of this report, but for which no fish were detected. The number of fish in the tagged population during each month is denoted as N T ; this excludes the 10 fish tagged during the summer sampling period. One fish was removed from the tagged population in September by way of the recreational fishery. The number of fish that were part of the defined tagged population (N T ) but which were not detected by any receiver during each time period is also displayed (N 0 ). Section 9. Research Activities
 worked in conjunction with MNRF s White Lake Fish Culture Station (FCS) to collect Bay of Quinte Walleye")
183 Partnerships 10.1 Walleye Spawn Collection J.A. Hoyle, Lake Ontario Management Unit In April 2017 the Lake Ontario Management Unit (LOMU) worked in conjunction with MNRF s White Lake Fish Culture Station (FCS) to collect Bay of Quinte Walleye gametes. Similar projects were conducted in spring In 2017, trap nets were set at four sites (Fig , Table ): Trumpour Point, Highshore, Big Bay, and Glenn Island. The trap nets were set beginning on April 3 in shoreline areas thought to be inhabited by Walleye that were staging to spawn. Netting took place from April Water temperature ranged from o C over this time period. Catches of Walleye captured in trap nets were supplemented with boat electrofishing efforts but electrofishing sampling information and fish catches were not recorded. Walleye, in spawning condition, were brought by boat to the Glenora Fisheries Station. Approximately 7.6 million eggs were collected from 33 families and transferred to the White Lake FCS. Walleye gametes collected in 2017 will be used to supply walleye fingerlings for stocking in inland lakes. The 2017 spawn collection will also provide wild gametes for restoration Walleye stocking of Walleye summer fingerlings in Toronto Harbour (see Section 7.4). Twenty species and a total of 1,609 fish including 488 Walleye were caught in trap nets in 2017 (Table ). Other commonly caught species included: Yellow Perch (280), White Perch (207), Black Crappie (137), Cisco (131), Brown Bullhead (80), Pumpkinseed (48), and Bluegill (42). Catches in 2017 are compared with those in 2014 to 2106 in Table A total of 23 species was caught in trap nets during the last four years. The size distribution of 489 Walleye FIG Bay of Quinte Walleye egg collection trap net site locations, Also shown is the location of the water temperature recording station. Section 10. Partnerships
Lake Ontario Fish Communities and Fisheries: 2016 Annual Report of the Lake Ontario Management Unit
 Lake Ontario Fish Communities and Fisheries: 216 Annual Report of the Lake Ontario Management Unit Cover Photos: (Left) MNRF s Ontario Explorer departing the Toronto Harbour, July 17, 216 (Right top) Ontario
LAKE ONTARIO FISH COMMUNITIES AND FISHERIES: 2013 ANNUAL REPORT OF THE LAKE ONTARIO MANAGEMENT UNIT
 LAKE ONTARIO FISH COMMUNITIES AND FISHERIES: 2013 ANNUAL REPORT OF THE LAKE ONTARIO MANAGEMENT UNIT LAKE ONTARIO FISH COMMUNITIES AND FISHERIES: 2013 ANNUAL REPORT OF THE LAKE ONTARIO MANAGEMENT UNIT
LAKE ONTARIO FISH COMMUNITIES AND FISHERIES: 2007 ANNUAL REPORT OF THE LAKE ONTARIO MANAGEMENT UNIT
 LAKE ONTARIO FISH COMMUNITIES AND FISHERIES: 2007 ANNUAL REPORT OF THE LAKE ONTARIO MANAGEMENT UNIT LAKE ONTARIO FISH COMMUNITIES AND FISHERIES: 2007 ANNUAL REPORT OF THE LAKE ONTARIO MANAGEMENT UNIT
Lake St. Clair Fish Community and Fishery
 Lake St. Clair Fish Community and Fishery Megan Belore Ontario Ministry of Natural Resources and Forestry Mike Thomas Michigan Department of Natural Resources Fish Community Fish Community Mixture of warm
Highlights of the Annual Lake Committee Meetings Great Lakes Fishery Commission proceedings held in Ypsilanti, MI
 Inland Seas Angler GREAT LAKES BASIN REPORT Special Report Lake Ontario A Publication of the Great Lakes Sport Fishing Council May 2009 http://www.great-lakes.org Vol. 20, No. 7 Highlights of the Annual
FISH COMMUNITIES AND FISHERIES OF THE THOUSAND ISLANDS AND MIDDLE CORRIDOR
 St. Lawrence River Discussion Paper FISH COMMUNITIES AND FISHERIES OF THE THOUSAND ISLANDS AND MIDDLE CORRIDOR Issues Below is a synopsis of fish community issues and proposed management approaches. More
STUDY PERFORMANCE REPORT
 STUDY PERFORMANCE REPORT State: Michigan Study No.: 427 Project No.: F-81-R-1 Title: Measurement of sportfishing harvest in lakes Michigan, Huron, Erie, and Superior Period Covered: October 1, 1999 to
LAKE ONTARIO FISH COMMUNITIES AND FISHERIES: 2001 ANNUAL REPORT OF THE LAKE ONTARIO MANAGEMENT UNIT
 LAKE ONTARIO FISH COMMUNITIES AND FISHERIES: 21 ANNUAL REPORT OF THE LAKE ONTARIO MANAGEMENT UNIT LAKE ONTARIO FISH COMMUNITIES AND FISHERIES: 21 ANNUAL REPORT OF THE LAKE ONTARIO MANAGEMENT UNIT Prepared
2011 Status of Major Stocks. Lake Erie Management Unit March 2012
 211 Status of Major Stocks Lake Erie Management Unit March 212 The Lake Erie Management Unit of the Ontario Ministry of Natural Resources is responsible for managing the fishery resources of the Ontario
Thunder Bay River Assessment Appendix. Appendix 2
 Appendix 2 Known past and present fish distributions in the River system. Distribution of fishes were compiled from Bailey et al. (2003) and from records located at the Michigan Department of Natural Resources
JOB 1, PART 2. SUMMARY OF CONOWINGO DAM WEST FISH LIFT OPERATIONS 2011
 JOB 1, PART 2. SUMMARY OF CONOWINGO DAM WEST FISH LIFT OPERATIONS 2011 Michael L. Hendricks Pennsylvania Fish and Boat Commission 1735 Shiloh Rd. State College, Pa 16801 INTRODUCTION The shore-based trapping
Job 1 Part JOB 1, PART 2: SUMMARY OF CONOWINGO DAM WEST FISH LIFT OPERATIONS, 2009
 2.0 JOB 1, PART 2: SUMMARY OF CONOWINGO DAM WEST FISH LIFT OPERATIONS, 2009 Lawrence M. Miller Normandeau Associates U. S. Fish and Wildlife Service 1921 River Road Harrisburg, Pennsylvania Drumore, Pennsylvania
SUMMARY OF CONOWINGO DAM WEST FISH LIFT OPERATIONS 2012
 SUMMARY OF CONOWINGO DAM WEST FISH LIFT OPERATIONS 2012 Michael L. Hendricks Pennsylvania Fish and Boat Commission 1735 Shiloh Rd. State College, Pa 16801 INTRODUCTION The shore-based trapping device at
Summary of 2012 DNR and Partners Fisheries Surveys in St. Clair/Lake Erie and Fishery Forecast for 2013
 Summary of 2012 DNR and Partners Fisheries Surveys in St. Clair/Lake Erie and Fishery Forecast for 2013 LE/LSC Citizens Fishery Advisory Committee April 2, 2013 Michael Thomas Fisheries Research Biologist
Species Highlights Alewife Moderate decline in numbers; 1998 year class still dominant (Chapter 1) Poor body condition (Chapter 1) Rainbow smelt Very
 Poor body condition (Chapter 1) Rainbow smelt Very") Species Highlights Alewife Moderate decline in numbers; 1998 year class still dominant (Chapter 1) Poor body condition (Chapter 1) Rainbow smelt Very low abundance (Chapter 1) Poor body condition (Chapter
Species Highlights Alewife Moderate decline in numbers; 1998 year class still dominant (Chapter 1) Poor body condition (Chapter 1) Rainbow smelt Very low abundance (Chapter 1) Poor body condition (Chapter
Great Lakes Coastal Wetland Communities: Vulnerabilities to Climate Change and Response to Adaptation Strategies
 Great Lakes Coastal Wetland Communities: Vulnerabilities to Climate Change and Response to Adaptation Strategies CCAF Wetlands Study Investigators: Susan Doka Fisheries & Oceans, Great Lakes Lab for Fisheries
December 18, Dear Sir/Madam,
 December 18, 2000 Dear Sir/Madam, We are writing to bring you up-to-date on our efforts to develop fish community objectives for the St. Lawrence River. First of all, we want to thank you for participating
Fisheries and Lake Management Planning. CAP Mtg Nov21,2012 Brett Tregunno Aquatic Biologist, Kawartha Conservation
 Fisheries and Lake Management Planning CAP Mtg Nov21,2012 Brett Tregunno Aquatic Biologist, Kawartha Conservation Outline Aquatic Habitat Types Fish Communities Significance of Resource Current Management
Columbia Lake Dam Removal Project
 Columbia Lake Dam Removal Project The Columbia Lake dam located 1/4 mile upstream of the Paulins Kill River's confluence with the Delaware River in Knowlton Township, Warren County has been proposed for
Impacts of Aquatic Invasive Species on the Lake Superior Fishery. by Jeff Gunderson Minnesota Sea Grant Program
 Impacts of Aquatic Invasive Species on the Lake Superior Fishery by Jeff Gunderson Minnesota Sea Grant Program Can humans really impact the fishery of such a large waterbody? Lake Superior Fishery Change
STUDY PERFORMANCE REPORT
 STUDY PERFORMANCE REPORT State: Michigan Study No.: 427 Project No.: F-81-R-2 Title: Measurement of sportfishing harvest in lakes Michigan, Huron, Erie, and Superior Period Covered: October 1, 2000 to
Keuka Lake State of the Lake 2017
 Keuka Lake State of the Lake 2017 1 2 Lake Characteristics Third largest by area of the Finger Lakes 11,730 ac Deep and steep sided - max 185 ft mean 101 ft Two story fishery (warmwater/coldwater) 178,800
Kawartha Lakes Fisheries. Dan Taillon Peterborough District Mike Rawson Kawartha Lakes Fisheries Assessment Unit
 Kawartha Lakes Fisheries Dan Taillon Peterborough District Mike Rawson Kawartha Lakes Fisheries Assessment Unit Presentation Outline State of the Kawartha Lakes Fishery Index netting data Angler creel
Status of Lake Erie s Western Basin Fish Populations: Trends and Environmental Conditions
 Status of Lake Erie s Western Basin Fish Populations: Trends and Environmental Conditions Jeff Tyson Ohio Department of Natural Resources Ohio Division of Wildlife Status of the Lake Erie s Western Basin
Quemahoning Reservoir
 Pennsylvania Fish & Boat Commission Biologist Report Quemahoning Reservoir Somerset County May 2011 Trap Net, Gill Net and Electrofishing Survey Quemahoning Reservoir is an 899 acre impoundment located
U. S. Fish and Wildlife Service Connecticut River Coordinator s Office. Ken Sprankle Connecticut River Coordinator
 U. S. Fish and Wildlife Service Connecticut River Coordinator s Office Ken Sprankle Connecticut River Coordinator Largest river basin in New England 400 miles long 11,250 mile 2 area Over 2,700 dams identified
Black Sturgeon Regional Plan
 Black Sturgeon Regional Plan This is one of twenty Regional Plans that support implementation of the Lake Superior Biodiversity Conservation Strategy (Strategy). The Strategy, prepared and overseen by
Status and Trends of the Lake Superior Fish Community,
 Status and Trends of the Lake Superior Fish Community, 1978-2015 An Overview of the USGS Lake Superior Monitoring and Research Program Owen Gorman, Mark Vinson & Daniel Yule Lake Superior Biological Station
Investigating reproduction and abundance of bighead carp (Hypophthalmichthys nobilis) and silver carp (H. molitrix) in the Greenup pool, Ohio River
 and silver carp (H. molitrix) in the Greenup pool, Ohio River") Investigating reproduction and abundance of bighead carp (Hypophthalmichthys nobilis) and silver carp (H. molitrix) in the Greenup pool, Ohio River Nathan Fleshman Dr. Thomas Jones Photo: USGS Photo: USGS
Investigating reproduction and abundance of bighead carp (Hypophthalmichthys nobilis) and silver carp (H. molitrix) in the Greenup pool, Ohio River Nathan Fleshman Dr. Thomas Jones Photo: USGS Photo: USGS
Future of Lake Whitefish and Lake Trout Populations in The Great Lakes
 Future of Lake Whitefish and Lake Trout Populations in The Great Lakes Mark P. Ebener Inter-Tribal Fisheries and Assessment Program Chippewa Ottawa Resource Authority Lake Trout (Salvelinus namaycush)
Onondaga Lake Fishery: 2011 Fact Sheet
 October, 2011 Onondaga County Department of Water Environment Protection SUNY College of Environmental Science and Forestry Joanne M. Mahoney, County Executive Tom Rhoads, P.E., Commissioner Onondaga Lake
NEVADA DEPARTMENT OF WILDLIFE STATEWIDE FISHERIES MANAGEMENT
 NEVADA DEPARTMENT OF WILDLIFE STATEWIDE FISHERIES MANAGEMENT FEDERAL AID JOB PROGRESS REPORTS F-2-49 213 RYE PATCH RESERVOIR WESTERN REGION NEVADA DEPARTMENT OF WILDLIFE, FISHERIES DIVISION ANNUAL PROGRESS
Geology. Key Factors. Overfishing. Great Lakes Fishes. Historical Fishing. About 10,000 years since last glacial retreat very young ecologically
 Great Lakes Fishes Geology About 10,000 years since last glacial retreat very young ecologically Largest surface freshwater system on earth 21% of world s supply 84% of North America s supply Five unique
Climate Change Impacts on Great Lakes Fishes
 Climate Change Impacts on Great Lakes Fishes Stuart A. Ludsin ludsin.1@osu.edu Changing Climate Webinar Series The Ohio State University 19 April 2011 Today s Presentation Great Lakes Fish Community A
LAKE DIANE Hillsdale County (T8-9S, R3W, Sections 34, 3, 4) Surveyed May Jeffrey J. Braunscheidel
 Surveyed May Jeffrey J. Braunscheidel") Michigan Department of Natural Resources Status of the Fishery Resource Report No. 2003-4, 2003 LAKE DIANE Hillsdale County (T8-9S, R3W, Sections 34, 3, 4) Surveyed May 2001 Jeffrey J. Braunscheidel Environment
Michigan Department of Natural Resources Status of the Fishery Resource Report No. 2003-4, 2003 LAKE DIANE Hillsdale County (T8-9S, R3W, Sections 34, 3, 4) Surveyed May 2001 Jeffrey J. Braunscheidel Environment
Status of the Lake Erie Fish Community Jeff Tyson, Ohio Division of Wildlife
 Status of the Lake Erie Fish Community 2010 Jeff Tyson, Ohio Division of Wildlife Status of the Lake Erie Fish Community 2010 Physical Environment/Fish Community West to east gradient in depth, temperature,
SUMMARY REPORT FOR LAKE ST. MALO FISHERIES ASSESSMENT. Prepared for the St. Malo and District Wildlife Association
 SUMMARY REPORT FOR LAKE ST. MALO FISHERIES ASSESSMENT Prepared for the St. Malo and District Wildlife Association Presented by August 25, 2014 Study dates thus far: Date Tasks February 16 Fishing derby;
Crawford Reservoir. FISH SURVEY AND MANAGEMENT INFORMATION Eric Gardunio, Fish Biologist Montrose Service Center
 FISH SURVEY AND MANAGEMENT INFORMATION General Information: Crawford Reservoir is a popular fishery that provides angling opportunity for yellow perch, channel catfish, northern pike, rainbow trout, black
Current Status and Management Recommendations for the Fishery in the Cloverleaf Chain of Lakes
 Current Status and Management Recommendations for the Fishery in the Cloverleaf Chain of Lakes Jason Breeggemann Senior Fisheries Biologist Wisconsin Department of Natural Resources Outline DNR fisheries
Alcona Dam Pond Alcona County (T25N, R5E, Sections various) Surveyed June 6-12 and September 16, 2003
 Surveyed June 6-12 and September 16, 2003") Michigan Department of Natural Resources Status of the Fishery Resource Report No. 2004-6, Year 2004 Alcona Dam Pond Alcona County (T25N, R5E, Sections various) Surveyed June 6-12 and September 16, 2003
Michigan Department of Natural Resources Status of the Fishery Resource Report No. 2004-6, Year 2004 Alcona Dam Pond Alcona County (T25N, R5E, Sections various) Surveyed June 6-12 and September 16, 2003
Study 9.5 Fish Distribution and Abundance in the Upper Susitna River
 Initial Study Report Meeting Study 9.5 Fish Distribution and Abundance in the Upper Susitna River October 15, 2014 Prepared by R2 Resource Consultants, Inc. 10/15/2014 1 Study 9.5 Objectives 1. Describe
Upper Columbia Redband Trout: Conservation for the Future
 Upper Columbia Redband Trout: Conservation for the Future Bryan Jones and Holly McLellan Colville Confederated Tribes Fish and Wildlife Department Historic Notes Upper Columbia River Large runs of steelhead,
2017 Lake Winnebago Bottom Trawling Assessment Report
 217 Lake Winnebago Bottom Trawling Assessment Report Adam Nickel, Winnebago System Gamefish Biologist, March 218 There were several highlights from the 217 Lake Winnebago bottom trawling survey, including
Renseignements supplémentaires. Supplementary Information. Présentation du Ministère des Richesses naturelles de l Ontario
 Deep Geologic Repository Joint Commission d examen conjoint du projet de stockage dans des couches géologiques profondes PMD 13-P1.6B File / dossier : 8.01.07 Date: 2013-10-01 Edocs: 4209085 Supplementary
Elk Lake, Antrim and Grand Traverse counties T. 28, 29 N., R. 8, 9 W., Sec. many. Lake surveys. began at 40 feet
 Elk Lake, Antrim and Grand Traverse counties T. 28, 29 N., R. 8, 9 W., Sec. many Physical and chemical data surveyed August 1931 Temperature ( F) Secchi disk (feet) 9. 6 Surface 74 Bottom 45 PH 8.0 Thermocline
NORTHWEST SCIENCE AND INFORMATION
 Science and Information Branch NORTHWEST SCIENCE AND INFORMATION Aquatics Update 2002-1 Fall Walleye Index Netting (FWIN) and Trap Netting Summary for Niobe Lake, 2000 by T. Cano Introduction Since 1981,
NEVADA DEPARTMENT OF WILDLIFE STATEWIDE FISHERIES MANAGEMENT
 NEVADA DEPARTMENT OF WILDLIFE STATEWIDE FISHERIES MANAGEMENT FEDERAL AID JOB PROGRESS REPORTS F-20-48 2012 RYE PATCH RESERVOIR WESTERN REGION NEVADA DEPARTMENT OF WILDLIFE, FISHERIES DIVISION JOB PROGRESS
Fish Community. Fish Habitat, Streams and Rivers
 Clear, Ston(e)y and White Lake Plan Fish Community The lakes support a cool/warm water fishery including muskellunge, walleye, largemouth and smallmouth bass, yellow perch, pumpkinseed, rockbass, blue
2015 Winnebago System Walleye Report
 215 Winnebago System Walleye Report Adam Nickel, Winnebago Gamefish Biologist, March 216 As winter passes in the rear view mirror, it won t be long until the spring rush of the 216 walleye run is here.
Untested Assumptions in Fisheries Management: the role of competition in Brook Trout declines?
 Untested Assumptions in Fisheries Management: the role of competition in Brook Trout declines? Brian Morrison Fisheries Biologist Ganaraska Region Conservation Authority November 22, 2012 Alternate Titles
Great Lakes fish consumption advisories: Is mercury. a concern? Supplemental Material. Satyendra P. Bhavsar *, Emily Awad, Chris G. Mahon, Steve Petro
 Suppl Mtrls (not cover letter - place cover letter in "comments") Supplemental Material Great Lakes fish consumption advisories: Is mercury a concern? Satyendra P. Bhavsar *, Emily Awad, Chris G. Mahon,
Cedar Lake Comprehensive Survey Report Steve Hogler and Steve Surendonk WDNR-Mishicot
 Cedar Lake- 2006 Comprehensive Survey Report Steve Hogler and Steve Surendonk WDNR-Mishicot ABSTRACT Cedar Lake is a 142 acre lake located in the southwest corner of Manitowoc County. It is a seepage lake
Michigan Dept. of Natural Resources Status of the Fishery Resource Report Page 1. Weber Lake Cheboygan County, T34N, R3W, Sec.
 Michigan Dept. of Natural Resources 2012-143 Status of the Fishery Resource Report Page 1 Weber Lake Cheboygan County, T34N, R3W, Sec. 31 Neal Godby, Fisheries Biologist Environment Weber Lake is a 28.5-acre
EXECUTIVE SUMMARY FISH COMMUNITY AND HABITAT EXISTING CONDITIONS REPORT
 EXECUTIVE SUMMARY FISH COMMUNITY AND HABITAT EXISTING CONDITIONS REPORT First Mining Gold (First Mining) has completed a comprehensive Fish Community and Habitat Existing Conditions Report which has utilized
JadEco, LLC PO BOX 445 Shannon, IL 61078
 Introduction: With the assistance of Lake Holiday staff and volunteers, we were able to conduct an AC electrofishing survey on May 8, 27. Water temperatures were 2.3 C (8.5 F) and water clarity was decent
Indiana Administrative Code Page IAC Aquaculture permit Authority: IC Affected: IC Sec. 17. (a) A person must not
 A person must not") Indiana Administrative Code Page 71 312 IAC 9-10-17 Aquaculture permit Affected: IC 14-22-27 Sec. 17. (a) A person must not import, raise, sell, or transport fish into or within Indiana without an aquaculture
Indiana Administrative Code Page 71 312 IAC 9-10-17 Aquaculture permit Affected: IC 14-22-27 Sec. 17. (a) A person must not import, raise, sell, or transport fish into or within Indiana without an aquaculture
(date are inclusive)
") Kind of Fish and Locality Methods Permitted Open Season (date are inclusive) Bag Limit Maximum or Minimum Size Limits (a) LARGE MOUTH AND SMALLMOUTH BASS. (i) All waters Hook & Line ice fishing (including
Kind of Fish and Locality Methods Permitted Open Season (date are inclusive) Bag Limit Maximum or Minimum Size Limits (a) LARGE MOUTH AND SMALLMOUTH BASS. (i) All waters Hook & Line ice fishing (including
BIG TWIN LAKE Kalkaska County (T28N, R05W, Section 18, and T28N, R06W, Section 13) Surveyed May 1999
 Surveyed May 1999") Michigan Department of Natural Resources Status of the Fishery Resource Report No. 2001-1, Year 2001 BIG TWIN LAKE Kalkaska County (T28N, R05W, Section 18, and T28N, R06W, Section 13) Surveyed May 1999
Michigan Department of Natural Resources Status of the Fishery Resource Report No. 2001-1, Year 2001 BIG TWIN LAKE Kalkaska County (T28N, R05W, Section 18, and T28N, R06W, Section 13) Surveyed May 1999
Busse Reservoir South Lateral Pool Population Survey
 Busse Reservoir South Lateral Pool Survey Located in Elk Grove Village south of Higgins Rd. between RT 53/I-290 and Arlington Heights Rd. Busse Reservoir is comprised of three pools making up a total of
NEVADA DEPARTMENT OF WILDLIFE STATEWIDE SPORT FISHERIES MANAGEMENT
 NEVADA DEPARTMENT OF WILDLIFE STATEWIDE SPORT FISHERIES MANAGEMENT FEDERAL AID JOB PROGRESS REPORT F-2-52 216 WILDHORSE RESERVOIR EASTERN REGION NEVADA DEPARTMENT OF WILDLIFE, FISHERIES DIVISION ANNUAL
Methods for Evaluating Shallow Water Habitat Restoration in the St. Clair River
 Methods for Evaluating Shallow Water Habitat Restoration in the St. Clair River Objectives Document fish use of restoration sites Spawning Presence of larvae, juvenile, and adult fish Quantify differences
Bode Lake - South Population Survey
 Bode Lake - South Survey Located in Hoffman Estates on the north side of Bode Rd. 1 mile west of Barrington Rd. Bode Lake is made up of two lakes along Poplar Creek; the larger and deeper Bode Lake South
Little Calumet River Rapid Response Fish Identification and Enumeration Branch Summary Report
 Little Calumet River Rapid Response Fish Identification and Enumeration Branch Summary Report Introduction A rotenone rapid response was completed on a 2.6-mile section of the Little Calumet River immediately
Rolling Knolls Pond Population Survey
 Located near the town of Elgin on the west side of Rohrssen Rd. between Illinois Route 58 and U.S.- 20. This small 1.8 acre pond has a maximum depth of 7.5 feet and is occasionally influenced by Poplar
ADOPT-A-STREAM WATERSHED APPROACH COMMUNITY-BASED STEWARDSHIP. Nova Scotia Salmon Association March 2005
 ADOPT-A-STREAM A WATERSHED APPROACH TO COMMUNITY-BASED STEWARDSHIP Nova Scotia Salmon Association March 2005 This manual is a revised and updated version of the 1994 Adopt-a-Stream manual that was prepared
TABLE ROCK LAKE 2014 ANNUAL LAKE REPORT. Shane Bush Fisheries Management Biologist Missouri Department of Conservation Southwest Region
 TABLE ROCK LAKE 14 ANNUAL LAKE REPORT Shane Bush Fisheries Management Biologist Missouri Department of Conservation Southwest Region March 1, 15 EXECUTIVE SUMMARY Table Rock Lake is a 43,1 acre reservoir
Dauphin Lake Fishery. Status of Walleye Stocks and Conservation Measures
 Dauphin Lake Fishery Status of Walleye Stocks and Conservation Measures Date: December, 21 Dauphin Lake Fishery Status of Walleye Stocks and Conservation Measures Background: Walleye stocks in Dauphin
Rainy Lake Open-water Creel Survey:
 Rainy Lake Open-water Creel Survey: 21 11 Darryl McLeod District Update 212-1 Introduction An open-water creel survey was conducted on the Ontario portion of Rainy Lake from May 15 th (the opening of the
THE FISHERY IN KENNEBEC LAKE Prepared by: Cam McCauley Landscape Planning Biologist Peterborough District, i t Kingston
 THE FISHERY IN KENNEBEC LAKE Prepared by: Cam McCauley Landscape Planning Biologist Peterborough District, i t Kingston 613-531-57055705 Questions 1. How many walleye and age structure now? 2. Status of
Introduction: JadEco, LLC PO BOX 445 Shannon, IL 61078
 Introduction: was contacted to collected data on the fishery for Lake Holiday. AC Electroshocking was conducted at 2 locations on September 28, 2015. Fish population data was collected for a total of 100
Fisheries Survey of White Rapids Flowage, Marinette County Wisconsin during Waterbody Identification Code
 Fisheries Survey of White Rapids Flowage, Marinette County Wisconsin during 25 Waterbody Identification Code 6343 Michael Donofrio Fisheries Supervisor Wisconsin Department of Natural Resources Peshtigo,
Crooked Lake Oakland County (T4N, R9E, Sections 3, 4, 9) Surveyed May James T. Francis
 Surveyed May James T. Francis") Michigan Department of Natural Resources Status of the Fishery Resource Report No. 2004-1, 2004 Crooked Lake Oakland County (T4N, R9E, Sections 3, 4, 9) Surveyed May 2002 James T. Francis Environment Crooked
Michigan Department of Natural Resources Status of the Fishery Resource Report No. 2004-1, 2004 Crooked Lake Oakland County (T4N, R9E, Sections 3, 4, 9) Surveyed May 2002 James T. Francis Environment Crooked
Lake Ontario Stocking Program Review November 2014
 Lake Ontario Stocking Program Review November 2014 Ministry of Natural Resources and Forestry Fish and Wildlife Services Branch Lake Ontario Management Unit 41 Hatchery LN, Picton, ON Lake Ontario Stocking
Ecosystem Monitoring Project 2014 Fish Sampling Update
 Ecosystem Monitoring Project 2014 Fish Sampling Update Lyndal Johnson, Sean Sol, Dan Lomax, Paul Chittaro, David Teel, and Gina Ylitalo NOAA Fisheries Northwest Fisheries Science Center, Seattle, WA, USA
Charter Boat Fishing in Lake Michigan: 2015 Illinois Reported Harvest
 Illinois Department of Natural Resources Division of Fisheries Charter Boat Fishing in Lake Michigan: 2015 Illinois Reported Harvest Steven R. Robillard Illinois Department of Natural Resources Lake Michigan
Salmonid Community of Lake Michigan: 2017 Fall Harbor Assessment
 Illinois Department of Natural Resources Division of Fisheries Salmonid Community of Lake Michigan: 2017 Fall Harbor Assessment Steven R. Robillard Illinois Department of Natural Resources - Lake Michigan
Summary of and Initial Response to public comments on MN Department of Natural Resources proposal to manage new waters for Muskellunge
 Summary of and Initial Response to public comments on MN Department of Natural Resources proposal to manage new waters for Muskellunge Summary of and Initial Response to public comments: This document
In each summer issue of Lake
 The 2000 Lake Erie Walleye Report by Rick Kubb In each summer issue of Lake Erie Walleye Magazine, we provide a synopsis of the walleye fishery in Lake Erie based on the scientific reports produced by
Caro Impoundment, Tuscola County
 Caro Impoundment is a 200 acre impoundment of the Cass River located one mile south of the Village of Caro in Tuscola County. Caro Dam, originally constructed in 1906 for water supply to Michigan Sugar
STUDY PERFORMANCE REPORT
 STUDY PERFORMANCE REPORT State: Michigan Project No.: F-53-R-14 Study No.: 486 Title: Assessment of lake trout populations in Michigan s waters of Lake Michigan. Period Covered: April 1, 1997 to March
NEVADA DEPARTMENT OF WILDLIFE STATEWIDE FISHERIES MANAGEMENT
 NEVADA DEPARTMENT OF WILDLIFE STATEWIDE FISHERIES MANAGEMENT FEDERAL AID JOB PROGRESS REPORTS F-2-52 216 CHIMNEY RESERVOIR WESTERN REGION NEVADA DEPARTMENT OF WILDLIFE, FISHERIES DIVISION JOB PROGRESS
Fisheries Management Zone 10:
 Fisheries Management Zone 10: Lake Trout Operational Objectives and Management Photo Credit: www.jamessmedleyoutdoors.com 2 FMZ 10: Lake Trout Operational Objectives and Management Lake trout are the second
Ohio Lake Erie Fisheries Report For 2002
 Ohio Lake Erie Fisheries Report For 2002 Summary and Excerpts from the March 2003 report by the Lake Erie Fisheries Units of the Ohio Department of Natural Resources, Division of Wildlife Note: Tables
Public Input to St. Lawrence River Fisheries Community Objectives
 Public Input to St. Lawrence River Fisheries Community Objectives Tommy L. Brown, Human Dimensions Research Unit, Cornell University Steven R. LaPan, New York State Department of Environmental Conservation,
Tampier Lake Population Survey
 Located in Palos Park on 131 st St. between Wolf and Will-Cook Rd. s. Tampier Lake has 131 acres of fishable water, with a maximum depth of 9.4 feet. Walleye, northern pike, largemouth bass and channel
Striped Bass and White Hybrid (x) Striped Bass Management and Fishing in Pennsylvania
 Striped Bass Management and Fishing in Pennsylvania") Striped Bass and White Hybrid (x) Striped Bass Management and Fishing in Pennsylvania Prepared by R. Lorantas, D. Kristine and C. Hobbs PFBC Warmwater Unit 2005 (stocking numbers updated after 2005) Goal:
Striped Bass and White Hybrid (x) Striped Bass Management and Fishing in Pennsylvania Prepared by R. Lorantas, D. Kristine and C. Hobbs PFBC Warmwater Unit 2005 (stocking numbers updated after 2005) Goal:
Big Bend Lake Population Survey
 Big Bend Lake Survey Located in Des Plaines on East River Rd. just south of Golf Rd. This 27 acre body of water has a depth of 27.8 feet; however because it is connected to the Des Plaines River by a spillway,
Lower Lake Committees Meetings March 27-28, 2018 Hilton Toronto Markham Suites Hotel Markham, Ontario DRAFT AGENDA. Lake Ontario Committee Meeting
 Lower Lake Committees Meetings March 27-28, 2018 Hilton Toronto Markham Suites Hotel Markham, Ontario DRAFT AGENDA Lake Ontario Committee Meeting Tuesday, March 27 10:00 am 1. LOC Introductions - Andy
Lake Butte des Morts Commercial Seining Project Report
 Lake Butte des Morts Commercial Seining Project Report Adam Nickel, Winnebago Gamefish (excluding sturgeon) Biologist, 22 December 2014 Conducting comprehensive fish surveys on the Upriver Lakes, including
Lake information report
 Page 1 of 6 Lake information report Name: Saganaga Nearest Town: Grand Marais Primary County: Cook Survey Date: 08/08/2011 Inventory Number: 16063300 walleye stocking. Purchase a walleye stamp. Your voluntary
Charter Boat Fishing in Lake Michigan: 2017 Illinois Reported Harvest
 Illinois Department of Natural Resources Division of Fisheries Charter Boat Fishing in Lake Michigan: 2017 Illinois Reported Harvest Steven R. Robillard Illinois Department of Natural Resources Lake Michigan
Laurentian Great Lakes and their invasive species. Jeff Gunderson Minnesota Sea Grant College Program
 Laurentian Great Lakes and their invasive species Jeff Gunderson Minnesota Sea Grant College Program Largest Group of Freshwater Lakes in the World Contain 21% of the worlds surface freshwater Variety
Okanagan Sockeye Reintroduction
 Okanagan Sockeye Reintroduction Backgrounder Elders accounts, and other forms of Traditional Ecological Knowledge (TEK) tell us that many species of salmon once came into the Okanagan Valley and tell us
Sag Quarry - West Population Survey
 Located in Lemont on RT 83 and Archer Ave. just north of 111 th St. Like Sag Quarry East, this lake is an old limestone quarry, 14 acres in size and with a maximum depth of 10.3 feet. The species found
NEVADA DEPARTMENT OF WILDLIFE STATEWIDE FISHERIES MANAGEMENT
 NEVADA DEPARTMENT OF WILDLIFE STATEWIDE FISHERIES MANAGEMENT FEDERAL AID JOB PROGRESS REPORTS F-20-52 2016 Lake Tahoe Rainbow Trout Study WESTERN REGION NEVADA DEPARTMENT OF WILDLIFE, FISHERIES DIVISION
How Marine-Derived Nutrients Benefit Both Natural and Model Stream Systems
 How Marine-Derived Nutrients Benefit Both Natural and Model Stream Systems Kurt M. Samways 1 and Margaret Q. Guyette 2 1 University of New Brunswick, Canadian Rivers Institute, Department of Biology, Fredericton
Fisheries Survey of Saratoga Lake
 Fisheries Survey of Saratoga Lake 7- Mark D. Cornwell Kevin Poole State University of New York College of Agriculture & Technology Department of Fisheries & Wildlife Cobleskill, NY ABSTRACT: This survey
CUSHMAN RESERVOIRS. Skokomish Watershed Monitoring Conference - Public Meeting Florian Leischner 9/17/2015
 CUSHMAN RESERVOIRS Skokomish Watershed Monitoring Conference - Public Meeting Florian Leischner 9/17/2015 CUSHMAN RESERVOIRS MONITORING Management and monitoring of Tacoma Power reservoirs Lake Cushman
SKIATOOK LAKE MANAGEMENT PLAN
 SKIATOOK LAKE MANAGEMENT PLAN Background Skiatook Lake impounds Hominy Creek, 5 miles west of Skiatook in Osage County, Oklahoma (Figure 1). Skiatook Lake covers 10,540 surface acres and was constructed
Wampum Lake Population Survey
 Wampum Lake Survey Located in Thornton on Thornton-Lansing Rd. 1½ mile west of Torrence Ave. Wampum Lake is 35 acres is size and has a maximum depth of 14.1 feet. Northern pike, largemouth bass, bluegill,