Marine Aquaculture Task Force Meeting Jan 19-21, 2006 Issue: Feeds & Nutrition Aquafeeds & Reduction Fisheries
|
|
|
- Noel Johnson
- 5 years ago
- Views:
Transcription


1 Albert G.J. Tacon Ph.D Aquaculture Development & Coordination Program - AQUAHANA University of Hawai i atacon@hawaii.edu
2 AQUACULTURE: THE GROWING BLUE REVOLUTION Million tonnes Fastest growing food sector for over 3 decades (8.6%/yr) production: 54.8 mmt, $ 67.3 billion, 247 species - by 2015 exceed capture fisheries mmt 54.8 mmt AQUACULTURE - WORLD CAPTURE FISHERIES - WORLD
3 AQUACULTURE: THE GROWING BLUE REVOLUTION Million tonnes Fastest growing food sector for over 3 decades (8.6%/yr) production: 54.8 mmt, $ 67.3 billion, 247 species - by 2015 exceed capture fisheries mmt 54.8 mmt AQUACULTURE - WORLD CAPTURE FISHERIES - WORLD
4 World Marine finfish Aquaculture and shellfish Task Force production Meeting from Jan capture 19-21, 2006 fisheries, and disposition of the catch (FAO, 2005) Million tonnes Global trends in capture fisheries: - Over 30.9% of catch destined for reduction - Decreasing per caput food supply max at 11.2 kg in 1987 decreasing to 9.8 kg Supplies <1% total calorie intake - Reverse production pyramid mmt mmt Mainly pelagic plankton filter feeders/omnivores: includes anchovies, herring, capelin, sardines, pilchards, mackerel, sand eels, menhaden, trash fish CAPTURE - NON-FOOD (FEED) CAPTURE - FOOD
5 Total world capture fisheries production in 2003 (FAOSTAT, 2005) CRUSTACEANS 6.6% MOLLUSCS 7.8% AQUATIC PLANTS 1.4% Finfish mmt Molluscs 7.14 mmt Aquatic plants 1.27 mmt Crustaceans 6.06 mmt Others 0.60 mmt Total marine/brackish 90.8% Fish marine/brackish 90.0% FINFISH 83.5% Total production by weight 91.5 mmt


 Herbivores")

6 Current answer to the above question: YES Capture fisheries has been feeding the world on carnivorous fish species since mankind first started hunting or fishing the oceans - Alaskan pollock - Skipjack tuna - Yellowfin tuna - Atlantic cod Majority of captured marine food fish spp have carnivorous feeding habits, actively consuming animal protein within pelagic or benthic zone, includes macrofauna, benthos or other fish (piscivores tuna) Herbivores (plant/detritus feeders) rep. <2% all fish, more frequent at low than high latitudes (mullets, milkfish, rabbitfish, parrot fish)
7 Production pyramid of capture fisheries landings in 2003 CARNIVOROUS FINFISH mmt CRUSTACEANS 6.06 mmt Alaskan pollack Skipjack tuna Yellowfin tuna Atlantic cod 2.89 mmt 2.11 mmt 1.48 mmt 0.85 mmt FRESHWATER FINFISHES 7.62 mmt FILTER FEEDING PELAGIC FISH mmt FILTER FEEDING MOLLUSCS 7.14 mmt AQUATIC PLANTS 1.17 mmt CARNIVOROUS FINFISH 45.1% CRUSTACEANS 6.6% OMNIVORES/HERBIVORES 48.3%
8 World Marine finfish Aquaculture and shellfish Task Force production Meeting from Jan capture 19-21, 2006 fisheries, and disposition of the catch (FAO, 2005) Million tonnes mmt 42.3 mmt 28.3 mmt CAPTURE - NON-FOOD (FEED) CAPTURE - FOOD AQUACULTURE - FISH & SHELLFISH
9 Total world aquaculture production in 2003 (FAOSTAT, 2005) AQUATIC PLANTS MOLLUSCS 22.8% 22.4% OTHERS 0.3% FINFISH 49.3% Total production by weight CRUSTACEANS 5.1% Finfish mmt Molluscs mmt Aquatic plants mmt Crustaceans 2.79 mmt Others 0.17 mmt Marine sp. 50.5% Brackishwater sp. 5.3% Freshwater sp. 44.2% Total marine/brackish 55.75% Fish 85.6% freshwater sp mmt
10 CARNIVOROUS FINFISH 3.98 mmt 7.3% OMNIVOROUS CRUSTACEANS 2.79 mmt 5.1% HERBIVOROUS/ OMNIVOROUS/ FILTER FEEDING FINFISH, MOLLUSCS AQUATIC PLANTS mmt 87.6% CRUSTACEA OMNIVOROUS/ HERBIVOROUS FINFISH mmt 29.2% FILTER FEEDING FINFISH 7.04 mmt % FILTER FEEDING MOLLUSCS mmt 22. 4% PHOTOSYNTHETIC AQUATIC PLANTS mmt % Global aquaculture production pyramid in 2003
11 Total world aquaculture production by region in 2003 PRODUCTION BY WEIGHT mmt EUROPE 4.0% PRODUCTION BY VALUE US $ billion EUROPE 7.6% ASIA 91.2% ASIA 81.9% SOUTH AMERICA 1.9% BY WEIGHT 5.8% BY VALUE NORTH AMERICA 1.6% BY WEIGHT 2.7% BY VALUE AFRICA 1.0% BY WEIGHT 1.2% BY VALUE OCEANIA 0.2% BYWEIGHT 0.7% BY VALUE
12 TOP AQUACULTURE PRODUCERS IN China mmt (70.5%) $ billion 02. India 2.21 mmt $ 2.5 billion 03. Philippines 1.45 mmt $ 0.7 billion 04. Japan 1.33 mmt $ 4.4 billion 05. Indonesia 1.23 mmt $ 1.7 billion 06. Vietnam 0.97 mmt $ 2.0 billion 07. Bangladesh 0.86 mmt $ 1.2 billion 08. Korea Rep mmt $ 1.1 billion 09. Thailand 0.77 mmt $ 1.9 billion 10. Chile 0.63 mmt $ 2.2 billion 11. Norway 0.58 mmt $ 1.3 billion 12. USA 0.54 mmt $ 0.8 billion China: pigs, rice, eggs, fish (over 2000 year tradition) Hawaii: 400 years, earliest record in the Americas


13 Ancient Hawaiian Fishponds Like their Polynesian forebears, Hawai ians ians were among the first aquaculturists on the planet. Date back to the 13 th century Generally, the Hawai ians kept and raised mullet, milkfish, and shrimp in these open ponds, as well as Moi;
14 World Marine finfish Aquaculture and shellfish Task Force production Meeting from Jan capture 19-21, 2006 fisheries, and disposition of the catch (FAO, 2005) Million tonnes mmt 42.3 mmt 28.3 mmt CAPTURE - NON-FOOD (FEED) CAPTURE - FOOD AQUACULTURE - FISH & SHELLFISH
15 CARNIVOROUS FINFISH 3.98 mmt 7.3% OMNIVOROUS CRUSTACEANS 2.79 mmt 5.1% HERBIVOROUS/ OMNIVOROUS/ FILTER FEEDING FINFISH, MOLLUSCS RUSTACE AQUATIC PLANTS mmt 87.6% CRUSTACEA OMNIVOROUS/ HERBIVOROUS FINFISH mmt 29.2% FILTER FEEDING FINFISH 7.04 mmt % FILTER FEEDING MOLLUSCS mmt 22. 4% AQUAFEED FED SPECIES PHOTOSYNTHETIC AQUATIC PLANTS mmt % Global aquaculture production pyramid in 2003
16 Estimated global compound aquafeed production in 2003 for major farmed species (values expressed as % total aquafeed production, dry as-fed basis) FRESHWATER CRUSTACEANS TILAPIA MARINE SHRIMP 3.6% 8.1% 15.0% SALMON 8.4% TROUT 3.7% MILKFISH 2.7% EEL 2.0% MARINE FISH 7.6% CATFISH 4.1% FEEDING CARPS 45.0% MARINE/BRACKISHWATER SPECIES 7.7 MMT % Total estimated compound aquafeed production in million tonnes
17 Estimated global industrial feed production in 2004 for major farmed animal species (values expressed as % dry as-fed basis) AQUACULTURE OTHERS 3.0% POULTRY 38.0% 3.0% CATTLE 24.0% PIGS 32.0% TOTAL ESTIMATED INDUSTRIAL ANIMAL FEED PRODUCTION IN MMT (Source: Gill, 2005)
18 At present the culture of carnivorous finfish, crustaceans & and to a lesser extent omnivorous/ herbivorous finfish is dependent upon reduction fisheries for sourcing key feed ingredient inputs, either in the form of fishmeal & fish oil, or directly in the form of whole fish or trash fish


19 At present the culture of carnivorous finfish, crustaceans & and to a lesser extent omnivorous/ herbivorous finfish is dependent upon reduction fisheries for sourcing key feed ingredient inputs, either in the form of fishmeal & fish oil, or directly in the form of whole fish or trash fish
20 Reported global fishmeal and fish oil usage in 2002 (Source: Pike, 2005) Ruminants 1% 7% Others Edible 14% Industrial 5% 24% Pigs Aquaculture 46% Poultry Aquaculture 22% 81% Fishmeal Fish oil
21 Typical fishmeal inclusion levels within livestock feeds and aquaculture feeds include: Pig: creep 5-10%, 5 weaner 5-10%, grower 3-5%, 3 finisher 3%, sow 3%; Poultry: chick rearing up to 3%, broiler 2-5%, 2 breeder 1-5%, 1 layer 2%; turkey 3-10%, 3 Pheasant/game 3-7%; 3 Dairy cattle: late pregnant %, lactating 5-10%, 5 calves %; Sheep: breeding ewes/pregnant 2-7.5%, 2 lactating 5-10%, 5 growing lambs %; Fish/carnivores: salmonids/eels/marine finfish):starter 35-70%, grower 20-50%; Fish/omnivores: carp/tilapia/catfish): starter 10-25%, grower 2-15%; 2 and Marine shrimp: starter 25-50, 50, grower 15-35%.
22 . Production Marine Aquaculture of finfish Task by feeding Force Meeting habit: (Source: Jan 19-21, FAO, a) Issue: (values Feeds expressed & Nutrition in thousand Aquafeeds tonnes - tt, &, live Reduction weight equivalents) Fisheries tt GROWTH (% APR) Carnivores 11.0% 9.5% 10.6% 10.3% 4.6% Filter feeders 6.0% 12.5% 9.1% 8.6% 3.6% Omnivores/herbivores 5.7% 12.5% 10.6% 9.2% 6.5% Total finfish 6.4% 12.1% 10.3% 9.2% 5.4% Carnivorous species: salmon, trout, eels, amberjack, seabass, seabream, black carp, mandarin fish, groupers, snakeheads CARNIVORES FILTER FEEDERS OMNIVORES/HERBIVORES TOTAL FINFISH
23 Estimated global use of fishmeal within compound aquafeeds in 2003 by major cultivated species (% total fish meal used within aquafeeds, dry as-fed basis) FRESHWATER CRUSTACEANS 4.7% CATFISH 0.8% TILAPIA 2.7% CARP 14.9% MARINE SHRIMP 22.8% MARINE/BRACKISHWATER SPECIES 2,255 tt or 76.8% MARINE FISH 20.1% MILKFISH 1.2% EEL 5. 8% SALMON 19.5% TROUT 7.4% Total estimated fishmeal used in aquafeeds in 2003 was 2, 936 thousand tonnes or 53.2% of total reported world fishmeal production of 5,520 thousand tonnes in 2003
24 Estimated global use of fish oil within compound aquafeeds in 2003 by major cultivated species (% total fish oil used within aquafeeds, dry as-fed basis) MARINE FISH 13.8% MARINE SHRIMP 7.3% FW CRUSTACEANS 1.7% CATFISH 1.0% TILAPIA 2.0% TROUT 15.4% CARPS 5.5% MILKFISH 0.6% SALMON 51.0% EEL 1.4% MARINE/BRACKISHWATER SPECIES 718 mmt or 89.5% Total estimated fish oil used in aquafeeds in 2003 was 802 thousand tonnes or 86.8% of total reported world fish oil production of 924,426 tonnes in 2003


25 Largest consumer of fish meal and fish oil SEALAB SUSTA INA BLE ECOLOGICA L AQUA CULTURE LA BORA TORY
26 T Total estimated FM & FO consumption in 2003 (thousand tonnes) FM FO FM+FO Production Salmon ,259 Marine shrimp ,805 Marine fish ,101 Feeding carp ,179 Trout Marine eels Fw. Crustaceans Tilapia ,678 Milkfish Catfish Total marine/brackish , ,503
27 Fishmeal and Fish oil dietary inclusion levels Fishmeal Fish oil Above changes have resulted in improved fish growth & feed efficiency
28 T Estimated Economic FCR for farmed aquaculture species (Tacon, 2005) Harvest body weight Time Salmon kg? Trout 1.3 < 1 kg Catfish 1.6 < 500 g Marine shrimp 1.9 <15-25 g Tilapia 2.0 < 750 g Milkfish 2.0 < 1 kg Marine fish 2.0 < 1 kg Feeding carp 2.0 < 1 kg Marine eels 2.0 < 500 g Fw. Crustaceans 2.3 < 50 g
29 T INPUT:OUTPUT BALANCE SHEET Total estimated use of FM & FO in 2003 was 3.74 million tonnes ( million tonnes) or the equivalent input of 15 to 18.7 million tonnes of pelagics (using a dry meal plus oil to wet fish weight equivalents conversion factor of 4 to 5) for the production or output of million tonnes of total farmed finfish and crustaceans in 2003 or million tonnes of fed finfish and crustacean species production. Moreover, coupled with the use of trash fish as a direct food source for farmed fish (especially marine finfish, and to a lesser extent crustaceans) currently estimated at 5-6 million tones it is estimated that the aquaculture sector consumed the equivalent of million tonnes of fish as feed in 2003 (either in the form of fishmeal, fish oil or trash fish, expressed in live weight equivalents) for the total production of about 30 million tonnes of farmed finfish and crustaceans in 2003.
30 World Marine finfish Aquaculture and shellfish Task Force production Meeting from Jan capture 19-21, 2006 fisheries, and disposition of the catch (FAO, 2005) Million tonnes mmt as feed Double counting? Not much left anyway? mmt 42.3 mmt 28.3 mmt CAPTURE - NON-FOOD (FEED) CAPTURE - FOOD AQUACULTURE - FISH & SHELLFISH


31 Status of reduction fisheries and ecosystem impacts from fishmeal and fish oil use
32 Million tonnes Total finfish & shellfish production from capture fisheries and aquaculture destined for food use, and proportion of catch destined for reduction into fishmeal & fish oil (FAO, 2005) Disposition of total global fish & shellfish catch in 2003; million tonnes (69.1%) for direct human consumption, million tonnes (23.4%) for reduction into fish meals and oils, and 6.9 million tonnes (7.5%) other miscellaneous purposes (FAO, 2005) LIMITED STOCKS - flat AQUACULTURE CAPTURE - REDUCTION CAPTURE - FOOD
33 Major fish species currently used for fishmeal and/or fish oil production Species Reported production in 2003 Peruvian anchovy 6,202,447 tonnes Blue whiting 2,385,007 Japanese anchovy 2,088,744 Atlantic herring 1,958,795 Chub mackerel 1,851,753 Chilean jack mackerel 1,735,625 Capelin 1,148,106 European pilchard 1,049,344 Californian pilchard 691,625 European sprat 631,823 Gulf menhaden 522,195 Sandeels 341,512 Atlantic horse mackerel 214,889 Norway pout 37,833
34 Fishmeal and Fish Oil production by Region in 2003 (FAO, 2005) FISHMEAL Production % FISH OIL Production % S. America 2,083, S. America 351, Asia 1,693, Europe 338, Europe 1,054, N. America 112, N. Amercia 422, Asia 98, Africa 223, Africa 21, Oceania 42, Oceania 2, Total 5,520, Total 924, (% of total global production)
35 World fishmeal production by major country producers (values expressed in thousand tonnes, dry as-fed basis; FAO, 2005) Thousand tonnes PERU CHILE CHINA JAPAN THAILAND DENMARK USA NORWAY ICELAND OTHERS
36 World fish oil production by major country producers Thousand tonnes (values expressed in thousand tonnes, dry as-fed basis; FAO, 2005) PERU CHILE USA DENMARK ICELAND NORWAY JAPAN CHINA SPAIN OTHERS
37 Reported total world fishmeal production in 2003 (FAO, 2005) Fishmeal from pelagic fish (thousand tonnes, dry, as-fed basis) Oily-fish meal (nei) 4,152 Jack mackerel meal 227 Anchoveta meal 211 Menhaden meal 175 Mackerel meal 123 Capelin meal 112 Pilchard meal 60 Tuna meal 55 Herring meal 20 Clupeoid fish meal (nei) 9 Fishmeal from demersal fish White-fish meal (nei) 199 Blue whiting meal 21 Other marine meals Fish meal (unspec) 111 Fish solubles 38
38 Reported total world fish oil production in 2003 (FAO, 2005) Pelagic body oils (thousand tonnes, dry, as-fed basis) - Anchoveta oil Capelin oil Menhaden oil 89 - Herring oil 7 Cod liver oil 3 Other fish liver oils 31 Other marine oils -Fish body oils (nei) 474 Total fish oil production 924,426 tonnes
39 Global fish meal and fish oil production by major species groups in 2003 (values expressed in million metric tons, as-fed basis; FAO, 2005) SPECIES SPECIFIC FISH MEALS 1.00 million tonnes SPECIES SPECIFIC FISH OILS million tonnes 18.2% 45% 81.8% 55% NON-SPECIES SPECIFIC FISH MEALS 4.52 million tonnes NON-SPECIES SPECIFIC FISH OILS million tonnes Total reported fish meal and fish oil production in 2003 was 5,520,270 tonnes and 924,426 tonnes respectively
40 Fishmeal and Fish Oil production by Region in 2003 (FAO, 2005) FISHMEAL Production % FISH OIL Production % S. America 2,083, S. America 351, Asia 1,693, Europe 338, Europe 1,054, N. America 112, N. Amercia 422, Asia 98, Africa 223, Africa 21, Oceania 42, Oceania 2, Total 5,520, Total 924, (% of total regional production reported as non-species specific)
41 World production of fishmeal & fish oil (metric tonnes; Shepherd, 2005) Fishmeal (est) Fish Oil in million MT Fish oil (est)
42
43 Landings of feed grade fish from IFFO-5 countries (Shepherd, 2005) IffO-5 Annual Landings (in thousand MT of fish) Chile Peru Denmark Iceland Norway Average 89/04: 15,
44 Reported capture fisheries landings of small pelagic fish destined for reduction into fish meal and fish oil (FAO, 2005) Million tonnes 30 The two main fish families destined for reduction into fish meal and fish oil are the Family Engraulidae (anchovies) and the Family Clupeidae (herring, sardines, pilchard, menhaden) ENGRAULIDAE CLUPEIDAE TOTAL
45 6 5 Marine Aquaculture Task Force Meeting Jan 19-21, 2006 Reported capture fisheries landings of Chilean jack mackerel & Chub mackerel Chub mackerel Chilean jack mackerel
46 3 2.5 Marine Aquaculture Task Force Meeting Jan 19-21, 2006 Reported capture fisheries landings of Capelin & Atlantic herring Capelin Atlantic herring
47 14 12 Marine Aquaculture Task Force Meeting Jan 19-21, 2006 Reported capture fisheries landings of Peruvian & Japanese Anchovy Peruvian anchovy Japanese anchovy
48 2.5 2 Marine Aquaculture Task Force Meeting Jan 19-21, 2006 Reported capture fisheries landings of Blue whiting & Sandeels BLUE WHITING SANDEELS
49 1.2 1 Marine Aquaculture Task Force Meeting Jan 19-21, 2006 Reported capture fisheries landings of Gulf menhaden & Californian pilchard GULF MENHADEN CALIFORNIAN PILCHARD
50 Marine Aquaculture Task Force Meeting Jan 19-21, 2006 Reported capture fisheries landings of European pilchard & European sprat EUROPEAN PILCHARD EUROPEAN SPRAT
51 Marine Aquaculture Task Force Meeting Jan 19-21, 2006 Reported capture fisheries landings of Atlantic horse mackerel & Norway pout ATLANTIC HORSE MACKEREL NORWAY POUT
52 Status Marine of these Aquaculture reduction Task fisheries: Force Meeting If these fisheries Jan are 19-21, seen 2006 as sustainable Question/s: Status what of criteria these reduction are used fisheries - If these fisheries are seen as sustainable what criteria are used FAO (1999). Indicators for sustainable development of marine capture fisheries. FAO. (2005). Review of the state of world marine fishery resources. FAO, Rome. FIN (2005). Fin Dossier 2005 Annual review of the feed grade fish stocks used to produce fishmeal and fish oil in the UK market Huntington, T.C. (2004a). Feeding the fish: sustainable fish feed and Scottish aquaculture. Report to the Joint Marine Programme (Scottish Wildlife Trust and WWF Scotland) and RSPB Scotland. Huntington, T., C. Frid, R. Banks, C. Scott & O. Paramor. (2004). Assessment of the sustainability of industrial fisheries producing fish meal & fish oil. Report to RSBP Lankester, K. (2005). Sustainability in the anchoveta fisheries in Peru (in press) Royal Commission on Environmental Pollution (2004). Turning the tide: addressing the impact of fisheries on the marine environment. SEAFEEDS (2003). Sustainable Environmental Aquaculture Feeds, Final report of the Seafeeds Workshop. University of Stirling Tuominen, T-R. & M. Esmark. (2003). Food for thought: the use of marine resources in fish feed. WWF-Norway. University of Newcastle/Poseidon Aquatic Resource Management Ltd (2004). The fishmeal & fish oil industry: its role in the common fisheries policy. EU Report.
53 Question/s: Status of reduction fisheries (FAO, 2005) U-underexploited, M-moderately exploited, F-fully exploited, O-overexploited, D-depleted, R-recovering Northwest Atlantic (FAO Statistical Area 21): Atlantic herring Atlantic menhaden Atlantic mackerel Capelin Northeast Atlantic (FAO Atlantic salmon Blue whiting Norway pout Sandeels Atlantic herring European pilchard European sprat Atlantic horse mackerel Atlantic mackerel Capelin Canada,, USA U-F-R USA Canada,, USA F Canada (FAO Statistical Area 27):. Norway, Finland, Denmark, Sweden Norway, Russian Fed., Iceland, Faeroe Denmark, Norway Denmark, Norway, Sweden Norway, Iceland, Russian Portugal, Spain Denmark, Poland F F F-D O?-F Russian Fed., Denmark F Spain, France,, UK?-F Poland, Sweden,, Latvia?-F F Netherlands, Norway, Ireland, France UK, Norway, Ireland, Russian Fed. Iceland, Norway, Russian Fed. F F F
54 U-underexploited, M-moderately exploited, F-fully exploited, O-overexploited, D-depleted, R-recovering Western Central Atlantic (FAO Statistical Area 31): Atlantic menhaden USA F Atlantic thread mackerel USA, Cuba? Gulf menhaden USA F Round sardinella Northwest Pacific Chum salmon Pink salmon Japanese anchovy Japanese pilchard Pacific herring Chub mackerel Pacific (FAO Venezuela. (FAO Statistical Area 61): Japan, Russian Fed. Russian Fed., Japan China, Japan, Korea Rep. China, Japan Russian Fed., China China, Japan, Korea Rep. Japanese jack mackerel Japan, Korea Rep. M/F F F F M F F
55 U-underexploited, M-moderately exploited, F-fully exploited, O-overexploited, D-depleted, R-recovering Northeast Pacific (FAO Statistical Area 67): Chinook salmon Chum salmon Coho salmon Pink salmon Sockeye salmon Alaska pollock Pacific herring Eastern Central Pacific California pilchard California anchovy Pacific anchoveta Pacific thread herring Chub mackerel Pacific jack mackerel USA, Canada USA, Canada USA USA, Canada USA, Canada USA USA, Canada F-O F F-O F F F M-O Pacific (FAO Statistical Area 77): Mexico,, USA M-F USA, Mexico Panama Panama. Mexico,, USA M USA U M-F M-F M-F
56 U-underexploited, M-moderately exploited, F-fully exploited, O-overexploited, D-depleted, R-recovering Southeast Pacific (FAO Statistical Area 87): Anchoveta Peru,, Chile R-O Araucanian herring Chile F-O Pacific thread herring Ecuador F South American pilchard Chile, Peru,, Ecuador F-O Chilean jack mackerel Chile, Peru F-O Chub mackerel Chile, Peru M-F
57 Question/s: Status of reduction fisheries: - If these fisheries are seen as sustainable what criteria are used - Evidence of ecosystem damage/stress from these fisheries Depends upon definition of sustainability and criteria employed, and who is evaluating the fishery: government, FAO, ICES, NGO (MSC), Industry etc. For example, according to the report of. University of Newcastle/Poseidon Aquatic Resource Management Ltd (2004). The fishmeal & fish oil industry: its role in the common fisheries policy: Management and sustainability of the industrial fisheries `In EU waters most of the targeted feed fish stocks, for which data are available, are considered to be within safe biological limits
58 Question/s: Status of reduction fisheries: - If these fisheries are seen as sustainable what criteria are used - Evidence of ecosystem damage/stress from these fisheries Different views: Huntington, Frid, Banks, Scott & Paramor (2004) Assessment of the Sustainability of Industrial Fisheries Producing Fish Meal and Fish Oil executive summary: `most feed fisheries. are in reasonable condition when considered from the traditional single stock perspective. However there is still only a weak understanding of the relationship between these fisheries and the wider ecosystem, both in terms of 1) their impact on non-target species and the trophic interactions resulting from fishing mortality and 2) the relative importance of climate/oceanography in determining population dynamics
59 Question/s: Status of reduction fisheries: - If these fisheries are seen as sustainable what criteria are used - Evidence of ecosystem damage/stress from these fisheries Different views: Huntington (2004) Feeding of Fish: Sustainable Fish Feed and Scottish Aquaculture synthesis: using a modified MSC-based principles and criteria for sustainable fishing, sustainability. assessment undertaken `preliminary analysis demonstrates that the sustainability of feed fish stocks is still far from certain..concerning the Peruvian anchovy `it is therefore impossible to conclude whether this fishery is sustainable or not
60 Is theremarine sufficient Aquaculture research Task onforce the sustainability Meeting of Jan reduction 19-21, 2006 fisheries to certify Issue: them? Feeds & Nutrition Aquafeeds & Reduction Fisheries As mentioned previously, this depends upon the definition of sustainability employed and criteria and indicators used. As mentioned in the SEAFEEDS (2003) report concerning the sustainability of feed grade fisheries: `There is a lack of agreed criteria and integrated reporting systems for the broader dimensions of sustainability relating to effects. on other fisheries and wider ecosystem and socio-economic impacts... we currently lack the information to make broader assessments of sustainability taking account of wider socio-economic and ecosystem impacts There is an urgent need to develop appropriate internationally agreed sustainability standards and criteria for feed-based fisheries at present these exist for `Sustainable Fishing (MSC) and `Indicators for Sustainable Development of Marine Capture Fisheries (FAO, 1999).
61 Question/s: Potential for use of fishery byproducts for minimizing demand on reduction fisheries - Are the `by-product product fisheries sustainable and does focusing more pressure on them create incentives for more bycatch, or pressure on the sustainability of the target fisheries? Industry estimates that there were 5.6 million tonnes of trimmings and rejects from food fish in 2002 (FIN, 2004).. For example, within the European Union (EU) it is estimated that in 2002 about 33% of the fishmeal produced in the EU-15 was manufactured from trimmings from food fish processing, including Spain 100% trimmings, France 100%, Germany 100%, Italy 100%, UK 84%, Ireland 60%, Sweden 25%, and Denmark 10% (Huntington et al. 2004). As mentioned previously, no information is currently available from FAO concerning the total global production of fishmeals and oils produced from fishery and aquaculture trimmings and offal. Clearly this deficiency needs to be rectified.
62 Marine Aquaculture ALASKA FISHERIES Task Force BYPRODUCT Meeting UTILIZATION Jan 19-21, 2006 EXISTING FISHERY RESOURCES & WASTE STREAMS SEAFOOD PROCESSING IMPROVED FISHERY RESOURCE USE & PRODUCT DEVELOPMENT FERTILIZER/CONDITIONER SALMON FISHERY PROCESSING ON-SHORE PHYSICAL & CHEMICAL EVALUATION ENERGY SOURCE FISHERY BYCATCH FACTORY TRAWLERS INPUTS DEVELOPMENT OF NEW & IMPROVED FISH PROCESSING TECHNOLOGIES OUTPUTS FEED ADDITIVES FEED INGREDIENTS COD FISHERY POLLOCK FISHERY PROCESSING AT-SEA BIOLOGICAL & ECONOMIC EVALUATION CO- PRODUCTS ANIMAL FEEDS EXISTING AMERICAN FISHERIES ACT & ALASKAN FISHERY MANAGEMENT PLAN INCREASED ECONOMIC OPPORTUNITIES & REDUCED ENVIRONMENTAL IMPACTS

63 Utilization of marine by-products (Rubin, 1998) SEALAB SUSTA INA BLE ECOLOGICA L AQUA CULTURE LA BORA TORY
64 Question/s: Potential for use of fishery byproducts for minimizing demand on reduction fisheries - Are the `by-product product fisheries sustainable and does focusing more pressure on them create incentives for more bycatch, or pressure on the sustainability of the target fisheries? Report: SCAHAW (2003): The use of fish by-products in aquaculture. Report of the Scientific Committee on Animal Health & Animal Welfare; Adopted 26 February 2003 In most European countries the fishmeal Industry is the major receiver of by-products from traditional fisheries, followed in importance by the ensiling of by-products.. With regard to aquaculture, by-products also arise from the slaughter and processing of fish for human consumption, including farmed salmon.
65 Question/s: Potential for use of fishery byproducts for minimizing demand on reduction fisheries - Are the `by-product product fisheries sustainable and does focusing more pressure on them create incentives for more bycatch, or pressure on the sustainability of the target fisheries? As stated previously, there is a need for the aquafeed industry to utilize the largely untapped existing waste streams within the fisheries sector, including fisheries bycatch and discards (Alverson et al. 1994:. recently estimated at over 7 million tonnes) and fishery processing wastes (Bechtel, 2003; Li et al. 2004; Rathbone et al. 2001); Moreover, as stated in the FAO Code of Conducted for Responsible Fisheries (FAO, 1995) `States should encourage the use of fish for human consumption and promote consumption of fish whenever appropriate, and discourage the use of food-fish fit for human consumption for animal feeding;
66 Question/s: Potential for use of fishery byproducts for minimizing demand on reduction fisheries - Are the `by-product product fisheries sustainable and does focusing more pressure on them create incentives for more bycatch, or pressure on the sustainability of the target fisheries? There is no simple answer to the above question: Fristly, we do not have a full grasp on. the exact size of the by-product fisheries and sustainability of these food fishing operations; Secondly, feed manufacturers require consistency in the quality of their feed ingredient sources, and the quality and freshness of fishery byproducts can be highly variable depending upon fishing/processing method employed, season, target species composition and nature of the product (heads, guts, skin, frames, spoiled fish etc.) processed.
67 Marine Aquaculture Task Force Meeting i Jan 19-21, 2006 m ALASKA: ESTIMATED FISH-BYPRODUCTS PRODUCED IN 2005 Peter Bechtel (Jan 17, 2006: pers comm.) i Alaskan Pollock Total Harvest Total By-Product Heads Viscera Frames Skin t a t e d F s h B y - P r o d u c t s. P r o d u c e d % of Fish Total MT I n 2
68 Marine Aquaculture Task Force Meeting i Jan 19-21, 2006 m ALASKA: ESTIMATED FISH-BYPRODUCTS PRODUCED IN 2005 Peter Bechtel (Jan 17, 2006: pers comm.) i Salmon Total Harvest Total By-Product Heads Viscera Pacific Cod Total Harvest Total By-Product Heads Viscera Frames Skin t a t e d F s h B y - P r o d u c t s. P r o d u c e d I n
69 Marine Aquaculture Task Force Meeting i Jan 19-21, 2006 m ALASKA: ESTIMATED FISH-BYPRODUCTS PRODUCED IN 2005 Peter Bechtel (Jan 17, 2006: pers comm.) i Flat Fish Total Harvest Total By-Product Heads Viscera Frames Skin Atka Mackeral Total Harvest Total By-Product Heads Viscera t a t e d F s h B y - P r o d u c t s. P r o d u c e d I n
70 Marine Aquaculture Task Force Meeting i Jan 19-21, 2006 m ALASKA: ESTIMATED FISH-BYPRODUCTS e PRODUCED IN 2005 Peter Bechtel (Jan 17, 2006: pers comm.) Perch Total Harvest Total By-Product Heads Viscera Sable Fish Total Harvest Total By-Product Heads Viscera Yellowfin Sole Total Harvest Total By-Product Heads t a t d F i s h B y - P r o d u c t s. P r o d u c e d I n Viscera
71 Marine Aquaculture Task Force Meeting i Jan 19-21, 2006 m t Issue: Feeds & Nutrition Aquafeeds i & Reduction Fisheries ALASKA: ESTIMATED FISH-BYPRODUCTS e PRODUCED IN 2005 F d Peter Bechtel (Jan 17, 2006: pers comm.) i Others Total Harvest Halibut Total By-Product Heads Viscera Pacific Herring Total Harvest Total Harvest Total By-Product Heads Viscera t a t e d s h B y - P r o d. u c t s P r o d u c e d I n 2 s m a t F i s h B y - P r o d u c t s P r o d u c e d I n
72 Marine Aquaculture Task Force Meeting i Jan 19-21, 2006 m ALASKA: ESTIMATED FISH-BYPRODUCTS PRODUCED IN 2005 Peter Bechtel (Jan 17, 2006: pers comm.) i Rock Fish Total Harvest Total By-Product Heads Viscera t a t e d F s h B y - P r o d u c t s Total Harvest Total By-Product Total Heads Total Viscera Total Frames Total Skin P r o d u c e d I n
73 Marine Aquaculture Task Force Meeting i ALASKA: ESTIMATED FISH-BYPRODUCTS Jan 19-21, 2006 m PRODUCED IN 2005 Issue: Feeds & Nutrition Aquafeeds a & Reduction Fisheries Peter Bechtel (Jan 17, 2006: pers comm.) Shore Side Plants Bering Aleutian Area *Gulf of Alaska Area Motherships Total Catcher-Processors Bering Aleutian Area Bering Aleutiuan Area Totals t t e d 2000 Meal MT F i s h B y - P r o. d u c t s P r o d u c e d I n Oil MT Meal Oil

 t i m a t e d F i s h B y - P r o d u")
74 . ALASKA: ESTIMATED FISH-BYPRODUCTS PRODUCED IN 2005 Peter Bechtel (Jan 17, 2006: pers comm.) t i m a t e d F i s h B y - P r o d u c t s P r o d u c e d I n 2
75 Status of fisheries & ecosystem impacts from fishmeal and oil use -Key questions that have yet to be resolved Need to develop internationally agreed standards, principles and criteria for sustainable feed-based fisheries. In line with the FAO Code of Conduct for Responsible Fisheries, the special needs of Developing Countries need to be taken into consideration when developing these standards and criteria; On the basis of the above agreed standards, principles and criteria for FAO/MSC or appropriate NGO to then ascertain the sustainability of the major reduction fisheries; Need to estimate total global production of fishmeal and fish oil from fishery by-products and trimmings, including species composition; Need to develop models concerning energy consumption within the different major reduction fisheries, including fishing, meal/oil manufacture
76 Question: : Status of the development and use of dietary fishmeal and oil substitutes for marine species Like humans, fish have a specific dietary requirement for 40 or so essential dietary nutrients and do not have a specific dietary requirement for a particular ingredient such as fishmeal or fish oil. For example, in their natural environment, the diet of salmonids consists of a mixture of crustaceans, molluscs and to a lesser extent fish; Not withstanding the above, fishmeal and fish oil has a nutritional profile which approximates closest to the known dietary requirements of fish, and as such usually has a high biological value and digestibility for farmed fish if prepared from fresh fish and processed adequately
77 Question: : Status of the development and use of dietary fishmeal and oil substitutes for marine species Current issues and obstacles to FM/FO usage are mainly ECONOMIC and MARKET DRIVEN: - Limited fish stocks & increasing fishing controls (biological limit) - Increasing proportion used for direct human consumption - Increasing competition for finite static resource - Increasing fishmeal & fish oil prices - Decreasing farmed fish prices due to increased production - Increasing farm production costs & overseas competition - Increasing demand by consumers for cleaner & greener foodstuffs
78 Constraints to using fishmeal and fish oil within aquafeeds: Mainly economic & market driven: - Limited fish stocks & increasing fishing controls (biological limit) - Increasing proportion used for direct human consumption - Increasing competition for finite static resource - Increasing fishmeal & fish oil prices - Decreasing farmed fish prices due to increased production - Increasing farm production costs & overseas competition - Increasing demand by consumers Solution: ON-GOING FOR ALL FEED MANUFACTURERS - Reduction of levels of usage on purely economic grounds - Increased use of alternative dietary proteins & lipids - Development of Improved feed & food safety controls - Development of greener feeds & farming systems
79 Current dietary fishmeal and fish oil dietary inclusion levels (%) within major producing countries Industry average: Fishmeal 35%, Fish oil 25% (2003) Current levels from the present study (2005): Canada Chile Norway UK Fishmeal 20 25% 30 35% 30 35% 35-40% Fish oil 15 20% 25 30% 25 30% 27 32% Differences used dependent upon economics & market forces within major producing and importing countries: Canada & UK case example
80 Status of on-going reduction of dietary fish meal & fish oil levels within salmon feeds by major producer Current levels of possible replacement from the present study (2005): Chile Canada Norway UK Marine protein replacement 60% 55% 55% 40% Marine lipid replacement 20% 50% 50% 0% Major fishmeal and fish oil replacers currently used: Chile: soybean meal, soy oil, rapeseed oil, maize gluten meal, canola, lupin, feather meal, poultry byproduct meal, crystalline amino acids Canada: canola, pea meal, soybean meal, rapeseed oil, maize gluten meal, feather meal, poultry byproduct meal, crystalline amino acids Norway: soybean protein concentrate, soybean meal, corn gluten meal, wheat gluten, rapeseed oil, crystalline amino acids UK: maize gluten, soya products (mostly extracted), wheat gluten, and crystalline amino acids role of major retailors/sqs
81 FOOD PROCESSING WASTES WHICH COULD BE RECYCLED AS FEED INPUTS Seafood/fishery byproducts: meals & oils produced from seafood/fishery processing waste and bycatch, including seaweeds Animal/rendered products: meat meal, meat & bone meal, feather meal, poultry by-product meal, blood meal, fats & tallows Brewing/fermentation products: extracted dried yeast, brewers grains, distillers solubles, SCP, glucans, nucleotides, carotenoids Flour/milling products: flour, middlings, mill run, bran, gluten Plant oilseeds/pulses: oilseed meals, oils, protein concentrates Agricultural wastes/products: fruit, pulp, cannery, hays, straws, fresh leaves, tubers, roots, kitchen scraps, starches, binders Others: invertebrates terrestrial & marine worms
82 Of the different sources of animal proteins and fats available for use within compound aquafeeds by the largest in terms of volumes available are the terrestrial animal by-product meals, including: Fats - industrial tallows, edible beef tallow, lard, yellow grease, feed grade fats; Animal protein meals - meat and bone meal, meat meal, hydrolyzed feather meal, poultry by-product meal, blood meal, and specialised protein blends; and Other miscellaneous products, including specific organ meals, such as liver meal and lung meals, chick hatchery waste, bone meal, hide fleshing meals, and blood/rumen contents meals.
 within major producing")
83 Current dietary fishmeal and fish oil dietary inclusion levels (%) within major producing countries
 within major producing")
84 Current dietary fishmeal and fish oil dietary inclusion levels (%) within major producing countries
 within major producing")
85 Current dietary fishmeal and fish oil dietary inclusion levels (%) within major producing countries
 within major producing")
86 Current dietary fishmeal and fish oil dietary inclusion levels (%) within major producing countries
 within major producing")
87 Current dietary fishmeal and fish oil dietary inclusion levels (%) within major producing countries

88 Question/s: Status of feed efficiency Calculate fm/fo fo conversion efficiency for different countries canada best also is already doing what is forecast for 2010

89 Question/s:

90 Question/s:
91 Question/s:

92

93 Status of feed efficiency Calculate fm/fo fo conversion efficiency for different countries canada best also is already doing what is forecast for 2010

94 Status of feed efficiency Calculate fm/fo fo conversion efficiency for different countries canada best also is already doing what is forecast for 2010

95 Status of feed efficiency Calculate fm/fo fo conversion efficiency for different countries canada best also is already doing what is forecast for 2010

96 Status of feed efficiency Calculate fm/fo fo conversion efficiency for different countries canada best also is already doing what is forecast for 2010

97 Status of feed efficiency Calculate fm/fo fo conversion efficiency for different countries canada best also is already doing what is forecast for 2010

98 Status of feed efficiency Calculate fm/fo fo conversion efficiency for different countries canada best also is already doing what is forecast for 2010
99 Animal by-product meals (ca million tonnes/annum, dry basis) exceed that of fishmeal and fish oils (6-8 million tonnes/annum, dry basis) by a factor of two to three and represent the largest source of animal proteins and lipids currently available in the market place for animal feed industry, including the salmon aquafeed sector. Action required: - Consumer education regarding the safety of using adequately processed rendered animal products within aquafeeds, including salmon feeds. - Change of EU legislation allowing the use of rendered protein and lipid sources within aquafeeds - The increased use of rendered products within aquafeeds is typified by the lower levels of fishmeal currently used in salmon feeds in Canada - Aquaculture, and in particular MARINE FISH FISHING, should be viewed as the recycler of feed-grade rendered animal by-products into
100 Question/s: Status of feed efficiency: Trends in efficiency of feed use Calculated salmon economic FCR Period > 2.0 Period Period Period Period Current Current range: depending upon feed, farmer & country
101 T Trends in feed efficiency Economic FCR Estimated Economic FCR for farmed aquaculture species (Tacon, 2005) Harvest body weight Time Salmon kg? Trout 1.3 < 1 kg Catfish 1.6 < 500 g Marine shrimp 1.9 <15-25 g Tilapia 2.0 < 750 g Milkfish 2.0 < 1 kg Marine fish 2.0 < 1 kg Feeding carp 2.0 < 1 kg Marine eels 2.0 < 500 g Fw. Crustaceans 2.3 < 50 g
102 FEED FORMULATION & NUTRIENT CONTENT AQUATIC ENVIRONMENT & NATURAL FOOD AVAILABILITY Main factors affecting the nutritional and economic success or not of a dietary feeding strategy FEED MANUFACTURE & PHYSICAL PROPERTIES ON-FARM FEEDING REGIME FEED TRANSPORT & STROAGE Importance of on-farm feed & water management


103 /s: Status of feed efficiency trends in efficiency of feed use Question/s:
104 Question/s: Public health issues related to feed -Which are the most important contaminants from public health viewpoint Concerns raised about the contamination of fish oils & fishmeals with: Persistent Organic Pollutants (POPs) - (Poly Chlorinated Dibenzo-p-Dioxins (PCDD) & Dibenzo Furans (PCDF) [Dioxins & Furans] - Poly Chlorinated Biphenyls (PCB s) - Dioxin-like PCBs - Poly Brominated Diphenyl Ether (BDE, brominated flame retardants) - Chlorinated pesticides (DDT, Toxaphene, Aldrin etc) Heavy metals & minerals - Mercury (Hg), Cadmium (Cd), Lead (Pb), Arsenic (As)

105 /s: Public health issues related to feed Question/s:

106 /s: Public health issues related to feed Question/s:


107 BFR of particular importance PBDEs plastics for electrical and electronic equipment (housings of computers, TV sets) textile back coating in furniture HBCD Expanded and Extruded Polystyrene for thermal insulation foams backcoating of textiles, mainly upholstery TBBPA Predominant Bfr in circuit boards ABS plastics

108 Tons per year Global anual Production of Brominated Flame Retardants Deca-BDE HBCD TBBPA Source: (> 2000)

109

110 Overview of concentration in fish oil ng/g, dioxin and dl-pcbs in ng TEQ/g Dioxin dioxin-like PCB Toxaphen PBDEs 7 Indicator PCB Herrmann et al.


111 Source: Robb, EWOS
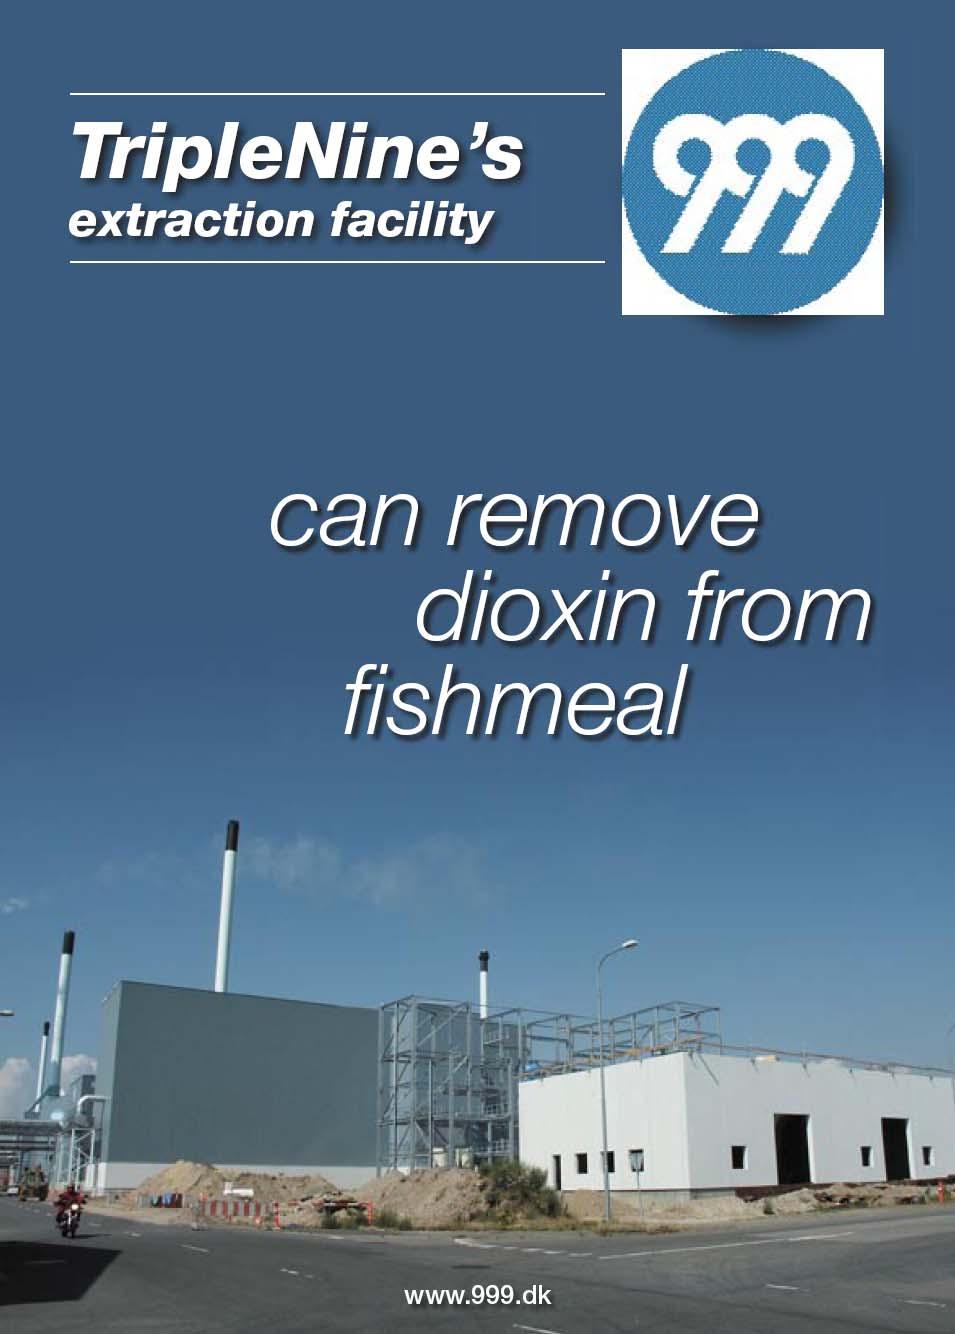
112 Question: Potential to strip contaminants Three main techniques to reduce POPs that are important for human health risk in fish, farmed on energy rich (oily) feeds a) Selection of marine feed materials with relatively low natural levels of dioxins b) Use of alternative non-marine feed materials with a natural lower level of dioxins c) Removal of undesirables from marine feed materials Berntssen, Hemre & Lie (2004)
113 C) Industrial decontamination of fish oil The use of industrial patented working fluid (ethylester fraction) increases the efficacy of short path distillation Contaminant PCB Organochloride pesticides, Dieldrin, DDT etc. Brominated flame retardants (28, 47, 66, 99, 100, 154) Toxaphenes (23, 50, 62) Dioxins Dioxin like PCB Reduction % 97% 99 % 99% 90% 91% 99 % Data provided by Pronova BioCare A.S. P.O. Box 2109, N-3202, Sandefjord, Norway

114 /s: Public health issues related to feed Question/s: -Potential to strip contaminants from a public health point of view Source: Halseth, NUTRECO


115
116 Summary-techniques for reducing POPs The selective use of marine oils with natural lower level of organic pollutants will reduce the level of dioxins in farmed fish, however, to a lesser extend the level of dioxin like PCB s and even less on PBDE. The use of vegetable oils will effectively reduce the level of all three mentioned organic pollutants, however, will also affect nutrients (n-3 HUFA) normally rich in marine fish. The use of cleaning techniques might be a promising approach in reducing the level of organic pollutants and maintaining the high nutritional value of seafood.
117 The substitution of marine feed ingredients with alternative ingredients might introduce new threats for food safety For GM, substitution of fish meal with plant meal had no apparent negative effect on fish health or forms a risk for the consumer In developing novel feeds for the production of a safe and healthy seafood a combination of both reduction of undesirables components and maintenance of health benefit nutrients has to be achieved.

118 Aquaculture unique opportunity to tailor products Nutrients Maximum health benefits Contaminants
119 Farmed Feed 0.6 to 7.9 ng/g Example Flame Retardants 1.0 to 4.5 ng/g Wild 0.5 to 1.1 ng/g Hotspots: Lake Michigan in USA 80ng/g Effect in humans? Herring 1 to 3.5 ng/g No maximum limit in EU yet Only a few species analysed Great variations within species Variations between locations Source: M. H.G. Berntssen, G.-I. Hemre and Ø. Lie, (2004)
120 /s: Public health issues related to feed Question/s: If known that some reduction fisheries are more contaminated than others? Has global mapping or research been done on this?


121 PCDD/Fs and related PCBs in Fishoil - global differences High in pg WHO-TEQ/g, lipid based 50 Mean Low Source: Scientific committee on animal nutrition, EU commission, C3, 2000
122 Comparison of dioxins in fish meal from northern and southern hemisphere 75 PCT ng WHO-TEQ/kg, 12 % moisture Median PCT Source: Ergo

123


124 /s: Public health issues related to feed Question/s:


125 /s: Public health issues related to feed Question/s:

126 /s: Public health issues related to feed Question/s: If known that some reduction fisheries are more contaminated than others? Has global mapping or research been done on this? Levels in Pacific fish stocks? Anchoveta? Need for global analysis

127


128
129 Key questions Question/s: that have yet Public to be health researched? issues related to feed - Assessment of environmental contaminant levels within the reduction fisheries stocks of the North, Central & South Pacific - Comparative global assessment of environmental contaminant levels within wild marine food fish stocks, including salmon, tuna, sword fish, cod, haddock - Publication of research findings on contaminant levels within fish stocks, including relevant feeding/spot-check analytical studies with farmed salmonids, within high profile peer reviewed non-aquaculture journals, including key medical and environmental science journals - Need to promote the nutritional health merits of farmed salmon (and seafood in general), not only as a source of omega-3 fatty acids, but also as a source of high quality animal protein and essential minerals and vitamins: we have a serious global food/obesity problem and have a solution in our hands

130 /s: Need to publish in aquaculture journal & non-aquaculture peer reviewed journals Question/s:
131 /s: Feed/feeding and ecosystem Question/s: Does feeding potentially contribute to additional contaminant loading around net cages? -Of course the answer is yes, and this may include additional contaminant loading from uneaten feed, fish faeces and excreta. -The potential impact (negative or positive) of these contaminants around the cages will depend upon the environmental carrying capacity of the coastal zone/area where the cages are geographically located and the water depth/water current under the cages. -Whilst in the past these contaminants have been considered in a negative sense, these so called contaminants are really `nutrients and as such could be harnessed for the co-culture of associated filter feeding species (ie. mussels) and aquatic plants (ie. seaweeds) rather than just released into the open sea.

132

133 /s: Feed/feeding and ecosystem Question/s:

134 /s: Feed/feeding and ecosystem Question/s:
135 Salmon Aquaculture Feed and the Environment Agriculture like Aquaculture,, has altered our global landscape for our food s sake SEALAB SUSTA INA BLE ECOLOGICA L AQUA CULTURE LA BORA TORY
136 /s: Feed/feeding and ecosystem Question/s: Key questions that have yet to be researched -Development of cost-effective satellite-assisted automated water quality monitoring techniques for measuring nutrient outputs from salmon farms, including benthos sediment inputs, and assessing the environmental impact of near-shore and off-shore salmon farming operations -Development of environmentally and ecologically sustainable multitrophic culture systems based on the co-culture of salmon, filter feeding molluscs, and seaweeds -Development of cost-effective bioremediation techniques for the exploitation and regeneration of sediments under salmon farms, including the possible culture of benthic invertebrates
137 There is no doubt that the third millennium will herald marked changes in ALL our global food production systems, including: Aquaculture
138 The over-riding riding reason for these changes is the stark realization (after years of environmental abuse) that our PLANET has it s LIMITS, both in terms of it s s available natural resources (land, water, energy, nutrients, biota), and through earth s ability and capacity to RECYCLE these resources and sustain LIFE as we currently know it.
139 Through the activities of our societies, food production sectors & industries we are now negatively impacting the land that we live on, the food that we eat, the water that we drink, the air that we breath, to the weather & climate of our planet and the well-being & health of ALL living things

140 The upshot of this is that AQUACULTURE, like all other food production systems, will have to become increasingly more ENVIRONMENTALLY & ECOLOGICALLY RESPONSIBLE if it is be truly sustainable in the long run and be socially accepted as an economically viable means of producing much needed high quality food for an ever increasing & hungry population
141 MALNUTRITION is still the number one killer & cause of suffering on earth; causing more deaths than HIV/AIDS, warfare, genocide, terrorism, or any other ailment
142 Every minute of every day, especially within developing countries, 23 children die of malnutrition and preventable diseases. Even when it doesn't kill, chronic malnutrition can cause blindness, birth deformities and brain damage. By the end of my 60 minute presentation 1,380 children will have died


143 It is estimated that about one-fifth of the world s s population is currently living in extreme economic poverty; ; defined as living on less than US$ 1 per day
144 The above tragedy is a particular travesty bearing in mind MALNUTRITION: the over-supply and imbalance of nutrients and consequent global epidemic of obesity which is occurring, especially within industrialized countries: resulting in decreased productivity and increased risk of heart disease, hypertension, stress, diabetes and certain cancers.
145 US MEAT & SEAFOOD CONSUMPTION Pound per head Beef Pork Chicken Turkey Total edible meats Eggs All dairy products Total seafood (2004) imports represent 80% of total consumption(16.2 in 1987) American Samoa 4.0 compared with for Western Samoa (USA 47.0 liveweight equivalents; FAO average)


146 OPPORTUNITIES.. Aquafeeds Marine Aquaculture Task Force Meeting Jan 19-21, Designer feeds: promoting the complete nutritional attributes of farmed fish & seafood in human nutrition and for optimum health & development NUTRITIONAL VALUE OF FISH & SEAFOOD - Need to combat the global epidemic of obesity, reduced dietary lipid levels.german case study with carps before & after unification NUTRITIONAL VALUE OF FISH & SEAFOOD Not just omega-3 fatty acids, Ca, P, Mg, Fe, Zn, I, F, Cr, Se, protein, vitamin A, D, etc


147 OPPORTUNITIES.. - Increased use of feed fish for direct human consumption rather than for reduction into fishmeal and oil: anchoveta, mackerel, squid, salmon oil, salmon heads & process residue freezing, canning, drying

, organic meals & oils")
 and/or from")
 Development of")
148 OPPORTUNITIES.. Fishmeal & Fish Oil - Organics natural binders (alternatives to synthetics), organic meals & oils prepared from certified stocks (sustainably managed) and/or from cultured species (fish, crustaceans, molluscs, polychaetes) Development of New Organic Culture Techniques for Native Hawaiian Seaweeds


149


150 OPPORTUNITIES.. Fishmeal & Fish Oil Marine Aquaculture Task Force Meeting Jan 19-21, Production of a new generation of marine proteins and lipids, including cultured micro & macro algae, marine polychaetes & shellfish. using nutrient effluents from fishmeal plants A. samoa?


151 OPPORTUNITIES.. Fishmeal & Fish Oil Marine Aquaculture Task Force Meeting Jan 19-21, Production of a new generation of marine proteins and lipids, including cultured micro & macro algae, marine polychaetes & shellfish SEAWEED: Ogo, Limu


152 OPPORTUNITIES.. Fishmeal & Fish Oil Marine Aquaculture Task Force Meeting Jan 19-21, Production of a new generation of marine proteins and lipids, including cultured micro & macro algae, marine polychaetes & shellfish
153 OPPORTUNITIES.. Aquafeeds - Coldwater marine finfish species hold greatest potential of all, with less than 1% of the oceans in the world being above 19 o C - Landings of Atlantic cod have steadily decreased due to over-fishing from 3,939,642 tonnes in 1968 to 851,319 tonnes in Marine cod aquaculture would be viewed as a champion by placing cod back on the table as a much needed low-fat marine white fish for mass consumption (in the first instance, primarily within developed country markets) - Atlantic cod production probably holds the greatest potential for increased global production of any marine fish species, possibly exceeding that of Atlantic salmon five to ten-fold.

154 OPPORTUNITIES.. Aquafeeds - ATLANTIC COD feeds and feeding technologies

155 OPPORTUNITIES.. Aquafeeds - Coldwater marine finfish species hold greatest potential of all, with less than 1% of the oceans in the world being above 19 o C - Landings of Atlantic cod have steadily decreased due to over-fishing from 3,939,642 tonnes in 1968 to 851,319 tonnes in Atlantic cod aquaculture would be viewed as a champion by placing cod back on the table as a much needed low-fat marine white fish for mass consumption (..little or no competition from Asian countries initially that is) - Atlantic cod production probably holds the greatest potential for increased global production of any marine fish species, possibly exceeding that of Atlantic salmon five to ten-fold.


156 OPPORTUNITIES.. Aquafeeds Marine Aquaculture Task Force Meeting Jan 19-21, Development of new zero-exchange freshwater and marine culture systems and low-cost feeds and feeding technologies


157 OPPORTUNITIES

158 system concept: A CULTURAL &NUTRITIONAL BLUE REVOLUTION

159


160
161 Weight gain (%) Survival (%) (%) Control Less Vitamins Less Minerals
162 (% ) CAM results Body weight gain (% of initial) Control MBM PBM Treatment
163 Constraints to using fishmeal and fish oil within aquafeeds: Mainly economic & market driven: - Limited fish stocks & increasing fishing controls (biological limit) - Increasing proportion used for direct human consumption - Increasing competition for finite static resource - Increasing fishmeal & fish oil prices - Decreasing farmed fish prices due to increased production - Increasing farm production costs & overseas competition - Increasing demand by consumers Solution: ON-GOING FOR ALL FEED MANUFACTURERS - Reduction of levels of usage on purely economic grounds - Increased use of alternative dietary proteins & lipids - Development of Improved feed & food safety controls - Development of greener feeds & farming systems
164 CONCLUSIONS - Current dependence of aquaculture feeds upon fishmeal and fish oil and the need to reduce this dependency for the long term sustainability of the aquaculture sector; - Absence of agreed standards and criteria for assessing the sustainability of reduction fisheries; - Current ability of the feed manufacturing sector to reduce from 50 to 75% of the fishmeal and fish oil content of marine/brackishwater aquaculture feeds with alternative more sustainable dietary protein and lipid sources; - Increasing awareness concerning the relative efficiencies of different terrestrial and aquatic food production systems, including modern aquaculture production systems, and the consequent need to undertake a comparative analysis of these farming systems in terms of edible food
165 CONCLUSIONS - Increasing awareness concerning the presence of environmental contaminants within the marine environment, including reduction fisheries and food fish, and the need to reduce these contaminant loads either through extraction/purification, increasing legislative controls, or through the use of alternative feedstuffs or dietary feeding strategies; - Increasing awareness concerning feed and food safety, and the urgent need to promote the true and complete nutritional value of both wild and farmed fish/seafood in the global fight against malnutrition, including under-nutrition within developing countries, and over-nutrition or obesity within developed countries; - Increasing recognition that as global farmed marine aquaculture production increases and grows into a major protein food-plate commodity, that greater efforts should be focused on market development and the promotion of the nutritional attributes of fish


166 Mahalo & Aloha
Compound Aqua feeds in a More Competitive Market: Alternative protein sources for a more sustainable future
 Compound Aqua feeds in a More Competitive Market: Alternative protein sources for a more sustainable future Abstract Albert G.J. Tacon Aquatic Farms Ltd 49-139 Kamehameha Hwy Kaneohe, Hawaii 96744 USA
Feeding fish to fish is this a responsible practice?
 Feeding fish to fish is this a responsible practice? Andrew Jackson Technical Director International Fishmeal & Fish Oil Organisation Humber Seafood Summit 15 July 2010 IFFO International Fishmeal and
Fishmeal Production ,000 tonnes
 Fishmeal and fish oil production and its role in sustainable aquaculture 1 Dr Andrew Jackson Technical Director International Fishmeal & Fish Oil Organisation February 2009 Refuting the myths: No 1 Fishmeal
Global fishmeal and fish oil supply - inputs, outputs, and markets
 Global fishmeal and fish oil supply - inputs, outputs, and markets C.J. Shepherd & A.J. Jackson 9 May 2012 Mass Balance of marine ingredients production 2010 Whole Fish 13,886 Total 18,515 By-Products
Historical developments and current issues in fish nutrition
 Historical developments and current issues in fish nutrition EAAP 2016 29 th of August, Johan Schrama & Sachi Kaushik Content presentation Historical development of aquaculture Trends in fish nutrition/fish
Different raw material for fishmeal and fish oil production Sources, regulations, quality criteria, and research needs
 Different raw material for fishmeal and fish oil production Sources, regulations, quality criteria, and research needs Charlotte Jacobsen & Gonçalo S. Marinho Research Group for Bioactives Analysis and
FISH IN - FISH OUT RATIOS EXPLAINED
 FISH IN - FISH OUT RATIOS EXPLAINED BY ANDREW JACKSON One of the long continued debates in aquaculture is the use of fishmeal and fish oil in feeds and the amount of wild fish it takes to produce farmed
The IFFO Global Standard for the Responsible Supply of fish oil
 The IFFO Global Standard for the Responsible Supply of fish oil Andrew Jackson Technical Director IFFO GOED First Annual Meeting Salt Lake City 13-14 January 2011 IFFO International Fishmeal and Fish Oil
OECD Workshop, Busan, June 2010
 Aquaculture Adaptation Strategies to Climate Change: An Industry Perspective Daniel Lee BAP Standards Coordinator Global Aquaculture Alliance OECD Workshop, Busan, June 2010 Outline Aquaculture Adaptation
THE STATE OF WORLD FISHERIES AND AQUACULTURE (SOFIA) 2010 Issued January 2011
 2010 Issued January 2011") 15 February 2011 THE STATE OF WORLD FISHERIES AND AQUACULTURE (SOFIA) 2010 Issued January 2011 Headline news Fish Consumption Reaches All-time High - The contribution of fish to global diets has reached
15 February 2011 THE STATE OF WORLD FISHERIES AND AQUACULTURE (SOFIA) 2010 Issued January 2011 Headline news Fish Consumption Reaches All-time High - The contribution of fish to global diets has reached
State of Small pelagic Fish resources and its implications for Food Security and Nutrition
 State of Small pelagic Fish resources and its implications for Food Security and Nutrition Manuel Barange, Stefania Vannuccini, Yimin Ye, Malcolm Beveridge Food and Agriculture Organization of the UN,
Status and futures in the fishmeal industry
 Status and futures in the fishmeal industry By Gunn Strandheim Irish Pelagic Seminar Killybegs, Ireland 11th of November - 211 Global fishmeal production Subject. Resource situation in the fishmeal industry
Is aquaculture growth putting pressure on feed fish stocks? And is the growth of aquaculture being restricted by finite supplies of fishmeal and fish?
 Is aquaculture growth putting pressure on feed fish stocks? And is the growth of aquaculture being restricted by finite supplies of fishmeal and fish? Key points 1. The supply of marine ingredients is
AQUACULTURE PROGRESS AQUACULTURE TODAY MILESTONE 1: MINIMIZING ENVIRONMENTAL IMPACTS. Facts:
 MILESTONE 1: MINIMIZING ENVIRONMENTAL IMPACTS Background: Like all other animals, as fish metabolize food they produce wastes soluble nitrogenous compounds and settable solids (feces). A priority has been
FISH 336 Introduction to Aquaculture
 FISH 336 Introduction to Aquaculture 1. Distance Delivered from Kodiak 2. Dr. Scott Smiley email: stsmiley@alaska.edu cell phone: (907) 942-0184 office hours by appointment FISH 336 Logistics Goals I My
Deakin University CRICOS Provider Code: 00113B
 0 10,000,000 20,000,000 30,000,000 40,000,000 50,000,000 60,000,000 70,000,000 80,000,000 90,000,000 100,000,000 1976 1977 1978 1979 1980 1981 1982 1983 1984 1985 1986 1987 1988 1989 1990 1991 1992 1993
Change, Challenges and Opportunities for Wild Fisheries
 Change, Challenges and Opportunities for Wild Fisheries Gunnar Knapp Professor of Economics University of Alaska Anchorage September 2002 This is a slightly modified version of a presentation which I gave
Fishmeal and fish oil figures
 October 2011 Fishmeal and fish oil figures CONTENTS 1. Fishmeal and fish oil summary 2. WORLD food and feed fisheries and aquaculture key figures 3. WORLD production, supply and consumption of fishmeal
FAO Global Capture Production database updated to 2015 Summary information Fisheries and Aquaculture Department
 FAO Global Capture Production database updated to Summary information Fisheries and Aquaculture Department Table 1. World capture production in and million million Inland capture 11.3 11.5 1.1% Marine
OVERVIEW OF FISH PRODUCTION, UTILIZATION, CONSUMPTION AND TRADE
 FISHERY INFORMATION, DATA AND STATISTICS UNIT OVERVIEW OF FISH PRODUCTION, UTILIZATION, CONSUMPTION AND TRADE BASED ON 21 DATA by STEFANIA VANNUCCINI Fishery Statistician (Commodities) FAO, Fishery Information,
Facts and figures on the CFP. Basic data on the Common Fisheries Policy
 Facts and figures on the CFP Basic data on the Common Fisheries Policy Edition 2004 Statistics were provided by Eurostat. A great deal of additional information on the European Union is available on the
Alaska s Strengths & Opportunities
 Alaska s Strengths & Opportunities 1. Wild Natural Product 2. Sound Fisheries Management 3. Omega 3 Fatty Acids 4. High Concentrations Vitamin D 5. Whitefish Strong but Tilapia Coming on 6. Wild Salmon
Ragnar Tveteras. University of Stavanger Norway
 Ragnar Tveteras University of Stavanger Norway Professor Ragnar Tveteras is a business economist at the University of Stavanger s Department for Industrial Economics, Risk Management and Planning. His
Facts and figures on the CFP BASIC DATA ON THE COMMON FISHERIES POLICY
 Facts and figures on the CFP BASIC DATA ON THE COMMON FISHERIES POLICY EDITION 2008 Statistics provided by Eurostat. Data on fleet, jobs and Community aid provided by the Directorate-General for Maritime
The Long-Term Economic and Ecologic Impact of Larger Sustainable Aquaculture
 The Long-Term Economic and Ecologic Impact of Larger Sustainable Aquaculture Alistair Lane - European Aquaculture Society Courtney Hough Federation of European Aquaculture Producers John Bostock University
SUSTAINABILITY CRITERIA FOR FISHERIES SUBSIDIES: THE LATIN AMERICAN CONTEXT
 SUSTAINABILITY CRITERIA FOR FISHERIES SUBSIDIES: THE LATIN AMERICAN CONTEXT 29-30 July 2009, Guayaquil, Ecuador The Sunken Billions Kieran Kelleher Fisheries Team Leader The World Bank The Economic Justification
Food Chain. Marine Food Webs and Fisheries
 Marine Food Webs and Fisheries http://archive.wri.org/image.cfm?id=2648&z=? OCN 201 Biology Lecture 10 Food Chain A series of different species of organisms at different trophic levels in an arrangement
FAO Global Capture Production database updated to 2012 Summary information
 FAO Global Capture Production database updated to 2012 Summary information Table 1. World capture production in 2011 and 2012 2011 2012 million million Inland capture 11.1 11.6 4.5% Marine capture (excluding
Aquaculture in Emerging Markets
 Aquaculture in Emerging Markets Dr. Arjen Roem Frankfurt - November 11th 2014 Trouw Nutrition Hifeed Outline Skretting global leader Aquaculture trends Emerging markets - Vietnam - Egypt - Nigeria Seafood
Aquaculture: With Special Reference to Developments in Asia.2 Aquaculture in Asia
 Network of Aquaculture Centres in Asia-Pacific Aquaculture: With Special Reference to Developments in Asia.2 Aquaculture in Asia Sena S. De Silva Network of Aquaculture Centers in Asia Pacific, Bangkok,
Mr Andrew Mallison. Director General, International Fishmeal and Fish Oil Organisation (IFFO) Fishmeal & fish oil trends and responsible sourcing
 Fishmeal & fish oil trends and responsible sourcing") Mr Andrew Mallison Director General, International Fishmeal and Fish Oil Organisation (IFFO) Fishmeal & fish oil trends and responsible sourcing Fishmeal and Fish Oil Market Trends Andrew Mallison Director
Mr Andrew Mallison Director General, International Fishmeal and Fish Oil Organisation (IFFO) Fishmeal & fish oil trends and responsible sourcing Fishmeal and Fish Oil Market Trends Andrew Mallison Director
Reflections and Current Processes: Whole Fish Utilization in the Tilapia Industry in Chinese Taipei
 APEC Seminar on Strengthening Public-Private Partnership to Reduce Food Losses in the Supply Chain of Fishery and Livestock, Sept. 27, 2015 Reflections and Current Processes: Whole Fish Utilization in
FISH TRADE AND CONSUMER TRENDS IN THE EU
 FISH TRADE AND CONSUMER TRENDS IN THE EU Ekaterina Tribilustova Eurofish International Organisation 12 th International Production and Scientific Conference on Aquaculture 24-25 November 216, Vukovar,
The sustainability of forage fisheries: the bond with the ShAD, status, problems, options
 The sustainability of forage fisheries: the bond with the ShAD, status, problems, options Pedro Sousa (FishSource Director), Jim Cannon (SFP CEO) Presented remotely to the Guayaquil October 9, 2008 Overview:
GERMANY IN THE WORLD AND IN THE EU (2015, source: FAO and Eurostat) FISHING FLEET (2015, source: JRC and Annual Economic Report)
 FISHING FLEET (2015, source: JRC and Annual Economic Report)") GERMANY IN THE WORLD AND IN THE EU (2015, source: FAO and Eurostat) Germany is the EU s 6th largest producer of fisheries and 10th largest of aquaculture products. (1000 tonnes) World EU-28 Germany % World
GERMANY IN THE WORLD AND IN THE EU (2015, source: FAO and Eurostat) Germany is the EU s 6th largest producer of fisheries and 10th largest of aquaculture products. (1000 tonnes) World EU-28 Germany % World
Aquaculture, Fisheries and the
 Aquaculture, Fisheries and the Environment Frank Asche NAAFE, 2011 The Economics of Conflict and Co-existence in an Increasingly Crowded Ocean" We like to think of fishing as traditional and romantic,
Why is Aquaculture and Aquatic Animal Health so Important?
 OIE Workshop for Aquatic Animal Focal Points Dubrovnik, Croatia 16-18 November 2010 Why is Aquaculture and Aquatic Animal Health so Important? Barry Hill President OIE Aquatic Animal Health Standards Commission
Salmon Market Analysis 2007
 Salmon Market Analysis 2007 April 2008 Systemizing the World of Aquaculture and Fisheries Industriveien 18, NO-6517 Kristiansund N Norway Tel.: +47 71 68 33 00 Fax: +47 71 68 33 01 E-mail: mail@kontali.no
Facts and figures on the CFP. Basic data on the Common Fisheries Policy
 E D I T I O N 2 0 0 6 Facts and figures on the CFP Basic data on the Common Fisheries Policy Statistics were provided by Eurostat. A great deal of additional information on the European Union is available
The Salmon Industry: Twenty-Five Predictions for the Future
 The Salmon Industry: Twenty-Five Predictions for the Future by Gunnar Knapp Professor of Economics Institute of Social and Economic Research University of Alaska Anchorage 3211 Providence Drive Anchorage,
Aquaculture growth potential in Azerbaijan
 Aquaculture growth potential in Azerbaijan Policy brief for FAO TCP/AZE/372/C2 Assessment of state-owned fish farms for sustainable development of the aquaculture sector in Azerbaijan (prepared by Junning
Feed Conversion Efficiency in the Salmon Industry
 Feed Conversion Efficiency in the Salmon Industry Rodrigo Infante Rodrigo Pizarro Steering Committee Salmon Dialogue November 2006 Vancouver / November 2006 Estimating FCE (fish to fish) How many fish
Human Impact in Aquatic Systems: Fish Catching vs. Fish Raising
 Human Impact in Aquatic Systems: Fish Catching vs. Fish Raising What are human impacts? Fish and aquatic invertebrates (clams, crabs, squid, etc.) currently supply 16% of world protein, higher in developing
NETHERLANDS IN THE WORLD AND IN THE EU (2015, source: FAO and Eurostat)
") Netherlands NETHERLANDS IN THE WORLD AND IN THE EU (2015, source: FAO and Eurostat) The Netherlands rank 5 th production. in the EU in terms of fisheries and 6 for farmed (1.000 tonnes) World EU-28 Netherlands
Netherlands NETHERLANDS IN THE WORLD AND IN THE EU (2015, source: FAO and Eurostat) The Netherlands rank 5 th production. in the EU in terms of fisheries and 6 for farmed (1.000 tonnes) World EU-28 Netherlands
Provide a brief introduction to the U.S. seafood industry
 Provide a brief introduction to the U.S. seafood industry Participants will gain a better understanding of the large variety of seafood products available. 3 Increase knowledge of the following: What is
STORM FORECASTS: The only independent source of animal health and animal agriculture historical market data and forecasts
 The only independent source of animal health and animal agriculture historical market data and forecasts June 2016 1 What is STORM FORECASTS? STORM FORECASTS is the only independent source of animal health
MALTA IN THE WORLD AND IN THE EU (2015, source: FAO and Eurostat) FISHING FLEET (2015, source: JRC and Annual Economic Report)
 FISHING FLEET (2015, source: JRC and Annual Economic Report)") MALTA IN THE WORLD AND IN THE EU (015, source: FAO and Eurostat) ranked low in the EU both for fisheries and for aquaculture production. (1000 tonnes) World EU- % World % EU- Catches 104.635 5.144 0,0%
MALTA IN THE WORLD AND IN THE EU (015, source: FAO and Eurostat) ranked low in the EU both for fisheries and for aquaculture production. (1000 tonnes) World EU- % World % EU- Catches 104.635 5.144 0,0%
BLUE GROWTH AQUACULTURE IN TURKEY: THE BEST MODEL FOR THE BLACKSEA REGION
 BLUE GROWTH AQUACULTURE IN TURKEY: THE BEST MODEL FOR THE BLACKSEA REGION Hayri DENİZ (Ph.D.) hayrideniz@hotmail.com Muğla Fish Farmers Association & KILIÇ Seafood Company International Conference on Fisheries
Key questions on aquaculture
 Aquaculture Common Issues Group Key questions on aquaculture General Page 1 Nutritional benefits from farmed fish and shellfish Page 4 Aquaculture in the UK Page 5 Legislation/controls/inputs Page 7 Salmon
Agricultural Trade Office The U.S. Embassy, Seoul
 Agricultural Trade Office The U.S. Embassy, Seoul www.atoseoul.com Data Source: Global Trade Atlas (www.gtis.com), CIF Value Basis, This presentation tracks Korea s imports of agricultural products on
We will be the global leader in providing innovative and sustainable nutritional solutions that best support the performance of fish and shrimp.
 We feed millions We will be the global leader in providing innovative and sustainable nutritional solutions that best support the performance of fish and shrimp. Nutritional solutions Active Nutrition
The State of the Ocean and the impact of subsidies. Daniel Pauly Sea Around Us project Fisheries Centre, UBC
 The State of the Ocean and the impact of subsidies Daniel Pauly Sea Around Us project Fisheries Centre, UBC World Trade Organization Geneva, September 30, 2010 Fisheries landings, despite (or because of
The Relationship of Freshwater Aquaculture Production to Renewable Freshwater Resources
 The Relationship of Freshwater Aquaculture Production to Renewable Freshwater Resources Claude E. Boyd Department of Fisheries and Allied Aquacultures Auburn University, Alabama USA Current and projected
Genetically modified salmon is fit for the table
 Genetically modified salmon is fit for the table GENETIC ENGINEERING September 22, 2010 By Yonathan Zohar, Special to CNN The debate over genetically engineered salmon should be put in the proper context:
POLAND IN THE WORLD AND IN THE EU (2015, source: FAO and Eurostat)
") POLAND IN THE WORLD AND IN THE EU (2015, source: FAO and Eurostat) Poland is the EU s 10th largest producer of fisheries and 9th largest of aquaculture products. (1.000 tonnes) World EU-28 Poland % World
POLAND IN THE WORLD AND IN THE EU (2015, source: FAO and Eurostat) Poland is the EU s 10th largest producer of fisheries and 9th largest of aquaculture products. (1.000 tonnes) World EU-28 Poland % World
Fishmeal / Fish Oil Use in Aquafeeds & The Evolving Nutritional Profile of Farmed Seafood
 Fishmeal / Fish Oil Use in Aquafeeds & The Evolving Nutritional Profile of Farmed Seafood n PRESENTER DR. GIOVANNI TURCHINI DEAKIN UNIVERSITY GLOBAL OUTLOOK FOR AQUACULTURE LEADERSHIP GUANGZHOU, CHINA
Opportunities and challenges for fishery by-products and by-catches to contribute to the supply of aquaculture feed ingredients.
 Opportunities and challenges for fishery by-products and by-catches to contribute to the supply of aquaculture feed ingredients. A study based on the British fishery-aquaculture continuum. Alban Caratis,
FRESHWATER VARIETIES Catfish TABLE 19 SALES OF CATFISH BY STATE, U.S., 2001 (%) TABLE 20 VOLUME OF FARM-RAISED CHANNEL CATFISH,
 TABLE 20 VOLUME OF FARM-RAISED CHANNEL CATFISH,") INTRODUCTION... XVIII OBJECTIVES AND GOALS OF STUDY... XVIII CONTRIBUTION OF THE STUDY AND FOR WHOM... XVIII STUDY SCOPE AND FORMAT... XVIII METHODOLOGY... XIX INFORMATION SOURCES... XX AUTHOR S CREDENTIALS...
INTRODUCTION... XVIII OBJECTIVES AND GOALS OF STUDY... XVIII CONTRIBUTION OF THE STUDY AND FOR WHOM... XVIII STUDY SCOPE AND FORMAT... XVIII METHODOLOGY... XIX INFORMATION SOURCES... XX AUTHOR S CREDENTIALS...
MOFAD Fisheries Commission The State of Fisheries in Ghana Science and Fisheries Management
 MOFAD The State of in Ghana Science and Management Najih Lazar Senior Advisor USAID/Sustainable Management Project (2015-2019) GOAL: To rebuild marine fisheries stocks and increase production through effective
Wild caught sustainable seafood
 Wild caught sustainable seafood Published November 2012 Responsible sourcing We are committed to the quality, integrity and long-term sustainability of the seafood we sell. Founded in 1880, initially trading
Environmental signals Fisheries. policy issue indicator assessment. fishing fleet. for cod stock in the North Sea
 54 Environmental signals 22 7. Fisheries policy issue indicator assessment reducing overcapacity of the European fishing fleet reducing overfishing implementing the recovery plan for cod stock in the North
Inside the United Kingdom Seafood Trade
 International Markets Bureau MARKET INDICATOR REPORT JULY 2012 Inside the United Kingdom Seafood Trade Inside the United Kingdom Seafood Trade TRADE SUMMARY The United Kingdom (U.K.) is the eighth-largest
World Market Overview of Fish Meal and Fish Oil
 Advances in Seafood Byproducts 11 Alaska Sea Grant College Program AK-SG-03-01, 2003 World Market Overview of Fish Meal and Fish Oil Stuart Barlow IFFO, St. Albans, Hertfordshire, U.K. Introduction IFFO
3. DYNAMICS OF GLOBAL CLIMATIC INDICES AND MAIN COMMERCIAL CATCHES
 11 3. DYNAMICS OF GLOBAL CLIMATIC INDICES AND MAIN COMMERCIAL CATCHES An important question is whether the main commercial stock production is affected by common factors, which also control the synchronous
4.3 Aquatic Food Production Systems
 4.3 Aquatic Food Production Systems Photo Taken in Bangladesh by Mrs. Page IB ESS Mrs. Page Significant Ideas Aquatic systems provide a source of food production. Unsustainable use of aquatic ecosystems
EXPECTATIONS FOR MARKETS AND TRADE
 EXPECTATIONS FOR MARKETS AND TRADE 2017 - INTERNATIONAL CONGRESS ON CLIMATE CHANGE AND FISHERIES (CONXEMAR-FAO) 2 October 2017 Stefania Vannuccini Stefania.Vannuccini@fao.org Increasing number of cronically
The Use of Fish Meal and Fish Oil in Aquaculture and Calculation of. the Fish-In-Fish-Out (FIFO) Ratio
 Ratio") De Piscium Farinae et Olei Utilisatione in Aquacultura et de Rationis FIFO Calculatione The Use of Fish Meal and Fish Oil in Aquaculture and Calculation of the Fish-In-Fish-Out (FIFO) Ratio An Overview
De Piscium Farinae et Olei Utilisatione in Aquacultura et de Rationis FIFO Calculatione The Use of Fish Meal and Fish Oil in Aquaculture and Calculation of the Fish-In-Fish-Out (FIFO) Ratio An Overview
Sustainable Seas - Marine Fisheries Fisheries and Fishing
 Sustainable Seas - Marine Fisheries Fisheries and Fishing Maximum Sustainable Yield and Fishery Management Mariculture Reading: Ch 9: 9.12 Ch 14: 14.7-14.9 Ch 17: 17.1, 17.17-17.21,17.25 Graphic: Chub
Agricultural Trade Office The U.S. Embassy, Seoul
 Agricultural Trade Office The U.S. Embassy, Seoul www.atoseoul.com Data Source: Global Trade Atlas (www.gtis.com), CIF Value Basis, This presentation tracks Korea s imports of agricultural products on
Wild caught sustainable seafood
 Wild caught sustainable seafood Version March 2017 Responsible sourcing We are committed to the quality, integrity and long-term sustainability of the seafood we sell. Founded in 1880, initially trading
CZECH REPUBLIC IN THE WORLD AND IN THE EU (2015, source: FAO and Eurostat)
") CZECH REPUBLIC IN THE WORLD AND IN THE EU (2015, source: FAO and Eurostat) The Czech Republic is a landlocked country with no marine fisheries, while it is the 11 th largest producer of aquaculture products.
CZECH REPUBLIC IN THE WORLD AND IN THE EU (2015, source: FAO and Eurostat) The Czech Republic is a landlocked country with no marine fisheries, while it is the 11 th largest producer of aquaculture products.
Aquaculture Sector in Libya. Abdallah Elmgawshi Aquaculture Department-Marin Biology Research Center (Tajura-Libya)
") Aquaculture Sector in Libya Abdallah Elmgawshi Aquaculture Department-Marin Biology Research Center (Tajura-Libya) Aquaculture in Libya General information Libya covers about 1,750,000 km 2 with a total
Aquaculture Sector in Libya Abdallah Elmgawshi Aquaculture Department-Marin Biology Research Center (Tajura-Libya) Aquaculture in Libya General information Libya covers about 1,750,000 km 2 with a total
Consumers perception of aquaculture products OECD Paris 16 April 2010
 Consumers perception of aquaculture products OECD Paris 16 April 2010 Aquaculture products: consumers perception SEAFOODplus EU-FP6 integrated project 2004-2008 CONSENSUS EU-FP6 coordination action 2006-2008
Commercial Net Pen Salmon Farming in Washington State
 Commercial Net Pen Salmon Farming in Washington State Icicle SeafoodsOverivew at a glance Icicle Seafoods Icicle is a leading harvester, producer and processor of diversified seafood products in North
NUTRITIONAL REQUIREMENTS OF STURGEON BROODSTOCKS Dr. Özgür ALTAN Aquaculture Expert FAO-Sub-Regional Office for Central Asia Tel:
 NUTRITIONAL REQUIREMENTS OF STURGEON BROODSTOCKS Dr. Özgür ALTAN Aquaculture Expert FAO-Sub-Regional Office for Central Asia Tel: +90.312. 307 95 36 Fax: +90.312. 327 17 05 E-mail: Ozgur.Altan@fao.org
PORTUGAL IN THE WORLD AND IN THE EU (2015, source: FAO and Eurostat)
") Portugal updated on 16-04-18 PORTUGAL IN THE WORLD AND IN THE EU (2015, source: FAO and Eurostat) Portugal ranks 11 th in the EU for fisheries production and has a lower ranking for aquaculture production.
Portugal updated on 16-04-18 PORTUGAL IN THE WORLD AND IN THE EU (2015, source: FAO and Eurostat) Portugal ranks 11 th in the EU for fisheries production and has a lower ranking for aquaculture production.
Fisheries and Aquaculture in Croatia
 Fisheries and Aquaculture in Croatia The World Trade Organization (WTO) and fisheries St. Petersburg, 29 31 October 2013 CROATIA Ministry of Agriculture Directorate of Fisheries Božena Vidović, bozena.vidovic@mps.hr
80:20 Pond Growth Performance of Hybrid Tilapia on Soybean Meal-Based Diets
 80:20 Pond Growth Performance of Hybrid Tilapia on Soybean Meal-Based Diets Results of 1997 ASA/China Feed-Based Production Trials INTRODUCTION M. C. Cremer and Zhang Jian American Soybean Association,
Prepared by: McDowell Group, Inc. Andy Wink CAP Meeting
 Prepared by: McDowell Group, Inc. Andy Wink CAP Meeting 7.28.15 Alaska Seafood Overview Fishery & Market Update Key Issues Ketchikan Seafood Industry Who and What is Alaska Seafood? About 60,000 fishermen,
Presentation to : Marine Aquaculture Task Force 2006
 Presentation to : Marine Aquaculture Task Force 2006 January 19th, 2006 Kona Kampachi Development of the first hatch-to-harvest open ocean fish farm in the U.S. Presentation by: Neil Anthony Sims, M.Sc.
The New Zealand Institute for Plant & Food Research Limited. It takes guts: Transforming fish processing in NZ
 It takes guts: Transforming fish processing in NZ Sue Marshall & Jacqui Day (PFR Seafood Technologies, Nelson) New Zealand Seafood Industry Conference, Wellington 19 August 2015 For comparison... Trident:
Moving Beyond Fishery Certification: Using collaboration, technology & innovation to further improve sustainability. June 6, 2017 Seattle, Washington
 Moving Beyond Fishery Certification: Using collaboration, technology & innovation to further improve sustainability June 6, 2017 Seattle, Washington Moving Beyond Fishery Certification: Using Collaboration,
Outline. 1. Selected indicators 2. Selected issues 3. Societal response 4. Outlook
 ICP. June 2005 Outline 1. Selected indicators 2. Selected issues 3. Societal response 4. Outlook 1. Selected indicators Reported landings Food Employment State of stocks Trade Fleet size Reported marine
SWEDEN IN THE WORLD AND IN THE EU (2015, source: FAO and Eurostat)
") SWEDEN IN THE WORLD AND IN THE EU (2015, source: FAO and Eurostat) Sweden is the EU s 8 th largest producers of fisheries and 15 th largest of aquaculture products. (1.000 tonnes) World EU-28 Sweden %
SWEDEN IN THE WORLD AND IN THE EU (2015, source: FAO and Eurostat) Sweden is the EU s 8 th largest producers of fisheries and 15 th largest of aquaculture products. (1.000 tonnes) World EU-28 Sweden %
Why the International Community Needs to Help Create Marine Reserves
 Why the International Community Needs to Help Create Marine Reserves by Daniel Pauly Sea Around Us Project Fisheries Centre, University of British Columbia Vancouver, Canada United Nations Open-ended Informal
Trends in salmon fisheries
 Trends in salmon fisheries Marc Trudel Fisheries and Oceans Canada Pacific Biological Station, Nanaimo Department of Biology, University of Victoria Plan of the presentation 1. Introduction 2. Salmon Harvest
Fishery. Fishing vessels (Dept. of Finance)
") Fishery Fishing vessels (Dept. of Finance) The Newfoundland and Labrador fishery recorded a difficult year in 29 due to low market prices, continued pressure from low-cost producers, and an appreciating
Fishery Fishing vessels (Dept. of Finance) The Newfoundland and Labrador fishery recorded a difficult year in 29 due to low market prices, continued pressure from low-cost producers, and an appreciating
FINLAND IN THE WORLD AND IN THE EU (2015, source: FAO and Eurostat) FISHING FLEET (2015, source: JRC and Annual Economic Report)
 FISHING FLEET (2015, source: JRC and Annual Economic Report)") FINLAND IN THE WORLD AND IN THE EU (05, source: FAO and Eurostat) Finland is the EU s th largest producer of fisheries and 4th largest of aquaculture products. (000 tonnes) World EU-8 Finland % World %
FINLAND IN THE WORLD AND IN THE EU (05, source: FAO and Eurostat) Finland is the EU s th largest producer of fisheries and 4th largest of aquaculture products. (000 tonnes) World EU-8 Finland % World %
An overview of Albanian seafood industry
 An overview of Albanian seafood industry 1. Structure and characteristics of the industry 1.1 Marine fisheries Marine capture fishery is the most important sector of the fisheries industry but lagoon and
THE DEVELOPMENT AND PROSPECT OF THE AQUACULTURE IN ASIA. Chen Sun, Shanghai Fisheries University, Economy and Trade College,
 THE DEVELOPMENT AND PROSPECT OF THE AQUACULTURE IN ASIA Chen Sun, Shanghai Fisheries University, Economy and Trade College, chensun@shfu.edu.cn ABSTRACT Asia has made and is making great contribution to
ANNEX II. REFERRED TO IN PARAGRAPH (c) OF ARTICLE 4 FISH AND OTHER MARINE PRODUCTS
 OF ARTICLE 4 FISH AND OTHER MARINE PRODUCTS") ANNEX II REFERRED TO IN PARAGRAPH (c) OF ARTICLE 4 FISH AND OTHER MARINE PRODUCTS ANNEX II REFERRED TO IN PARAGRAPH (c) OF ARTICLE 4 FISH AND OTHER MARINE PRODUCTS Article 1 Fish and other marine products
ANNEX II REFERRED TO IN PARAGRAPH (c) OF ARTICLE 4 FISH AND OTHER MARINE PRODUCTS ANNEX II REFERRED TO IN PARAGRAPH (c) OF ARTICLE 4 FISH AND OTHER MARINE PRODUCTS Article 1 Fish and other marine products
Global Industry Perspective Greg Tyler, Vice President of Marketing USA Poultry & Egg Export Council
 Global Industry Perspective Greg Tyler, Vice President of Marketing USA Poultry & Egg Export Council UNECE Meetings Atlanta, Georgia April 24 th, 2012 USAPEEC & its Mission The USA Poultry & Egg Export
Food for Thought: the Use of Marine Resources in Fish Feed"
 Food for Thought: the Use of Marine Resources in Fish Feed" Report 2/03 Written by: Taija-Riitta Tuominen and Maren Esmark Title "Food for Thought: the Use of Marine Resources in Fish Feed" Report number:
Global Outlook for Agriculture Trend versus Cycle
 Global Outlook for Agriculture Trend versus Cycle Michael Swanson Ph.D. Wells Fargo October 2017 Everything is connected we just don t see how. Connection corollary: Nothing natural moves in a straight
LATVIA IN THE WORLD AND IN THE EU (2015, source: FAO and Eurostat) FISHING FLEET (2015, source: JRC and Annual Economic Report)
 FISHING FLEET (2015, source: JRC and Annual Economic Report)") LATVIA IN THE WORLD AND IN THE EU (2015, source: FAO and Eurostat) Latvia is the EU s 13th largest producer of fisheries and 21st largest of aquaculture products. (1.000 tonnes) World EU-28 Latvia % World
LATVIA IN THE WORLD AND IN THE EU (2015, source: FAO and Eurostat) Latvia is the EU s 13th largest producer of fisheries and 21st largest of aquaculture products. (1.000 tonnes) World EU-28 Latvia % World
Le Anh Tuan
 Le Anh Tuan leanhtuandhts@gmail.com Department of Coastal Aquaculture Institute of Aquaculture 02 Nguyen Dinh Chieu St., Nha Trang City, Vietnam Tel: +84 913429198 EDUCATION Nha Trang University, Nha Trang,
Romanian Fisheries Sector - Facts and Figures -
 Romanian Fisheries Sector - Facts and Figures - Cătălin PLATON ROMFISH National Association of Fish Producers Romania Gross Domestic Product (PPP, Official Exchange Rate, Real Growth Rate and Per Capita)
BRITISH COLUMBIA SEAFOOD INDUSTRY YEAR IN REVIEW
 BRITISH COLUMBIA SEAFOOD INDUSTRY YEAR IN REVIEW ii British Columbia Seafood Industry 2012 YEAR IN REVIEW TABLE of CONTENTS A MESSAGE from The B.C. MINISTER of AGRICULTURE....1 British Columbia SEAFOOD
Paul Christian Ryan Vate Ocean Gardens Ltd. & South Pacific Ocean Gardens Ltd. Port Vila, Efate, Vanuatu &
 Paul Christian Ryan Vate Ocean Gardens Ltd. & South Pacific Ocean Gardens Ltd. Port Vila, Efate, Vanuatu & President (Elect) Of Vanuatu Aquaculture and Fisheries Association Introduction Vate Ocean Gardens
Global Market Trends and Challenges
 Global Market Trends and Challenges Northern Ireland Poultry Industry Conference 2 nd November 2017 Gary Millar, International Business Development Manager (Asia) Global Market Trends & Challenges: Global