The Awesome, Wonderful, Beautiful, Exciting and Terrible Climate of the West What a Hoot!
|
|
|
- Pamela Anderson
- 5 years ago
- Views:
Transcription
1 The Awesome, Wonderful, Beautiful, Exciting and Terrible Climate of the West What a Hoot! Nolan J. Doesken, State Climatologist Colorado Climate Center Presented to Four States Irrigation Council, 54 th Annual Meeting, January 17-19, 2007, Fort Collins, Colorado Prepared by Odie Bliss

2 Why is our climate So Special?
3 We are in the middle of our continent a long way from the nearest ocean and midway between the equator and the North Pole A straight shot from the Arctic A straight shot from the Gulf of Mexico


4 High Altitude Plains With a Huge Mountain Barrier to our West

5 Prevailing westerly winds overhead with a low pass through the Rockies over southern Wyoming

6 Not enough tall vegetation to slow the winds


7 What is the result?

8 Wetter in the mountains, drier on the plains
9 Lots of sunshine!

10 Few storms, but large storms


11 Most dramatic temperature changes

12 July and January Temperatures July Average Maximum Temperatures January Average Minimum Temperatures


13 Biggest and longest lasting droughts


14 Never enough rain, but When it rains, it pours

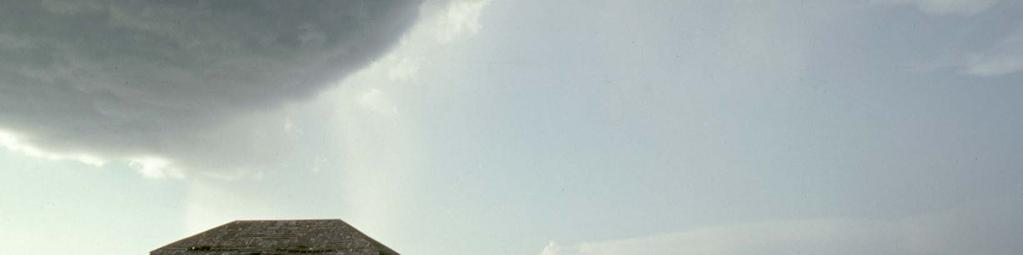
15 Blizzards When the right conditions do come together, we get some of the nastiest weather possible


16 Hail Capital of North America

17 Other climate characteristics of our region

18 Rocky Mountain Rain Shadow
19 High Seasonal Variability in Precipitation Water Year Average Precipitation for Selected Stations 5.0 Grand Junction Vail Vail Pass Georgetown Denver Burlington 4.5 Precipitation (inches) Oct Nov Dec Jan Feb Mar Apr May Jun Jul Aug Sep
20 Water Year Average Precipitation for Selected Stations 5.0 Garden City, KS Grand Island, NE Casper, WY Precipitation (inches) Oct Nov Dec Jan Feb Mar Apr May Jun Jul Aug Sep

21 Water Year 2006 How did we fare? Photo by Lynn Kral, Loveland, CO January 2006

22 Oct 1, 2005 Drought Monitor
23 Joe Wright Reservoir 2006 Snotel Preciptiation and snowpack accumulation graph


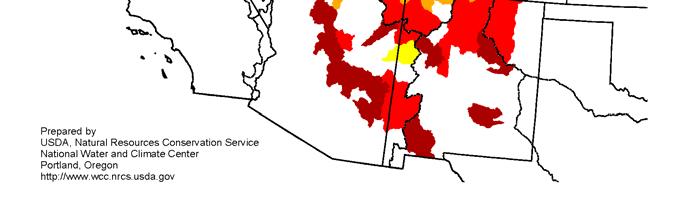
24 April 1, 2006 Snowpack Western US Snowpack as percent of average from NRCS
25 April 1, 2006 Drought Monitor

26 Growing Season Precipitation
27 Water Year 2006 Precipitation Percent of Average Prism precip map showing WY precip as % of average
28 October 1, 2006 Drought Monitor
29 2006 Temperature Departure from Average Temperature Departures for Water Year Temperature Departure (deg F) Oct Nov Dec Jan Feb Mar Apr May Jun Jul Aug Sep Eastern Plains Foothills Mountains Western Valleys

30 Historical Trends
31 Colorado Statewide Water Year (Oct-Sep) Precipitation Colorado Statewide Water Year (Oct-Sep) Precipitation from Year Precipitation (inches)

32 Wyoming Average Statewide Precipitation (Jan-Dec)
33 Colorado Statewide Average Summer (Jun-Aug) Temperature Colorado Statewide Average Summer (Jun-Aug) Temperature ( ) Temperature Average Temperature Temperature (deg F)
34 Colorado Statewide Average Winter (Dec-Feb) Temperatures 33 Colorado Statewide Average Winter (Dec-Feb) Temperature ( ) Temperatuure (deg F) Temperature Average Temperature

35 Where do we stand today?

36 Colorado Snowcover
37 Current Drought Monitor map

38 Greeley, CO, CoAgMet Temperature graph from CoAgMet from past 90 days, this year na dlast year on same figure (to show how cold greeley has been this time)

39 CoCoRaHS A chance to help!


40 What is CoCoRaHS? CoCoRaHS is a unique, non-profit community based network of volunteers of all ages and backgrounds working together to measure and map precipitation (rain, hail and snow). Photo by Henry Reges


41 Photo by Henry Reges CoCoRaHS Supplementing NWS Cooperative Program to Improve Precipitation Measurements

42 Help us expand CoCoRaHS! There is no better way to learn to understand your water supply than to measure it yourself and see the variations


43 Walking Through the Water Year A water education idea
44 Colorado Climate Center Data and Power Point Presentations available for downloading click on Drought then click on Presentations
Colorado Weather and Climate Update
 Colorado Weather and Climate Update Nolan J. Doesken State Climatologist Colorado Climate Center, Atmospheric Science Department, Colorado State University Presented to Colorado Livestock Association,
The State of the Climate Address
 The State of the Climate Address Nolan J. Doesken Colorado Climate Center, Atmospheric Science Dept, Colorado State University Presented to Colorado Water Officials Association, 2005 Annual Meeting, September
CoCoRaHS goes to the Colorado Farm Show
 CoCoRaHS goes to the Colorado Farm Show Nolan J. Doesken Colorado Climate Center, Atmospheric Science Dept, Colorado State University Presented January 25, 2006, Greeley, CO Prepared by Odie Bliss The
Environmental Protection The answer my friend is blowing in the wind
 Environmental Protection The answer my friend is blowing in the wind Nolan Doesken Colorado Climate Center Colorado State University Presented at the Pesticide Conference, November 17, 2005, Denver, CO
Weather and Climate Impacts on Water Supply
 Weather and Climate Impacts on Water Supply Nolan Doesken Colorado Climate Center Atmospheric Science Department Colorado State University http://ccc.atmos.colostate.edu Presented at the South Platte Forum,
Precipitation Patterns in South Park
 Precipitation Patterns in South Park Nolan J. Doesken, State Climatologist Colorado Climate Center, Atmospheric Science Department, Colorado State University Presented at South Park Symposium, August 3,
Drought and the Climate of the Ogallala Aquifer
 Drought and the Climate of the Ogallala Aquifer Nolan J. Doesken Colorado Climate Center Colorado State University Presented at Ogallala Symposium, Wray, Colorado February 20, 2006 Prepared by Odie Bliss
Nolan Doesken Colorado Climate Center
 Nolan Doesken Colorado Climate Center Presented to: Colorado Cattleman s s Association, Pueblo, CO, June 19, 2006 http://ccc.atmos.colostate.edu Prepared by Odie Bliss 1 Let s s Talk About Precipitation
Nolan Doesken. Colorado Climate Center.
 Nolan Doesken Colorado Climate Center Presented to: Colorado Conservation Tillage Association, Greeley, CO, February 1-2, 1 2005 http://ccc.atmos.colostate.edu Prepared by Odie Bliss 1 Key Features of
Drought or Not? Nolan J. Doesken Colorado Climate Center Colorado State University
 Drought or Not? Nolan J. Doesken Colorado Climate Center Colorado State University http://ccc.atmos.colostate.edu Presented at Horticultural Art Society meeting, November 19, 2004, Colorado Springs, Colorado
Drought! When Do We Know It s Over?
 Drought! When Do We Know It s Over? Nolan J. Doesken Colorado Climate Center Colorado State University http://ccc.atmos.colostate.edu Presented at the 2004 Peak to Prairie Landscape Symposium, February
Drought: What is the Status?
 Drought: What is the Status? Nolan J. Doesken Colorado Climate Center Colorado State University http://ccc.atmos.colostate.edu Presented at 2005 Peak to Prairie Landscape Symposium, February 11, 2005,
Global Climate Change: Just the Facts
 Global Climate Change: Just the Facts Nolan Doesken State Climatologist, Colorado Climate Center Atmospheric Science Department Colorado State University Presented at Club 20 Fall Meeting, Grand Junction,
Climate Issues A State s s Perspective
 Climate Issues A State s s Perspective Nolan J. Doesken Colorado State Climatologist, President Elect AASC Colorado Climate Center, Colorado State University FYO8 Central Regional MIC/HIC Conference, Kansas
The Arkansas Basin Climate Report Part 1 -- Remembering where we ve come from
 The Arkansas Basin Climate Report Part 1 -- Remembering where we ve come from Nolan Doesken State Climatologist (retired) Colorado Climate Center / Colorado Water Institute Colorado State University Arkansas
Tuesday, January 11, :11 AM (CST)
") Tuesday, January 11, 2011 11:11 AM (CST) -Assessment of current water conditions - Precipitation Forecast - Recommendations for Drought Monitor Upper Colorado Normal Precipitation Upper Colorado River
Tuesday, January 11, 2011 11:11 AM (CST) -Assessment of current water conditions - Precipitation Forecast - Recommendations for Drought Monitor Upper Colorado Normal Precipitation Upper Colorado River
COMPARISON OF FIXED & VARIABLE RATES (25 YEARS) CHARTERED BANK ADMINISTERED INTEREST RATES - PRIME BUSINESS*
 CHARTERED BANK ADMINISTERED INTEREST RATES - PRIME BUSINESS*") COMPARISON OF FIXED & VARIABLE RATES (25 YEARS) Fixed Rates Variable Rates FIXED RATES OF THE PAST 25 YEARS AVERAGE RESIDENTIAL MORTGAGE LENDING RATE - 5 YEAR* (Per cent) Year Jan Feb Mar Apr May Jun Jul
COMPARISON OF FIXED & VARIABLE RATES (25 YEARS) Fixed Rates Variable Rates FIXED RATES OF THE PAST 25 YEARS AVERAGE RESIDENTIAL MORTGAGE LENDING RATE - 5 YEAR* (Per cent) Year Jan Feb Mar Apr May Jun Jul
2018 HR & PAYROLL Deadlines
 th (by payment date) EPAF 3rd PARTY FEEDS WTE Approval 2018 HR & PAYROLL s Normal Payroll day s 2017 B1-26 3 * 13-Dec-17 15-Dec-17 n/a n/a n/a 28-Dec-17 29-Dec-17 11:00 AM 16-Dec-2017 29-Dec-2017 JAN 2018
Utility Debt Securitization Authority 2013 T/TE Billed Revenues Tracking Report
 Utility Debt Securitization Authority 2013 T/TE Billed Revenues Tracking Report Billing Budgeted Billed Dollar Percent Month Revenues Revenues Variance Variance Jan 2018 11,943,180.68 12,697,662.47 754,481.79
Climate of Colorado. Climatography of the United States No. 60 (updated 1/2003) Prepared by
 Prepared by") Climate of Colorado Climatography of the United States No. 60 (updated 1/2003) Prepared by Nolan J. Doesken, Roger A. Pielke, Sr., and Odilia A.P. Bliss Colorado Climate Center, Atmospheric Science Department,
Climate of Colorado Climatography of the United States No. 60 (updated 1/2003) Prepared by Nolan J. Doesken, Roger A. Pielke, Sr., and Odilia A.P. Bliss Colorado Climate Center, Atmospheric Science Department,
Wisconsin 511 Traveler Information Annual Usage Summary January 3, Wisconsin 511 Phone Usage ( )
") Wisconsin 511 Traveler Information 211 Annual Usage Summary January 3, 212 Overall to-date Summary 36 months of operation 1,16,63 total calls the 1 Million mark was passed on December 3, 212 3,627,527
Wisconsin 511 Traveler Information 211 Annual Usage Summary January 3, 212 Overall to-date Summary 36 months of operation 1,16,63 total calls the 1 Million mark was passed on December 3, 212 3,627,527
First of all, you should know that weather and climate are not the same thing.
 First of all, you should know that weather and climate are not the same thing. WEATHER IS: Short term Limited area Can change rapidly Difficult to predict WEATHER is what s happening outside your window
LAB H - ATMOSPHERE AND CLIMATE LAB II STABILITY AND PRECIPITATION PATTERNS
 Introduction LAB H - ATMOSPHERE AND CLIMATE LAB II STABILITY AND PRECIPITATION PATTERNS This lab will provide students with the opportunity to become familiar with the concepts of atmospheric stability
Agricultural Weather Assessments World Agricultural Outlook Board
 Texas (8) Missouri (7) South Dakota (6) Kansas (5) Nebraska (5) North Dakota (5) Oklahoma (5) Kentucky (4) Montana (4) California (3) Minnesota (3) New York (3) Pennsylvania (3) Tennessee (3) Wisconsin
Agricultural Weather Assessments World Agricultural Outlook Board
 Texas (8) Missouri (7) South Dakota (6) Kansas () Nebraska () North Dakota () Oklahoma () Kentucky (4) Montana (4) California (3) Minnesota (3) New York (3) Pennsylvania (3) Tennessee (3) Wisconsin (3)
Arizona Climate Summary September 2012
 Arizona Climate Summary September 2012 Summary of conditions for August 2012 August 2012 Temperature and Precipitation Summary August 1 st 15 th : During the month of August, at least one location received
NEVADA SLOT MACHINES: HISTORICAL HOLD PERCENTAGE VARIATIONS ANNUAL AND MONTHLY HOLD PERCENTAGES, CENTER FOR GAMING RESEARCH, NOVEMBER 2017
 NEVADA SLOT MACHINES: HISTORICAL HOLD PERCENTAGE VARIATIONS ANNUAL AND MONTHLY HOLD PERCENTAGES, 2004-2017 CENTER FOR GAMING RESEARCH, NOVEMBER 2017 Executive Summary Hold percentage the portion of money
Design Criteria Data
 FRESNO CA Latitude = 36.77 N WMO No. 72389 Longitude =119.7 W Elevation = 328 feet Period of Record = 1972 to 1996 Average Pressure = 29.62 inches Hg Design Criteria Data Mean Coincident (Average) Values
Design Criteria Data
 TUCUMCARI NM Latitude = 35.18 N WMO No. 723676 Longitude =13.6 W Elevation = 465 feet Period of Record = 1973 to 1996 Average Pressure = 25.86 inches Hg Design Criteria Data Mean Coincident (Average) Values
Monthly Webinar 12.07/2010
 Monthly Webinar 12.07/2010 -Assessment of current water conditions - Precipitation Forecast - Recommendations for Drought Monitor Upper Colorado Normal Precipitation Upper Colorado River Basin Normal
Arizona Climate Summary
 Arizona Climate Summary March 2012 Summary of conditions for February 2012 February 2012 Temperature and Precipitation Summary February 1 st 17 th : February continued where January left off with a high
Historical and Current Climate in the Rio Grande National Forest Area. Peter Goble Nolan Doesken 10/19/2016
 Historical and Current Climate in the Rio Grande National Forest Area Peter Goble Nolan Doesken 10/19/2016 Geographic Orientation Geographic Orientation Geographic Orientation Rio Grande National Forest
Kodiak, Alaska Site 1 Wind Resource Report
 Kodiak, Alaska Site 1 Wind Resource Report Report written by: Douglas Vaught, P.E., V3 Energy LLC, Eagle River, AK Date of report: March 16, 2007 Photo by Doug Vaught, V3 Energy LLC Summary Information
July 2015 Sept Cork City Pedestrian Counter Report
 July 2015 Sept 2015 Cork City Pedestrian Counter Report Disclaimer Cork City Council has produced this report based on information extracted from our Pedestrian Counter Monitoring System. Although care
Design Criteria Data
 MEMPHIS TN Latitude = 35.35 N WMO No. 723345 Longitude = 89.87 W Elevation = 322 feet Period of Record = 1973 to 1996 Average Pressure = 29.68 inches Hg Design Criteria Data Mean Coincident (Average) Values
Properties. terc.ucdavis.edu 8
 Physical Properties 8 Lake surface level Daily since 1900 The lowest lake level on record was 6,220.26 feet on Nov. 30, 1992. Since 1900, lake level has varied by more than 10 feet. Lake level typically
Site Description: Tower Site
 Wind Resource Summary for Elizabeth Site Final Report Colorado Anemometer Loan Program Monitoring Period: 7/3/6 /15/7 Report Date: December 22, 7 Site Description: The site is.6 miles northeast of the
A Snapshot of Our Changing Climatology
 A Snapshot of Our Changing Climatology Dr. Kenneth ( Kenny ) Blumenfeld Sr. Climatologist DNR State Climatology Office 11/17/2018 1 Items to bear in mind 1. Climate news elsewhere may not apply here 2.
PUBLIC MEETINGS. Please see the City of Geneva Public Meeting Guide for more information regarding City Council and Committee of the Whole meetings.
 PUBLIC MEETINGS Citizens are welcome and encouraged to attend all City of Geneva public meetings. Public meeting guests are also urged to participate in any of the City s many public meetings that take
Short-Term Transit Ridership and Revenue Forecasting
 Short-Term Transit Ridership and Revenue Forecasting presented to The 5 th Transportation Research Board Conference on Innovations in Travel Modeling presented by Cambridge Systematics, Inc. Feng Liu,
NOTE ->->-> DUE THURSDAY APRIL 20 TH 2006 THAT IS CORRECT I FORGOT THIS IS EASTER WEEKEND SO I HAVE EXTENDED THE DUE DATE TO THE ABOVE
 GEO 130 NAME OCEANOGRAPHY TEST 3 TAKE HOME TEST SPRING 2006 NOTE ->->-> DUE THURSDAY APRIL 20 TH 2006 THAT IS CORRECT I FORGOT THIS IS EASTER WEEKEND SO I HAVE EXTENDED THE DUE DATE TO THE ABOVE This test
Weather EOG Review Questions
 Weather EOG Review Questions 1. Which statement best describes runoff? A Water vapor cools off and changes into water droplets. B Water in the form of rain, snow, sleet, or hail falls from clouds. C Precipitation
May 2018 FY Key Performance Report
 May 20 FY 20 - Key Performance Report Management Notes: The information in this report is based on the FY 20 Operating Budget, Amendment 2, adopted by the Board on January 22, 20. RT s farebox recovery
CUPSIM Water Supply Variability Study All information subject to change.
 . 1 IN A NUTSHELL The CUP Water Supply Variability Study is an opportunistic, proactive example of responsible water system management The CUP is very complex and approaching full demand The study capitalizes
SEASONAL PRICES for TENNESSEE FEEDER CATTLE and COWS
 SEASONAL PRICES for TENNESSEE FEEDER CATTLE and COWS Tammy L. McKinley Extension Specialist Agricultural & Resource Economics economics.ag.utk.edu AE16-06 July 2016 TABLE OF CONTENTS Seasonal : Introduction...
Bicycle Crashes. Number of Bike Crashes. Total Bike Crashes. are down 21% and severe bike crashes down 8% since 2013 (5 years).
.") Bicycle Crashes The City of Fort Collins is well known for its bike culture, and there is a strong focus on encouraging increased riding. Bike safety is an important component of supporting these efforts.
Bicycle Crashes The City of Fort Collins is well known for its bike culture, and there is a strong focus on encouraging increased riding. Bike safety is an important component of supporting these efforts.
Bluetongue Disease (BT)
") Bluetongue Disease (BT) Analysis of ADNS data since 01/2018 Reporting period: 2018-01-01 2018-12-09 Data query: 2018-12-10 AGES DSR Austrian Agency for Health and Food Safety www.ages.at Parameters Data
Bluetongue Disease (BT) Analysis of ADNS data since 01/2018 Reporting period: 2018-01-01 2018-12-09 Data query: 2018-12-10 AGES DSR Austrian Agency for Health and Food Safety www.ages.at Parameters Data
Meteorology of Monteverde, Costa Rica 2007
 Meteorology of Monteverde, Costa Rica 2007 Technical Report submitted to the Monteverde Institute Andrew J. Guswa, Associate Professor, Picker Engineering Program Amy L. Rhodes, Associate Professor, Department
b Number issued 200,000 (marked with * in the attached appendix) Exercise price is as set out in the appendix
 Exercise price is as set out in the appendix") www.sli-systems.com Level 1, EPIC 78 106 Manchester Street Christchurch New Zealand Phone: 0800 754 797 Fax:03 961 3262 22 May 2018 Client Market Services NZX Limited WELLINGTON By NZ MAP NOTIFICATION
www.sli-systems.com Level 1, EPIC 78 106 Manchester Street Christchurch New Zealand Phone: 0800 754 797 Fax:03 961 3262 22 May 2018 Client Market Services NZX Limited WELLINGTON By NZ MAP NOTIFICATION
Becky Bolinger NIDIS IMW Drought Early Warning System Webinar November 21, 2017
 NIDIS Intermountain West Dec-Feb Winter Outlook Becky Bolinger NIDIS IMW Drought Early Warning System Webinar November 21, 2017 COLORADO CLIMATE CENTER La Niña Advisory And associated impacts from La Niña
9-1: What Causes Climate. 6 th Grade Earth Science
 6 th Grade Earth Science What is Climate? 9-1: What Causes Climate Climate is the long-term average conditions of temperature, precipitation, winds, and clouds in an area. Examples of Climate The Mojave
September 2018 FY Key Performance Report
 September 20 FY 2019 - Key Performance Report Management Notes: The information in this report is based on the FY 2019 Operating Budget, adopted by the Board on June 11, 20. RT s farebox recovery ratio
Wind Resource Assessment for NOME (ANVIL MOUNTAIN), ALASKA Date last modified: 5/22/06 Compiled by: Cliff Dolchok
, ALASKA Date last modified: 5/22/06 Compiled by: Cliff Dolchok") 813 W. Northern Lights Blvd. Anchorage, AK 99503 Phone: 907-269-3000 Fax: 907-269-3044 www.akenergyauthority.org SITE SUMMARY Wind Resource Assessment for NOME (ANVIL MOUNTAIN), ALASKA Date last modified:
813 W. Northern Lights Blvd. Anchorage, AK 99503 Phone: 907-269-3000 Fax: 907-269-3044 www.akenergyauthority.org SITE SUMMARY Wind Resource Assessment for NOME (ANVIL MOUNTAIN), ALASKA Date last modified:
1 PEW RESEARCH CENTER
 1 SEPTEMBER 2018 POLITICAL SURVEY FINAL TOPLINE SEPTEMBER 18-24, 2018 N=1,754 QUESTIONS 1-2, 7-8, 11-13, 28 PREVIOUSLY RELEASED NO QUESTIONS 3-6, 9-10, 14-27, 29-32, 34-43, 47-49 QUESTION 33 HELD FOR FUTURE
FREEDOM OF INFORMATION REQUEST
 FREEDOM OF INFORMATION REQUEST REQUEST NUMBER: FOI Request 003905-16 REQUEST DETAILS: As part of my research I am requesting information on the numbers of 'strip searches' that have taken place within
Applied Earth Science Climate Exam Practice Questions Page 1
 Name: 1. Which combination of climate factors generally results in the coldest temperatures? A) low elevation and low latitude B) low elevation and high latitude C) high elevation and low latitude D) high
3/22/11. General Circulation of the Atmosphere. General Circulation of the Atmosphere
 Chapter 10 General refers to the average air flow, actual winds will vary considerably. Average conditions help identify driving forces. The basic cause of the general circulation is unequal heating of
Wind Resource Assessment for CHEFORNAK, ALASKA
 813 W. Northern Lights Blvd. Anchorage, AK 99503 Phone: 907-269-3000 Fax: 907-269-3044 www.akenergyauthority.org Wind Resource Assessment for CHEFORNAK, ALASKA Date last modified: 3/15/2006 Compiled by:
May 2018 MLS Statistical Report
 Jan Feb Mar Apr May Jun Jul Aug Sep Oct Nov Dec January February March April May June July August Septem October Novem Decemb Days on Market The graph on the right illustrates the drastic decline in the
JULY 2013 RIDERSHIP REPORT MTA METRO-NORTH RAILROAD EXECUTIVE SUMMARY
 Ridership Report JULY 2013 RIDERSHIP REPORT MTA METRO-NORTH RAILROAD EXECUTIVE SUMMARY July July 2013 Total MNR System Ridership was 7.346 million vs. 7.439 million in July 2012, a decrease of 92,959 passengers
Station 1: Ocean Currents Use the ocean currents map copied from page 4 of the ESRT and the passage to answer the questions that follow.
 Station 1: Ocean Currents Use the ocean currents map copied from page 4 of the ESRT and the passage to answer the questions that follow. The Map: Questions: 1. Name the cool current off the West coast
GAZIFÈRE INC. Prime Rate Forecasting Process 2015 Rate Case
 Overview A consensus forecast is used to estimate the prime rate charged by commercial banks. As the prime rate is subject to competitive pressures faced by individual lenders and is set on an individual
January 2019 FY Key Performance Report
 January 2019 FY 2019 - Key Performance Report Management Notes: The information in this report is based on the FY 2019 Operating Budget, adopted by the Board on June 11, 20. RT s farebox recovery ratio
Suburb Flyover Report
 Suburb Flyover Report NARRABEEN (House) Prepared By: Shelley Bakhuizen, Ray White Mona Vale NARRABEEN - Suburb Map NARRABEEN - Sales Statistics (Houses) Year # Sales Median Growth Low High 1998 188 $ 09,500
Variability in the tropical oceans - Monitoring and prediction of El Niño and La Niña -
 Variability in the tropical oceans - Monitoring and prediction of El Niño and La Niña - Jun ichi HIROSAWA Climate Prediction Division Japan Meteorological Agency SST anomaly in Nov. 1997 1 ( ) Outline
Air Masses and Fronts
 Air Masses and Fronts A huge body of air that has similar temperature, humidity, and air pressure at any given height is called an air mass. A single air mass may spread over millions of square kilometers
Hydrological Condition Report including the issues of High Flow Fluctuation in Chiang Saen
 Hydrological Condition Report including the issues of High Flow Fluctuation in Chiang Saen Technical Symposium for ESCIR and MRC on Social Impact Assessment in River Basin Management Sothea KHEM, HENG
Manitoba Water Stewardship. Coping with Drought. Drought Research Initiative Workshop. Inn at the Forks, Winnipeg. A.A. Warkentin. January 11-13, 2007
 Manitoba Water Stewardship Coping with Drought Drought Research Initiative Workshop Inn at the Forks, Winnipeg A.A. Warkentin January 11-13, 2007 Annual Renewal of Water Supplies Important Precipitation-based
January 2018 Sun Mon Tue Wed Thu Fri Sat Week 2 1 New Year's Day
 January 2018 1 New Year's Day 2 3 4 6 Feb 2018 7 8 9 10 11 12 13 14 1 Martin Luther King 16 17 18 e-learning Curriculum Building the Toolbox (0900-1000) 19 20 21 24 2 28 29 30 31 Jan 2018 February 2018
Site Description: LOCATION DETAILS Report Prepared By: Tower Site Report Date
 Wind Resource Summary for Holyoke Site Final Report Colorado Anemometer Loan Program Monitoring Period:: 6/21/26 /6/27 Report Date: December 2, 27 Site Description: The site is 17.4 miles south of the
Bell Work. Compare and contrast warm fronts and cold fronts. What type of weather is associated with a high pressure and low pressure systems?
 Daily Routine Sit in your appropriate seat quietly Have all necessary materials out All back packs on the floor All cell phones on silent and away in backpacks All music devices off and headphones out
Canada s Natural Systems. Canadian Geography 1202
 Canada s Natural Systems Canadian Geography 1202 Canada s Natural Systems Natural System: A system found in nature Here are the four natural systems that we will explore in the next few weeks 1. Canada
Weather & Atmosphere Study Guide
 Weather & Atmosphere Study Guide 1. Draw a simple water cycle diagram using the following words: Precipitation, Evaporation, Condensation, Transpiration 2. In your own words, explain the difference between
Calendar On US Federal Reserve Holidays, no settlements will take place for USD.
 NASDAQ Dubai Notice No: NASDAQ Dubai Trading Holidays and Settlement Calendar 2012 Date of Issue: NASDAQ Dubai TRADING HOLIDAYS AND SETTLEMENT CALENDAR 2012 For Derivatives, Exchange Traded Commodities,
2017 CRAPPIE TOURNAMENT SUMMARY
 017 CRAPPIE TOURNAMENT SUMMARY FISHERIES BUREAU MISSISSIPPI WILDLIFE, FISHERIES, AND PARKS 1505 Eastover Drive Jackson, MS 3911 Your purchase of fishing equipment and motor boat fuels supports Sport Fish
The student will be expected to demonstrate an understanding of the cause of winds and how winds affect climate.
 The student will be expected to demonstrate an understanding of the cause of winds and how winds affect climate. In this lesson you will: 2.3.1 Define the term prevailing winds. (k) 2.3.3 State the impact
SWISS reports stable load factors
 SWISS Corporate Communications Phone: +41 (0)848 773 773 Fax: +41 (0)44 564 2127 communications@swiss.com SWISS.COM Media release Zurich Airport, October 10, 2008 SWISS reports stable load factors SWISS
Bird strikes Swedish Airspace
 Bird strikes Swedish Airspace 1998-2005 Nordic Birdstrike Committee Arlanda 2006-09-21 Jörgen Andersson Jörgen Andersson, Swedish CAA 1 Objective Occurrence reports Bird population Birdstrikes between
SOLTRANS BOARD MEETING SUPPLEMENTAL REPORTS / HANDOUTS January 15, 2015 MEETING HANDOUTS
 SOLTRANS BOARD MEETING SUPPLEMENTAL REPORTS / HANDOUTS January 15, 2015 MEETING HANDOUTS Agenda Item 10 January 2015 System Improvements Update - PowerPoint Presentation Agenda Item 12 Construction Projects
LUXURY BOUTIQUE CRUISES. Vietnam Cambodia Myanmar DEPARTURES. Ayeyarwady & Chindwin Myanmar
 Vietnam Cambodia Ayeyarwady & Chindwin Heritage Line operates with one luxury cruise vessel named in on the Ayeyarwady and the Chindwin River. features 23 cabins in five different categories. Heritage
Rice Yield And Dangue Haemorrhagic Fever(DHF) Condition depend upon Climate Data
 Condition depend upon Climate Data") Rice Yield And Dangue Haemorrhagic Fever(DHF) Condition depend upon Climate Data Dr Lai Lai Aung, Assistant Director( Met Service) Dr Khaing Khaing Soe Assistant Director(Public Health) Dr Thin Nwe htwe
Rice Yield And Dangue Haemorrhagic Fever(DHF) Condition depend upon Climate Data Dr Lai Lai Aung, Assistant Director( Met Service) Dr Khaing Khaing Soe Assistant Director(Public Health) Dr Thin Nwe htwe
African swine fever in domestic pigs and wild boar (ASF)
") African swine fever in domestic pigs and wild boar (ASF) Analysis of ADNS data since 01/2018 Reporting period: 2018-01-01 2018-12-09 Data query: 2018-12-10 AGES DSR Austrian Agency for Health and Food
African swine fever in domestic pigs and wild boar (ASF) Analysis of ADNS data since 01/2018 Reporting period: 2018-01-01 2018-12-09 Data query: 2018-12-10 AGES DSR Austrian Agency for Health and Food
Wind Resource Assessment for DEADHORSE, ALASKA
 813 W. Northern Lights Blvd. Anchorage, AK 99503 Phone: 907-269-3000 Fax: 907-269-3044 www.akenergyauthority.org Wind Resource Assessment for DEADHORSE, ALASKA Date last modified: 4/18/2006 Compiled by:
Intermountain West Climate Summary
 Intermountain West Climate Summary A product of The Western Water Assessment Issued October 2010 Vol. 6, Issue 6 ENSO and Intermountain West Water Supply: A Review of Water Year 2010 and Outlook for Water
Arizona Climate Summary December 2008
 Arizona Climate Summary December 28 Summary of conditions for November 28 November 28 Temperature and Precipitation Summary November 1 st - 11 th : November began with high pressure over the western U.S.,
Jeopardy Q $100 Q $100 Q $100 Q $100 Q $100 Q $200 Q $200 Q $200 Q $200 Q $200 Q $300 Q $300 Q $300 Q $300 Q $300 Q $400 Q $400 Q $400 Q $400 Q $400
 Jeopardy Grab Bag Review Grab Bag Review 2 Biomes Climate Factors that affect climate Q $100 Q $200 Q $300 Q $400 Q $500 Q $100 Q $100 Q $100 Q $100 Q $200 Q $200 Q $200 Q $200 Q $300 Q $300 Q $300 Q $300
DEC DASHBOARD. Positive Response Compliance DEC. Compliant Tickets : On-Time Performance Analysis. December % Late.
 Positive Response Compliance 215 Compliant 215 Non-Compliant 216 Compliant 216 Non-Compliant 1% 87% 96% 86% 96% 88% 97% 89% 97% 89% 98% 88% 97% 86% 96% 92% 97% 93% 97% 94% 97% 96% 97% 94% 97% 8% 6% 4%
JAN DASHBOARD. Positive Response Compliance JAN. Compliant Tickets : On-Time Performance Analysis. January % Late.
 Positive Response Compliance 216 Compliant 216 Non-Compliant 217 Compliant 217 Non-Compliant 1% 96% 97% 8% 6% 4% 2% 4% 3% FEB MAR APR MAY JUN JUL AUG SEP OCT NOV DEC 8% Late Compliant Tickets : On-Time
MAR DASHBOARD MAR. Compliant % Breakdown Mar % Late % On-time MAR APR MAY JUN JUL AUG SEP OCT NOV DEC
 Positive Response Compliance 215 Compliant 215 Non-Compliant 216 Compliant 216 Non-Compliant 1% 87% 96% 86% 96% 88% 97% 89% 89% 88% 86% 92% 93% 94% 96% 94% 8% 6% 4% 2% 13% JAN 4% 14% FEB 4% 12% 3% 11%
Wind Resource Assessment for SAINT PAUL, ALASKA
 813 W. Northern Lights Blvd. Anchorage, AK 99503 Phone: 907-269-3000 Fax: 907-269-3044 www.akenergyauthority.org Wind Resource Assessment for SAINT PAUL, ALASKA Date last modified: 3/1/2006 Compiled by:
DEPARTURES. Ayeyarwady & Chindwin Myanmar
 Ayeyarwady & Chindwin Heritage Line operates with one luxury cruise vessel named in on the Ayeyarwady and the Chindwin River. features 23 cabins in five different categories. Heritage Line is cruising
Nasdaq Dubai AED TRADING HOLIDAYS AND SETTLEMENT CALENDAR 2018 For Equities Outsourced to the DFM (T+2)
") NasdaqDubai Circular No: 14 /2018 Date of Issue: 13 March 2018 Date of Expiry : Upon issue of replacement Circular Nasdaq Dubai AED TRADING HOLIDAYS AND SETTLEMENT CALENDAR 2018 For Equities Outsourced
NasdaqDubai Circular No: 14 /2018 Date of Issue: 13 March 2018 Date of Expiry : Upon issue of replacement Circular Nasdaq Dubai AED TRADING HOLIDAYS AND SETTLEMENT CALENDAR 2018 For Equities Outsourced
Downtown Denver Summer 2013 Pedestrian Count Report
 Downtown Denver Summer 2013 Pedestrian Report Funded by the Downtown Denver Business Improvement District Downtown Denver Partnership, Inc. Research Department Research Department 511 16 th Street, Suite
SWISS Traffic Figures May 2004
 SWISS Traffic Figures May 2004 SWISS continues seat load factor improvement in May SWISS s load factor for May was 4.8 percentage points better than for the same period last year. Seat load factor for
Long-Lead Climate Outlook and the Role of ENSO in High Plains Drought
 Long-Lead Climate Outlook and the Role of ENSO in High Plains Drought Klaus Wolter NOAA-Earth System Research Lab & University of Colorado at Boulder-CDC klaus.wolter@noaa.gov Kudos to Chad McNutt for
Lake mead current water level
 P ford residence southampton, ny Lake mead current water level Projected Operations. Hourly Schedules (updated daily) Davis Dam & Parker Dam Headgate Rock Dam. 10-Day Lake Mead Outlook. 4-6-2015 The Historic
3. EXCEL FORMULAS & TABLES
 Fall 2017 CS130 - Excel Formulas & Tables 1 3. EXCEL FORMULAS & TABLES Fall 2017 Fall 2017 CS130 - Excel Formulas & Tables 2 Cell References Absolute reference - refer to cells by their fixed position.
Impact of Climate Change on Dutchess County
 Impact of Climate Change on Dutchess County Vicky Kelly Cary Institute of Ecosystem Studies Marist College Center for Lifetime Study The Impact of the Hudson River on American History and Culture October
Eastern Equatorial Pacific
 Overview The is the region of open ocean directly south of Mexico and Central America (between approximately 4 o to 16 o N, and 85 o to 105 o W) (Figure 1). Major bathymetric features include Guatemala
Staying in Tune with South Florida s Water Cycle for Scientists, Managers, and Policy Makers in 5 Minutes per Week
 Staying in Tune with South Florida s Water Cycle for Scientists, Managers, and Policy Makers in 5 Minutes per Week Robert Sobczak (Big Cypress Nat l Pres), Todd Hopkins (FWS), Kevin Kotun (Everglades National