Great Lakes Commission Semiannual Meeting
|
|
|
- Dana Richardson
- 6 years ago
- Views:
Transcription


1 Great Lakes Commission Semiannual Meeting Great Lakes Water Levels Forecasts March 6, 2013 Washington D.C. Keith Kompoltowicz Chief, Watershed Hydrology Detroit District Corps of Engineers
2 Recent Analysis/Forecast of Great Lakes Water Levels 2 BUILDING STRONG

3 Hydrologic Cycle WINTER SPRING SUMMER FALL Snow accumulation Snow melt, rainfall, increased runoff Increased sunshine warms lake water Increased evaporation 3 BUILDING STRONG
4 Water Balance (Factors Affecting Water Levels) Inflow from Upstream Lake Evaporation Precipitation Runoff Net Basin Supply Outflow 4 BUILDING STRONG
5 2012 Net Basin Supplies Lake Superior Lake Michigan-Huron NBS tcfs NBS tcfs Jan Feb Mar Apr May Jun Jul Aug Sep Oct Nov Dec Jan Feb Mar Apr May Jun Jul Aug Sep Oct Nov Dec NBS Avg NBS NBS Avg NBS Lowest on record for Sept Second lowest on record for Sept 5 BUILDING STRONG
6 2012 Precipitation compared to average 2012 Evaporation compared to average Accumulated Precipitation (inches) Average Accumulated Evaporation (inches) Average 0 Superior Michigan-Huron Erie Ontario 0.00 Superior Michigan-Huron St. Clair Erie Ontario 2012 Spring (Mar, Apr, May) Runoff % of Average Superior Mich-Huron St. Clair Erie Ontario 78% 65% 50% 51% 37% Only a 4 inch seasonal rise on Lake Michigan-Huron; Average is 12 inches No seasonal rise on Lake St. Clair or Lake Erie; First time on record for both lakes 6 BUILDING STRONG

7 BUILDING STRONG
8 Departure from Average NBS tcfs Lake Michigan-Huron NBS Cumulative Annual Departure from Average ( ) Lake Michigan-Huron Water Levels ( ) Seasonal Trend Lake Michigan-Huron LTA '96 '97 '98 '99 '00 '01 '02 '03 '04 '05 '06 '07 '08 '09 '10 '11 '12

9 Period of record of Great Lakes water levels ( ) Times of above average levels, times of below average levels, times of near average levels. No discernible long-term cycles 9 BUILDING STRONG
10 January Lake Levels January 2013 Level (ft, IGLD85) Difference from LWD (inches) Difference from Jan (inches) Difference from Jan. Record Low, in. Difference from Jan. Average (inches) Superior Michigan- Huron St. Clair Erie Ontario Lowest monthly mean on record since 1918 BUILDING STRONG
11 February Lake Levels February 2013 Level (ft, IGLD85) Difference from LWD (inches) Difference from Feb (inches) Difference from Feb. Record Low, in. Difference from Feb. Average (inches) Superior Michigan- Huron St. Clair Erie Ontario BUILDING STRONG

12 2013 Snow Water Equivalent NOHRSC 12 BUILDING STRONG

13 2012 Snow Water Equivalent NOHRSC 13 BUILDING STRONG

14 14 BUILDING STRONG

15 15 BUILDING STRONG

16 16 BUILDING STRONG

17 17 BUILDING STRONG

18 18 BUILDING STRONG

19 19 BUILDING STRONG


20 BUILDING STRONG
21 UNDERSTANDING GREAT LAKES WATER LEVEL FLUCTUATIONS AND CURRENT CONDITIONS MARCH 2013 John Allis Chief, Great Lakes Hydraulics and Hydrology Office (313) Keith Kompoltowicz Chief, Watershed Hydrology Branch (313) Eric Tauriainen Chief, Hydraulic Engineering Branch (313)
22 Table of Contents Introduction...2 Understanding Great Lakes Water Level Fluctuations...2 Descriptions of the major components causing Great Lakes water levels to rise and fall Current Great Lakes Water Level Conditions.4 A lake by lake listing of current and forecasted water levels and the contributions of hydrologic parameters Appendix A: Figures Figure 1 The Great Lakes Basin.6 Map showing the outline of the Great Lakes drainage basin, noting that 1/3 of this area is the actual lake surface itself Figure 2 Great Lakes System Profile 7 Figure showing the step like profile of the system, falling about 600 feet from Lake Superior to the Atlantic Ocean Figure 3 Great Lakes Water Levels... 8 Hydrographs showing the monthly lake level fluctuations for all lakes over the period , from record lows to record highs Figure 4 Monthly Bulletin of Water Levels for the Great Lakes The official 6 month forecast for the Great Lakes Figure 5 Current Precipitation Values.10 Graphic for each lake showing the last 3 years of precipitation values compared to their long-term average Figure 6 Current Evaporation Values.11 Graphic for each lake showing the last 4 years of evaporation values, expressed as a positive or negative difference from their long-term average Figure 7 Hydrologic Components A graphical representation of the magnitude of the contribution of runoff, precipitation, outflow and evaporation to the water supply for each lake Figure 8 Current Lake Levels 13 Appendix B: Water Level Talking Points...14 Appendix C: Water Level Summary...16 Narrative describing recent water level conditions Appendix D: Useful Great Lakes Web Addresses..17 A listing of web sites containing a variety of Great Lakes information
23 Introduction This document is provided as a means to help people become more informed on the science behind the fluctuations in Great Lakes water levels. Conditions have been drier than normal in recent years, leading to below average water levels on all of the Great Lakes. Lake Michigan- Huron set a new all-time record low water level in January Water level fluctuations are primarily driven by the natural hydrologic cycle with only minor influences from humans. Information is presented on the Great Lakes basin in general, the driving forces behind why the levels rise and fall, and more detailed data on recent precipitation, evaporation and river flows that play a key role in current water level conditions. Understanding Great Lakes Water Level Fluctuations The Great Lakes and St. Lawrence River are a dynamic system. The Great Lakes basin covers more than 94,000 square miles of water and more than twice as much land. It includes part or all of eight U.S. states and two Canadian provinces as shown in Figure 1. The profile of the system is depicted in Figure 2 and shows a series of steps leading from Lake Superior at the headwaters down to the Atlantic Ocean. The St. Marys River flows from Lake Superior to Lake Huron. Lakes Michigan and Huron are connected by the broad and deep Straits of Mackinac and are considered to be one lake hydraulically, with levels rising and falling together. The St. Clair and Detroit rivers, with Lake St. Clair in between, connect Lake Huron with Lake Erie. The Niagara River then links Lake Erie with Lake Ontario, including the dramatic drop over Niagara Falls. The man-made Welland Canal also links Lakes Erie and Ontario, providing a detour around the Falls. From Lake Ontario, water flows into the St. Lawrence River, which converges with the Ottawa River and flows on to the Atlantic Ocean. Since the retreat of the glaciers, water levels have undergone dramatic fluctuations, as much as hundreds of feet. Figure 3 shows the water level ranges of the Great Lakes over the last 94 years, based on monthly lake-wide averages for each lake. The difference between the amount of water coming into a lake and the amount going out is the determining factor in whether the water level will rise, fall or remain stable. Moisture is carried into the Great Lakes basin by continental air masses originating in the northern Pacific Ocean, tropical systems originating in the Gulf of Mexico, or Arctic systems originating in the far north. As these weather systems move through, they deposit moisture in the form of rain, snow, hail or sleet. Water enters the lakes through precipitation on the lake, runoff from surrounding land, groundwater inflow and inflow from upstream lakes. Figure 5 shows the precipitation values for each lake, for the last few years compared to average. Water leaves the lakes through evaporation from the water surfaces, groundwater outflow, consumptive use, diversions and outflows to downstream lakes or rivers. Evaporation is a major factor when warm lake surfaces come in contact with cool, dry air. Figure 6 shows the evaporation values for each lake, for the last few years compared to average. Water levels fluctuate on a short-term basis, usually due to winds and changes in barometric pressure lasting from a couple of hours to several days. The lakes also fluctuate on a seasonal cycle each year. Levels decline to their lowest level in the winter months because more water leaves the lake through evaporation (greatest in the fall and early winter), and precipitation falling as snow can accumulate on the land during winter. As the snow melts in the spring, runoff increases. Precipitation in the spring primarily falls as rain and can also contribute to 2
24 higher runoff. Generally, evaporation is least during spring and early summer. These factors contribute to more water entering the lakes than leaving, so water levels rise to their summer peak. Long-term fluctuations occur over periods of consecutive years. Continuous wet and cold years will cause levels to rise, while warm and dry years will cause levels to decline. Figure 7 shows the hydrologic components that make up the water supply to each of the lakes and the percentage they contribute. Crustal movement, the rebounding of the earth s crust from the removed weight of the glaciers, does not change the amount of water in a lake, but rather the water depths along the shoreline of each lake. Rebound rates vary across the Great Lakes basin, with the crust rising at the highest rate in the northern portion of the basin, where the ice was thickest, heaviest and last to retreat. In the southern portion of the basin, rebound rates are much slower. As a result, the Great Lakes basin is gradually tipping. There are five diversions in the Great Lakes basin. The Long Lac and Ogoki diversions bring water into Lake Superior from the Hudson Bay watershed. The Lake Michigan Diversion at Chicago removes water from Lake Michigan for water supply, sewage disposal and commercial navigation. The Welland Canal provides a shipping route around Niagara Falls and moves water from Lake Erie to Ontario that would have naturally flowed down the Niagara River. The New York State Barge Canal diverts a small amount of water from the Niagara River and returns the water to Lake Ontario. In all, the net amount of water diverted into the Great Lakes basin exceeds that diverted out. Lake Superior outflows are controlled near the twin cities of Sault Ste. Marie, Ontario and Michigan. The current flow control facilities consist of three hydropower plants, five navigation locks and a 16-gated control structure, called the Compensating Works. Lake Superior outflows have been regulated since 1921 by the International Lake Superior Board of Control in accordance with conditions specified by the International Joint Commission (IJC). The IJC, a binational agency of the United States and Canada, is responsible for oversight of the terms of the 1909 Boundary Waters Treaty between the two nations. Lake Superior s outflows are adjusted monthly, taking into consideration the water levels of lakes Superior and Michigan- Huron. The objective is to help maintain the lake levels on both lakes in relative balance compared to their long-term seasonal averages. Regulation of Lake Superior s outflow has an effect on water levels, but to a far lesser extent than natural factors. There have been numerous alterations made to the St. Clair River since the mid 1800s, mainly for the support of commercial navigation. While much of the dredging has been performed by USACE, they have been internationally developed and approved projects to benefit the Great Lakes region. The last major deepening, for the 27 foot navigation project in the St. Clair River, was completed in Studies completed at that time determined that all the dredging in the St. Clair River since the mid-1800s would lower Lake Michigan-Huron water levels 10 to 16 inches. These studies included preliminary investigations into types of structures that could be constructed to mitigate for the lower levels experienced due to the projects. Authorization from the 1950s (for the 1960s deepening project) to study and construct structures for compensation may remain and the Corps is currently verifying that authorization status. The recently completed International Upper Great Lakes Study (IUGLS), which was commissioned by the International Joint Commission (IJC), investigated changes in flows through the St. Clair River and possible drivers for changes in water level relationships between Lake Michigan-Huron and Erie. You can find this report at the IUGLS website at 3
25 Current Great Lakes Water Level Conditions Great Lakes water levels for 2012 and 2013, as well as forecasted levels to August 2013 are shown in Figures 4 and 8. Note that currently all of the Great Lakes are below their long-term averages. In December 2012 and January 2013, Lake Michigan-Huron s water level reached record lows for those months. The January 2013 level was the lowest monthly mean recorded since Lakes Superior, St. Clair, Erie, and Ontario are not forecasted to set record low water levels. Figure 5 shows the monthly precipitation values since January 2010 as compared to their monthly averages, while Figure 6 shows the monthly evaporation since January 2009, in terms of their difference above or below average. This information provides insight into the differing hydrologic conditions experienced across the Great Lakes basin in the last few years. Lake Superior s monthly average water level for February 2013 ( ft) was 8 inches above the lowest recorded level of February ( ft) which was set in The current forecast shows the water level of Lake Superior remaining well below its long-term average but above its record low water levels during the next six months. Since April 1998 Lake Superior has been below its long-term average ( ) and is currently in the longest period of below average water levels in recorded history. Natural factors contributing to recent low water levels on Lake Superior include: Evaporation in 2012 was 14 inches greater than average Evaporation in 2011 was 8 inches more than average Evaporation in 2010 was 5 inches above average Precipitation in 2012 was 3 inches less than average Precipitation in 2011 was 3 inches less than average Precipitation in 2010 was nearly 2 inches below average Lake Michigan-Huron has been below long-term average water levels since January 1999 and is currently in its longest period of below average water levels in recorded history. The February 2013 level of was 1 inch above the February record low. The most probable forecast for the next six months shows Michigan-Huron remaining 2 to 6 inches above record lows over the next 6 months. Natural factors contributing to recent low levels on Lake Michigan-Huron include: Evaporation in 2012 was 12 inches greater than average Evaporation in 2011 was near average Evaporation in 2010 was 5 inches above average Precipitation in 2012 was 4 inches below average Precipitation in 2011 was 3 inches above average Precipitation in 2010 was 1 inch below average 4
26 Lake St. Clair began 2012 with above average water levels but has since fallen to below average levels. It is currently 9 inches below average and 18 inches below last year s levels. The most probable forecast for the next six months shows the lake remaining below average and last year s levels, but above its record lows. Significant natural factors include: Evaporation in 2012 was 3 inches greater than average Evaporation in 2011 was 6 inches below average Evaporation in 2010 was 9 inches above average Precipitation in 2012 was 2 inches less than average Precipitation in 2011 was 10 inches greater than average Precipitation in 2010 was near average Lake Erie was above, below and at average water levels in It is currently 5 inches below average and 20 inches below last year s levels. Lake Erie had no seasonal rise during 2012, which is the first such occurrence in the period of record. The most probable forecast for the next six months shows the lake will remain below average and last year s level, but well above its record low levels. Significant natural factors include: Evaporation in 2012 was 13 inches greater than average Evaporation in 2011 was 3 inches below average Evaporation in 2010 was 6 inches above average Precipitation in 2012 was 4 inches less than average Precipitation in 2011 was 16 inches above average Precipitation in 2010 was near average Lake Ontario was also above, below and at average water levels in It is currently 3 inches below average and 19 inches below last year s levels. The most probable forecast for the next six months shows the lake will remain below average, but it may surpass last year s levels starting in May Lake Ontario is forecasted to remain more than 2 feet above its record low levels. Significant natural factors include: Evaporation in 2012 was 11 inches greater than average Evaporation in 2011 was 1 inch more than average Evaporation in 2010 was 5 inches above average Precipitation in 2012 was 5 inches less than average Precipitation in 2011 was 4 inches above average Precipitation in 2010 was 1 inch below average Forecasted water levels are highly dependent on the supply of water the lakes are expected to receive over the coming months. The U.S. Army Corps of Engineers, in coordination with Environment Canada, will continue to monitor basin conditions and provide updated information on our website at Additional web links of interest are listed in Appendix D. 5
27 Minnesota Duluth Missi ssippi Wisconsin Illinois Albany R i ive r B a s n Riv er Chicago Sanitary & Ship Canal Illinois Waterway Bas in Lake Nipigon Thunder Bay Lake Green Bay Milwaukee Ogoki Project Nipigon River Chicago Ogoki River Superior Lake Keweenaw Peninsula Green Bay ig n Mich a Indiana Albany Diversion Dam Control Dam Diversion Dam Long Lake Great Long Lake Project Control Dam Aguasabon River Canada United States Sault Ste. Marie Straits Of Mackinac Lakes Kenogami River Michigan Bay City St. Clair River Lake St. Clair Detroit Detroit River Toledo Ohio River Ontario Sault Ste. Marie Lake Superior Control Structure St. Marys River Lake Drainage Cleveland Georgian Bay Great Lakes - St. Lawrence River System Huron Lake Erie Hudson Bay The Great Lakes Basin 14,000 miles of shoreline 95,000 square miles of water 200,000 square miles of land 8 States & 2 Provinces Basin Toronto Welland Canal Ottawa Lake Pennsylvania PENNSYLVANIA Ontario Quebec Oswego Rochester Niagara River Buffalo Niagara Falls River Ottawa Cornwall Massena St. Lawrence River Kingston Cape Vincent New York Montreal LAKE ST. LOUIS St. Lawrence River Control structure

28
29 feet Lake Superior Lake Michigan-Huron Great Lakes Water Levels ( ) Monthly Mean Level Long Term Annual Average meters meters feet feet Lake St. Clair Lake Erie meters meters meters feet feet feet Lake Ontario The monthly average levels are based on a network of water level gages located around the lakes. Elevations are referenced to the International Great Lakes Datum (1985).
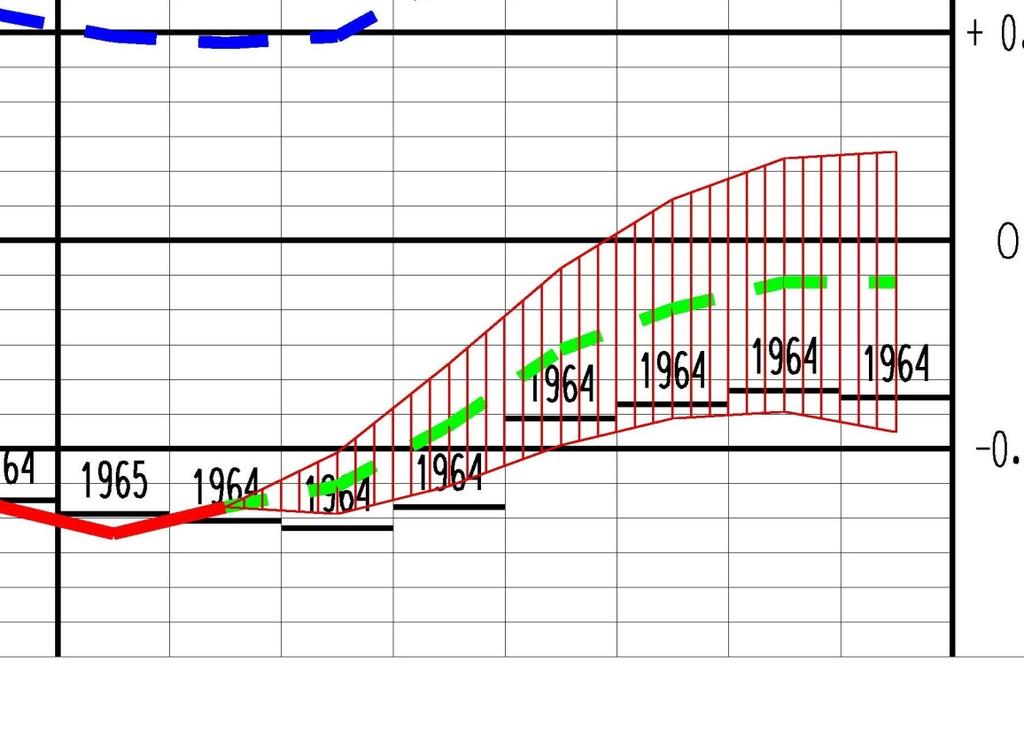
30 Ft. MAR APR MAY JUN JUL AUG SEP OCT NOV DEC JAN FEB MAR APR MAY JUN JUL AUG SEP OCT NOV DEC JAN FEB MAR APR MAY JUN JUL AUG M US Army Corps 0-1 CHART DATUM FEET (183.2 METERS) LAKE SUPERIOR of Engineers Detroit District MONTHLY BULLETIN OF LAKE LEVELS FOR THE Ft. MAR APR MAY JUN 2011 JUL AUG SEP OCT NOV DEC JAN FEB MAR APR MAY 2012 JUN JUL AUG SEP OCT NOV DEC JAN FEB MAR 2013 APR MAY JUN JUL AUG M. GREAT LAKES MARCH Water levels for the previous year and the current year to date are shown as a solid line on the hydrographs. A projection for the next six months is given as a dashed line. This Ft Ft MAR MAR CHART DATUM FEET (176.0 METERS) LAKES MICHIGAN-HURON 2011 APR MAY JUN JUL AUG SEP OCT NOV DEC JAN CHART DATUM FEET (174.4 METERS) LAKE ST. CLAIR 2011 APR MAY JUN JUL AUG SEP OCT NOV DEC JAN FEB FEB MAR MAR 1964 APR 1926 APR MAY MAY JUN JUL 2012 JUN JUL 1964 AUG AUG 1964 SEP SEP 1964 OCT OCT 1964 NOV NOV 1964 DEC 1964 DEC 1965 JAN 1936 JAN FEB 1926 FEB MAR MAR APR MAY APR MAY JUN JUN 1964 JUL JUL 1964 AUG AUG M M ELEVATIONS REFERENCED TO THE CHART DATUM OF EACH RESPECTIVE LAKE projection is based on the present condition of the lake basin and anticipated future weather. The shaded area shows a range of possible levels over the next six months dependent upon weather variations. Current and projected levels (solid and dashed lines) can be compared with the average levels (dotted line) and extreme levels (shown as bars with their year of occurrence). The legend below further identifies the information on the hydrographs. LEGEND LAKE LEVELS RECORDED PROJECTED AVERAGE ** 1985 MAXIMUM ** MINIMUM ** The levels on the hydrographs are shown in both feet and meters above (+) or below (-) Chart Datum. Chart Datum, also known as Low Water Datum, is a reference plane on each lake to which water depth and Federal navigation improvement depths on navigation charts are referred. All elevations and plots shown in this bulletin are referenced to International Great Lakes Datum 1985 (IGLD 1985). IGLD 1985 has its zero base at Rimouski, Quebec near the mouth of the St. Lawrence River (approximate sea level). FEBRUARY MEAN LAKE LEVELS (IGLD 1985) Superior Mich- Huron St. Clair Erie Ontario 0-1 CHART DATUM FEET (173.5 METERS) LAKE ERIE * 2013 Ft. M Ft M Ft Ft. MAR APR MAY JUN JUL AUG SEP OCT NOV DEC JAN FEB MAR APR MAY JUN JUL AUG SEP OCT NOV DEC JAN FEB MAR APR MAY JUN JUL AUG M. ** MAX. M Yr. Ft ** MIN. M. Yr ** AVG. Ft M * provisional ** Average, Maximum and Minimum for period CHART DATUM FEET (74.2 METERS) LAKE ONTARIO
 Lake Erie Precipitation (2010-2013) Precip (in) 7.00 6.00 5.00 4.00 3.00 2.00 1.00 0.00 Jan-10 Jan-11 Jan-12 Jan-13 Precip (in) 8.00 7.00 6.00 5.00 4.00 3.00 2.00 100 1.")
31 Lake Superior Precipitation ( ) Lake Michigan-Huron Precipitation ( ) Precip (in) Jan-10 Jan-11 Jan-12 Jan-13 Precip (in) Jan-10 Jan-11 Jan-12 Jan-13 Lake St. Clair Precipitation ( ) Lake Erie Precipitation ( ) Precip (in) Jan-10 Jan-11 Jan-12 Jan-13 Precip (in) Jan-10 Jan-11 Jan-12 Jan-13 Lake Ontario Precipitation ( ) U.S. Army Corps of Engineers Detroit District Precip (in) Jan-10 Jan-11 Jan-12 Jan-13 Actual Average 5-Feb-13
32 Difference from average, mm Evaporation on Lake Superior Jan-09 Jan-10 Jan-11 Jan-12 Jan-13 Month Evaporation on Lake St. Clair Difference from average, mm Evaporation on Lake Michigan-Huron Jan-09 Jan-10 Jan-11 Jan-12 Jan-13 Month Evaporation on Lake Erie Differenc ference from average, mm Difference from average, mm Jan-09 Jan-10 Jan-11 Jan-12 Jan-13 Jan-09 Jan-10 Jan-11 Jan-12 Jan-13 Month Month Evaporation on Lake Ontario U.S. Army Corps of Engineers Detroit District Difference from average, mm Jan-09 Jan-10 Jan-11 Jan-12 Jan-13 Month 5-Feb-13
33 U.S. Army Corps of Engineers Detroit District Hydrologic Components Flow from upstream lakes, evaporation and precipitation influence lake levels. This graph illustrates the relative influence of each of those factors on the Great Lakes system. Values are based on a monthly average and are represented as thousand cubic feet per second. Note that the net amount of water diverted into the Great Lakes is greater than the amount diverted out. The Welland and NY State Barge canals are intra-basin diversions, meaning the diverted water does not leave the Great Lakes basin. LONG LAKE, OGOKI DIVERSIONS 5 CONSTANT LEVEL Superior 57% in is precipitation 39% in is runoff 4% in from diversions 40% out is evaporation 60% out is outflow RUNOFF FROM LAKE PRECIPITATION ON LAKE OUTFLOW LAKE SUPERIOR EVAPORATION FROM LAKE LAKE SUPERIOR OUTFLOW TO MICH-HURON Mich-Huron* 39% in is precipitation 32% in is runoff 29% in is inflow 31% out is evaporation 68% out is outflow 1% out thru Chi. Diversion *Lakes Michigan and Huron are considered to be one lake, as they rise and fall together due to their union at the Straits of Mackinac. CONSTANT LEVEL 78 LAKES MICH-HURON 87 CONSTANT LEVEL 25 LAKE MICH-HURON OUTFLOW TO ERIE CHICAGO DIVERSION LAKE ERIE WELLAND CANAL 7 Erie 79% in is inflow 11% in is precipitation 10% in is runoff 89% out is outflow 11% out is evaporation LAKE ERIE OUTFLOW TO ONTARIO NY STATE BARGE CANAL 1 Ontario 80% in is inflow 13% in is runoff 7% in is precipitation 95% out is outflow 5% out is evaporation CONSTANT LEVEL LAKE ONTARIO 14 LAKE ONTARIO OUTFLOW TO THE SEA 251
34 Lake Superior Lake Michigan-Huron Difference from Datum (inches) Chart Datum = ft Difference from Datum (inches) Chart datum = ft Jan Feb Mar Apr May Jun Jul Aug Sep Oct Nov Dec Jan Feb Mar Apr May Jun Jul Aug Sep Oct Nov Dec Lake St. Clair Lake Erie Difference from Datum (inches) Chart datum = ft Jan Feb Mar Apr May Jun Jul Aug Sep Oct Nov Dec Difference from Datum (inches) Chart datum = ft Jan Feb Mar Apr May Jun Jul Aug Sep Oct Nov Dec Lake Ontario U.S. Army Corps of Engineers Detroit District Difference from Datum (inches) Chart datum = ft 0.00 Jan Feb Mar Apr May Jun Jul Aug Sep Oct Nov Dec Forecast Long Term Average 3/4/2013
35 Great Lakes low water levels 2013 (AS OF: 4 March 2013) CURRENT 1) Lake Michigan-Huron s February 2013 monthly mean water level was ft, which was 1 inch ABOVE the February record low. The lake remained well below (27 inches) is long-term average. 2) Lake Michigan-Huron s January 2013 monthly mean water level set an all-time record low at ft. This is lower than any other month in the entire period of record, which goes back to The previous all-time record low was set in March 1964 at ft. All elevations are referenced to the 1985 International Great Lakes Datum. 3) The most probable forecast from our most recent 6 month bulletin shows Lake Michigan-Huron remaining 2 to 7 inches ABOVE record lows through August. If dry conditions are experienced in the Michigan-Huron basin during the next few months, water levels could return to record lows. 4) Lakes Superior and Michigan-Huron have been below average for 14 straight years, the longest stretch in each of their recorded histories. 5) Current forecasts for Lakes Superior, St. Clair, Erie, and Ontario do not call for record low levels given any scenario. 6) All the Great Lakes are below their long term averages. Only Lake Superior is above its level of a year ago. All the Great Lakes are expected to remain below their long term averages (LTA) for at least the next 6 months. Even under very wet scenarios, Michigan-Huron will remain below its LTA for a much longer period of time. 7) Lake Superior and Lake Michigan-Huron are currently below low water datum and expected to remain below datum through the next several months. At the start of the navigation season later this month, levels on Lake Superior and Michigan-Huron are expected to be 12 and 15 inches below datum, respectively. Lake Michigan- Huron is projected to still be 3 inches below datum in August. 8) The lack of a solid snowpack during the winter of 2011 to 2012, coupled with the very hot and dry summer of 2012, are the biggest factors leading to the lower water levels this year. Snowmelt runoff and spring precipitation are the largest contributors to the seasonal rises on all the Great Lakes. Evaporation, a major component of water loss from the system, was also well above average during the heat wave of 2012 and continuing into the autumn and winter months. U.S. ARMY CORPS OF ENGINEERS Detroit District 477 Michigan Ave Detroit, MI 48226
36 9) In an average year, Lake Michigan-Huron s seasonal rise is close to 12 inches. Because of dry conditions throughout the basin, the lake s rise was only about 4 inches in Lakes St. Clair and Erie have average seasonal rises of about 15 inches, but in 2012 both lakes had no seasonal rise, but rather have been either steady or declining since January This was the first time in its recorded history that Lake Erie did not have a seasonal rise. 10) Conditions needed for the lakes to make gains with respect to their long term averages include heavy snow (not lake effect) during the winter months and plentiful spring rainfall. Snow water equivalent values across northern Ontario, the U.P. of Michigan, northern/eastern Wisconsin and the Arrowhead of Minnesota are higher than those of The official spring outlook, issued by the National Weather Service shows the potential for above average precipitation in March, April and May. These conditions may lead to an average or above average seasonal rise for the Great Lakes. 11) There are no discernible long term cycles of water levels apparent over our period of record ( ) for Great Lakes water levels. While the historical record shows periods of high and low water, it is not possible to predict with any certainty when/if water levels would return to long term average levels. Lake levels could go higher or lower from their current levels in future years. U.S. ARMY CORPS OF ENGINEERS Detroit District 477 Michigan Ave Detroit, MI 48226

37 DETROIT DISTRICT U.S. ARMY CORPS OF ENGINEERS CELRE-HH-W 477 MICHIGAN AVENUE DETROIT, MICHIGAN FEBRUARY 2013 GREAT LAKES WATER LEVEL SUMMARY LAKE SUPERIOR The average water level of Lake Superior for the month of February was feet, which was 1 inch below January s level. The February level was 10 inches below chart datum, 12 inches below long-term average (LTA), and 1 inch above the level of one year ago. Lake Superior continues its 14 year stretch of below LTA water levels, the longest period of below average levels in its recorded history dating back to Precipitation on the Lake Superior basin was below average in February and has been below average over the past 12 months. The water level of Lake Superior is forecasted to be 8 to 13 inches above record low water levels over the next six months. Superior is expected to be 10 to 11 inches below chart datum through April and then gradually rise to 3 inches above chart datum by August. The water levels are forecasted to range 0 to 2 inches below last year s levels and 10 to 11 inches below LTA through August. LAKE MICHIGAN-HURON The February 2013 monthly mean water level for Lake Michigan-Huron was feet, rising 2 inches from January s all-time record low water level. The February 2013 level was 1 inch above the previous record low water level for February of feet set in The February level was 16 inches below datum, 14 inches below its level of last year, and 27 inches below its LTA. Lake Michigan-Huron also continues a 14 year stretch of below average levels, the longest in its period of record. The most probable line of the latest forecast shows Michigan-Huron remaining 2 to 7 inches above record lows through August. However, if the basin receives dry conditions over the next few months the water level could again return to near record lows. The lake is forecasted to range from 7 to 15 inches below chart datum through May and then 3 to 5 inches below datum for June, July, and August. The water levels are expected to remain 24 to 26 inches below LTA through August. LAKE ST. CLAIR Lake St. Clair s monthly mean water level for February 2013 of feet rose 1 inch from January s level. During February, Lake St. Clair was 18 inches below last year s level and 9 inches below LTA. Lake St. Clair s water levels are projected to range 5 to 14 inches below last year s levels through June and then be 1 to 3 inches below the levels of a year ago during July and August. The lake is expected to range 10 to 13 inches below LTA through August. LAKE ERIE Lake Erie s average water level was feet in February, which was 2 inches above January s level. February s water level was 20 inches below last year s level and 5 inches below LTA. The Lake Erie basin received near average precipitation in February and has received 88% of average precipitation over the last 12 months. Lake Erie is forecasted to be 9 to 16 inches below its levels of a year ago through April and then be 1 to 5 inches below last year for May through August. The water levels are expected to be 5 to 9 inches below LTA over the next six months. LAKE ONTARIO The level of Lake Ontario for February was 6 inches higher than January s level with a mean of feet. The February water level was 19 inches below last year s level and 3 inches below LTA. Lake Ontario received above average precipitation in February, with the total being 118% of average. During the last 12 months, precipitation over the basin has been 88% of average. The lake is forecasted to range between 12 inches above and 14 inches below its levels of a year ago through August. Lake Ontario s water level is projected to be between 2 inches below and 3 inches above LTA over the next six months.
38 Useful Great Lakes Web Addresses 2013 International Lake Superior Board of Control: International Niagara River Board of Control International St. Lawrence River Board of Control: International Joint Commission: International Upper Great Lakes Study USACE Detroit District Web Page: USACE Buffalo District Web Page: Detroit District Water Level Bulletin: Canadian Water Level Bulletin: Great Lakes Information Network: Canadian Hydrographic Service (CHS): Great Lakes Nautical Charts (U.S.) CHS - Nautical Charts (Canadian): (Click on 'Forecasts' under "Water Levels") National Oceanic and Atmospheric Administration Water levels: CHS Hourly Water Levels: Environment Canada Weather Radar - Ontario: Environment Canada Marine Weather Forecasts: National Weather Service Environment Canada 5-Day Weather Outlooks - Ontario: NOAA Climatological Outlooks Environment Canada Climatological Outlooks: U.S. Real-Time Streamflows (U.S.G.S.) Canadian Real-Time Streamflows: Crustal Movement Report: Seaway:
Introducing the Great Lakes
 Introducing the Great Lakes Just a few years ago, geologically speaking, a glacier passed this way, and that's why the Midwest has the Great Lakes. Size The Great Lakes and their connecting channels form
Drought: What is the Status?
 Drought: What is the Status? Nolan J. Doesken Colorado Climate Center Colorado State University http://ccc.atmos.colostate.edu Presented at 2005 Peak to Prairie Landscape Symposium, February 11, 2005,
Seasonal Summary. For The Great Lakes. Winter
 Seasonal Summary For The Great Lakes Winter 2007-2008 Produced by the North American Ice Service August 2008 Table of Contents General General overview of the past season...4 Lake Superior...9 Lake Michigan
Properties. terc.ucdavis.edu 8
 Physical Properties 8 Lake surface level Daily since 1900 The lowest lake level on record was 6,220.26 feet on Nov. 30, 1992. Since 1900, lake level has varied by more than 10 feet. Lake level typically
CCoWS. Central Coast Watershed Studies. Summary of Precipitation and Streamflow for Potrero and San Clemente Creeks in 2010
 Central Coast Watershed Studies CCoWS Summary of Precipitation and Streamflow for Potrero and San Clemente Creeks in Water-Year 2010 Santa Lucia Preserve Monterey County, California Publication No. WI-2011-01
National Maritime Center
 National Maritime Center Providing Credentials to Mariners (Sample Examination) Page 1 of 8 Choose the best answer to the following Multiple Choice Questions. 1. Assume that your vessel has just entered
Tuesday, January 11, :11 AM (CST)
") Tuesday, January 11, 2011 11:11 AM (CST) -Assessment of current water conditions - Precipitation Forecast - Recommendations for Drought Monitor Upper Colorado Normal Precipitation Upper Colorado River
Tuesday, January 11, 2011 11:11 AM (CST) -Assessment of current water conditions - Precipitation Forecast - Recommendations for Drought Monitor Upper Colorado Normal Precipitation Upper Colorado River
MBMG Butte Mine Flooding Monthly Report BMFOU Consent Decree BU-SEH Remedial Action Monitoring Program Contract No TO-35 September 2013
 MBMG Monthly Report BMFOU Consent Decree 02-35-BU-SEH Remedial Action Monitoring Program Contract No. 400022-TO-35 September 20 The Montana Bureau of Mines and Geology (MBMG) continued to perform monitoring
Drought or Not? Nolan J. Doesken Colorado Climate Center Colorado State University
 Drought or Not? Nolan J. Doesken Colorado Climate Center Colorado State University http://ccc.atmos.colostate.edu Presented at Horticultural Art Society meeting, November 19, 2004, Colorado Springs, Colorado
SECTION 2 HYDROLOGY AND FLOW REGIMES
 SECTION 2 HYDROLOGY AND FLOW REGIMES In this section historical streamflow data from permanent USGS gaging stations will be presented and discussed to document long-term flow regime trends within the Cache-Bayou
Drought! When Do We Know It s Over?
 Drought! When Do We Know It s Over? Nolan J. Doesken Colorado Climate Center Colorado State University http://ccc.atmos.colostate.edu Presented at the 2004 Peak to Prairie Landscape Symposium, February
Geography/IEW ages All Saints Home School Cooperative 8:30 9:20 Instructor: Mary Kratz,
 / ages 10 11 All Saints Home School Cooperative 8:30 9:20 Instructor: Mary Kratz, deers.cry@gmail.com, 651 815 7688 Supplies Needed for class: Paddle to the Sea Tree in the Trail Minn of the Mississippi
COMPARISON OF FIXED & VARIABLE RATES (25 YEARS) CHARTERED BANK ADMINISTERED INTEREST RATES - PRIME BUSINESS*
 CHARTERED BANK ADMINISTERED INTEREST RATES - PRIME BUSINESS*") COMPARISON OF FIXED & VARIABLE RATES (25 YEARS) Fixed Rates Variable Rates FIXED RATES OF THE PAST 25 YEARS AVERAGE RESIDENTIAL MORTGAGE LENDING RATE - 5 YEAR* (Per cent) Year Jan Feb Mar Apr May Jun Jul
COMPARISON OF FIXED & VARIABLE RATES (25 YEARS) Fixed Rates Variable Rates FIXED RATES OF THE PAST 25 YEARS AVERAGE RESIDENTIAL MORTGAGE LENDING RATE - 5 YEAR* (Per cent) Year Jan Feb Mar Apr May Jun Jul
Hydrological Condition Report including the issues of High Flow Fluctuation in Chiang Saen
 Hydrological Condition Report including the issues of High Flow Fluctuation in Chiang Saen Technical Symposium for ESCIR and MRC on Social Impact Assessment in River Basin Management Sothea KHEM, HENG
The Awesome, Wonderful, Beautiful, Exciting and Terrible Climate of the West What a Hoot!
 The Awesome, Wonderful, Beautiful, Exciting and Terrible Climate of the West What a Hoot! Nolan J. Doesken, State Climatologist Colorado Climate Center Presented to Four States Irrigation Council, 54 th
Manitoba Water Stewardship. Coping with Drought. Drought Research Initiative Workshop. Inn at the Forks, Winnipeg. A.A. Warkentin. January 11-13, 2007
 Manitoba Water Stewardship Coping with Drought Drought Research Initiative Workshop Inn at the Forks, Winnipeg A.A. Warkentin January 11-13, 2007 Annual Renewal of Water Supplies Important Precipitation-based
Drought and the Climate of the Ogallala Aquifer
 Drought and the Climate of the Ogallala Aquifer Nolan J. Doesken Colorado Climate Center Colorado State University Presented at Ogallala Symposium, Wray, Colorado February 20, 2006 Prepared by Odie Bliss
Table 1. Monthly precipitation totals from the on-site rain gage and from the Dulles weather station and their differences.
 Table 1. Monthly precipitation totals from the on-site rain gage and from the Dulles weather station and their differences. Precipitation Month On-Site Rain Dulles Weather Difference Ratio 1996-97 Gage
8/29/20098 SAHRA - Watershed Visualization
 Module 3 Narration Southwestern Water Cycle 001.wav 26 sec 002.wav 10 sec 003 wav 17 sec Water on Earth is constantly on the move. Water continually circulates between the surface of Earth and the atmosphere
Nolan Doesken. Colorado Climate Center.
 Nolan Doesken Colorado Climate Center Presented to: Colorado Conservation Tillage Association, Greeley, CO, February 1-2, 1 2005 http://ccc.atmos.colostate.edu Prepared by Odie Bliss 1 Key Features of
Adopted Regulation Strategy LWCB Regulation Meeting - March 22, 2010
 Adopted Regulation Strategy LWCB Regulation Meeting - March 22, 2010 The Lake of the Woods Control Board held a Regulation Meeting in Kenora on March 25, 2010 and adopted the following strategy. The strategy
TROUT CREEK WATERSHED (Second Year of Snowline Data)
") Extent of Snow Cover During the 2002 Spring Freshet For the TROUT CREEK WATERSHED (Second Year of Snowline Data) (Penticton Forest District) 1.0 INTRODUCTION The extent of snow cover over a watershed basin
Extent of Snow Cover During the 2002 Spring Freshet For the TROUT CREEK WATERSHED (Second Year of Snowline Data) (Penticton Forest District) 1.0 INTRODUCTION The extent of snow cover over a watershed basin
Great Lakes Shipping Across The Country & Around The World Great Lakes Floor Map: Shipping and Receiving Cargo on the Great Lakes
 Lesson #1 Lesson #2 Great Lakes Shipping Across The Country & Around The World Great Lakes Floor Map: Shipping and Receiving Cargo on the Great Lakes Laura Mikesell Laura.Mikesell@gpschools.org Parcells
A Snapshot of Our Changing Climatology
 A Snapshot of Our Changing Climatology Dr. Kenneth ( Kenny ) Blumenfeld Sr. Climatologist DNR State Climatology Office 11/17/2018 1 Items to bear in mind 1. Climate news elsewhere may not apply here 2.
Adopted Regulation Strategy Lake of the Woods Control Board Regulation Meeting March 12, 2013
 Adopted Regulation Strategy Lake of the Woods Control Board Regulation Meeting March 12, 2013 The Lake of the Woods Control Board held a Regulation Meeting March 12, 2013 in Kenora. The strategy was formulated
The Summer of 2007: A Look at Niagara
 The Summer of 27: A Look at Niagara By Wayne Heinen (maps generated by Piper McKinnon) OVERVIEW The summer of 27 was yet another challenging growing season. One look at the inch-wide cracks in the soil,
NYS Coastal Waters. Water Resources of NYS: THE NATURE of the COASTAL ZONE. NYS Coastal Waters. NYS Coastal Atlas. Coastal Zone Management 10/10/2014
 Water Resources of NYS: THE NATURE of the COASTAL ZONE NYS Coastal Waters NYS is the only state to border the Atlantic Ocean and the Great Lakes (Lakes Erie and Ontario). Great Lakes shoreline: 577 miles
13. TIDES Tidal waters
 Water levels vary in tidal and non-tidal waters: sailors should be aware that the depths shown on the charts do not always represent the actual amount of water under the boat. 13.1 Tidal waters In tidal
Water budgets of the two Olentangy River experimental wetlands in 2001
 Water Budgets 23 Water budgets of the two Olentangy River experimental wetlands in 2001 Li Zhang and William J. Mitsch School of Natural Resources, The Ohio State University Introduction Hydrologic conditions
PROFILE OF SACRAMENTO RIVER, FREEPORT TO VERONA, CALIFORNIA,
 PROFILE OF SACRAMENTO RIVER, FREEPORT TO VERONA, CALIFORNIA, FLOOD OF FEBRUARY 1986 By J.C. Blodgett and J.B. Lucas U.S. GEOLOGICAL SURVEY Open-File Report 88-82 CO CM I m r-h CM Sacramento, California
Weather and Climate Impacts on Water Supply
 Weather and Climate Impacts on Water Supply Nolan Doesken Colorado Climate Center Atmospheric Science Department Colorado State University http://ccc.atmos.colostate.edu Presented at the South Platte Forum,
Response of a Newly Created Marsh-Wetland Affected by Tidal Forcing, Upland Discharge, and Groundwater Interaction
 Response of a Newly Created Marsh-Wetland Affected by Tidal Forcing, Upland Discharge, and Groundwater Interaction Mouth of Columbia River, Cape Disappointment State Park, Washington 12 Hans R. Moritz
Colorado Weather and Climate Update
 Colorado Weather and Climate Update Nolan J. Doesken State Climatologist Colorado Climate Center, Atmospheric Science Department, Colorado State University Presented to Colorado Livestock Association,
Albeni Falls Dam Downstream Water Temperature Study Interim Results
 Albeni Falls Dam Downstream Water Temperature Study Interim Results Amy Reese, Chief Water Management Section Seattle District June 24, 2014 US Army Corps of Engineers What we hope to cover today Albeni
Staying in Tune with South Florida s Water Cycle for Scientists, Managers, and Policy Makers in 5 Minutes per Week
 Staying in Tune with South Florida s Water Cycle for Scientists, Managers, and Policy Makers in 5 Minutes per Week Robert Sobczak (Big Cypress Nat l Pres), Todd Hopkins (FWS), Kevin Kotun (Everglades National
NOTE ->->-> DUE THURSDAY APRIL 20 TH 2006 THAT IS CORRECT I FORGOT THIS IS EASTER WEEKEND SO I HAVE EXTENDED THE DUE DATE TO THE ABOVE
 GEO 130 NAME OCEANOGRAPHY TEST 3 TAKE HOME TEST SPRING 2006 NOTE ->->-> DUE THURSDAY APRIL 20 TH 2006 THAT IS CORRECT I FORGOT THIS IS EASTER WEEKEND SO I HAVE EXTENDED THE DUE DATE TO THE ABOVE This test
MINUTES. International Kootenay Lake Board of Control Public Meeting. Kootenai River Inn 7169 Plaza Street Bonners Ferry, Idaho
 MINUTES Public Meeting Kootenai River Inn 7169 Plaza Street Bonners Ferry, Idaho Wednesday, September 26, 2012 7:30-9:30 PM Attendance United States Canada Chairs Col. Bruce Estok (host) Kirk Johnstone
Monthly Webinar 12.07/2010
 Monthly Webinar 12.07/2010 -Assessment of current water conditions - Precipitation Forecast - Recommendations for Drought Monitor Upper Colorado Normal Precipitation Upper Colorado River Basin Normal
CLAIBORNE LOCK AND DAM PERTINENT DATA
 CLAIBORNE LOCK AND DAM PERTINENT DATA GENERAL Location Clarke, Monroe, & Wilcox Counties, Alabama; Alabama River, river mile 72.5 Drainage area Millers Ferry to Claiborne sq. mi. 836 Total drainage area
ENSO Cycle: Recent Evolution, Current Status and Predictions. Update prepared by Climate Prediction Center / NCEP 8 March 2010
 ENSO Cycle: Recent Evolution, Current Status and Predictions Update prepared by Climate Prediction Center / NCEP 8 March 2010 Outline Overview Recent Evolution and Current Conditions Oceanic Niño Index
Presented to Idaho Washington Aquifer Collaborative February 11, Spokane River Project License
 Presented to Idaho Washington Aquifer Collaborative February 11, 2014 Spokane River Project License Contact Speed Fitzhugh, Spokane River License Manager Telephone - (509) 495-4998 Email - speed.fitzhugh@avistacorp.com
Plan B Dam Breach Assessment
 Plan B Dam Breach Assessment Introduction In support of the Local Sponsor permit applications to the states of Minnesota and North Dakota, a dam breach analysis for the Plan B alignment of the Fargo-Moorhead
CoCoRaHS goes to the Colorado Farm Show
 CoCoRaHS goes to the Colorado Farm Show Nolan J. Doesken Colorado Climate Center, Atmospheric Science Dept, Colorado State University Presented January 25, 2006, Greeley, CO Prepared by Odie Bliss The
Global Climate Change: Just the Facts
 Global Climate Change: Just the Facts Nolan Doesken State Climatologist, Colorado Climate Center Atmospheric Science Department Colorado State University Presented at Club 20 Fall Meeting, Grand Junction,
Little Spokane River Stream Gage Report: Deadman Creek, Dragoon Creek, and the West Branch of the Little Spokane River
 Little Spokane River Stream Gage Report: Deadman Creek, Dragoon Creek, and the West Branch of the Little Spokane River June 2010 Spokane County Conservation District N. 210 Havana St. Spokane, WA 99202
Nolan Doesken Colorado Climate Center
 Nolan Doesken Colorado Climate Center Presented to: Colorado Cattleman s s Association, Pueblo, CO, June 19, 2006 http://ccc.atmos.colostate.edu Prepared by Odie Bliss 1 Let s s Talk About Precipitation
BENEFIT-COST ANALYSIS OF HARBOR DREDGING ON THE GREAT LAKES
 Middle States Geographer, 997,30:55-6 BENEFT-COST ANALYSS OF HARBOR DREDGNG ON THE GREAT LAKES Raymond W. Waxmonsk:y Department of Geography & Planning Buffalo State College Buffalo, NY 4222 ABSTRACT:
Buckland Wind Resource Report
 Buckland Wind Resource Report By: Douglas Vaught, P.E., V3 Energy LLC, Eagle River, Alaska Date: September 17, 2010 Buckland met tower; D. Vaught photo Contents Summary... 2 Test Site Location... 2 Photographs...
The International Joint Commission Kootenay Lake Board of Control
 The International Joint Commission Kootenay Lake Board of Control Columbia Basin Regional Advisory Committee March 9, 2016 Castlegar, BC Presented by: Gwyn Graham IKLBC Canadian Secretary Gwyn.Graham@Canada.ca
Wind Resource Assessment for NOME (ANVIL MOUNTAIN), ALASKA Date last modified: 5/22/06 Compiled by: Cliff Dolchok
, ALASKA Date last modified: 5/22/06 Compiled by: Cliff Dolchok") 813 W. Northern Lights Blvd. Anchorage, AK 99503 Phone: 907-269-3000 Fax: 907-269-3044 www.akenergyauthority.org SITE SUMMARY Wind Resource Assessment for NOME (ANVIL MOUNTAIN), ALASKA Date last modified:
813 W. Northern Lights Blvd. Anchorage, AK 99503 Phone: 907-269-3000 Fax: 907-269-3044 www.akenergyauthority.org SITE SUMMARY Wind Resource Assessment for NOME (ANVIL MOUNTAIN), ALASKA Date last modified:
Coquitlam/Buntzen Project Water Use Plan
 Coquitlam/Buntzen Project Water Use Plan Temperature Monitoring Lower Coquitlam River Project Year 3 Report Reference: COQMON#6 Study Period: March 2008 April 2009 Report Date: April 2009 Trow Associates
Barrier fact sheet. For more info see:
 Barrier fact sheet Barrier Fact Sheet These are the current types of barriers that are being used in the Great s. They attempt to keep sea lampreys from migrating upstream to their spawning grounds. for
The State of the Climate Address
 The State of the Climate Address Nolan J. Doesken Colorado Climate Center, Atmospheric Science Dept, Colorado State University Presented to Colorado Water Officials Association, 2005 Annual Meeting, September
Gayaza High School Geography Department
 THE DEVELOPMENT OF THE SAINT LAWRENCE SEAWAY This is an inland water way partly artificially constructed from the Gulf of St. Lawrence to the Western end of Lake Superior. It covers a distance of 3,800
Finding aid for the Pere Marquette Railroad Co. collection Collection 037
 Finding aid for the Pere Marquette Railroad Co. collection Collection 037 Finding aid prepared by William C. Black This finding aid was produced using the Archivists' Toolkit October 22, 2013 Describing
Colorado River Drought Response and System Sustainability. Chuck Cullom July 16, 2014
 Colorado River Drought Response and System Sustainability Chuck Cullom July 16, 2014 Study Structure and Schedule Summary of Key Activities Upcoming Meetings Further Discussion, Follow-up Colorado River
Wisconsin 511 Traveler Information Annual Usage Summary January 3, Wisconsin 511 Phone Usage ( )
") Wisconsin 511 Traveler Information 211 Annual Usage Summary January 3, 212 Overall to-date Summary 36 months of operation 1,16,63 total calls the 1 Million mark was passed on December 3, 212 3,627,527
Wisconsin 511 Traveler Information 211 Annual Usage Summary January 3, 212 Overall to-date Summary 36 months of operation 1,16,63 total calls the 1 Million mark was passed on December 3, 212 3,627,527
Lower Coquitlam River Project Water Use Plan. Temperature Monitoring Lower Coquitlam River Project Year 2 Report
 Lower Coquitlam River Project Water Use Plan Temperature Monitoring Lower Coquitlam River Project Year 2 Report COQMON#6 Temperature Monitoring Study Lower Coquitlam River Study Period: Year 2-2007 Report
Precipitation Patterns in South Park
 Precipitation Patterns in South Park Nolan J. Doesken, State Climatologist Colorado Climate Center, Atmospheric Science Department, Colorado State University Presented at South Park Symposium, August 3,
Climate Change and Hydrology in the Sierra Nevada. Lorrie Flint U.S. Geological Survey Sacramento CA
 Climate Change and Hydrology in the Sierra Nevada Lorrie Flint U.S. Geological Survey Sacramento CA Discussion Topics Climate change for California Methods to evaluate hydrologic impacts Water balance
Environmental Protection The answer my friend is blowing in the wind
 Environmental Protection The answer my friend is blowing in the wind Nolan Doesken Colorado Climate Center Colorado State University Presented at the Pesticide Conference, November 17, 2005, Denver, CO
CORPS FACTS. Harbor Dredging U.S. ARMY CORPS OF ENGINEERS BUILDING STRONG
 CORPS FACTS Harbor Dredging U.S. ARMY CORPS OF ENGINEERS BUILDING STRONG Disaster Response Sedimentation in the channel is caused by the normal cycle of silt movement, erosion from high water or heavy
ENSO Cycle: Recent Evolution, Current Status and Predictions. Update prepared by Climate Prediction Center / NCEP 4 September 2012
 ENSO Cycle: Recent Evolution, Current Status and Predictions Update prepared by Climate Prediction Center / NCEP 4 September 2012 Outline Overview Recent Evolution and Current Conditions Oceanic Niño Index
STRUCTURE S-65 PURPOSE SPILLWAY OPERATION
 STRUCTURE S-65 This structure is a reinforced concrete, gated spillway with discharge controlled by three cable operated, vertical lift gates, and a reinforced concrete lock structure with two pairs of
Babson Capital/UNC Charlotte Economic Forecast. May 13, 2014
 Babson Capital/UNC Charlotte Economic Forecast May 13, 2014 Outline for Today Myths and Realities of this Recovery Positive Economic Signs Negative Economic Signs Outlook for 2014 The Employment Picture
Canada s Natural Systems. Canadian Geography 1202
 Canada s Natural Systems Canadian Geography 1202 Canada s Natural Systems Natural System: A system found in nature Here are the four natural systems that we will explore in the next few weeks 1. Canada
Meteorology of Monteverde, Costa Rica 2007
 Meteorology of Monteverde, Costa Rica 2007 Technical Report submitted to the Monteverde Institute Andrew J. Guswa, Associate Professor, Picker Engineering Program Amy L. Rhodes, Associate Professor, Department
Site Description: Tower Site
 Wind Resource Summary for Elizabeth Site Final Report Colorado Anemometer Loan Program Monitoring Period: 7/3/6 /15/7 Report Date: December 22, 7 Site Description: The site is.6 miles northeast of the
Neighborhood Influences on Use of Urban Trails
 Neighborhood Influences on Use of Urban Trails Greg Lindsey, Yuling Han, Jeff Wilson Center for Urban Policy and the Environment Indiana University Purdue University Indianapolis Objectives Present new
FISHERIES BLUE MOUNTAINS ADAPTATION PARTNERSHIP
 FISHERIES A warming climate, by itself, substantially affects the hydrology of watersheds in the Blue Mountains. Among the key hydrologic changes projected under all scenarios for the 2040s and beyond
NEVADA SLOT MACHINES: HISTORICAL HOLD PERCENTAGE VARIATIONS ANNUAL AND MONTHLY HOLD PERCENTAGES, CENTER FOR GAMING RESEARCH, NOVEMBER 2017
 NEVADA SLOT MACHINES: HISTORICAL HOLD PERCENTAGE VARIATIONS ANNUAL AND MONTHLY HOLD PERCENTAGES, 2004-2017 CENTER FOR GAMING RESEARCH, NOVEMBER 2017 Executive Summary Hold percentage the portion of money
System Flexibility Indicators
 System Flexibility Indicators Place your chosen image here. The four corners must just cover the arrow tips. For covers, the three pictures should be the same size and in a straight line. Operational Forum
More Than Just a Lake!
 By creating a map of the rivers flowing into your Great Lake, learn how rivers form a watershed. TOPIC Great Lake drainage basins AUDIENCE Grades 1-6; 10-30 students SETTING Large, open indoor space is
OFFICE OF STRUCTURES MANUAL FOR HYDROLOGIC AND HYDRAULIC DESIGN CHAPTER 11 APPENDIX B TIDEROUT 2 USERS MANUAL
 OFFICE OF STRUCTURES MANUAL FOR HYDROLOGIC AND HYDRAULIC DESIGN CHAPTER 11 APPENDIX B TIDEROUT 2 USERS MANUAL APRIL 2011 APRIL 2011 Page 1 Preface TIDEROUT 2, Build 1.22 dated June 29, 2006 is the current
SCIENCE AND TECHNOLOGY: CANADA COAST TO COAST
 ACTIVITY DESCRIPTION: This activity shows the abundance of water in and around Canada. By identifying and labeling a number of water bodies and courses, students realize the magnitude of Canada s water
STUDY PERFORMANCE REPORT
 STUDY PERFORMANCE REPORT State: Michigan Study No.: 427 Project No.: F-81-R-2 Title: Measurement of sportfishing harvest in lakes Michigan, Huron, Erie, and Superior Period Covered: October 1, 2000 to
Variability in the tropical oceans - Monitoring and prediction of El Niño and La Niña -
 Variability in the tropical oceans - Monitoring and prediction of El Niño and La Niña - Jun ichi HIROSAWA Climate Prediction Division Japan Meteorological Agency SST anomaly in Nov. 1997 1 ( ) Outline
THE ATMOSPHERE. WEATHER and CLIMATE. The Atmosphere 10/12/2018 R E M I N D E R S. PART II: People and their. weather. climate?
 R E M I N D E R S Two required essays are due by Oct. 30, 2018. (A third may be used for extra credit in place of a Think Geographically essay.) ESSAY TOPICS (choose any two): Contributions of a noted
2 For education only. Not for sale. All Rights Reservied ButterfliesandBarefootLasses.blogspot.com
 Hi! We're reading Paddle to the Sea by Holling C. Holling this year with our American History studies, and I wanted to flesh things out a little bit with some notebooking. The first page (page 2) is a
APPENDIX B NOAA DROUGHT ANALYSIS 29 OCTOBER 2007
 APPENDIX B NOAA DROUGHT ANALYSIS 29 OCTOBER 2007 ENSO Cycle: Recent Evolution, Current Status and Predictions Update prepared by Climate Prediction Center / NCEP October 29, 2007 Outline Overview Recent
ANNUAL EVALUATION OF 2016 WATER-LEVEL MONITORING DATA FROM THE CITY OF LAS CRUCES WATER SUPPLY WELLS, NEW MEXICO
 ANNUAL EVALUATION OF 216 WATER-LEVEL MONITORING DATA FROM THE CITY OF LAS CRUCES WATER SUPPLY WELLS, NEW MEXICO prepared by Steven T. Finch, Jr., CPG Annie McCoy, CPG Water Resource and Environmental Consultants
AcquaTailings: A Tool for Streamlining Mining Water Budget
 AcquaTailings: A Tool for Streamlining Mining Water Budget Gustavo Pereira, GeoHydroTech Engineering, São Paulo, Brazil, gpereira@ghtengenharia.com.br, hrocha@ghtengenharia.com.br, dhoffert@ghtengenharia.com.br,
Nothing So Constant as Change
 Nothing So Constant as Change By Ron Schaper Dynamic Environments 1) Lake Levels 2) Beach Size 3) Cliff Erosion 4) Beach and Cliff Plant Communities 1) Lake Levels (Michigan/Huron) More than 20,000 years
Appendix G Whitewater Recreation Flow Study Plan
 Appendix G Whitewater Recreation Flow Study Plan Study Plan Whitewater Recreation Flow Study Grandfather Falls Hydroelectric Project FERC Project No. 1966 March 2013 An Integrys Energy Group Company Section
UNDERSTANDING YOUR ESTUARY Level IA- ESTUARY SEARCH
 UNDERSTANDING YOUR ESTUARY Level IA- ESTUARY SEARCH Kakagon/Bad River Sloughs, a Lake Superior estuary located on the Bad River Reservation near Ashland, WI. GOAL Select one Wisconsin estuary to study
GROWING SEASON TEMPERATURES
 Ag-Weather Update: Review of Summer Growing Season & Update on the Wet Forecast for Fall & Winter Paul W. Brown Extension Specialist, Biometeorology College of Agriculture & Life Sciences University of
3. EXCEL FORMULAS & TABLES
 Fall 2017 CS130 - Excel Formulas & Tables 1 3. EXCEL FORMULAS & TABLES Fall 2017 Fall 2017 CS130 - Excel Formulas & Tables 2 Cell References Absolute reference - refer to cells by their fixed position.
First of all, you should know that weather and climate are not the same thing.
 First of all, you should know that weather and climate are not the same thing. WEATHER IS: Short term Limited area Can change rapidly Difficult to predict WEATHER is what s happening outside your window
STUDY PERFORMANCE REPORT
 STUDY PERFORMANCE REPORT State: Michigan Study No.: 427 Project No.: F-81-R-1 Title: Measurement of sportfishing harvest in lakes Michigan, Huron, Erie, and Superior Period Covered: October 1, 1999 to
Pork Outlook. Professor of Agricultural Economics. Midwest/Great Plains & Western Outlook Conference Indianapolis, August 2007
 Midwest/Great Plains & Western Outlook Conference Indianapolis, August 2007 Pork Outlook Ron Plain Professor of Agricultural Economics University of Missouri-Columbia http://web.missouri.edu/~plainr/ Long
Appendix ELP El Paso, Texas 2003 Annual Report on Freeway Mobility and Reliability
 (http://mobility.tamu.edu/mmp) Office of Operations, Federal Highway Administration Appendix ELP El Paso, Texas 2003 Annual Report on Freeway Mobility and Reliability This report is a supplement to: Monitoring
Site Description: LOCATION DETAILS Report Prepared By: Tower Site Report Date
 Wind Resource Summary for Holyoke Site Final Report Colorado Anemometer Loan Program Monitoring Period:: 6/21/26 /6/27 Report Date: December 2, 27 Site Description: The site is 17.4 miles south of the
National Renewable Energy Laboratory. Wind Resource Data Summary Guam Naval Ordnance Annex Data Summary and Retrieval for November 2009
 National Renewable Energy Laboratory Wind Resource Data Summary Guam Naval Ordnance Annex Data Summary and Retrieval for November 2009 Prepared for: National Renewable Energy Laboratory 1617 Cole Boulevard
Lower Mekong Basin. John G. Williams. Petrolia, California.
 Technical Comment on Sabo et al. Designing river flows to improve food security futures in the Lower Mekong Basin John G. Williams Petrolia, California jgwill@frontiernet.net Abstract: Sabo et al. (1)
KC Scout Kansas City s Bi-State Transportation Management Center
 KC Scout Kansas City s Bi-State Transportation Management Center Operations Report May 216 This report contains statistical and operational data of activities at the Scout TMC for the period Sunday, May
Climate briefing. Wellington region, February Alex Pezza and Mike Thompson Environmental Science Department
 Climate briefing Wellington region, February 2016 Alex Pezza and Mike Thompson Environmental Science Department For more information, contact the Greater Wellington Regional Council: Wellington PO Box
Aspects and Case Studies of the Effects of Climate Change on Water Resources. Part II (Case Studies)
") Aspects and Case Studies of the Effects of Climate Change on Water Resources Part II (Case Studies) Manfred Koch Department of Geohydraulics and Engineering Hydrology, University of Kassel, Germany Email:
Aspects and Case Studies of the Effects of Climate Change on Water Resources Part II (Case Studies) Manfred Koch Department of Geohydraulics and Engineering Hydrology, University of Kassel, Germany Email:
Kodiak, Alaska Site 1 Wind Resource Report
 Kodiak, Alaska Site 1 Wind Resource Report Report written by: Douglas Vaught, P.E., V3 Energy LLC, Eagle River, AK Date of report: March 16, 2007 Photo by Doug Vaught, V3 Energy LLC Summary Information
A review of 2015 fatal collision statistics as of 31 December 2015
 A review of fatal collision statistics as of 31 December This report summarises the main trends in road fatalities that have emerged in. This has been prepared by the Road Safety Authority following analysis
Agricultural Weather Assessments World Agricultural Outlook Board
 Texas (8) Missouri (7) South Dakota (6) Kansas (5) Nebraska (5) North Dakota (5) Oklahoma (5) Kentucky (4) Montana (4) California (3) Minnesota (3) New York (3) Pennsylvania (3) Tennessee (3) Wisconsin