ENGINEER S REPORT. for. BROAD BEACH GEOLOGIC HAZARD ABATEMENT DISTRICT MALIBU, CALIFORNIA July 15, 2015 TABLE OF CONTENTS
|
|
|
- Osborne Marshall
- 5 years ago
- Views:
Transcription
1 ENGINEER S REPORT for BROAD BEACH GEOLOGIC HAZARD ABATEMENT DISTRICT MALIBU, CALIFORNIA July 15, 2015 TABLE OF CONTENTS CERTIFICATION OF FILING...1 I. INTRODUCTION...3 II. BACKGROUND...3 III. GEOLOGIC HAZARD ABATEMENT DISTRICT BOUNDARIES...3 IV. SERVICE LEVELS...3 V. SITE HISTORY...4 VI. Page DESCRIPTION OF THE IMPROVEMENTS TO BE IMPLEMENTED BY THE BBGHAD...5 VII. ASSESSMENT METHOD AND BENEFIT...8 VIII. ASSESSMENT LIMIT - BUDGET...11 EXHBIT A Index of Comments on April 2015 Draft Engineers Report and Responses EXHIBIT B - Legal Description EXHIBIT C - BBGHAD Boundary EXHIBIT D - Broad Beach BBGHAD Budget EXHIBIT E - Moffatt & Nichol, Coastal Engineering Appendix to the Broad Beach Geologic Hazard Abatement District Engineer s Report 2015 Update EXHIBIT F - Assessment Diagram v v
2 ENGINEER S REPORT GEOLOGIC HAZARD ABATEMENT DISTRICT BROAD BEACH (Pursuant to the Public Resources Code of the State of California, Section et seq.) CERTIFICATION OF FILING This report is presented at the direction of the Broad Beach GHAD (BBGHAD) Board of Directors. The BBGHAD is intended to provide monitoring and maintenance of improvements related to geologic hazard management within the BBGHAD and to levy and collect assessments in order to perform its activities. The improvements, which are the subject of this report, are defined as any activity necessary or incidental to the prevention, mitigation, abatement, or control of a geologic hazard, construction, maintenance, repair, or operation of improvement; or the issuance and servicing of bonds issued to finance any of the foregoing (Section 26505). This report consists of seven parts, as follows: I. INTRODUCTION II. III. IV. BACKGROUND GEOLOGIC HAZARD ABATEMENT DISTRICT DIAGRAM SERVICE LEVELS V. SITE HISTORY VI. VII. DESCRIPTION OF THE IMPROVEMENTS TO BE IMPLEMENTED BY THE BBGHAD ASSESSMENT METHOD AND BENEFIT VIII. ASSESSMENT LIMIT - BUDGET v v
3 The undersigned respectfully submits the enclosed Engineer s Report. Date: July, 2015 By: ENGEO Incorporated, GE Uri Eliahu I HEREBY CERTIFY that the enclosed Engineer s Report was filed on the day of. Clerk of the Board Broad Beach Geologic Hazard Abatement District Malibu, California I HEREBY CERTIFY that the enclosed Engineer s Report was approved and confirmed by the BBGHAD Board on the day of. Chairman of the Board Broad Beach Geologic Hazard Abatement District Malibu, California APPROVED v v
4 ENGINEER S REPORT for BROAD BEACH GEOLOGIC HAZARD ABATEMENT DISTRICT for the ESTABLISHMENT OF AN ASSESSMENT LIMIT I. INTRODUCTION The Broad Beach Geologic Hazard Abatement District (BBGHAD) was formed by the Malibu City Council on September 12, 2011, pursuant to Resolution No under the authority of the California Public Resources Code, Division 17, Section et seq. II. BACKGROUND On November 6, 2011, pursuant to Resolution No. 2011/03, the BBGHAD Board of Directors approved the Broad Beach Plan of Control (BBGHAD Plan of Control) to allow the BBGHAD to permanently monitor and maintain BBGHAD improvements. The establishment of a real-property-related assessment to fund the BBGHAD responsibilities is described in this Engineer s Report. A previous Engineer s Report was prepared for the BBGHAD, dated January 18, 2012, and was adopted by the BBGHAD Board of Directors pursuant to Resolution No. 2012/02. On April 28, 2015, the BBGHAD published a draft, revised Engineer's Report (April 2015 Draft) reflecting applicable permitting realities associated with the proposed Project (as defined below). The BBGHAD subsequently published updated draft, revised Engineer's Reports on June 24, 2015 ( Draft) and July 17, 2015 (July 2015 Draft). Since the publishing of the April 2015 Draft, the BBGHAD has received and responded to various written comments in connection with the proposed updated Engineer's Report. An index of the comments associated with the April 2015 Draft and the Draft, coupled with the BBGHAD's responses thereto, are attached and incorporated as Exhibit A. Copies of all of the actual comments associated with the April 2015 Draft the Draft, and the BBGHAD's responses thereto, can be reviewed at and III. GEOLOGIC HAZARD ABATEMENT DISTRICT BOUNDARIES The legal description and boundaries for the BBGHAD are attached hereto and incorporated as Exhibits B and C. IV. SERVICE LEVELS The BBGHAD s activities are set forth in the Plan of Control and include certain activities necessary or incidental to the prevention, mitigation, abatement, or control of geologic hazards, including construction, retention, repair, or operation of any improvement, and the issuance and servicing of debt or bonds issued to finance any of the foregoing v v
5 The BBGHAD provides for the administration and review of facilities within the budgeted limits, including the following services: 1. Oversight of BBGHAD operations. 2. In conjunction with the County Assessor s Office, setting the annual levying of assessments on the property tax roll. 3. Engagement of technical professionals to perform the monitoring duties as described in the BBGHAD Plan of Control and as required by various governmental agencies. 4. Performance of BBGHAD construction activities in accordance with the BBGHAD Plan of Control. These activities include, but are not limited to, the following. Beach nourishment and sculpting Construction/restoration of dunes and related natural habitat Beach drainage improvements 5. Performance of BBGHAD preservation activities in accordance with the BBGHAD Plan of Control. These activities include, but are not limited to, the following. Inspection of revetment structures Inspection and preservation of restored dunes. Monitoring of accumulated erosion and beach recession. 6. Preparation of annual BBGHAD budgets. V. SITE HISTORY The Broad Beach area is located at the base of the Santa Monica Mountains and adjacent to Santa Monica Bay in Malibu, western Los Angeles County, California, extending from Point Lechuza on the west to Zuma Beach on the east. Although beach width can vary seasonally as well as from year to year, Broad Beach has been consistently narrowing in width since the early 1970s. The historically wide beach has gradually narrowed due to an imbalance in the sediment budget, i.e., more sand has left the beach system over the past 40 years than entered it. Since the mid-1970s, Broad Beach has lost an average of 20,000 cubic yards per year. This rate accelerated between 2004 and 2009 to approximately 35,000 cubic yards per year. As reported by Moffatt & Nichol, the Engineer of Record for the proposed improvements, Broad Beach is a very narrow ribbon of sand visible primarily at low tide but inundated at moderate to high tide (Moffatt & Nichol, 2015 (Exhibit E)). In general, very little, if any, dry beach exists at higher tide levels, especially in the western portion of the above-described area. Various portions of the beach have been subjected to emergency repair/protective measures in years past due to storms and related erosion events. Temporary armoring (including sandbags) from earlier emergency repairs became increasingly exposed with time, and was subsequently removed or augmented with more robust shoreline v v
6 protection. An emergency rock revetment was installed seaward of 78 Broad Beach parcels in 2010 to protect the private properties (Moffatt & Nichol, 2015). Because of the general and continuing narrowing of the beach, private improvements, including homes, are threatened by high tides and continuing wave action. In order to reduce the risk of damage and/or destruction of these improvements, a beach restoration program will be implemented. Beaches essentially act as coastal storm barriers. A beach s size, shape and sand volume help determine how well the beach can protect a developed area during a storm. The various elements of a beach, including vegetated dunes, the flat portion of the dry sand beach and offshore sand bars, offer a level of natural protection against coastal storms by absorbing and dissipating the energy of breaking waves, either seaward on an offshore bar or directly on the beach itself. To restore the energy-dissipation components to the beach, additional protective measures will be implemented. The profile and geometry of the contemplated beach restoration project ( Project ) have been designed for the protection of private improvements within the BBGHAD (Moffatt & Nichol, 2015). VI. DESCRIPTION OF THE IMPROVEMENTS TO BE IMPLEMENTED BY THE BBGHAD A. Beach Nourishment The BBGHAD-maintained improvements are described in the BBGHAD Plan of Control. In general, these improvements include the following: Sand Nourishment and Beach Replenishment placing beach material to replenish Broad Beach with dry sand between the dune system and shoreline. Revetment Relocating and burying the existing revetment in the landward edge of the widened, nourished beach. The cost of relocation and burying of the existing revetment will be borne by the affected landowners and will not be paid by GHAD assessments. After-the-fact permitting would be undertaken to classify the revetment as a permanent feature. Imported beach quality material would be placed over the existing revetment to create a restored dune. Inland Beach Material Sourcing and Transport Sourcing beach compatible material at an inland site or sites. Dune Building and Restoration Building a reservoir of sand and restoring dune habitat with native plant species. Protection of the beach, dunes, structures, and infrastructure will require nourishment of the beach and restoration of historic dunes and/or improvement of existing dunes. Beach nourishment and sculpting will restore the width of the beach and provide a protective barrier for v v
7 structures and properties, as well as inward stretches of the beach. The habitat restoration, incorporating native vegetation, will reduce erosion to the dune and beach face. When completed, these improvements will repair existing damage and reduce future inundation- and erosion-related damage from storm surges, wave run-up, and overtopping, as described below. The Project will include approximately 300,000 cubic yards of sand nourishment, which will provide approximately 90 feet of dry sand beach seaward of the seaward toe of the restored dune system. Like most beach nourishment projects, the beach will gradually lose sand. Studies indicate that Broad Beach is currently losing sand at a rate of approximately 35,000 cubic yards per year. Thus, while the sand will deplete at different rates depending on weather, tides, and many other factors, a 300,000-cubic-yard initial nourishment should last for the 5-year interval prior to the next major re-nourishment event (Moffatt & Nichol, 2015). Three viable sources of beach-quality sand have been identified; these proposed sources for medium-grain sand are private local commercial quarries (CEMEX, Grimes Rock, and P.W. Gillibrand, collectively, "Local Inland Sources") in the Moorpark/Simi area of the Simi Valley, 20 to 25 miles north of the Project site by air and 40 to 45 miles north of the Project site by truck (Moffatt & Nichol, 2015). B. Monitoring via Sand Backpassing A proactive beach monitoring plan is critical to the success of the nourishment project. An important element of the Project is the implementation of a sand backpassing program. Since the beach is not anticipated to erode at the same rate along its length, periodic re-distribution of the sand to even-out the resource will be implemented. The BBGHAD shall be responsible for the monitoring of the restored beach and dunes. The BBGHAD s monitoring responsibilities include prevention, abatement, and control of erosion hazards as well as vegetation control within the Project area. The BBGHAD s general preservation responsibilities will include: Inspection of revetment structures Inspection and maintenance of restored dunes Monitoring of accumulated erosion and beach recession Monitoring of Project impacts in accordance with governmental oversight Specifics regarding the beach monitoring are as follows (Moffatt & Nichol, 2015): Monthly measurement of the dry sand beach width (from the seaward toe of the restored sand dune system to the seaward edge of dry sand "towel area") at nine locations: o East end Broad Beach Road o East-central reach Broad Beach Road o Central reach Broad Beach Road o West-central reach Broad Beach Road v v
8 o o o o o West-central A reach Broad Beach Road West-central B reach Broad Beach Road West end 31506/31504 Victoria Point Road West end A Victoria Point Road West end B 31536/31532 Victoria Point Road Semi-annual (spring and fall) full beach profile measurements out to the closure depth (approximate ocean water depth of 40 feet). Estimation of the rate and trend of beach width change and sand volume change at each of the measurement points for one year prior to construction and continually after construction for 10 years. Zuma Beach Width: A total of seven beach profiles will be surveyed every six months to quantify total sand volume and width changes within the littoral mini-cell between Lechuza Point and Point Dume. More frequent measurements of the beach berm width will be taken along Broad Beach to supplement the surveyed beach profiles. The measurements will be taken from fixed benchmarks (storm drain outfalls) at the back of the beach to the wetted bound line to provide an approximation of the dry beach width above the mean high water line. In addition to measured beach widths from three benchmarks, a handheld GPS unit will be used to record the horizontal position of the wetted bound line along Broad Beach. This will provide a continuous line from Trancas Creek to Point Lechuza that can be displayed on Project drawings to provide an estimated beach width along the entire Project. The beach widths measured from the benchmarks can be used to verify and correct coordinates from the handheld GPS unit. Backpassing will be implemented when the dry beach width at various transects approved by governmental agencies is approximately 30 feet or less for consecutive periods in accordance with governmental oversight ( backpassing milestone ). To the extent possible, based on 300,000-cubic-yard major nourishments and natural ocean conditions, backpassing is intended to maintain a balanced benefit of the beach nourishment and to maintain dry sand beach seaward of the revetment. The backpassing milestone will assist in identifying when beach erosion reaches a point that threatens property and improvements and to permit sufficient time to implement management actions to maintain these benefits. The backpassing milestone is meant to be used in combination with onsite observations, beach width measurements, profile monitoring, and an understanding of historical and projected future trends. The backpassing milestone should be reevaluated frequently due to the large variability in potential shoreline change rates. With the nourishment volume reduced to 300,000 cubic yards, the opportunities for effective backpassing of sufficient sand surplus at the downdrift end of the Project may be limited after the first one to two years after major nourishment episodes. Since the net direction of sand movement (littoral drift) is to the east, it is anticipated that the predominant backpassing operation will be from east (surplus) to west (deficit). The resulting action would backpass sand v v
9 using mechanical equipment from the wide reach of beach (surplus area) to widen the narrow reach (deficit area) of beach. Backpassing would be expected to commence in the fall months. Additional details of backpassing operations are presented in Exhibit E. Small-scale interim renourishments will occur in accordance with objective triggers as described in Exhibit E interim renourishment milestone. Beach widths measured from various transects, supplemented with surveyed beach profile data, will be analyzed to determine when this interim renourishment milestone is met. Prior to the scheduled renourishment of up to 300,000 cubic yards at or around year 5, and subsequent 300,000-cubic-yard planned renourishments at years 10 and 15, the need may arise for the placement of additional sand along Broad Beach to maintain Project objectives. Small-scale renourishments are proposed as an adaptive management action when beach width along the western portion of Broad Beach has narrowed to the point where seasonal fluctuations in beach width could result in revetment exposure and limited lateral beach access. When the beach width backpassing milestone or interim renourishment milestone is reached and backpassing is not feasible, up to 75,000 cubic yards of additional nourishment sand (of same specification as original nourishment) would be obtained from an approved sand borrow site, transported from the local inland source(s), and deposited on Broad Beach. This volume will provide approximately 50 feet of dry beach width over a 2,000-foot reach of assumed sand deficit area. The sand source for these renourishments would be the same as for the initial nourishment, unless the applicable agencies approve other borrow sites and all details for construction described in the Project description would apply. Given that the current sand loss rate in the Broad Beach area averages about 35,000 cubic yards per year, the Project includes periodic renourishment of 300,000 cubic yards at approximate 5-year intervals using sand of the same specification as the original nourishment. Provided the monitoring results of the initial nourishment show no significant adverse impacts, the periodic renourishment will be placed in the same footprint as shown in Exhibit E. VII. ASSESSMENT METHOD AND BENEFIT A. Special Benefit and Proportionality The improvements described in this document will confer some or all of the following special benefits to the assessed parcels: 1. Protection from erosion due to wave action. 2. Protection from flooding associated with storms. 3. Protection from sea-level rise. 4. Availability to access and use the beach facility. 5. Prevention of blight. 6. Consequential protection of properties to the west of the beach improvements to the extent of natural littoral movement v v
10 The BBGHAD improvements described in Section VI are distributed within the BBGHAD boundaries. Implementation and protection of these improvements provide a special benefit to all real property assessed within the BBGHAD. As a means of protection from erosion, flooding from sea level rise and storms, tsunamis, and wave action, the proposed beach improvements will provide protection to private property improvements within the BBGHAD, including homes and the Malibu West Beach Club and, therefore, will provide a special benefit to property owners within the BBGHAD. Properties to the west of Broad Beach Road will receive a reduced special benefit (and be assessed less accordingly), which is generally limited to points 4, 5, and 6 above. Two parcels devoted exclusively to public access walkways ( public access parcels ) receive an even further-reduced benefit, limited to point 4 above. These improvements are special benefits conferred on all the assessed parcels in the BBGHAD. These improvements affect the assessed property in a way that is particular and distinct from their effect on other parcels, and real property in general and the public at large do not benefit or share. Property owners derive special benefit based in direct proportion to their respective beach frontage. Although volumes of sand placement may differ from time to time on each parcel, the dynamic nature of beach erosion, subsequent sand transport, the anticipated backpassing maintenance, and interim sand nourishment activities render the environment within the BBGHAD district boundaries as a semi-closed, discrete system in which special benefit is provided along the coastal property line for the benefit of coastal properties and is therefore derived based on proportional beach frontage. The propensity to erode is based on coastal exposure; thus, protection from erosion is also based on coastal exposure foot frontage of coast. Therefore, owners with greater beach frontage derive greater special benefit than owners with lesser beach frontage. Moffatt & Nichol finds that the proposed improvements and activities equalize the special benefit derived by properties within the BBGHAD based on pro-rata length of beachfront per assessed parcel, with reduced special benefit to properties to the west of Broad Beach Road and the public access parcels as stated above. The special benefit is proportional to the length of beach frontage and the extent of BBGHAD-placed sand nourishment, regardless of the presence of pre-existing protective structures, such as revetments or seawalls. As described by representatives of Moffatt & Nichol (the Engineer of Record for the proposed improvements), the proposed beach nourishment Project will directly benefit the performance and longevity of existing seawalls within the BBGHAD district in two important ways. First, the beach nourishment is adding soil to the seaward side of an existing seawall, thereby acting to better balance the soil pressures that act upon the landward side of the wall. Second, adding sand to a beach fronting a seawall that has been denuded of sand will move the wave-breaking impact area seaward and away from directly impinging on the seawall. The wider beach will allow wave energy to dissipate more gradually on the sloping sand beach, thereby reducing environmental loading on the seawall structure. There is no special benefit for properties outside of the district. First, we must distinguish between the public benefit necessary to allow permitting of the Project (and protecting private property and preventing it from becoming a nuisance is such a public benefit) and the general benefit contemplated by Article XIII D of the California Constitution v v
11 We conclude the Project will create no general benefit in the latter sense, but that it will have sufficient public benefit to allow its entitlement. To be conservative in our analysis, however, we also evaluate the value of any putative general benefit under Article XIII D of the California Constitution the Project might arguably create and, for the reasons stated below, conclude the cost of any such general benefit will not be recovered from assessment proceeds, but from non-assessment revenues. Like most assessments, special benefits conferred by the improvements may have the effect of creating incidental general benefits (i.e., an improved beach area that the public may use). However, the additional beach area created by the improvements contemplated here is not a general benefit within the contemplation of Article XIII D of the California Constitution. The fact that a particular improvement project does not confer any such general benefit on the community at large does not make the Project any less public in the sense required to allow assessment funding or to permit Coastal Commission, State Lands Commission and other government approvals of the Project. The California Coastal Commission and the State Lands Commission both explicitly conditioned their approvals of the contemplated improvements on the creation of additional beach area accessible to the public, as required by the statutes under which they act. Thus, although the additional beach area may be publicly accessible, it is a legally compelled portion of the Project required to achieve the special benefit running to property owners; without additional beach area, the Coastal Commission and State Lands Commission would not permit the Project to achieve the special benefit. If the additional beach area were construed as a general benefit within the meaning of Article XIII D of the California Constitution, that benefit is minimal. Of the parcels within the BBGHAD, approximately 47 non-contiguous parcels currently allow for lateral public access, and those parcels are remotely located with limited public transportation and public parking. Further, the cost to confer the incidental general benefit is exceeded by two non-assessment funding sources for the Project. First, the cost of revetment relocation, estimated at $2.4 million, as presented in Exhibit E, will be borne by the private landowners who hold title to property on which portions of the revetment will be relocated. This funding source will offset the general benefit realized by the public. Second, the revetment will be relocated landward, which will create approximately 1.3 acres of additional wet sand beach available for public access as the boundary between private and public land remains the mean high tide line. This amounts to a transfer of valuable interests in real property from the owners of the private properties on which the revetment is located to the general public, which will be able to use the newly created state tidelands. Based on publicly available real estate listings for sale within the boundaries of BBGHAD in April 2015, the value of vacant coastal property in this vicinity is estimated at $27,293,000 per acre. The transfer of this interest in approximately 1.3 acres is valued at approximately $35,480,900. The value is based on recent listing prices of land for sale at or near the time of this report preparation, not actual sales price. However, any difference in these two values would be expected to have an immaterial effect on the analysis. In recognition of the incidental nature of any general benefit (within the meaning of Article XIII D of the California Constitution) resulting from the Project, we determine that the value of the general benefit is no more than 5 percent of the total general and special benefit generated by the v v
12 Project. Although the Project has no stated termination date, the California Coastal Commission is highly unlikely to approve a permit lasting more than 20 years, and in any event, it is unduly speculative to predict costs and available resources more than 20 years into the future. Projectrelated expenses for a 20-year horizon have been estimated to be approximately $63.6 million (2015 dollars). Therefore, the portion of Project cost attributable to this putative and incidental general benefit is, in our professional judgment, no more than 5 percent, or approximately $3.18 million. Also, the special benefit conveyed to the non-assessed public access parcels is a reduced amount (related to point 4 discussed above) of the per-foot assessment value presented in Exhibit D) for the combined 40-foot parcel width. However, even if the public access parcels were to receive the full benefit valued at $595 per linear foot of beach frontage, as discussed in Section VIII below, this would amount to only $23,800 during the first year, with a 20-year horizon estimated at $476,000 total in 2015 dollars. Therefore, the non-assessment consideration ($37.9 million) consisting of the transfer of very valuable real property (approximately $35.5 million) and non-assessment costs of revetment relocation ($2.4 million), borne by the affected homeowners, offers a contribution that more than offsets both the putative general benefit generated by the project and the limited benefit conferred on the two public parcels. As discussed above, the value of even a very small fractional portion of land contribution far exceeds the value of these benefits, regardless of whether actual sales price or asking price is considered. B. Assessment Method Lots will be assessed based on the length of their respective beach frontages; the assessment will be based on a unit rate times the linear footage of beach frontage. Based on the reduced special benefit that will be derived west of Broad Beach Road described above, those property owners will be assessed a lower assessment measured as a percentage of the assessment paid by other landowners within the BBGHAD. VIII. ASSESSMENT LIMIT - BUDGET A financial analysis was performed to provide a framework for an operating budget for the on-going abatement, mitigation, prevention, and control of geologic hazards within the BBGHAD boundaries. In preparation of the budget, several factors were considered including: Proposed Improvements Elements Requiring Preservation Based on the estimated expenses for on-going operations and the allowance for one future beach re-nourishment event (5 years after the initial re-nourishment), a budget was prepared for the purpose of estimating initial assessment levels (Exhibit D). The budget is based on cost estimates provided at the time of preparation of this Engineer's Report with respect to materials, labor, and related costs within a reasonably foreseeable timeline of anticipated Project commencement. Because of uncertainty related to the dates on which the BBGHAD will obtain required Project permits and, subsequently, begin construction, the Project costs and related v v
13 assessment have been adjusted to allow for a potential delay of the issuance of necessary permits and/or the commencement of Project construction beyond calendar year The Engineer recommends an average annual assessment limit of $595 per foot of beach frontage for each residential lot beginning at Broad Beach Road and all lots eastward (Fiscal Year 2015 dollars). Based on the reduced special benefit to westerly properties described above, the assessment limit for parcels to the west of Broad Beach Road will be set at 25 percent of the value for the remaining frontage, a percentage established in the professional judgment of the BBGHAD Manager and Assessment Engineer (ENGEO) and the BBGHAD Engineer, Moffatt & Nichol. Further details are provided in Exhibit E. Inherently, the determination of the fractional assessment assigned to parcels to the west of Broad Beach Road is based on a qualitative analysis of several factors discussed in this document. During this determination, a quantitative assessment was concurrently performed. The quantitative assessment must be qualified: it is not to be interpreted as a statement of precision; rather, it was performed to clarify and facilitate validation of the qualitative analysis. In the event that the assessment described in this document is not approved by vote of the property owners within the BBGHAD, the existing assessment will remain in place. The Assessment Diagram is shown in Exhibit F. The proposed initial assessment level will be adjusted annually to reflect the percentage change in the Los Angeles metropolitan area Consumers Price Index (CPI) for All Urban Consumers. The assessment limit will be adjusted annually using an initial date of April 2015 for the CPI. Each subsequent annual adjustment will be calculated using the 12-month period from April to April. The assessment shall be levied by the BBGHAD following the authorization of the assessment v v
14 EXHIBIT A Index of Comments on April and Draft Engineer's Report and Responses Thereto (To review copies of the actual comments and responses, go to: and v v
15 INDEX OF COMMENTS ON APRIL AND JUNE 2015 DRAFT ENGINEER'S REPORT AND RESPONSES THERETO 2015 June DRAFT Engineer s Report & Related Documents 01. BBGHAD Broad Beach Engineers Report Redline DRAFT 6/24/ July 13, from Max Factor III to Chair Norton Karno 03. BBGHAD Response to July 13, Comments From Max Factor 2015 April DRAFT Engineer s Report & Related Documents Docs Supporting BBGHAD Engineer s View-Some Sand Nourishment Will Migrate West 01. April 2015 DRAFT Engineer s Report 02. 5/13/15 Fox Rothchild Comment Letter on Draft Engineer s Report 03. 5/29/15 BBGHAD Reponse to Fox Rothchild Comment Letter /12/15 Arnault/Factor Comment Letter on Draft Engineer s Report 05. 6/2/15 BBGHAD Response to Arnault/Factor Comment Letter 06. Coastal Frontiers 2014 Beach Survey & Historical Survey Data 07. Coastal Frontiers 2013 Beach Survey & Historical Survey Data 08. 6/1/2015 Legal Comments on Draft Engineer's Report 09. 6/12/2015 Coastal Engineering Review by Pacific Engineering Group 10. 6/13/2015 West End Settlement Petition 11. 6/16/5015 Additional Info Provided by Max Factor re Draft Engineer s 12. BBGHAD Response to June 1, 2015 K Salt Letter 13. Pacific Engineering Review Response 14. BBGHAD Response to 06/16/15 Additional Information Provided by Max Factor III re: Draft Engineer s Report
16 EXHIBIT B Legal Description v v
17
18
19
20 EXHIBIT C BBGHAD Boundary v v
21
22
23
24
25
26
27
28
29 EXHIBIT D Broad Beach Geologic Hazard Abatement District Budget July 15, v v
30 EXHIBIT D Broad Beach Geologic Hazard Abatement District Budget July 15, 2015 ASSUMPTIONS Beach Frontage Of Project (excluding Western 22 parcels) (LF) 4,961 Annual Assessment per Foot of Beach Frontage (current $) $595 Beach Frontage of Western 22 Parcels (LF) 1,256 Annual Assessment per Foot of Beach Frontage of Western 22 Parcels (LF) $ Annual Adjustment in Assessment (estimated) 3.5% Escalation in Annual Costs (estimated) 3.5% Investment Earnings (estimated) 5% Frequency of Sand Nourishment (years) 5 Cost of Sand Nourishment (current $) $10,750,000 ESTIMATED ANNUAL EXPENSES IN 2015 Administration, Accounting, & Insurance $150,080 Annual Monitoring $400,000 Permitting Fees $896,000 Beach Nourishment $10,750,000 Amount Financed ($10,750,000) Miscellaneous Expenses $182,300 Debt Service $2,347,312 TOTAL $3,975,692 ESTIMATED ANNUAL EXPENSES IN 2016 Administration, Accounting, & Insurance $155,333 Annual Monitoring $414,000 Ongoing Backpassing $51,750 Miscellaneous Expenses $188,681 Debt Service $2,347,312 TOTAL $3,157, v v
31 ESTIMATED ANNUAL EXPENSES IN 2017 Administration, Accounting, & Insurance $160,770 Ongoing Backpassing $53,561 Annual Monitoring $428,490 Miscellaneous Expenses $195,284 Debt Service $2,347,312 TOTAL $3,185, v v
32 EXHIBIT E Moffatt & Nichol Coastal Engineering Appendix to the Broad Beach Geologic Hazard Abatement District Engineer s Report v v
33 Broad Beach Restoration Project Coastal Engineering Appendix To The Broad Beach Geologic Hazard Abatement District Engineers Report 2015 Update Prepared for: BROAD BEACH GEOLOGIC HAZARD ABATEMENT DISTRICT Prepared by: MOFFATT & NICHOL 3780 Kilroy Airport Way, Suite 600 Long Beach, California M&N File v2
34 Table of Contents 1. Summary of Project Revisions Problem Description Beach Erosion and Loss of Related Shore Protection Homeowners Actions Project Background Regional Coastal Setting Existing Broad Beach Coastal Development Public Access Coastal Processes Water Levels Tides Storm Effects Long Term Sea Level Rise Waves Wave Exposure Extreme Waves Design Wave for Shoreline Structures Sediment Transport Rate Analysis Summary Description of Revised Proposed Project Project Objectives Key Elements of Revised Project Revised Beach and Dune Design Sand Sources for Beach Nourishment and Dune Restoration Dune Habitat Restoration Private Property and Public Lateral Access Equilibrium of the Beach After Nourishment Beach Fill Performance Monitoring Long-Term Beach Profile Monitoring Beach Berm Width Measurements Adaptive Management Actions Backpassing Interim Nourishments Erosion Nourishments Project Benefits West of Broad Beach Road Partial Revetment Relocation Project Construction Initial Project Construction Schedule Construction Staging Area and Equipment Construction Procedures Summary Discussion of Project Benefits References v2 ii
35 TABLE OF TABLES Table 4-1. Water Levels at Broad Beach, Based on LA Outer Harbor Tide Station (NOAA/NOS, 2008) Table 4-2. Extreme Water Levels versus Recurrence Interval Table 4-3: SLR Projections for Los Angeles Region (NRC 2012) Table 4-4. Beach Retreat Due to Sea Level Rise Rates at Los Angeles Area Beaches Table 4-5. Broad Beach Breaking Wave Heights Range Table 5-1 Comparison of Average Beach Width Added for West and East Reaches Post 300,000 cy Fill.. 50 Table 5-2. Comparison of Average Beach Width Added for West and East Reaches Post Initial 300,000 cy Fill With Interim 75,000 cy at Year Table 5-3. Preliminary List of Construction Equipment for the Broad Beach Restoration Project TABLE OF PHOTOS Photo Aerial Photo (California Coastal Records, 2009)... 3 Photo Aerial Photo (California Coastal Records, 2009)... 4 Photo 2-3. Temporary Sandbag Revetment (May 2009)... 5 Photo 2-4. Temporary Sandbag Revetment (December 2009)... 5 Photo 2-5. Severe Erosion and Dune Damage at West Broad Beach (January 2010)... 6 Photo 2-6. Temporary Sandbag Revetment Failure and Dune Damage (January 2010)... 7 Photo 2-7. Emergency Revetment (February 2010)... 8 Photo 2-8. Emergency Revetment (February 2010)... 8 Photo 5-1. Sand Stockpile at the Grimes Rock Quarry Photo 5-2. Sand Stockpile at the CEMEX Quarry Photo 5-3. Sand Stockpile at the P.W. Gillibrand Quarry Photo 5-4. Sand Backpassing in Long Beach, CA TABLE OF FIGURES Figure 3-1. Vicinity Map Figure 3-2. Location Map, Modern Malibu Littoral Cell (MMLC) Figure 4-1. Wave Exposure Windows at Broad Beach Figure 4-2. Significant Wave Height (Wave Rose) Offshore of Point Dume (CDIP, 2010) Figure 4-3. Peak Wave Period (Period Rose) Offshore of Point Dume (CDIP, 2010) Figure 4-4. Volumetric Changes, Figure 4-5. Volumetric Changes, Figure 4-6. Volumetric Changes, Figure 5-1. Plan View of Alternative 4C Figure 5-2. Alternative 4C, Typical Sections Figure 5-3. Cross Section of Sacrificial and Designated Dune Habitat Areas Figure 5-4. Broad Beach Restoration Project - Sand Source Area Figure 5-5. Geology Strata of the Quarries as Sandstone Figure 5-6. Conceptual Rendering of Dune Restoration Figure 5-7. Conceptual Cross-Section of Restored Dune and Beach with Existing Offers to Dedicate and Public Beach Area Figure 5-8. Example of Equilibrium Beach Profile for Alternative 4C Figure 5-9. Transects for Beach Profiling at Broad Beach and Zuma v2 iii
36 Figure Adaptive Management Triggers Figure Schematic of Borrow Area for Alternative 4C Year 1 Backpassing Operation (15,000 cy) Figure Schematic of Placement Area for Alternative 4C Year 1 Backpassing Operation (15,000 cy) 46 Figure Schematic of Placement Area for Alternative 4C Interim Nourishment Figure Illustration of Bi-Directional Transport of Sand at Edge of Beach Fill Figure Predicted Shoreline Change after 300,000 cy Nourishment Figure Predicted Shoreline Change after 75,000 cy Interim Nourishment Figure Construction Staging & Stockpile Areas For Alternative 4C Project Figure Proposed Haul Routes from Local Inland Sand Sources v2 iv
37 1. Summary of Project Revisions The Broad Beach Geologic Hazard Abatement District ( BBGHAD ) was formed in September 2011, and the resulting assessment was based on the Engineer s Report prepared by Engeo, Inc. in January Subsequent to its formation, the BBGHAD has received significant input from state, federal, and regional regulatory agencies, including the California Coastal Commission ( CCC ), the California State Lands Commission ( CSLC ), the Army Corps of Engineers, and their respective consulting agencies and members of the public regarding various aspects of the proposed Broad Beach beach and dune restoration project (Project). Many stakeholders communicated a desire to avoid and minimize impacts to sensitive marine habitats, particularly in the western portion of the Project site. As a result, the BBGHAD authorized the BBGHAD Engineer, Moffatt & Nichol ( M&N ), to develop and analyze a new alternative 4C ( Alternative 4C ) which proposes separate sand placements of 300,000 cubic yards each ("Major Nourishments") approximately every five (5) years, a revised sand placement area (limiting West End sand placement at Broad Beach Rd.), and other Project revisions. Given these substantive modifications to the originally proposed Project, an updated assessment will be required. This report provides an update to the initial Coastal Engineering Appendix to the Engineer s Report, reflecting all the elements of the new Project. The BBGHAD proposes a significantly narrower sand placement footprint for Alternative 4C than that of the originally proposed Project. This new alternative does not include placing sand material seaward of the 22 western most BBGHAD parcels (19 residences), approximately 1150 feet of shoreline length. This approach differs from the original Project proposed by the BBGHAD, which contemplated an initial placement of 600,000 cubic yards within the entire BBGHAD, from Trancas Creek at the east to Point Lechuza at the west. Under Alternative 4C, no direct placement of nourishment material would occur west of Broad Beach Road. The Project goals include restoring a sandy beach over the revised Project length intended to provide the natural shore protection inherent with sand beaches, coupled with the recreational benefits. Ancillary to the shore protection and recreational benefits afforded the BBGHAD, the project will also provide public access benefits and enhanced intertidal habitat value which are necessary elements of the project entitlement. The Project's rock revetment, seaward of 78 BBGHAD residences from Broad Beach Road, provides a last line of defense against coastal flooding and structural damage to primary structures, including onsite wastewater treatment systems (OWTSs), in the event that the sandy beach erodes away. Both economics and concerns for environmental impacts preclude the placement of sufficient sand volume to provide the necessary protection of primary structures at an acceptable level of risk without the revetment in place. In an effort to meet the Project goals described above, and do so in accordance with applicable GHAD law, the BBGHAD proposes to implement revised backpassing from wider reaches of the beach to narrower reaches of the beach subject to objective triggers, with the frequency not to exceed one time per year. Further, if insufficient sand volume exists for backpassing, the BBGHAD intends to implement additional smaller scale interim renourishments ("Interim Nourishments") to supplement the proposed Major Nourishments in an effort to maintain sufficient sand beach over the Project length and bury any v2 1
38 exposed rock revetment. The frequency and volume of these Interim Nourishments will be determined by additional objective renourishment triggers, and subject to availability of BBGHAD funding. As a final measure to maintain sand on the beach, if natural ocean forces, Major Nourishments, backpassing, and Interim Nourishments fail to cause at least 10 feet of sand to remain seaward of the revetment between Transects , the BBGHAD proposes to conduct up to three (3) Erosion Nourishments per 10-year period using, per event, a maximum of 75,000 cubic yards of imported sand seaward of the revetment in the area that does not meet objective access criteria. The BBGHAD intends to implement adaptive management techniques to the Project based on detailed, real time monitoring during the Project's duration, and implementing any revisions agreed upon with governmental agencies. The BBGHAD intends for this adaptive management approach to cover the requested 20-year duration of its pending Coastal Development Permit (CDP). In late 2014, the CCC proposed a landward relocation of approximately 1,600 linear feet of the eastern portion of the revetment to the line of the existing septic systems with the provision of a minimal 15 foot setback between the seaward limit of the leach fields and the landward edge of the rock revetment. The BBGHAD has analyzed this CCC proposal and further consulted with the CCC and other permitting agencies. As a result, and in accordance with CCC directives, the BBGHAD has agreed to relocate the eastern portion of the emergency revetment further seaward than proposed by the CCC in late 2014, but in a location as far landward as feasible in accordance with applicable laws. The applicable setback requirement between the wave uprush line and the existing OWTS leach fields constitutes a key factor in the revetment relocation. Based on the BBGHAD s commitment to maintaining beach width in front of the revetment for the permit duration, the risk of wave overtopping and leach field inundation posed by the worst-case scenario has been sufficiently lowered to justify reducing the setback of the revetment pullback s wave uprush line from the existing leach fields. Given the BBGHAD s desire to transition member properties off septic systems, the increased risk of leach field damage due to increased proximity of the wave uprush line may be acceptable given the anticipated relatively short leach field lifespan of up to 10 years. This pullback also creates sufficient land area seaward of the relocated revetment to more than offset the total amount of area the existing emergency revetment is claimed to encroach (0.85 acres) on public land as asserted by the California State Lands Commission (CSLC) according to its January 2010 survey. This Coastal Engineering Appendix to the BBGHAD Engineers Report is organized as follows: Section 2: Problem Description including the basis for the BBGHAD formation; Section 3: Project Background including regional setting, existing development on Broad Beach and characteristics of public access; Section 4: Coastal Processes which provides a technical description of the geological conditions creating the project need; Section 5: Detailed description of the revised project; and Section 6: Summary of project benefits for BBGHAD members v2 2

39 2. Problem Description Broad Beach is located in the northwest portion of the County of Los Angeles within the City of Malibu, California. The project area is comprised of the shoreline area fronting approximately 114 residences and a beach club spanning approximately from Lechuza Point to Trancas Creek. 2.1 Beach Erosion and Loss of Related Shore Protection Development along Broad Beach began in the 1930s, consisting of small beach cottages. Given the limited infrastructure available, septic systems and leach fields were typically installed close to the sand dunes seaward of the residences. As construction continued and the site was further developed, most leach fields continued to remain. Most lots were developed by the late 1980s. During this period, the beach remained considerably wider than it is today, especially through the early 1970s. The width of Broad Beach reached a peak in 1970 at a yearly average of 60 feet landward of the present mean high tide line (MHTL). Aerial photographs from 1972 (Photo 2-1) provide a clear illustration of a very large sand volume on the beach. Presently, Broad Beach is a very narrow ribbon of sand visible primarily at low tide, but inundated at high tide (Photo 2-2). Photo Aerial Photo (California Coastal Records, 2009) v2 3
 Several recent studies of the coastal region encompassing Broad Beach have identified a trend of continued erosion without any significant")
40 Photo Aerial Photo (California Coastal Records, 2009) Several recent studies of the coastal region encompassing Broad Beach have identified a trend of continued erosion without any significant recovery in beach width since the early 1970s. The beach is narrowing because of a negative sand balance due either to a reduction in sand supply entering around Lechuza Point, or a change in the magnitude and/or direction of the wave energy that increases the amount of sand leaving the Broad Beach. Between 1974 and 2009, approximately 600,000 cubic yards (cy) of sand was lost at Broad Beach, a majority of which has moved east to Zuma Beach. Studies conclude that this trend of erosion appears to have accelerated in the last two decades. El Niño storm seasons within the last decade have exacerbated the shoreline recession resulting in structural damage and further beach erosion. The El Niño storms caused considerable shoreline erosion and related storm wave damage along the California coastline. Many Broad Beach homes were threatened, causing many homeowners to construct temporary sand bag revetments to protect residential structures and leach fields. One residence suffered significant structural damage. During one particularly severe storm in early February 1998, with sand bags already in place, the active beach scarp retreated more than 30 feet in the course of two days. The 2007/2008 winter season, though milder than the winter, also resulted in significant retreat of the beach. Many of the homeowners responded with construction of more substantial sand bag revetments, which were authorized through emergency Coastal Development Permits issued by the City of Malibu. Examples of these revetments are shown in Photo 2-3 and Photo 2-4. In addition to these structures, timber protective devices, concrete seawalls, and rock revetments were constructed at various residences along the west end of Broad Beach. Waves and higher tides run up to the foot of historically wide dunes along the east end of Broad Beach. The prognosis for the condition of Broad Beach without beach restoration activities is very poor, given the erosional trends and lack of remaining beach. The visual quality of the beach has been seriously impacted by the unsightly temporary sand bagging and emergency shore protection measures. In addition, opportunities for lateral access and recreation along the beach are severely limited v2 4
, representing most of the property owners along the Broad Beach shoreline, elected to take")

41 Photo 2-3. Temporary Sandbag Revetment (May 2009) Photo 2-4. Temporary Sandbag Revetment (December 2009) 2.2 Homeowners Actions The Trancas Property Owner s Association (TPOA), representing most of the property owners along the Broad Beach shoreline, elected to take action in early 2009 to develop a long term solution to protect against shoreline erosion and reduce the threat to private property. During preparation of the initial planning studies for the restoration of Broad Beach, a large El Niño winter was forecast for the 2009/2010 winter season. In December 2009, there was a significant narrowing of the beach due to v2 5

42 storm wave attack resulting in widespread failure of the existing temporary emergency sandbag revetments, especially at the west end of the beach. Photo 2-5 illustrates the eroded shoreline condition near the west end of Broad Beach; Photo 2-6 shows conditions toward the east. It became evident that these temporary structures would not provide sufficient shore protection for the upcoming winter. Acute and significant erosion was proceeding, resulting in significant loss of dune habitat and threatening of residential structures. Undermining and failure of several approved On-Site Waste Water Treatment Systems (OSTs) was also imminent without immediate action. Combined with the prediction of moderate to severe El Niño conditions for the upcoming winter, the need for immediate emergency action became apparent. As a result, the TPOA sought and obtained an Emergency Coastal Development Permit (ECDP) to implement an interim shore protection measure to halt the critical erosion until the longer term project is in place. Photo 2-5. Severe Erosion and Dune Damage at West Broad Beach (January 2010) v2 6
 Under the emergency situation, a temporary rock revetment was considered the minimum action necessary, and the least environmentally")
43 Photo 2-6. Temporary Sandbag Revetment Failure and Dune Damage (January 2010) Under the emergency situation, a temporary rock revetment was considered the minimum action necessary, and the least environmentally damaging alternative. The temporary rock revetment design was developed to stabilize the shoreline against further erosion for the 2009/2010 El Niño season. Other temporary revetment alternatives consisting of geotextile bags were providing a clear demonstration that they could not provide reliable shore protection and could, at best, provide only a false sense of security. In addition to their lack of hydraulic stability, the failed geo-bag (sandbag) system was proving to be a source of debris and litter on the beach. The TPOA's consultants developed the temporary rock revetment design to provide the minimum necessary protection while allowing for rapid construction. Specific elements of the temporary revetment include: Filter fabric to eliminate loss of dune material through voids in the stone matrix; Reduced armor size (1/2 to 2 ton) stone to allow for faster construction using readily available, stockpiled stone; Reduced revetment volume to allow for faster construction and lateral beach access; and Shallower toe elevation for improved constructability. The TPOA obtained an ECDP and other necessary approvals for the temporary revetment in late 2009 and early The following photographs show the completed revetment that extends from Trancas Creek for about 4,100 feet west terminating just past the western public access point for Broad Beach v2 7

 518042v2")
44 Photo 2-7. Emergency Revetment (February 2010) Photo 2-8. Emergency Revetment (February 2010) v2 8
45 3. Project Background 3.1 Regional Coastal Setting The Southern California coast is a complex, tectonically-active region and is characterized as a collision coast wherein the Pacific Ocean plate subducts on contact with the North American plate. From a geologic time perspective, the process manifests itself in the form of narrow offshore shelves cut by submarine canyons, uplifted by coastal mountains and coastal erosion. Broad Beach exemplifies a typical Southern California stretch of coastline, comprising a sandy beach backed by coastal bluffs. Broad Beach is located at the western (upcoast) end of a 4 mile long hookshaped beach between the Point Lechuza and Point Dume as shown in Figure 3-1. With a total length of just over 1 mile, Broad Beach is bounded by Point Lechuza to the west and Trancas Creek to the east. Zuma Beach and Point Dume State Beach make up the remainder of the hook-shaped beach. This hook-shaped beach is referred to as the Zuma Littoral Subcell (ZLS) throughout this report. Broad Beach and the ZLS lie within the Modern Malibu Littoral Cell (MMLC) shown in Figure 3-2. The MMLC is bounded by Port Hueneme to the north and Marina Del Rey to the south. Littoral cells are essentially self-contained beach compartments bounded by geographic features such as headlands or submarine canyons that limit the movement of sand between cells. Each compartment consists of sand sources (such as rivers, streams, and coastal bluff erosion), sand sinks (such as coastal dunes and submarine canyons), and beaches which provide pathways for wave-driven sand movement within a littoral cell. The south-southwest facing MMLC coastline is directly exposed to swells generated in the southern hemisphere. These swells approach Malibu from the southwest, south, and southeast, but the great decay distances typically result in waves of low heights and long periods. Despite sheltering from the Channel Islands, the Broad Beach area is exposed to North Pacific swell through the Santa Barbara Channel. North Pacific generated swells are the most energetic source of waves in the region and the north-westerly approach angle results in a pre-dominant longshore sand transport direction from the west to east in the MMLC. Due to the wave climate and pre-dominant longshore sand transport direction, Broad Beach and the ZLS depend on sand delivered from upcoast sources, including fluvial discharges from coastal watersheds of the Santa Monica Mountains and erosion of coastal bluffs. Mugu Submarine Canyon captures almost all of the longshore sand supply and represents the upcoast limit of potential sand sources for the ZLS v2 9

46 Figure 3-1. Vicinity Map v2 Draft 10

47 Figure 3-2. Location Map, Modern Malibu Littoral Cell (MMLC) v2 Draft 11
48 3.2 Existing Broad Beach Coastal Development The coastal community of Broad Beach is currently protected by a temporary rock revetment fronting most properties west of the Malibu West Beach Club and east of Broad Beach Road. Shore protective devices west of this address consist of multiple devices for single or multiple lots. These measures include rock revetments, concrete vertical seawalls, and timber seawalls. Several properties do not have any shore protective structure in place and some are supported by piles which are currently exposed. 3.3 Public Access Parking is available at Zuma beach immediately to the east, as well as parallel parking along Broad Beach Road. Los Angeles County operates a series of connected public parking lots along Zuma beach. The westernmost lot, Lot 12, can be used to access Broad Beach on foot after parking. However, much of that lot is occupied by surf camp and other vendor vehicles during summer months. Parallel parking exists along the northern side of Broad Beach Road for almost the entire length of Broad Beach, but these spaces are oriented in a parallel manner, which necessarily limits the capacity of parking along Broad Beach Road. Vertical access to Broad Beach is provided in two locations at and Broad Beach Road via approximately 20' wide parcels owned by Los Angeles County. A component of the emergency revetment project was the improvement of vertical public access paths otherwise operated and maintained by Los Angeles County Department of Beaches and Harbors. A concrete walkway and steps to the beach were constructed over the temporary revetment to maintain vertical access at these locations. These vertical public access paths will be incorporated into each proposed beach restoration alternative. The eroded shoreline along Broad Beach has significantly limited the recreational beach area and lateral access. There is essentially no dry beach available along most of the beach and during even moderate high tides of 3-4 feet, most of the beach is submerged with waves breaking directly onto the temporary revetment. In addition to existing physical limitations, lateral access along Broad Beach is affected by a complicated mix of public land, Offers to Dedicate (OTDs) public lateral access easements and private property. Land seaward of the mean high tide line (MHTL) is considered public land. The existing easements along Broad Beach vary from one property to the next according to the contents of the actual recorded grants and, in some areas, may influence lateral access available to the public. Some recorded grants provide for a designated buffer seaward from authorized development on a property and the portion available for public access. The buffer typically varies from 5 feet to 50 feet wide along Broad Beach v2 Draft 12
49 4. Coastal Processes This section describes general coastal processes relevant to the selection and design of solutions to the coastal erosion problems at Broad Beach. These processes include sand movement, tide levels, sea level rise, and wave climate. This section also includes a discussion of the historical shoreline changes at Broad Beach which assist in understanding potential sand loss rates for beach nourishment solutions. 4.1 Water Levels Water levels are in a constant state of fluctuation subject to short term changes due to tides and storm surge and long term changes associated with sea level rise. Water levels and elevations on land throughout this study are referenced to the Mean Lower Low Water (MLLW) datum. MLLW, as shown in Table 4-1, is approximately 2.8 feet below mean sea level averaged over the most recent tidal epoch. The following sections discuss the processes that influence water levels with a focus on those causing elevated water levels that are most often responsible for coastal-related flooding and damage Tides The tides at Broad Beach are classified as mixed semidiurnal (two unequal highs and lows per day). Tide characteristics from the Los Angeles tide gage nearest the project site are shown in Table 4-1. These are based on the most recent ( ) tidal epoch. Table 4-1. Water Levels at Broad Beach, Based on LA Outer Harbor Tide Station (NOAA/NOS, 2008) Water Level Extreme High (Observed January 27, 1983) Mean Higher High Water (MHHW) Mean High Water (MHW) Mean Sea Level (MSL), Epoch National Geodetic Vertical Datum (NGVD29) Mean Low Water (MLW) North American Vertical Datum 1988 (NAVD88) Mean Lower Low Water (MLLW) Extreme Low (Observed December 17, 1933) Elevation to MLLW Vertical Datum +7.8 feet +5.5 feet +4.7 feet +2.8 feet +2.6 feet +0.9 feet +0.2 feet 0.0 feet -2.7 feet Storm Effects In Southern California, the highest tides of the year typically occur in the winter months. Wave overtopping and wave-related coastal damage often occurs when an extremely high tide coincides with high storm waves. A statistical analysis of extreme water elevations was developed based on recorded annual extreme high water elevations obtained from the National Ocean Service for the outer Los Angeles Harbor reference tide station. Water elevation records were available from 1923 to Table 4-2 shows the annual extreme high water elevation versus recurrence interval. The extreme still water levels combined with sea level rise projections provide the basis for estimating a design water depth for coastal engineering analyses v2 Draft 13
50 Table 4-2. Extreme Water Levels versus Recurrence Interval Recurrence Interval (Years) Extreme Still Water Elevation (Feet, MLLW) Long Term Sea Level Rise Sea levels are projected to rise in coming decades as a result of increased global temperatures associated with climate change. When discussing sea level rise (SLR) (and when reviewing SLR projections), it is important to distinguish the differences between global and local SLR rates. Global SLR rates discount local effects such as tectonics (i.e., land uplift/subsidence), water temperatures, and wind stress patterns that can act to subdue or amplify the global SLR rates. Local (or relative) SLR refers to the observed changes in sea level relative to the shoreline in a specific region and takes into account these local factors. A myriad of planning and policy-level guidance on SLR has been released by international, federal, and state entities. These guidance documents are generally based on research and publications generated from the scientific community. The most applicable guidance to the proposed project is the California Coastal Commission Draft SLR Policy Guidance (CCC 2013). This guidance document is based on the National Research Council (NRC) 2012 study, which provided local SLR projections for the west coast of the United States. Guidance related to SLR evolves as new science is released and confirmed. The most relevant science and guidance from the international, federal, and state levels at the time of this report is summarized in this section. California Coastal Commission Draft SLR Policy Guidance (CCC 2013) The document provides step-by-step guidance on how to address SLR in new and updated Local Coastal Programs (LCPs) and Coastal Development Permits (CDPs) according to the policies of the California Coastal Act. The steps provided in the guidance are as follows: Establish the projected SLR range for the Project. Determine how impacts from SLR may constrain the Project site. Determine how the Project may impact coastal resources, considering the influence of SLR. Identify alternatives to avoid resource impacts and minimize risks. Finalize the Project design and submit CDP. The document states that best available science should be utilized when conducting project-level or regional vulnerability assessments. The NRC 2012 study detailed below is considered the best available science for the region at the time of this report. The CCC Draft SLR Policy Guidance document remains the most current document and is undergoing revision based on public comment v2 Draft 14
51 National Research Council (NRC 2012) The NRC is a group of scientists and research organizations that act as an advisory group for government agencies. The NRC study projections indicate a 0.5-foot increase in relative SLR by 2030 and a 3.1-foot increase by 2100 (Table 4-1) in the Los Angeles region. The confidence level in the projections, indicated by the uncertainty values, increases with the projection year as does the difference between the low and high projections. Table 4-3: SLR Projections for Los Angeles Region (NRC 2012) Time Horizon (feet) Low End of Range (feet) Projection (feet) High End of Range (feet) The potential impacts of sea-level rise on the beach and dune system are difficult to quantify with any certainty. If the beach were treated as a simple sloped structure with a 30:1 (horizontal to vertical) slope, then the waterline could move landward by as much as 30 feet or more by the year However, since the beach is dynamic, it has the ability to respond to water level changes and the results are rarely linear. In addition, current dunes at Broad Beach further complicate the situation. It is clear, however, that sea-level rise places the landside structures at additional and increasing levels of risk, and should be considered a fundamental part of any design solution. Sea level rise primarily causes beaches and shorelines to retreat landward. In general, on beaches which have a slope of 10:1 (horizontal: vertical), each inch of sea level rise would result in 10 inches of beach retreat (loss of beach width). For beaches which have a slope of 30:1, each inch of sea level rise would result in 30 inches of beach retreat, i.e. the flatter beaches would experience a greater amount of shoreline retreat. Based on the projected sea level rise numbers above and assuming no modifications to the shoreline, future beach retreat along LA area beaches was estimated for the range of scenarios (lower rate to highest rate); these values are shown in Table 4-4. Table 4-4. Beach Retreat Due to Sea Level Rise Rates at Los Angeles Area Beaches Beach Slopes Horizontal : Vertical Horizontal Beach Retreat From 2010 Shoreline (Lower Rate to Highest Rate, Feet) Year 2030 Year :1 (Steeper) 1 to 5 1 to 11 20:1 1 to 11 3 to 21 30:1 (Flatter) 2 to 13 3 to 27 At Broad Beach, the foreshore beach slopes (area seaward of scarp face or edge of dune) are close to 30:1. The distance between the existing mean-high-tide line (MHW) and the back beach (edge of dune v2 Draft 15
52 or edge of scarp face) is close to zero along much of the Broad Beach shoreline, i.e. the high tide line is already at the back beach line. Based on this and the sea level rise numbers in the table above, the scarp face would move almost 30 feet landward by 2050 solely due to sea level rise if no back beach shore protection was first created. 4.2 Waves Wave climate is the primary force for generating alongshore sediment transport and is, therefore, a critical element of any study aiming to evaluate and quantify sediment transport rates and associated change in beach sand volume and shoreline position. This section provides a summary of the wave climate along Broad Beach and discusses the wave data sources used to evaluate the regional and local historic beach performance Wave Exposure The southern exposure of Malibu and the proximity of the Channel Islands offshore limit the direction from which potentially destructive storm waves can impinge upon the area. The islands serve to create wave exposure windows, dissipating and reflecting wave energy and thereby modifying the wave conditions along the mainland shoreline. Upcoast shoreline features also serve to create wave exposure windows and refract waves before they reach the Malibu area. Wave exposure windows for the Malibu shoreline are illustrated Figure 4-1. In general, there are three main types of waves which occur along the southern California coast and which could occur through the Malibu wave exposure windows: North Pacific swell, southern swell, and seas generated locally. The North Pacific swell events are the most significant source of extreme waves in the region. The Broad Beach area is exposed to North Pacific swell through the Santa Barbara Channel. Swell from winter storms in the southern hemisphere reach California during the months of May through October. These swells approach Malibu from the southwest, south, and southeast, but are partially blocked by the Channel Islands. Additionally, the great decay distances result in waves of low heights and long periods v2 Draft 16
 are especially effective at moving sand alongshore from west to east.")
53 Figure 4-1. Wave Exposure Windows at Broad Beach Wave direction affects how the sand moves along the shoreline. Waves that travel through the Santa Barbara Channel to Malibu from the west (North Pacific swell waves) are especially effective at moving sand alongshore from west to east. South swells arriving nearly straight onto the shore of Malibu are more effective at moving sand in a cross-shore direction, either offshore to deeper water or onshore from deeper water. Scripps Institution of Oceanography operates and maintains ocean monitoring stations through the Coastal Data Information Program (CDIP). The closest CDIP monitoring station to Broad Beach is CDIP Buoy 102 offshore of Point Dume in 365 meter water depth. The significant wave heights and wave periods based on wave direction at this buoy are shown in Figure 4-2 and Figure 4-3, respectively. Flick and O Reilly (2008) studied wave exposure at Broad Beach based on the closest NOAA wave buoy (Buoy 46025, approximately 33 miles northwest of Catalina Island). Their study presented wave transformation coefficients that can determine the relative wave height at Broad Beach as a function of the offshore wave period and direction of wave travel. The study showed that Broad Beach is vulnerable to a broad swath of southerly and south-westerly approaching waves (from 170 degrees to about 240 degrees) where the refraction coefficients are close to 1 (high) or ever larger in a few instances. Wave exposure falls off rapidly for essentially all wave periods for approach directions north of about 260 degrees v2 Draft 17
54 Figure 4-2. Significant Wave Height (Wave Rose) Offshore of Point Dume (CDIP, 2010) v2 Draft 18
55 Figure 4-3. Peak Wave Period (Period Rose) Offshore of Point Dume (CDIP, 2010) v2 Draft 19
56 4.2.2 Extreme Waves Flick and O Reilly (2008) also noted a number of extraordinary large wave events in the NOAA wave buoy records. These include the maximum measured wave height of about 26 feet on January 19, 1988 and several other wave-storm events exceeding 20 feet. Based on the NOAA wave buoy data from 1982 to 2001, the mean monthly wave heights varied by only 50% or so (range of 3.3 to 5 feet), whereas the seasonal variation in the extreme wave heights varied by a factor of four (from ~6.5 feet in July to 26 feet in January). Extreme wave heights drop substantially to about 13 feet by April and May each year, and stay that way on average through October. El Niño conditions cause increased storminess and have historically increased the frequency and intensity of higher local waves, increasing the severity of beach erosion and coastal flooding. El Niño conditions occur on average every 2-5 years, and usually last about 12 months. Strong El Niños occur less frequently and come in many different varieties, with no two ever the same (Flick, 2009). Whether and how waves from any particular El Niño winter affect southern California is largely determined by the tracks storms take as they travel from their generation regions in the western Pacific off Asia toward the Eastern Pacific and North America. These tracks are determined by the path of the mid-latitude jet stream, which depends on the relative positions of the North Pacific high pressure system and the Aleutian low. About two-thirds of El Niños are associated with strong winter storm activity in southern California. (Flick, 2009) El Niños have occurred most recently in , , , and , , , and The was the strongest on record and it developed more rapidly than any El Niño of the past 40 years. The El Niño is also considered to be one of the most major recent storm events and caused considerable damage along the coast of California Design Wave for Shoreline Structures The critical design case for shallow water shoreline structures is when wave breaking takes place in front of the structure (CEM 2003). The maximum height of waves which can break upon a shoreline structure is limited by the water depth fronting the structure. The water depth varies over time based on tide levels and will increase with future sea level rise. This analysis is based on this maximum depth-limited breaking wave height, which is defined as the design wave height. Deep water waves exceeding the design wave height will break offshore and dissipate much of their energy before they reach the shoreline structure. A statistical evaluation of extreme high water elevations was developed based on the recorded annual extreme high water elevations obtained from the NOAA/NOS LA Outer Harbor reference tide station (Table 4-5). The effect of future relative sea level rise must also be included in the determination of the design water depth. The extreme scour elevation is also required to determine the design water depth at the toe of any potential shore protection device. Due to the variability of the sand elevations from seasonal changes and storm events, it is difficult to predict with great accuracy the depth of scour. But, based on experience in Southern California, a scour depth of 0 feet MLLW is appropriate to reduce undermining. Therefore, scour depth at the toe of the structure is estimated to reach the mean lower low water elevation v2 Draft 20
57 Based on the probabilistic extreme high water elevations, sea level rise, and assumed scour elevation, a range of potential design water depths was calculated, i.e. the low end of the range was calculated based on a 5-year recurrence high water elevation with a low rate sea level rise. A high end estimate was calculated based on a 100-year recurrence high water elevation with the highest rate sea level rise. Factors other than water depth affecting the maximum wave height include the incident wave period and nearshore beach slope. Longer period waves will result in higher design breaking waves (USACE 1984). A design wave period, T, of 16 seconds was selected as the design period to obtain the subject breaking wave height, as this represents the average of the most frequently occurring storm-generated swell in this region. Based on available beach profiles in the Broad Beach area, nearshore slopes ranged from approximately 25:1 (horizontal:vertical) to 30:1. Estimates of breaking wave heights were developed using methods described in the Shore Protection Manual (USACE 1984) and Coastal Engineering Manual (USACE 2003), for the range of potential design water depths. The results (range of potential breaking wave heights) are shown in Table 4-5. Table 4-5. Broad Beach Breaking Wave Heights Range Probabilistic Still Water Elevation Based on LA Harbor Tide Gage Statistics Recurrence Interval (Years) Elevation (Feet, MLLW) Probabilistic Sea Level Rise by 2050 (Feet) Design Water Level (Feet, MLLW) Maximum Scour Depth (Feet, MLLW) Design Water Depth (Feet) Breaking Wave Height (Feet) Low Rate Likely High Rate Highest Rate These large breaking wave heights are indicative of the relatively steep nearshore profile fronting Broad Beach and the significant estimates of future sea level rise. 4.3 Sediment Transport Rate Analysis The preceding sections summarize existing and available data used to describe historic and recent shoreline locations, wave climate and its role in shoreline dynamics, water level variations, and projected future sea level rise that can affect wave conditions and shoreline location. This section draws upon this information and other data sources to conduct detailed analysis to quantify historic shoreline changes and sediment transport rates which constitute the key parameters in the development of a long-term shoreline restoration project. The average Broad Beach sand volume changes relative to an arbitrary base are presented in Figure 4-4 through Figure 4-6, and include the associated trendlines. Figure 4-4 shows the full 63-year data record. Figure 4-5 illustrates the trend over the past 41 years during which the beach was generally erosive. Figure 4-6 shows the most recent five-year time period. By reviewing the changes in volumes, as well as rates of change in volume, trends in the sediment transport regime can be assessed. The earliest switch v2 Draft 21
58 from rise to fall in the volume of the littoral sediment lens appears to have occurred in the late 1960s and 1970s. The peak was followed by a progressive loss until the present. The trendlines indicate the following: Figure 4-5: , 41 years of data - 20,000 cubic yards per year (cyy) loss. Figure 4-6: , 5 years of data - 35,000 cyy loss. These trends indicate a continuing pattern of erosion since the 1970s and acceleration of erosional trends. 1,600,000 1,400,000 6-Data-Points Moving Average Sand Volume (Cubic Yards) 1,200,000 1,000, , , , Year Figure 4-4. Volumetric Changes, v2 Draft 22
59 This number, in all graphs, indicates the average sand loss rate Figure 4-5. Volumetric Changes, ,000 Sand Volume (Cubic Yards) 800, , ,000 Trend Line Volume = 70,400,000 - (35,000 x Year) 500, Year Figure 4-6. Volumetric Changes, v2 Draft 23
60 Subsequent to the detailed sediment transport rate analysis described above, analysis of seasonal beach profile survey data between 2009 and 2014 further corroborates this estimate with an estimated annual beach volume loss of 33,000 cubic yards per year. 4.4 Summary Sand loss estimates were developed based on the sum of two components of sand loss: (1) the current natural loss rate projected into the future, and (2) the additional loss due to beach widening (beach nourishment). Between 1974 and 2009, Broad Beach lost approximately 600,000 cy of sand. On average, the shoreline moved 65 feet further inland. The greatest recession occurred close to Lechuza Point and tapered off toward Trancas Creek. Once the sand budget turned negative in 1974, the Broad Beach loss rate increased thereafter by approximately 900 cy per year. By 2009, the natural sand loss rate was about 35,000 cubic yards per year at Broad Beach. During the period of 2009 to 2014, the loss rate remained similar at 33,000 cubic yards per year. The Broad Beach shoreline is retreating because of a negative sand balance. Sea level rise accounts for less than 5 percent of the imbalance. An analysis of wave measurements and historical beach and shoreface data also argues against the notion of a decades-long transport of hundreds of thousands of cubic yards offshore. Rather, the sand imbalance is due to a positive longshore sand transport gradient. The analysis indicates the gradient is either due to a reduction in sand supply entering around Lechuza Point or a change in the alongshore component of wave energy that increases the amount leaving near Trancas Creek v2 Draft 24
61 5. Description of Revised Proposed Project 5.1 Project Objectives The Broad Beach Restoration Project seeks to design, permit, and implement a long-term shoreline restoration program that provides erosion control and property protection, with ancillary benefits of improved recreation and public access opportunities, aesthetics, and environmental stewardship. The need for this project results from a decades-long trend of shoreline erosion that has recently accelerated and reached a critical point in which residential structures and onsite wastewater treatment systems are threatened by coastal erosion and flooding. The major objectives of the proposed Project include: Protect existing homes, structures and other improvements including septic systems along Broad Beach from coastal erosion; Create and maintain a wide sandy beach backed by a restored dune system similar to that which historically occurred along this reach of coastline; and Develop a cost-effective long-term plan for maintaining shore protection along Broad Beach. 5.2 Key Elements of Revised Project The revised Project, as proposed, would implement a shoreline protection plan along Broad Beach for at least 20 years, consisting of: Beach nourishment to recreate both a dry sand beach and a restored dune system; At least 20 years of dune restoration; At least 20 years of sand backpassing designed to prolong nourishment; and Permitting the partially relocated 2010 rock revetment as a permanent structure buried under both the beach nourishment and dune. The BBGHAD proposes to conduct a minimum of two Major Nourishment events in the first 10 years of the Project. Placement 1 of 300,000 cubic yards would occur in year 0 and placement 2 would occur approximately 5 years later. The performance of the Project would be monitored regularly, assessed every 5 years, modified as required and upon permitting by all agencies. Another two Major Nourishments, also of quarry sand, would be conducted in approximately year 10 and approximately year 15 as needed in accordance with objective triggers. The BBGHAD also proposes to conduct smaller-scale backpassing from wider reaches of the beach to narrower reaches of the beach according to certain objective triggers, with the frequency not expected to exceed one time per year. In the event that insufficient sand volume exists for backpassing, the BBGHAD intends to complete Interim Nourishments and Erosion Nourishments to maintain a sufficient sand beach over the Project length to bury any exposed rock revetment and maintain a minimum width of sandy beach. The frequency and volume of such nourishments will be determined by certain additional objective renourishment triggers. 5.3 Revised Beach and Dune Design The total Project area of new dunes, beach berm and beach face would cover up to 24.3 acres. The height of the proposed sand dunes would be typical of the existing dunes at the east end of the Project, approximately 20 feet higher than MLLW. MLLW is the average of the lower of the two low tides that v2 Draft 25
62 occur each day. The top of the relocated emergency rock revetment would be buried beneath at least 2 and up to 5 feet of sand. Depending on location, the profile of the new dry sand beach berm would be roughly 12 to 15 feet above MLLW or existing low tide winter sand levels. The new post-construction dry sand beach berm would extend seaward of the dunes by approximately 60 to 75 feet. At its widest point, the combined new beach and dune system would extend for 240 feet seaward from approximately the top of the relocated revetment to the surf zone on the face of the beach berm. Due to predicted impacts, the proposed Project under Alternative 4C has been revised not only to avoid direct placement of beach and dune building material on sensitive habitat including rocky intertidal habitat, rocky outcrops, offshore reef, and associated surf grass habitat, but also, at the CCC s request, to avoid the "boulder field centered seaward of approximately Broad Beach Road. As a result, direct placement of beach and dune building material will end at Broad Beach Road. A plan view of Alternative 4C placement is provided in Figure 5-1 and typical sections shown in Figure v2 Draft 26

63 Figure 5-1. Plan View of Alternative 4C v2 Draft 27
64 Figure 5-2. Alternative 4C, Typical Sections v2 Draft 28
65 The revised dune plan incorporates a linear sand mound, or ridge, along the reach with sand fences to catch sand and allow the dunes to form naturally, rather than installing a "finished" product as formed by contractors. The BBGHAD proposes to install planting along the ridge to slow and trap sand in the dune. The revised dune plan incorporates three (3) ridges at the east end and identifies that reach as designated dune habitat, intending it to be permanent. The remainder of the reach west of designated dune habitat is sacrificial dune between Broad Beach Road and Broad Beach Road; this portion of the dune area may be lost due to the reduction in nourishment volume fronting and protecting the dunes, and may not be required to be replaced with subsequent nourishments. However, this "sacrificial dune" dune area could be replaced at BBGHAD discretion. The designated dune habitat is located between Pacific Coast Highway and Broad Beach Road and would fully mitigate impacts to existing dunes if required at a 3:1 ratio. The BBGHAD proposes the footprint east of Broad Beach Road and ending at Broad Beach Road to have a combined dune and dry sand beach berm approximately 125 feet wide and a beach berm face constructed at a 5:1 slope extending seaward for an additional 60 feet where it intersects the existing beach. The BBGHAD proposes the beach berm in this area at 12 feet above MLLW. Between Broad Beach Road and Broad Beach Road, where the revetment relocation landward will occur in accordance with CCC direction, the dune area is proposed to widen and range from approximately 75 feet in width to approximately 150 feet. The BBGHAD proposes the landward toe of the dune to extend up to 25 landward of the relocated revetment and the seaward toe up to 90 feet seaward of the revetment with dune elevations at roughly 15 to 20 feet above existing MLLW to cover the existing revetment. The BBGHAD designed the proposed dune area to replicate the existing dunes at the eastern end and former dunes at the site by varying in footprint and shape. Figure 5-3 shows the designated and sacrificial habitats in cross section. In areas where the constructed dune abuts existing dune on the landward side, the BBGHAD's proposal would meet or exceed the elevation of the existing dune to protect existing dune habitat. In areas where the constructed dune abuts lower lying non-dune private properties, the BBGHAD proposes the dune to slope landward for 10 to 20 feet in a 3:1 slope. In the locations within the Project area with no rock revetment, the BBGHAD contemplates that the constructed dune system would likely be lower and tapered to integrate with conditions at each adjacent property. The BBGHAD proposes the dune construction to undulate along the beach in order to preserve natural, historic dune composition v2 Draft 29
66 Figure 5-3. Cross Section of Sacrificial and Designated Dune Habitat Areas Source: Moffatt & Nichol v2 Draft 30

67 5.4 Sand Sources for Beach Nourishment and Dune Restoration The primary sand sources for the proposed Project are inland quarry material, suitable for dune and beach-quality sand (see Figure 5-4). Since 2010, the BBGHAD has expended significant time and effort investigating offshore, harbor-area, and former river bed sand sources for beach nourishment and dune building material. For example, with oversight from the primary permitting authorities, the BBGHAD conducted extensive benthic, chemistry, grain size, and other analyses on sand approximately feet below the water surface approximately one third mile offshore Dockweiler State Beach in Los Angeles. Subsequently, the BBGHAD discovered that the City of Los Angeles owned the subject offshore sand and was not interested in selling this sand to the BBGHAD. The BBGHAD also investigated other sand in Ventura Harbor and in Calleguas Creek in Ventura County, but these sands could not meet chemical compatibility requirements with native Broad Beach material or other governmental agency requirements. In short, all of the alternative sand sources were discovered to either have material which was deemed incompatible with the Project s goals, presented insurmountable hurdles in securing authorization or, in the example of the offshore Trancas site, was located in a marine protected area with restrictions on allowable offshore activities. Quarries Broad Beach Figure 5-4. Broad Beach Restoration Project - Sand Source Area v2 Draft 31
68 Sand for beach nourishment should be of medium-grain size, coarser than the fine-medium grain size present on the existing beach in order to better resist erosion and maximize dry beach width. The proposed source for medium-grain sand are private local commercial quarries (CEMEX, Grimes Rock, and P.W. Gillibrand, collectively, "Local Inland Sources") in the Moorpark/Simi area of the Simi Valley, miles north of the Project site by air and miles north of the Project site by truck. The BBGHAD proposes to transport the quarry material via truck to the Broad Beach site and distribute it by heavy equipment including large (40-ton capacity) off-road trucks, bulldozers and scrapers to create the final beach and dune templates. Front-end loaders are proposed to be used to move sand as needed. The stockpiled materials originate from a sandstone geologic formation believed to be a former seabed, i.e. marine sedimentary rock. Two quarries, Grimes Rock and CEMEX, possess the capacity to provide the quantity of sand required for the Project (300,000 cubic yards of material per Major Nourishment). A third quarry, P.W. Gillibrand, can supplement the Project if the other quarries cannot meet the capacity needed to serve the Project, and can significantly expand operations, if needed, to potentially supply the Project with all of the material. The material is continually excavated, stockpiled, and removed as part of ongoing quarry and aggregate sales operations. Figure 5-5 shows the geologic setting of the quarries and indicates that sandstone is the sediment source. Large strata of sandstone are typically formed in pre-historic marine environments, suggesting that these materials are former seabed. Sand sieve test results show the material to be 92.5% sand and 7.5% silts and clays, which is generally compatible with the beach. The median diameter of the quarry material is larger than the current beach, but this fact is an attribute for beach nourishment material as the fill material will reside on the beach longer and prolong benefits. The San Diego Association of Governments used beach fill material that was more coarse than the native material in both 2001 and 2012 to maximize the San Diego area project s life, and to also maximize the width of the new beach berm. Coarser sand resides higher on the beach profile and typically results in a wider recreational beach berm area than finer sand v2 Draft 32

69 Figure 5-5. Geology Strata of the Quarries as Sandstone Note: The Blue Polygon Represents the Sandstone Deposit. In response to CCC requirements, the median grain size or d50 of the quarry material selected for beach and dune creation will be between 0.24 mm and 0.60 mm. Photographs of the existing sand stockpiles at each quarry are provided below. These stockpiles are continually reworked, turned over, removed, and replaced for commercial purposes, so the sand is well mixed and homogeneous throughout the piles v2 Draft 33


70 Photo 5-1. Sand Stockpile at the Grimes Rock Quarry Photo 5-2. Sand Stockpile at the CEMEX Quarry The beach and dune material would be excavated from one or more of the listed quarries and would be trucked in 14-cubic-yard-capacity, bottom-dump trucks v2 Draft 34

71 Photo 5-3. Sand Stockpile at the P.W. Gillibrand Quarry 5.5 Dune Habitat Restoration In accordance with governmental agency direction, the proposed dune restoration Project includes measures to restore native coastal dune habitats through planting of appropriate native dune vegetation, potentially restoring all such areas to their current ESHA designations and protections consistent with the City of Malibu s LCP/LUP. The BBGHAD proposes native habitat restoration to include planting species such as beach verbena, dune primrose and other characteristic species found in this community. The BBGHAD proposes to assume responsibility for the construction, planting, and maintenance of the restored dune system (BBGHAD Resolution No. 2012/06). A program of initial removal of non-native invasive species such as iceplant (Hottentot fig), pampas grass, myoporum, and European dune grass from areas within and adjacent to the restored dunes would be initiated. As proposed, signs would be posted to demarcate sensitive dune habitats (e.g. Habitat Area: Please Remain Seaward of Dunes on Sandy Beach"). No public access will be permitted on the dunes. By their nature, dunes are an attraction for those who desire to climb up and on top of them. Doing so will reduce the size of the dunes, weaken their structure, adversely affect burgeoning plant life, and create added risk of trespassing into protected ESHA and residential areas. Further, protocols would be implemented for long-term maintenance of restored habitats, including initial irrigation plans, ongoing invasive species/weed control and maintenance of signs and access control measures. Existing historical paths from the residences to the beach will remain and also serve as a practical and defined means for property owners to preserve and maintain the native vegetation within the protected, restored dune areas. Paths from the residences, the Malibu West Beach Club, and the County-owned vertical access points to the new dry sand beach will provide access for those who have historically used such pathways and also protect newly established and restored dune habitat from random passage to the beach. Property v2 Draft 35

72 owners will continue to be able to recreate at the seaward crest of the restored dunes. A conceptual rendering of the Project is shown in Figure 5-6. Figure 5-6. Conceptual Rendering of Dune Restoration Source: Moffatt & Nichol Private Property and Public Lateral Access Currently, public lateral access along Broad Beach is limited to times of low and moderate tides. Public access landward of the MHTL is also affected by uneven distribution of Access and Recreational Use Easements (AREs) for lateral access, which are recorded on approximately 35% of the private parcels along Broad Beach. These AREs typically extend inland on private property between 10 and 25 feet above the MHTL. However, in some areas, the existing revetment now overlies these AREs. Nonetheless, segments of the revetment that overlie existing AREs that have been accepted and recorded by CSLC and various agencies on private land would remain in place with lateral public beach access proposed to be accommodated on the new wide sandy beach. In recognition of the ancillary public benefits from the Project and in further recognition that existing lateral easements: (a) cover a relatively small portion of the beach; (b) are inconsistent with one another and create uncertainty and confusion; and (c) are of limited value given the absence of a sandy beach under current beach conditions, all existing lateral access OTDs, AREs, and all currently existing lateral access easements are proposed to be suspended for the duration of the Project in accordance with Project specifications and the maintenance of same. The BBGHAD has proposed to governmental agencies that, for the duration of the Project, the October 2009 survey may serve as the public/private seaward boundary, subject to Project-specific restrictions on access to the restored dunes. To the extent that any restored dune area lies seaward of the October 2009 MHTL (i.e., on public property), the individual BBGHAD property owners would be granted, through appropriate legal means, unrestricted access to the public property seaward of their properties from the 2009 MHTL to the seaward toe of the restored dunes - subject to the use restrictions specified in Project permits. A cross-section of the restored dune and proposed private dune access and public beach dedication is shown in Figure v2 Draft 36
73 ACCESS EASEMENTS GRANTED BY CERTAIN OWNERS PUBLIC DRY SAND BEACH POST CONSTRUCTION MHTL Figure 5-7. Conceptual Cross-Section of Restored Dune and Beach with Existing Offers to Dedicate and Public Beach Area v2 Draft 37
74 5.7 Equilibrium of the Beach After Nourishment For a beach nourishment project, sand is initially placed high on the upper portion of the beach profile above the mean lower low tide area. This is done to expand the level beach berm area for immediate benefit, to retain the sand for as long as possible, and to facilitate construction. The constructed beach immediately incurs change by waves and tides that distributes the sand both offshore and alongshore. As sand redistributes, the nourishment project typically experiences a process of equilibration to a more natural condition of berm width and profile slope that depends on sand grain size and wave energy (the equilibrium beach profile ). As proposed, the Project is expected to function in a similar manner. For the Project, the equilibrium beach profile was estimated using several different methods. Essentially, the estimates show that approximately one-quarter to one-half of the width of the beach berm may be lost within approximately one season after construction (depending on conditions and nourishment sand quality), and the slope of the beach flattens (Figure 5-8) as the material deposits slightly farther into the nearshore. Figure 5-8. Example of Equilibrium Beach Profile for Alternative 4C 5.8 Beach Fill Performance Monitoring The performance of the beach fills is anticipated to be monitored by a dual program comprising long term beach profile surveys, augmented by more frequent measurements of the dry beach berm width. Each program is described as follows: Long-Term Beach Profile Monitoring In order to determine the performance of the nourishment Project and monitor the effect of coastal erosion on sand loss on the beach in accordance with direction from governmental agencies,, the v2 Draft 38
75 Applicant proposes to perform long-term beach profile monitoring. This monitoring would be intended to identify and assess coastal erosion and the potential need to initiate backpassing or other proposed nourishment activities to offset such erosion. This monitoring is proposed to include: 1. Measurement points: Monthly measurement (systematically at the same time of each month) of the dry sand beach width (similar to that performed at Zuma Beach by Los Angeles County presently) from the seaward toe of the restored sand dune system to the seaward edge of dry sand "towel area" at nine measurement point profiles specified below and shown on Figure 5-9. The measurement can be done with a tape measure or roll tape, or other suitable low technology device. a) 408 (east end Broad Beach Road) b) 409 (east-central reach Broad Beach Road) c) 410 (central reach Broad Beach Road) d) 411 (west-central reach Broad Beach Road) e) 411.7* (west-central A reach Broad Beach Road) f) 411.9* (west-central B reach Broad Beach Road) g) 412 (west end 31506/31504 Victoria Point Road) h) 412.3* (west end A Victoria Point Road) i) 412.5* (west end B 31536/31532 Victoria Point Road) (* These transects were first surveyed in spring 2013 and were added at the request of the California Coastal Commission per its filing status letter dated February 8, 2013.) 2. Semi-annual (spring and fall) full beach profile measurements out to the closure depth (approximate ocean water depth of 40 feet). 3. Estimation of the rate and trend of beach width change and sand volume change at each of the measurement points for one year prior to construction and continually after construction for 10 years. 4. Zuma Beach Width: A total of seven beach profiles will be surveyed every six (6) months to quantify total sand volume and width changes within the littoral mini-cell between Lechuza Point and Point Dume Beach Berm Width Measurements The BBGHAD has proposed to take more frequent measurements of the beach berm width along Broad Beach to supplement the surveyed beach profiles. As proposed, the measurements would be taken from fixed benchmarks (storm drain outfalls) at the back of the beach to the wetted bound line to provide an approximation of the dry beach width above the mean high water line. This measurement yields data of the dry beach width over time and space. The U.S. Army Corps of Engineers (USACE) performs these types of measurements along Orange County (called "Clancy measurements"). These measurements are quite useful because they are frequent (monthly) and can capture impacts from storm events. The proposed storm drain outfall structures to be constructed at four locations along the revetment will provide visible and fixed benchmarks ideal for regular beach width measurements. The storm drain outfall structures would be located near profiles 411 (west), 410 (central) and 409 (east) and would provide useful data to supplement the surveyed beach profiles. These three locations would also v2 Draft 39

76 provide a good indicator of the remaining beach width in front of the revetment at the west, central and east ends of the Project. In addition to measured beach widths from three benchmarks, the BBGHAD proposes to use a handheld GPS unit to record the horizontal position of the wetted bound line along Broad Beach. This would provide a continuous line from Trancas Creek to Point Lechuza that could be displayed on Project drawings to provide an estimated beach width along the entire Project. The beach widths measured from the benchmarks could then be used to verify and correct coordinates from the handheld GPS unit. Figure 5-9. Transects for Beach Profiling at Broad Beach and Zuma Source: Coastal Frontiers Adaptive Management Actions Based on information obtained from the beach profile and beach width monitoring program, the BBGHAD will determine if site conditions trigger the need to undertake certain beach management actions. These will identify when beach erosion is reaching a point that threatens Project benefits including protection of private property and recreation, with careful attention to also maintaining public access seaward of the revetment. The triggers are crafted to permit sufficient time to implement management actions to maintain these benefits. The BBGHAD proposes these management actions to maintain a widened beach in an adaptive manner prior to the Major Nourishments at approximately 5 year intervals. In the event of a severe coastal storm wave event or series of events which strip the beach of sand and subject to monitoring results and BBGHAD finances, the BBGHAD seeks the flexibility to conduct Major Nourishments more often than every five (5) years in addition to or in lieu of Interim Nourishments and Erosion Nourishments as described below. Adaptive management actions are proposed to include: (1) short-term backpassing events meant to prolong the life of the beach nourishment activity and equalize the benefits of the Project among the homeowners within the BBGHAD; (2) Interim Nourishments of up to 75,000 cubic yards (subject to availability of additional BBGHAD funding); and (3) up to three (3) Erosion Nourishments of up to 75, v2 Draft 40
77 cubic yards per 10-year period. The management actions would l be triggered when the beach width data meets the criteria listed below and illustrated in Figure Backpassing, as proposed, would be triggered when the average dry beach width fronting the western revetment near Transect 411 is approximately 75 feet or less for 3 consecutive months. Beach widths measured from the storm drain outfall structure near Transect 411 (31284 Broad Beach Road), supplemented with surveyed beach profile data at profile 411, would be analyzed to determine when this trigger is met. As proposed by the BBGHAD, if trigger measurements are met in the spring,then the 3 consecutive month window would be tolled or suspended for the summer months i.e. from Memorial Day to Labor Day as no construction or backpassing activities can occur on the beach during that time. 2. Interim Nourishments, as proposed, would be triggered when the average dry beach width fronting the western revetment near Transect 411 is approximately 30 feet or less for 6 consecutive months and is recorded by two (2) consecutive full beach profile surveys and insufficient beach width exists to provide 10,000 cubic yards of backpassing sand from the eastern end of Broad Beach. Beach widths measured from the storm drain outfall structure near Transect 411 (31284 Broad Beach Road), supplemented with surveyed beach profile data at profile 411, would be analyzed to determine when this trigger is met. Should trigger measurements be met in the spring, then the 3 consecutive month window would be tolled or suspended for the summer months i.e. from Memorial Day to Labor Day as no construction or backpassing activities can occur on the beach during that time. 3. Erosion Nourishments, as proposed, would be triggered if natural ocean forces, backpassing, and Interim Nourishments fail to cause at least 10 feet of sand to remain seaward of the revetment between Transects for six (6) consecutive months ("Erosion Nourishment Trigger") as measured at mean sea level as determined by the initial post-cdp survey. In this Erosion Nourishment scenario, the BBGHAD would nourish with at least 75,000 cubic yards of imported sand seaward of the revetment in the area that does not meet the objective access criteria. The BBGHAD proposes to complete Erosion Nourishments no later than May 1 of the year following the Erosion Nourishment Trigger date and in no event shall Erosion Nourishments begin after April 15 of any year. Erosion Nourishments of a maximum of 75,000 cubic yards would be conducted no more than three (3) times per 10 years for the duration of the permit v2 Draft 41
78 Figure Adaptive Management Triggers v2 Draft 42

79 5.9.1 Backpassing Photo 5-4. Sand Backpassing in Long Beach, CA As proposed, backpassing would involve the use of heavy equipment (e.g., scrapers, bulldozers) to excavate sand from the downdrift sand rich segment of Broad Beach (anticipated to be the eastern reach) and its transport back updrift to the eroding reach of Broad Beach (anticipated to be the western reach of the Alternative 4C footprint). Backpassing is proposed to extend the practical lifetime of this beach nourishment project by recycling sand back updrift within the littoral cell and delay the need for major beach renourishment. Backpassing is less expensive than small-scale nourishment from either onshore sources via trucking due to high unit cost or from offshore dredging due to equipment mobilization costs. The objective backpassing triggers intend to maintain a balanced benefit of the beach nourishment to the maximum extent practical for BBGHAD purposes, and to maintain dry sand beach seaward of the revetment. As part of the overall Adaptive Management Plan (AMP), these triggers will assist in identifying when beach erosion reaches a point that threatens Project benefits (e.g., protection of private property, lateral access, recreation, etc.) and to permit sufficient time to implement management actions to maintain these benefits. The triggers are meant to be used in combination with on-site observations, beach width measurements, profile monitoring, and an understanding of historical v2 Draft 43
80 and projected future trends. The BBGHAD proposes to re-evaluate the triggers frequently due to the large variability in potential shoreline change rates. The concept of sand backpassing was incorporated into the Project at a time when the intended nourishment volume was 600,000 cubic yards. With that volume and resulting beach widths, backpassing was proposed as an effective measure to extend the life of the nourishment by pushing sand from the downdrift, wider portion of the beach and transporting it west to the updrift and narrower reaches. With the Major Nourishment volume reduced to 300,000 cubic yards, the opportunities for effective backpassing of sufficient sand surplus at the downdrift end of the Project may be limited after the first one to two years after Major Nourishments. Since the net direction of sand movement (littoral drift) is to the east, it is anticipated that the predominant backpassing operation will be from east (surplus) to west (deficit). The resulting action would backpass sand using mechanical equipment (scrapers and bulldozers) from the wide reach of beach (surplus area) to widen the narrow reach (deficit area) of beach. The anticipated borrow area will extend from Transect 410, near the center of Broad Beach, toward the east for a distance of about 3,000 feet. Along this reach sand will be backpassed from the dry beach (above Mean High Water) while maintaining a 10 foot buffer from the dune restoration area. The sand volume available for backpassing operations within the borrow area will depend on the actual dispersion of the initial beach fill. Modeling results indicate there could be up to 25,000 cubic yards available within this borrow area for the first backpassing operation expected to occur about 1 year after the initial beach fill. A schematic plan and typical section of the borrow area are shown in Figure 5-11 for the first backpassing event. Subsequent events will involve backpassing volumes of 15,000 cubic yards or less. The anticipated placement area for backpassed sand will be 500 feet on either side of Transect i.e. a total linear length of 1,000 feet between and Broad Beach Road. Backpassed sand will be placed up to an elevation of +12 feet, MLLW and within the limits of the original beach fill template. The first backpassing event, expected to occur about 1 year after the initial fill, would increase the beach width by about 40 feet within the placement reach. A schematic plan and typical section of the placement area are shown in Figure 5-12 for the first backpassing event v2 Draft 44

81 Figure Schematic of Borrow Area for Alternative 4C Year 1 Backpassing Operation (15,000 cy) v2 Draft 45


82 Figure Schematic of Placement Area for Alternative 4C Year 1 Backpassing Operation (15,000 cy) v2 Draft 46
83 5.9.2 Interim Nourishments Prior to the scheduled Major Nourishments after the initial sand placement, the need may arise for the placement of additional sand along Broad Beach to maintain Project objectives. Interim Nourishments, at the discretion of the BBGHAD and subject to BBGHAD finances, are proposed as an adaptive management action when beach width along the western portion of Broad Beach has narrowed to the point where seasonal fluctuations in beach width could result in revetment exposure and limited lateral beach access. When the beach width trigger is reached and backpassing is not feasible, up to 75,000 cubic yards of Interim Nourishment sand (of same specification as original nourishment) would be obtained from an approved sand borrow site, transported from the local inland source(s), and deposited on Broad Beach. This volume will provide approximately 50 feet of dry beach width over a 2,000 foot reach of assumed sand deficit area. The sand source for these renourishments would be the same as for the initial nourishment, unless the applicable agencies approve other borrow sites and all details for construction described in the Project description would apply. A schematic plan and typical section of an Interim Nourishment is shown in Figure Erosion Nourishments In addition, if natural ocean forces, backpassing, and Interim Nourishments fail to cause at least 10 feet of sand to remain seaward of the revetment between Transects for six (6) consecutive months ("Erosion Nourishment Trigger") as measured at mean sea level as determined by the initial post-cdp survey, the BBGHAD will nourish with a maximum of 75,000 cubic yards of imported sand seaward of the revetment in the area that does not meet the objective access criteria. The BBGHAD proposes to complete Erosion Nourishments up to three (3) times per 10-year period, and no later than May 1 of the year following the Erosion Nourishment Trigger date and in no event shall Erosion Nourishments begin after April 15 of any year v2 Draft 47


84 Figure Schematic of Placement Area for Alternative 4C Interim Nourishment v2 Draft 48

85 5.10 Project Benefits West of Broad Beach Road As has been presented within this report, the western extent of the direct placement of beach nourishment sand is at Broad Beach Road. This reduction in the sand placement footprint was required to avoid impacts to sensitive nearshore habitat resources associated with both direct and indirect burial by fill sand. Direct impacts imply sand placed directly on sensitive habitat areas; indirect impacts result from westward and seaward migration of the initially placed fill. Both the analytical and numerical modeling tools used to predict movement of the beach fill material demonstrate that while the majority of the sand is moved toward the east due to the prevailing wave direction, there will be transport of sand westward toward Lechuza Point, therein providing measurable dry sand beach and the related benefits of enhanced shore protection and recreational opportunities. Westward transport of sand is predicted to occur immediately during and following the beach fill due to the change in shoreline orientation caused by the initial fill itself. This simple concept is illustrated in Figure 5-14 below. Figure Illustration of Bi-Directional Transport of Sand at Edge of Beach Fill Figure 5-15 illustrates the westerly migration of sand for the initial 300,000 cy fill case alone. The model includes a realistic placement rate of sand, such that at completion of construction, there has been sufficient time for sand to be reworked and moved by wave action. Table 5-1 compares the average beach width gained within the western portion of the beach (west of 31380) with the average width gained over the remaining eastern reach. The table then tabulates the predicted relative benefit ratio of beach width added within the western portion of the beach compared to the east v2 Draft 49
86 Time after Initial Fill Table 5-1 Comparison of Average Beach Width Added for West and East Reaches Post 300,000 cy Fill Average Beach Width Added (West of 31380) Average Beach Width Added (East of to 30708) Relative Benefit Ratio of Beach Width Added (West/East of 31380) 0.5 year 50 ft 79 ft year 34 ft 63 ft years 10 ft 44 ft 0.22 Figure 5-16 shows the case where an additional 75,000 cy interim fill is placed two years after the initial nourishment of 300,000 cy based on the objective triggers discussed previously. When the 75,000 cy interim fill is placed it is assumed that some material remains on the beach two years after the initial 300,000 cy placement. Again, transport of sand westward of the placement footprint is predicted by the model. Table 5-2 compares the average beach width added from the initial nourishment of 300,000 cy and an interim renourishment of 75,000 cy occurring at year 2. Time after Initial Fill Table 5-2. Comparison of Average Beach Width Added for West and East Reaches Post Initial 300,000 cy Fill With Interim 75,000 cy at Year 2 Average Beach Width Added (West of 31380) Average Beach Width Added (East of to 30708) Relative Benefit Ratio of Beach Width Added (West/East of 31380) 0.5 year 50 ft 79 ft year 34 ft 63 ft years 10 ft 44 ft years 40 ft 60 ft years 20 ft 50 ft years 2 ft 29 ft 0.07 It s important to note these predictions are based on a simplified numerical model with a synthetic wave conditions applied. The actual amount of sand transported in a westerly direction will depend on the ocean conditions (weather, waves and water levels) during and after construction. Numerical modeling of shoreline morphology is inherently imprecise because of the complexity of coastal processes. The GENESIS model is intended to provide a generalized long-term trend in shoreline response. Short-term changes in shoreline positions may vary from these results due to the unpredictable and complicated coastal processes which influence Broad Beach and neighboring beaches. The results can be relied upon for anticipating general areas of accretion or erosion at orders of magnitude over large-scales and relative differences between proposed nourishment volumes and shapes, rather than in predicting very precise, site-specific increments of shoreline movement over very small scales v2 Draft 50
87 5.11 Partial Revetment Relocation As part of the long-term strategy for protection of structures, including septic systems, from coastal erosion, the BBGHAD is seeking approval of the emergency rock revetment constructed in 2010, and has agreed to move the eastern 1,600-foot portion of the revetment landward of its current location. Similar to the initial construction of the emergency revetment, the cost of relocating the revetment will be borne by the individual homeowners and not a part of the GHAD assessment. The revetment relocation cost is estimated at approximately $1,500 per linear foot v2 Draft 51
88 Figure Predicted Shoreline Change after 300,000 cy Nourishment v2 Draft 52

89 Figure Predicted Shoreline Change after 75,000 cy Interim Nourishment v2 Draft 53
90 5.12 Project Construction As proposed, construction for the proposed Project would involve the following sequence of events some of the tasks may occur concurrently: Transporting the sand via truck from inland quarries. An estimated 21,500 truck trips would be required to transport the sand for the initial nourishment of 300,000 cubic yards from the Local Inland Sources. Redistributing the sand as needed with earthmoving equipment, such as bulldozers, and grading the beach fills to required dimensions; and Annual redistribution of the sand from the wide reach of the beach to the narrow reach using heavy equipment such as scrapers and bull dozers Initial Project Construction Schedule Initial and subsequent Major Nourishment construction activity is estimated to extend over approximately eight (8) months. The window of time when an eight-month Project may occur should extend from approximately September 15 to May 15 of the years of construction. The beach nourishment portion of the Project is anticipated to require approximately four (4) months, with physical construction of the dunes requiring another month. Planting, fencing, signage, and placement of temporary irrigation systems within the dunes are planned to require another 30 days. Most activities (earthmoving and dune planting) within the Project area would occur between 7 a.m. and 6 p.m. Specifically for inland material, hauling may require 70 working days at five days per week. The BBGHAD has proposed a 14-hour daily trucking schedule beginning at 7 a.m. and ending at 9 p.m. The only construction activities proposed to occur between 6 p.m. and 9 p.m would be trucking on PCH and stockpiling activities at the Zuma parking lot and on the stockpile areas. No construction activities are proposed to occur west of Trancas Creek between 6 p.m. and 9 p.m. As proposed, the BBGHAD estimates that trucking activities would be completed after 14 weeks Construction Staging Area and Equipment During the construction phase of the Project, the BBGHAD has proposed staging of construction equipment and materials at the western most parking lot of Zuma Beach. Additional temporary staging areas for storage or stockpile of sand may also be established on the beach immediately west of the Zuma Beach parking lot, while maintaining a 100 foot buffer from the Trancas Lagoon. Construction vehicles and equipment are planned to access the site via Pacific Coast Highway into the Zuma Beach parking lot. From the parking lot, equipment would travel down to the wet sand beach and along the beach in front of Trancas Creek and onto Broad Beach. The personnel requirements for the Project would include 12 workers during daytime construction hours (7 a.m. to 9 p.m.). Equipment anticipated to be necessary for construction activities associated with the proposed Project is summarized in Table 5-3 and construction staging and stockpile areas are shown in Figure v2 Draft 54
91 Table 5-3. Preliminary List of Construction Equipment for the Broad Beach Restoration Project Support Equipment Vehicles Contractor s mobile office (1) Excavators (3) Generators (estimated 2) D-9 Bulldozers (2) Portable restrooms (3) Fuel truck (1, not stationed at site); Service truck (1) Lighting (2 stands) Delivery trucks (estimated 20) Grizzly (hopper/conveyor system)(3) Front-End Loaders (3) Backhoes (3) Full-size pick-up trucks (2) Bob-cats (4) Scrapers (3) Plant delivery trucks for dunes (20) Off-road 40-ton Dump Truck (7) The BBGHAD has proposed that fuel trucks would travel to the staging area at Zuma Beach parking lot every morning to fuel Project equipment. Service trucks providing lubricant and oils for Project equipment would visit the staging area weekly for maintenance. All fueling and/or maintenance of Project equipment would be restricted to the Zuma Beach parking lot and staging area as CSLC policies strictly prohibit this type of activity occurring on or near tidelands. Disturbed areas of the parking lot would be repaved as needed after Project completion Construction Procedures Best Management Practices The BBGHAD has proposed the implementation of Best Management Practices (BMPs) throughout the construction phase of the proposed Project. As the proponent, the BBGHAD or its contractors would implement site-specific construction mitigation plans, including a traffic minimization plan and equipment refueling plan. Beach Building Beaches would be formed by placement of sand from the trucks. Sand would be graded and spread along the beach to the dimensions of the beach fill plan using two bulldozers. Sand placement around storm drain outlets would be designed to allow for proper drainage v2 Draft 55

92 Figure Construction Staging & Stockpile Areas For Alternative 4C Project v2 Draft 56
93 Dune Building and Restoration According to the BBGHAD's proposal, the dune would most likely be formed by deposition of sand from the trucking deliveries using loaders and backhoes. Sand would be graded and spread over the existing revetment on the east and up against existing foundations and seawalls in the west height using smaller bulldozers. Existing large-diameter public storm drains which currently terminate at the revetment would be protected with a new concrete weir box structure and integrated into the revetment. These drains would issue under the dune and through the beach by percolation. Following sand placement and planting of approved native dune flora, public access would be through existing vertical accessways owned and operated by Los Angeles County and private access to the area would be channeled through pathways to ensure protection of the restored dune habitat. Transportation from Local Inland Sources As proposed, trucks hauling sand from the Local Inland Sources and other construction equipment to the Broad Beach site would access the construction staging area located at the western end of the Zuma Beach parking lot via a new temporary driveway opposite Guernsey Drive on Pacific Coast Highway (PCH), and exit the lot via the existing driveway connection to PCH. Trucks would travel southeasterly on PCH and enter the new access driveway on PCH opposite from Guernsey Drive. Although a detailed truck access plan has not yet been prepared, trucks would enter the west end of the Zuma Beach parking lot by turning right from PCH into the new driveway and queue in the parking lot to dump their sand onto grizzlies. After unloading, trucks would exit by heading to the existing driveway at the north end of the Zuma lot and turning left out of the driveway across PCH. 1 This left turn would need to be controlled with a temporary traffic signal as this volume and frequency of trucks could not safely cross the highway without such control. Employees would enter/exit the site via the main gate at the Zuma Beach County Park located east of the site. The BBGHAD estimates a total of 21,500 loaded truck round trips for the transport of each 300,000 cubic yards of sand between the Local Inland Sources and Broad Beach sites assuming use of 14 cubic yard capacity trucks. It is anticipated that the haul route from the local inland sand source locations to the Broad Beach Project site will be that shown in Figure Several access options were considered; however, the size of trucks prohibits using the PCH/Busch Drive underpass 1.5 miles south of the site. Traversing local neighborhoods was also considered and rejected due to local traffic impacts v2 Draft 57
 that will transport the sand into a stockpile on the")
94 Figure Proposed Haul Routes from Local Inland Sand Sources Trucks would enter the parking lot, drive over a low grizzly (hopper and conveyor belt system) that will transport the sand into a stockpile on the beach. Front-end loaders will then load large 40-ton capacity off-road trucks and/or 30 CY scrapers that will drive the material down the beach and drop it within the target placement area. Bulldozers would then shape the placement area into the desired beach fill template. Dunes would be built in a similar way with front-end loaders moving sand dropped along the toe of the revetment up into the dune template, with small dozers or bobcats forming the dunes into their final templates. Public Access During Construction As proposed, public access during nourishment and dune restoration activities would be maintained to the maximum extent possible. At least two weeks prior to commencing nourishment operations, signs notifying the public of the dates of nourishment operations would be posted at the public access points and at other highly visible locations along the beach. Public lateral access to Broad Beach would be restricted during working hours (7 a.m. to 6 p.m., Monday through Friday) due to the equipment traffic associated with the beach nourishment activities. The Zuma Parking Lot 12 and the beach area at the stockpile will be closed to the public during sand delivery hours of 7 a.m. to 9 p.m. On weekends and holidays, the BBGHAD has proposed that the beach would remain open for public access. As work progresses, public access to portions of the beach would be allowed during nourishment operations to the extent possible with implementation of a construction vehicle traffic management plan. For example, as beach placement is completed at the western end of the Project, this area would become available for public use. The areas of active work (e.g., access routes and areas where earthmoving equipment is being used, etc.) would be clearly delineated with access controlled by the contractor v2 Draft 58
95 Backpassing Activities Each backpassing operation would require approximately up to three weeks to complete, dependent on the amount of sand to be moved, and would include five personnel, one bulldozer, three scrapers, and a supervisor/foreman vehicle. Standard earthmoving BMPs would be used to reduce impacts from these operations. The contractor would establish a haul route along the seaward edge of the beach, maximizing the distance between the work and residences. The contractor would establish fencing or signs to control public access to the work site. Access points through the work zone would be continuously manned by construction monitors. Sand backpassing implementation would be expected to commence in the fall season and is estimated to occur over a one and a half to three week (7 to 15 working day) period. The equipment would typically operate on a 12-hour basis between 7 a.m. and 7 p.m., and approximately 5,000 cubic yards per day would be moved. Backpassing would utilize the west end of Zuma Beach s parking lot for a staging area, as described for beach nourishment. Up to 1.5 acres would be required. Ingress and egress for the construction equipment to the staging area would be via existing driveways off Pacific Coast Highway; access to the beach would be via the existing curb cut at the parking lot's west end. As proposed, the staging area would accommodate construction, materials, parking of support vehicles, and assembly of construction crews. The site would be fenced off and equipment will be stored overnight. This site was previously used for the 2010 emergency rock revetment Project v2 Draft 59
96 6. Summary Discussion of Project Benefits Primarily, the Project seeks to provide the benefit of shoreline restoration and protection of coastal property from damages related to shoreline erosion and resulting direct exposure to high water levels and storm waves. These benefits would be achieved by restoring the historically wide sandy beach and dune system exemplified by Broad Beach of the early 1970s. Implementation, maintenance, and protection of these improvements provide a special benefit to all property owners within the project area. Property owners derive special benefit based in direct proportion to their respective beach frontage. Although volumes of sand placement may differ from time to time on each parcel, the dynamic nature of beach erosion, subsequent sand transport, and the anticipated backpassing and interim/erosion fill maintenance activities renders the environment within the project boundaries as a semi-closed, discrete system in which special benefit is derived based on proportional beach frontage. Therefore, owners with greater beach frontage derive greater special benefit than owners with lesser beach frontage. The proposed improvements combined with the anticipated regular backpassing activities equalize the special benefit derived by properties within the project area based on pro rata length of beachfront per assessed parcel v2 Draft 60
97 7. References California Coastal Commission (CCC), Draft Sea-Level Rise Policy Guidance, Public Review Draft, October. California Coastal Records, 2009, Copyright Kenneth & Gabrielle Adelman, California Coastal Records Project, Campbell, T., Dean, R., Mehta, A., and Wang, H., 1988, Short Course on Principles and Applications of Beach Nourishment, Florida Shore and Beach Preservation Assn and U of Florida. CDIP, 2010, The Coastal Data Information Program, Scripps Institution of Oceanography, Flick, Reinhard, Personal Communication With Chris Webb, October Flick and O Reilly, Broad Beach, Malibu, California, Wave Study. Flick, Reinhard E. and Reilly, William C. November Flick, 2009, El Niño Outlook Winter and Related Storminess at Broad Beach, Malibu California, Reinhard E. Flick, TerraCosta Consulting Group, Inc., December 9, 2009 Griggs, 2008, Long and Short-Term Beach Changes Along Broad Beach, Malibu. Gary Griggs & Associates, Consulting Coastal Geologists. October Hallermeier, 1978, Uses for a Calculated Limit Depth to Beach Erosion, ASCE, Proceedings 16th International Coastal Engineering Conference. Moffatt & Nichol, 2009, Regional Sediment Management Offshore Canyon Sand Capture, Final Position Paper Report, Moffatt & Nichol and Everts Coastal, February NOAA, 2008, National Oceanic and Atmospheric Administration National Ocean Service website, URL: National Research Council of the National Academies (NRC) Sea Level Rise for the Coasts of California, Oregon, and Washington: Past, Present, and Future. USACE, 2003, Coastal Engineering Manual, Department of the Army, U.S. Army Corps of Engineers. USACE, 1984, Shore Protection Manual, Coastal Engineering Research Center, Department of the Army, Waterways Experiment Station, Corps of Engineers, v2 Draft 61
98 EXHIBIT F Assessment Diagram v v
99
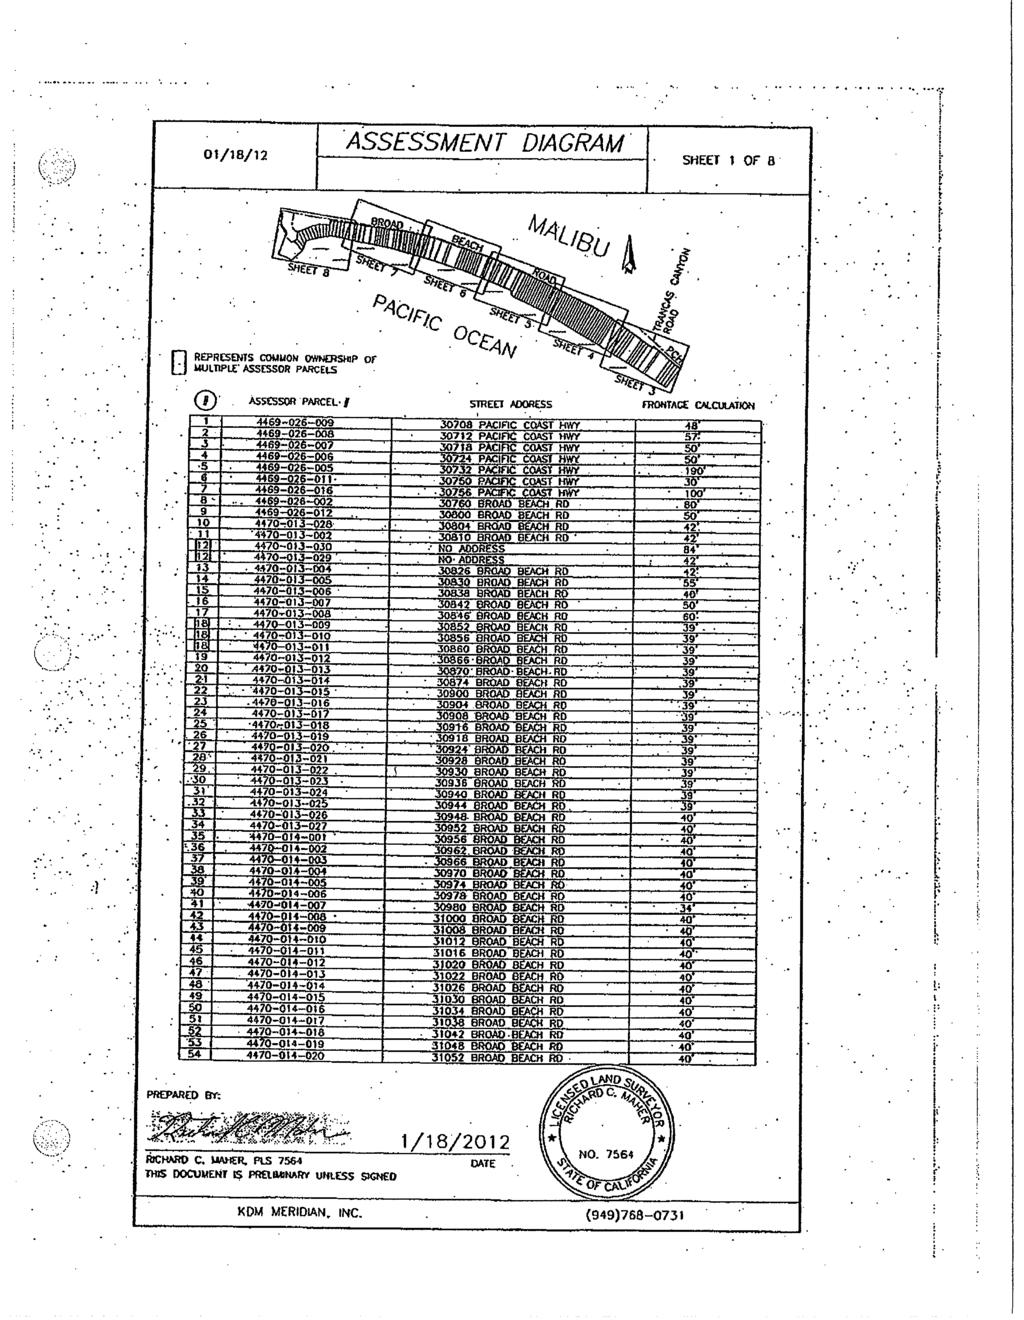
100
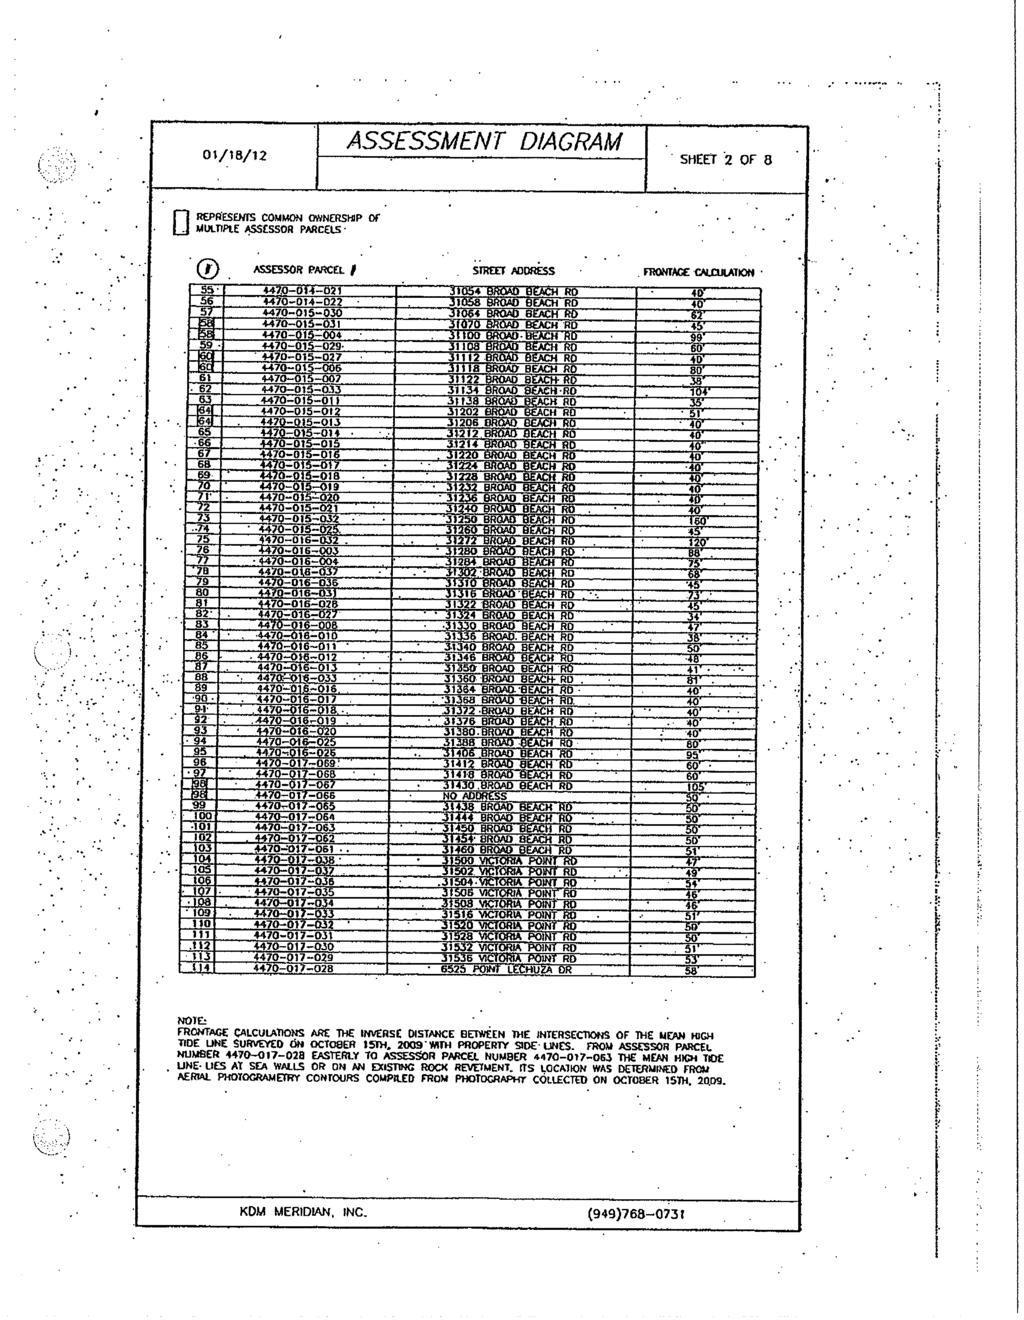
101
BROAD BEACH GEOLOGIC HAZARD ABATEMENT DISTRICT REGULAR MEETING AGENDA. Sunday July 19, 2015; 10:00 a.m.
 BROAD BEACH GEOLOGIC HAZARD ABATEMENT DISTRICT REGULAR MEETING AGENDA Sunday July 19, 2015; 10:00 a.m. Regular Session Private Residence- 31330 Broad Beach Road, Malibu, CA 90265 1) Call to Order 2) Roll
Closed Sessions Matters None. Regular Session Matters 1) Call to Order. 2) Roll Call. 3) Adoption of Agenda
 Call to Order. 2) Roll Call. 3) Adoption of Agenda") BROAD BEACH GEOLOGIC HAZARD ABATEMENT DISTRICT REGULAR MEETING AGENDA Sunday, December 11, 2011 at 9:00 a.m. Home of Wini Lumsden 31330 Broad Beach Road, Malibu, California 90265 Closed Sessions Matters
BROAD BEACH GEOLOGIC HAZARD ABATEMENT DISTRICT REGULAR MEETING AGENDA Sunday, December 11, 2011 at 9:00 a.m. Home of Wini Lumsden 31330 Broad Beach Road, Malibu, California 90265 Closed Sessions Matters
Broad Beach Sand & Dune Habitat Restoration Project. Revetment Owners Meeting July 12, 2017
 Broad Beach Sand & Dune Habitat Restoration Project Revetment Owners Meeting July 12, 2017 Status of Project Entitlement Coastal Commission CDP approved 10/15 (consolidated with City of Malibu), PTI conditions
County of Santa Barbara Permit Option Analysis Goleta Beach JULY 13, 2017
 County of Santa Barbara Permit Option Analysis Goleta Beach JULY 13, 2017 Introduction 2 Goleta Beach Park welcomes 1.5 million visitors annually Amenities include: Picnic Areas and Group Areas w/bbqs
RE: Hurricane Matthew Beach Damage Assessment and Recommendations [CSE 2416]
![RE: Hurricane Matthew Beach Damage Assessment and Recommendations [CSE 2416]](/thumbs/83/87675702.jpg "RE: Hurricane Matthew Beach Damage Assessment and Recommendations [CSE 2416]") October 25, 2016 Iris Hill Town Administrator Town of Edisto Beach 2414 Murray St Edisto Beach SC 29438 RE: Hurricane Matthew Beach Damage Assessment and Recommendations [CSE 2416] Dear Iris, Hurricane
October 25, 2016 Iris Hill Town Administrator Town of Edisto Beach 2414 Murray St Edisto Beach SC 29438 RE: Hurricane Matthew Beach Damage Assessment and Recommendations [CSE 2416] Dear Iris, Hurricane
Atlantic Coast of Long Island, Jones Inlet to East Rockaway Inlet, Long Beach Island, NY Construction Update
 Atlantic Coast of Long Island, Jones Inlet to East Rockaway Inlet, Long Beach Island, NY Construction Update June 2016 US Army Corps of Engineers Project Purpose Three specific damage mechanisms of coastal
SACO RIVER AND CAMP ELLIS BEACH SACO, MAINE SECTION 111 SHORE DAMAGE MITIGATION PROJECT APPENDIX F ECONOMIC ASSESSMENT
 SACO RIVER AND CAMP ELLIS BEACH SACO, MAINE SECTION 111 SHORE DAMAGE MITIGATION PROJECT APPENDIX F ECONOMIC ASSESSMENT Department of the Army New England District, Corps of Engineers 696 Virginia Road
FINDING OF NO SIGNIFICANT IMPACT
 DEPARTMENT OF THE ARMY CHARLESTON DISTRICT, CORPS OF ENGINEERS 69A HAGOOD AVENUE CHARLESTON, SOUTH CAROLINA 29403-5107 FINDING OF NO SIGNIFICANT IMPACT EDISTO BEACH COASTAL STORM DAMAGE REDUCTION GENERAL
Affects of Tides on Lateral Coastal Access at. Las Varas Ranch. Gaviota, California. Photos Courtesy of California Coastal Records Project
 Affects of Tides on Lateral Coastal Access at Las Varas Ranch Gaviota, California Photos Courtesy of California Coastal Records Project September 18, 2014 Santa Barbara County Trails Council 1 As part
HURRICANE SANDY LIMITED REEVALUATION REPORT UNION BEACH, NEW JERSEY DRAFT ENGINEERING APPENDIX SUB APPENDIX D SBEACH MODELING
 HURRICANE SANDY LIMITED REEVALUATION REPORT UNION BEACH, NEW JERSEY DRAFT ENGINEERING APPENDIX SUB APPENDIX D SBEACH MODELING Rev. 18 Feb 2015 1 SBEACH Modeling 1.0 Introduction Following the methodology
DUNE STABILIZATION AND BEACH EROSION
 DUNE STABILIZATION AND BEACH EROSION CAPE HATTERAS NATIONAL SEASHORE NORTH CAROLINA ROBERT DOLAN PAUL GODFREY U. S. DEPARTMENT OF INTERIOR NATIONAL PARK SERVICE OFFICE OF NATURAL SCIENCE WASHINGTON, D.
NORTHERN CELL OPTIONS SHORTLIST RECOMMENDATIONS
 OPTIONS SHORTLIST RECOMMENDATIONS Coastal Unit C: Bayview Options recommended for MCDA scoring. Status quo. Planting 3. Renourishment (gravel) 6. Beach-scraping 7. Restore shingle crest. Inundation accommodation
North Shore of Long Island, Feasibility Study
 North Shore of Long Island, Asharoken New York Asharoken, Feasibility Study Asharoken, NY Public Meeting June 30, 2015 US Army Corps of Engineers US Army Corps of Engineers New York BUILDING STRONG BUILDING
Absecon Island Shore Protection The planning behind the project
 Absecon Island Shore Protection The planning behind the project Most residents of Atlantic City, Ventnor, Margate and Longport are now aware of upcoming plans to protect their common coastline with a beachfill
AN OVERVIEW OF RECENT PROJECTS RELATED TO SAND BUDGETS, SOUTHERN CALIFORNIA BEACHES
 AN OVERVIEW OF RECENT PROJECTS RELATED TO SAND BUDGETS, SAND SUPPLY, COASTAL ARMORING, MANAGEMENT, AND VALUING SOUTHERN CALIFORNIA BEACHES Dr. Kiki Patsch California State University Channel Islands Environmental
VENICE LOCAL COASTAL PROGRAM UPDATE: COASTAL HAZARDS WELCOME
 VENICE LOCAL COASTAL PROGRAM UPDATE: COASTAL HAZARDS WELCOME 1 Introducing the Team Hosted by the Department of City Planning and grant funded in part by the California Coastal Commission 2 Workshop Purpose
ATLANTIC COUNTY 2006 to 2008
 ATLANTIC COUNTY 2006 to 2008 The Atlantic County oceanfront shoreline consists of three barrier islands where the northern one, Little Beach Island and a third of the second, Brigantine Island, are undeveloped
SPECIAL SPRING 2018 STORM REPORT ON THE CONDITION OF THE MUNICIPAL BEACHES FOR THE BOROUGH OF STONE HARBOR, CAPE MAY COUNTY, NEW JERSEY
 SPECIAL SPRING 2018 STORM REPORT ON THE CONDITION OF THE MUNICIPAL BEACHES FOR THE BOROUGH OF STONE HARBOR, CAPE MAY COUNTY, NEW JERSEY Aerial photograph taken April 21, 2018 showing the view up the beach
Volume and Shoreline Changes along Pinellas County Beaches during Tropical Storm Debby
 Volume and Shoreline Changes along Pinellas County Beaches during Tropical Storm Debby Ping Wang and Tiffany M. Roberts Coastal Research Laboratory University of South Florida July 24, 2012 Introduction
Coastal Hazards Study
 Coastal Hazards Study 2212 Beach Boulevard, Pacifica Prepared for: EXECUTIVE SUMMARY City of Pacifica 170 Santa Maria Ave Pacifica, CA 94044 Prepared by: moffatt & nichol 2185 N. California Blvd. Walnut
UPPER BEACH REPLENISHMENT PROJECT RELATED
 ASSESSMENT OF SAND VOLUME LOSS at the TOWNSHIP of UPPER BEACH REPLENISHMENT PROJECT RELATED to the LANDFALL OF HURRICANE SANDY - PURSUANT TO NJ-DR 4086 This assessment is in response to Hurricane Sandy
Figure79. Location map for the 10 NJBPN profile sites in Atlantic County, NJ 155
 154 Figure79. Location map for the 10 NJBPN profile sites in Atlantic County, NJ 155 ATLANTIC COUNTY SPRING 2009 to FALL 2010 The Atlantic County coastline consists of three barrier islands. Between Little
RI Regulatory Setbacks & Buffers: Coastal Management Issues
 RI Regulatory Setbacks & Buffers: Coastal Management Issues New England Onsite Wastewater Training Program @ URI OWT 155 - November 29, 2012 James Boyd - Coastal Policy Analyst Photo: October 30, 2012
CHAPTER 8 ASSESSMENT OF COASTAL VULNERABILITY INDEX
 124 CHAPTER 8 ASSESSMENT OF COASTAL VULNERABILITY INDEX 8.1 INTRODUCTION In order to assess the vulnerability of the shoreline considered under this study against the changing environmental conditions,
Fact Sheet Ordinance Regulating Erosion Threatened Structures
 Fact Sheet Ordinance Regulating Erosion Threatened Structures Town of Duck, North Carolina August 15, 2011 What is being considered? The Town of Duck Council is considering an ordinance to limit the encroachment
Photo by: Darryl Hatheway, 2011
 Photo by: Darryl Hatheway, 2011 September 11, 2015 Presentation Discussion Examine PFD V-Zone Mapping in Wave Runup Dominated West Coast Application of PFD V-Zone Mapping Criteria in Pacific G&S PFD V-Zone
ST. JOSEPH PENINSULA, GULF COUNTY, FLORIDA Beach Re-Nourishment and Environmental Enhancement Project RECOMMENDATIONS
 ST. JOSEPH PENINSULA, GULF COUNTY, FLORIDA Beach Re-Nourishment and Environmental Enhancement Project RECOMMENDATIONS January 23, 2018 543 Harbor Boulevard, Suite 204 Destin, Florida 32541 850.654.1555
Building Coastal Resiliency at Plymouth Long Beach
 Building Coastal Resiliency at Plymouth Long Beach Department of Marine and Environmental Affairs March 30, 2017 Introducing Green Infrastructure for Coastal Resiliency Plymouth Long Beach & Warren s Cove
23- Year Sand Volume Changes at Site 132, 15th Street, Brigantine
 149 Figure75. Location map for the 9 NJBPN profile sites in Atlantic County, NJ ATLANTIC COUNTY SPRING 2008 to FALL 2009 150 The Atlantic County oceanfront shoreline consists of three barrier islands.
Delaware Chapter Surfrider Foundation - Indian River Inlet Monitoring
 Delaware Chapter Surfrider Foundation - Indian River Inlet Monitoring In 2012, the Delaware Surfrider Foundation Chapter formed the Surf Quality and Access Committee to focus on issues such as surf spot
ALTERNATIVES FOR COASTAL STORM DAMAGE MITIGATION
 ALTERNATIVES FOR COASTAL STORM DAMAGE MITIGATION Dave Basco Old Dominion University, Norfolk, Virginia, USA National Park Service Photo STRUCTURAL (changes to natural, physical system) hardening (seawalls,
Performance of Upham Beach T-Groin Project and Its Impact to the Downdrift Beach
 Performance of Upham Beach T-Groin Project and Its Impact to the Downdrift Beach Progress Report for the Period of October 2008 to April 2009 Submitted by Ping Wang, Ph.D., and Tiffany M. Roberts Department
D.B. Wilson Station CCR Landfill
 D.B. Wilson Station CCR Landfill Disposal of Coal Combustion Residuals (CCR) from Electric Utilities Final Rule Closure and Post-closure Care Plan October 11, 2016 Prepared By: Project ID: 160030A Big
FINAL REPORT FOR 2013 ON THE CONDITION OF THE MUNICIPAL OCEANFRONT BEACHES THE BOROUGH OF AVALON, CAPE MAY COUNTY, NEW JERSEY
 FINAL REPORT FOR 2013 ON THE CONDITION OF THE MUNICIPAL OCEANFRONT BEACHES THE BOROUGH OF AVALON, CAPE MAY COUNTY, NEW JERSEY View from 12 th Street to the south taken February 28, 2013, following completion
GONE! Coastal Erosion Happens During Storms! Why Worry About Coastal Setbacks? Goals for Today
 RI Regulatory Setbacks & Buffers: Coastal Zone Management Issues New England Onsite Wastewater Training Program @ URI OWT 155 November 21, 2013 Goals for Today Understand the impacts of storms, coastal
The Dynamic Coast. Right Place Resources. A presentation about the interaction between the dynamic coast and people
 The Dynamic Coast Houses threatened by coastal erosion in California Right Place Resources A presentation about the interaction between the dynamic coast and people For the rest of the presentations in
ALTERNATIVES FOR COASTAL STORM DAMAGE MITIGATION AND FUNCTIONAL DESIGN OF COASTAL STRUCTURES
 The University of the West Indies Organization of American States PROFESSIONAL DEVELOPMENT PROGRAMME: COASTAL INFRASTRUCTURE DESIGN, CONSTRUCTION AND MAINTENANCE A COURSE IN COASTAL DEFENSE SYSTEMS I CHAPTER
Protecting our Beaches
 Protecting our Beaches South Amelia Island Shore Stabilization Project Nassau County, FL Mr. Drew Wallace President South Amelia Island Shore Stabilization Association (SAISSA) Mr. Bill Moore, AICP Project
Town of Duck, North Carolina
 Tracking No. 00.00.2010 Erosion Mitigation And Shoreline Management Feasibility Study Town of Duck, North Carolina Coastal Planning & Engineering of North Carolina August 15, 2012 Tom Jarrett Robert Neal
Long Beach Island Holgate Spit Little Egg Inlet Historical Evolution Introduction Longshore Transport Map, Survey and Photo Historic Sequence
 Appendix B Long Beach Island Holgate Spit Little Egg Inlet Historical Evolution Introduction The undeveloped southern end of Long Beach Island (LBI) is referred to as the Holgate spit as it adjoins the
Future Condi,ons coastal hazard modeling and mapping
 Future Condi,ons coastal hazard modeling and mapping Presented by Bob Ba:alio, PE Environmental Science Associates, Inc. (ESA) On behalf of the physical processes team (USGS, TerraCosta- Scripps, ESA)
FINAL ENVIRONMENTAL IMPACT STATEMENT ON BROWARD COUNTY SHORE PROTECTION PROJECT SEGMENTS II AND III BROWARD COUNTY, FLORIDA
 FINAL ENVIRONMENTAL IMPACT STATEMENT ON BROWARD COUNTY SHORE PROTECTION PROJECT SEGMENTS II AND III BROWARD COUNTY, FLORIDA 1. PROJECT PURPOSE AND NEED 1.1. PROJECT AUTHORITY. 1.1.1. INITIAL AUTHORIZATION.
Effectiveness of Beach Nourishment in Response to Sea Level Rise
 2014 FSBPA Annual Conference Effectiveness of Beach Nourishment in Response to Sea Level Rise Navarre Beach Santa Rosa County July 18, 2005 Lovers Key Lee County April 23, 2012 South County St. Lucie County
LOCAL COASTAL PROGRAM UPDATE
 LOCAL COASTAL PROGRAM UPDATE Agenda Meeting #1 General Information (1 1:45 pm) Introductions and Background Grants involved What is a Local Coastal Program? What is required? LCP Update tasks and schedule
A REVIEW OF THE CONDITION OF THE MUNICIPAL BEACHES AS A RESULT OF HURRICANE SANDY IN THE BOROUGH OF STONE HARBOR, CAPE MAY COUNTY, NEW JERSEY
 A REVIEW OF THE CONDITION OF THE MUNICIPAL BEACHES AS A RESULT OF HURRICANE SANDY IN THE BOROUGH OF STONE HARBOR, CAPE MAY COUNTY, NEW JERSEY View along the dune scarp from 103 rd Street on October 31,
Chiswell and Chesil Beach (to Wyke Narrows) 6a02 and 6a03 SUMMARY OF PREFERRED PLAN RECOMMENDATIONS AND JUSTIFICATION
 6a02 and 6a03 SUMMARY OF PREFERRED PLAN RECOMMENDATIONS AND JUSTIFICATION") Location reference: Policy Unit reference: Plan: Chiswell and Chesil Beach (to Wyke Narrows) 6a02 and 6a03 SUMMARY OF PREFERRED PLAN RECOMMENDATIONS AND JUSTIFICATION The long term aim for this section
Location reference: Policy Unit reference: Plan: Chiswell and Chesil Beach (to Wyke Narrows) 6a02 and 6a03 SUMMARY OF PREFERRED PLAN RECOMMENDATIONS AND JUSTIFICATION The long term aim for this section
Beach profile surveys and morphological change, Otago Harbour entrance to Karitane May 2014 to June 2015
 Beach profile surveys and morphological change, Otago Harbour entrance to Karitane May 2014 to June 2015 Prepared for Port Otago Ltd Martin Single September 2015 Shore Processes and Management Ltd Contact
OECS Regional Engineering Workshop September 29 October 3, 2014
 B E A C H E S. M A R I N A S. D E S I G N. C O N S T R U C T I O N. OECS Regional Engineering Workshop September 29 October 3, 2014 Coastal Erosion and Sea Defense: Introduction to Coastal/Marine Structures
New Jersey Beach Profile Network Atlantic County Profile Site Locations
 215 RICHARD STOCKTON COLLEGE OF NEW JERSEY New Jersey Beach Profile Network Atlantic County Profile Site Locations COASTAL RESEARCH CENTER Figure 128 There are nine NJBPN survey sites on the Atlantic County
4/20/17. #31 - Coastal Erosion. Coastal Erosion - Overview
 Writing Assignment Due Monday by 11:59 pm #31 - Coastal Erosion Beach front property! Great View! Buy now at a great price! See main class web pages for detailed instructions Essays will be submitted in
Impact of Hurricane Matthew on the Atlantic Coast of Florida
 Impact of Hurricane Matthew on the Atlantic Coast of Florida A coastal engineer was driving across country and his jeep broke down in front of a monastery. It was late in the day and the monks invited
Inlet Management Study for Pass-A-Grille and Bunces Pass, Pinellas County, Florida
 Inlet Management Study for Pass-A-Grille and Bunces Pass, Pinellas County, Florida Final Report Submitted By Ping Wang, Ph.D., Jun Cheng Ph.D., Zachary Westfall, and Mathieu Vallee Coastal Research Laboratory
PUBLIC EXHIBITION OF COASTAL ZONE MANAGEMENT PLAN FOR COLLAROY-NARRABEEN BEACH AND FISHERMANS BEACH
 ITEM 8.3 REPORTING MANAGER TRIM FILE REF 2014/110936 ATTACHMENTS PUBLIC EXHIBITION OF COASTAL ZONE MANAGEMENT PLAN FOR COLLAROY-NARRABEEN BEACH AND FISHERMANS BEACH GROUP MANAGER NATURAL ENVIRONMENT 1
Case study 64. Shoreham Harbour Shingle Bypassing and Recycling
 Case study 64. Shoreham Harbour Shingle Bypassing and Recycling Authors: Tony Parker, Uwe Dornbusch Main driver: Improved defences Project stage: Ongoing construction/operation since 1992 Photo 1: Shoreham
3.3 OCEANOGRAPHY/COASTAL PROCESSES
 3.3 OCEANOGRAPHY/COASTAL PROCESSES Beaches are dynamic and conditions vary based on the onshore/offshore movement of sand both seasonally and annually. Sand also moves alongshore within a generally defined
New Jersey Coastal Zone Overview. The New Jersey Beach Profile Network (NJBPN) 3 Dimensional Assessments. Quantifying Shoreline Migration
 3 Dimensional Assessments. Quantifying Shoreline Migration") New Jersey Coastal Zone Overview The New Jersey Beach Profile Network (NJBPN) Objectives Profile Locations Data Collection Analyzing NJBPN Data Examples 3 Dimensional Assessments Methodology Examples Quantifying
New Jersey Coastal Zone Overview The New Jersey Beach Profile Network (NJBPN) Objectives Profile Locations Data Collection Analyzing NJBPN Data Examples 3 Dimensional Assessments Methodology Examples Quantifying
EVALUATION OF BEACH EROSION UP-DRIFT OF TIDAL INLETS IN SOUTHWEST AND CENTRAL FLORIDA, USA. Mohamed A. Dabees 1 and Brett D.
 EVALUATION OF BEACH EROSION UP-DRIFT OF TIDAL INLETS IN SOUTHWEST AND CENTRAL FLORIDA, USA Mohamed A. Dabees 1 and Brett D. Moore 1 The paper discusses the analysis of up-drift beach erosion near selected
Sunset Beach Annexation LOCAL AGENCY FORMATION COMMISSION MEETING OCTOBER 11, 2017
 Sunset Beach Annexation LOCAL AGENCY FORMATION COMMISSION MEETING OCTOBER 11, 2017 History Sunset Beach is a beach-front community of approximately 970 people. It was an unincorporated area of the County
Long Term Success and Future Approach of the Captiva and Sanibel Islands Beach Renourishment Program
 2017 National Conference on Beach Preservation Technology February 8-10, 2017; Stuart, Florida Long Term Success and Future Approach of the Captiva and Sanibel Islands Beach Renourishment Program Thomas
April 7, Prepared for: The Caribbean Disaster Emergency Response Agency Prepared by: CEAC Solutions Co. Ltd.
 April 7, 2006 Prepared for: The Caribbean Disaster Emergency Response Agency Prepared by: Introduction CEAC Solutions Co. Ltd was commissioned in May 2005 to prepare coastal beach erosion hazard maps for
Julebæk Strand. Effect full beach nourishment
 Julebæk Strand Effect full beach nourishment Aim of Study This study is a part of the COADAPT funding and the aim of the study is to analyze the effect of beach nourishment. In order to investigate the
To: William Woods, Jenni Austin Job No: CentrePort Harbour Deepening Project - Comments on community queries
 Memo To: William Woods, Jenni Austin From: Richard Reinen-Hamill Date: Subject: cc: 1 Purpose This memo sets out our response to issues raised at and after Seatoun community consultation sessions held
LAB: WHERE S THE BEACH
 Name: LAB: WHERE S THE BEACH Introduction When you build a sandcastle on the beach, you don't expect it to last forever. You spread out your towel to sunbathe, but you know you can't stay in the same spot
Regular Workshop October 20, 2014 Agenda Item: Dr. Albert E. Browder, PE; Olsen Associates, Inc.
 Regular Workshop October 20, 2014 Agenda Item 8 Agenda Item: Presenter: Summary: Beach Update Town Manager; Dr. Albert E. Browder, PE; Olsen Associates, Inc. At the January 21, 2014 Regular Workshop Meeting,
Redondo Beach Boat Launch Ramp Facility
 Redondo Beach Boat Launch Ramp Facility Feasibility Report for the California Department of Boating and Waterways 2015 Grant Cycle For the City of Redondo Beach Submitted by March 13, 2014 Table of Contents
ATLANTIC COAST OF LONG ISLAND, JONES INLET TO EAST ROCKAWAY INLET, LONG BEACH ISLAND, NY. Contract #2 Construction Scope. April 18th-19th 2018
 ATLANTIC COAST OF LONG ISLAND, JONES INLET TO EAST ROCKAWAY INLET, LONG BEACH ISLAND, NY Contract #2 Construction Scope April 18th-19th 2018 New York District PLAN COMPONENTS Length of Beachfill 35,000
2013 ANNUAL REPORT - TO THE CITY OF NORTH WILDWOOD ON THE CONDITION OF THE CITY BEACHES
 2013 ANNUAL REPORT - TO THE CITY OF NORTH WILDWOOD ON THE CONDITION OF THE CITY BEACHES View on June 18, 2013 from the 2 nd Avenue jetty looking south while the 2013 beach nourishment project was under
Assateague Island National Seashore North End Restoration Project Timeline
 Assateague Island National Seashore North End Restoration Project Timeline Date Event Some information provided in the Project Introduction document. Detailed events are available in a timeline compiled
Administration Report Fiscal Year 2011/2012
 Administration Report Fiscal Year 2011/2012 Poway Unified School District Community Facilities District No. 3 June 20, 2011 Prepared For: Poway Unified School District Planning Department 13626 Twin Peaks
Administration Report Fiscal Year 2010/2011
 Administration Report Fiscal Year 2010/2011 Poway Unified School District Community Facilities District No. 3 June 21, 2010 Prepared For: Poway Unified School District 13626 Twin Peaks Road Poway, CA 92064
Inventory of coastal sandy areas protection of infrastructure and planned retreat
 2018-02-28 Inventory of coastal sandy areas protection of infrastructure and planned retreat Johanna Birgander, Thorbjörn Nilsson, Pär Persson Summary To estimate the natural protection around the coast
Q1. What are the primary causes/contributors to coastal erosion at Westshore and the concept of longshore / littoral drift.
 Q1. What are the primary causes/contributors to coastal erosion at Westshore and the concept of longshore / littoral drift. In order of (timing related) contribution to present problem 1. Beach is too
October 4, Seabreeze Associates Limited Partnership Robert B. Fultz, General Partner 865 Highland Drive Boulder Creek, California 95006
 1 October 4, 2016 Seabreeze Associates Limited Partnership Robert B. Fultz, General Partner 865 Highland Drive Boulder Creek, California 95006 Subject: Preliminary Site Investigation and Dune Hazard Report
Collaboration: Sea-level Marin Adaptation Response Team (C-SMART)
") Collaboration: Sea-level Marin Adaptation Response Team (C-SMART) Photo Credit : Lighthawk Aerial Community Development Agency 3501 Civic Center Drive, Rm. 308 San Rafael, CA 94903 415 4736269 T www.marinslr.org
Collaboration: Sea-level Marin Adaptation Response Team (C-SMART) Photo Credit : Lighthawk Aerial Community Development Agency 3501 Civic Center Drive, Rm. 308 San Rafael, CA 94903 415 4736269 T www.marinslr.org
The 2017 Panama City Beaches Beach Interim Renourishment Project. Answers to Common Questions
 The 2017 Panama City Beaches Beach Interim Renourishment Project The fourth renourishment of the Panama City Beaches will be under construction during March and April 2017, with a planned completion by
# Post Consultation and Submissions Resource Consent Conditions for Surfing Impact Mitigation August 2016
 # Post Consultation and Submissions Resource Consent Conditions for Surfing Impact Mitigation August 2016 Surf Mitigation Management Plan 1 1 Not less than 6 months prior to the commencement of the construction
Beach Nourishment Impact on Beach Safety and Surfing in the North Reach of Brevard County, Florida
 Beach Nourishment Impact on Beach Safety and Surfing in the North Reach of Brevard County, Florida Prepared by John Hearin, Ph.D. Coastal Engineering Vice Chairman Cocoa Beach Chapter Port Canaveral Patrick
Montserrat. Wise practices for coping with. i b bea n Se a
 Wise practices for coping with Montserrat Car i b bea n Se a Fisheries Division, Montserrat Physical Planning Department, Montserrat University of Puerto Rico, Sea Grant College Program Caribbean Development
SELECTION OF THE PREFERRED MANAGEMENT OPTION FOR STOCKTON BEACH APPLICATION OF 2D COASTAL PROCESSES MODELLING
 SELECTION OF THE PREFERRED MANAGEMENT OPTION FOR STOCKTON BEACH APPLICATION OF 2D COASTAL PROCESSES MODELLING C Allery 1 1 DHI Water and Environment, Sydney, NSW Abstract This paper presents an approach
Inspection of Clarence City Beaches following Winter 2011 Storm Events
 18 July 2011 WRL Ref: WRL10086TDS L20110718 Messrs P Watson & I Preece Clarence City Council PO Box 96 Rosny Park TAS 7018 By email: pwatson@ccc.tas.gov.au ipreece@ccc.tas.gov.au Dear Phil/Ian, Inspection
CHAPTER 281 INFLUENCE OF NEARSHORE HARDBOTTOM ON REGIONAL SEDIMENT TRANSPORT
 CHAPTER 281 INFLUENCE OF NEARSHORE HARDBOTTOM ON REGIONAL SEDIMENT TRANSPORT Paul C.-P. Lin, Ph.D., P.E. 1 and R. Harvey Sasso, P.E. 2 ABSTRACT The influence of nearshore hardbottom on longshore and cross-shore
2015 ANNUAL REPORT - TO THE CITY OF NORTH WILDWOOD ON THE CONDITION OF THE CITY BEACHES
 2015 ANNUAL REPORT - TO THE CITY OF NORTH WILDWOOD ON THE CONDITION OF THE CITY BEACHES Ariel view of North Wildwood looking south from the Hereford Inlet perspective on June 24, 2015. The main channel
Habitat Development: Habitat Boulders Lawson Pier Foreshore Enhancement
 Habitat Development: Habitat Boulders Improve the existing habitat by stabilising beach sediments. Increase biodiversity by creating new habitats and colonisation opportunities. Loose cobble is unstable;
Bay County, MI Coastal Hazard Analysis Flood Risk Review Meeting. May 14, 2018
 Bay County, MI Coastal Hazard Analysis Flood Risk Review Meeting May 14, 2018 Agenda Introductions Coastal Flood Risk Study and Mapping Program Current Status Technical Overview of Study and Mapping Floodplain
Exhibit 1 PLANNING COMMISSION AGENDA ITEM
 Exhibit 1 PLANNING COMMISSION AGENDA ITEM Project Name: Grand Junction Circulation Plan Grand Junction Complete Streets Policy Applicant: City of Grand Junction Representative: David Thornton Address:
Coastal Hazards and Management in North Carolina. Braxton Davis April 14, 2015
 Coastal Hazards and Management in North Carolina Braxton Davis April 14, 2015 Coastal Facts and Figures 320 miles of ocean beaches 12,000+ miles of estuarine shoreline 2 million + acres of sounds, creeks,
Geology of the Hawaiian Islands
 Geology of the Hawaiian Islands Class 24 8 April 2004 Any Questions? Rise and fall of sea level and its effect on Hawai`i Sea level Has fluctuated up and down many times in the geologic past Evidence?
Dauphin Island East End Beach and Barrier Island Restoration Project. Beau Buhring South Coast Engineers
 Dauphin Island East End Beach and Barrier Island Restoration Project Beau Buhring South Coast Engineers Funding Funded with qualified outer continental shelf oil and gas revenues by the Coastal Impact
Emergency Coastal Protection Works Practical Lessons For The Future From The Past
 Emergency Coastal Protection Works Practical Lessons For The Future From The Past Angus Jackson1 Principal Engineer, International Coastal Management a.jackson@coastalmanagement www.coastalmanagement.com.au
Beach, dune and development in the Borough of Mantoloking as of January Prepared for The Borough of Mantoloking: April 2, 2008
 Summary of 20-years of Shoreline Monitoring Between Maryland Avenue, Point Pleasant Beach, Bay Head, Mantoloking, Brick Township, to 1 st Avenue in Normandy Beach, Ocean County, New Jersey & an Evaluation
1-32 NOME HARBOR, ALASKA (CWIS NOS , 87755, 12270, & 10422) Condition of Improvement 30 September 2012
 Condition of Improvement 30 September 2012") NOME HARBOR 1-32 NOME HARBOR, ALASKA (CWIS NOS. 72742, 87755, 12270, & 10422) Condition of Improvement 30 September 2012 AUTHORIZATION: (1) Rivers and Harbors Act, 8 August 1917 (House Doc. 1932, 64th
NOME HARBOR 1-32 NOME HARBOR, ALASKA (CWIS NOS. 72742, 87755, 12270, & 10422) Condition of Improvement 30 September 2012 AUTHORIZATION: (1) Rivers and Harbors Act, 8 August 1917 (House Doc. 1932, 64th
Table 4. Volumetric Change Rates Pre-Project and Post-Project for the Town of Duck
 V. VOLUMETRIC CHANGES General Volumetric changes measured over the entire monitoring area for various time periods are provided in Table 4. The volume changes are given in terms of cubic yards/foot of
Estuarine Shoreline Stabilization
 Estuarine Shoreline Stabilization Property Owner s Guide to Determining the Most Appropriate Stabilization Method Estuarine shorelines are dynamic features that experience continued erosion. Land is lost
Figure 4, Photo mosaic taken on February 14 about an hour before sunset near low tide.
 The Impact on Great South Bay of the Breach at Old Inlet Charles N. Flagg and Roger Flood School of Marine and Atmospheric Sciences, Stony Brook University Since the last report was issued on January 31
ST. LUCIE COUNTY, FLORIDA
 ST. LUCIE COUNTY, FLORIDA COASTAL STORM RISK MANAGEMENT STUDY Draft Feasibility Study & Integrated Environmental Assessment Public Meeting Presented by U.S. Army Corps of Engineers Jacksonville District
The Sand Beaches of New Hampshire and Maine
 The Sand Beaches of New Hampshire and Maine Beach Preservation and Erosion Control Photographs provided by Joe Kelly and Steve Adams Cover photo: Reid State Park, ME Introduction The sand beaches of New
CROSS-SHORE SEDIMENT PROCESSES
 The University of the West Indies Organization of American States PROFESSIONAL DEVELOPMENT PROGRAMME: COASTAL INFRASTRUCTURE DESIGN, CONSTRUCTION AND MAINTENANCE A COURSE IN COASTAL DEFENSE SYSTEMS I CHAPTER
USE OF SEGMENTED OFFSHORE BREAKWATERS FOR BEACH EROSION CONTROL
 .. CETN-III-22 4/84 PURPOSE: USE OF SEGMENTED OFFSHORE BREAKWATERS FOR BEACH EROSION CONTROL To provide information on the functional application of and general design considerations for using offshore
Oceanside Carlsbad. Solana Beach
 Oceanside Carlsbad Solana Beach BACKGROUND AND PURPOSE OF THE PROGRAM Many beaches in Southern California are actively eroding; A deficit of natural sand delivery to the beaches exists due to flood control
Traffic Calming Policy
 Article I. Purpose and Goal. The purpose of this policy is to establish criteria and procedures the City will use to evaluate requests for, and if appropriate, implement traffic calming measures. Neighborhood