HEC-RAS Two-Dimensional Modeling: Lake Wausau, Wisconsin River and Tributaries Big Rib River and Eau Claire River January 2018
|
|
|
- Vernon Chambers
- 5 years ago
- Views:
Transcription


1 Final Report HEC-RAS Two-Dimensional Modeling: Lake Wausau, Wisconsin River and Tributaries Big Rib River and Eau Claire River City of Schofield, City of Wausau, Town of Rib Mountain, and Village of Rothschild, in Marathon County, Wisconsin January 2018
2 This page intentionally left blank.
3 January 2018 Lake Wausau 2D Hydrodynamic Model Executive Summary The Lake Wausau Association has been working on ways to improve the water quality and fish habitat of the lake. The Corps of Engineers agreed to analyze the flow in Lake Wausau and model alternatives to increase flows in some of the backwater channels in an effort to reduce the growth of invasive species and algae. The LWA is working on the final steps in development of a Lake Wausau Management Plan. Lake Wausau is formed by blocking flow of the Wisconsin River by the Domtar Paper Mill Dam at Rothschild, WI. The dam is used for hydroelectric power generation for the paper mill. Flows into the lake come from the Wisconsin River, Big Rib River and the Eau Claire River Flowage. The Wisconsin River has 25 hydroelectric dams with the Wausau Dam located just upstream of the modeled area. The Brooks and Ross Dam is located on the Eau Claire River Flowage immediately upstream of the modeled area. One specific concern is the fish habitat at the upper end of Lake Wausau above and below the County Road N Bridge over the Big Rib River. This habitat has been degrading since the replacement of the bridge in 2004 due to the change in location of the northern end of the bridge and the extension of the causeway on the southern end of the bridge that cut off one of the flow channels. A second concern that LWA wanted examined with the hydrodynamic model was the water quality in the small channels near the golf course where the nutrient loading is high. Increased water velocity in historic backwater channels can increase the dissolved oxygen levels and potentially reduce aquatic vegetation growth due to the moving water. The 2D modeling was performed using HEC RAS version Hydrographic survey data was received from the University of Wisconsin Steven s Point and the Wisconsin Department of Transportation and its contractors. Marathon County, WI LiDAR data was obtained and used for above water elevations. A digital elevation model was created from the bathymetric and topographic data and used for the terrain of the 2D model. Manning s n values were based on Wiscland 2 land cover data from the Wisconsin Department of Natural Resources and aquatic plant mapping data provided by the LWA. Hydrographic flow data was obtained from the USGS for the gaging station upstream of Lake Wausau on each river and transferred downstream using appropriate methods detailed in the report. The hydraulic model was unable to be calibrated to water surface elevation data at the Domtar Dam downstream boundary (Wisconsin River at Rothschild) because the stage data was made available too late into the project. This modeling and results are intended to look at relative differences between existing conditions and the modeled scenarios. In an attempt to reduce model run times, the transferred hydrographs were spliced down to a shorter time window by removing parts of the hydrograph data from September A rating curve at the Domtar Dam was used for the downstream boundary. The model was built only using 2D geometry components. Lake Wausau was modeled as one large 2D area with a maximum cell size of 50 feet. Near any proposed project features a smaller cell size was used to capture the detail and the complex hydrodynamics near abrupt changes in flow patterns. There were four 2D area connections defined in Lake Wausau. The 2D area connections served like weirs and represented the Country Club with 5 existing, un gated culverts; Country Road N over the Big Rib River, a proposed jetty alongside the Eau Claire River as it enters Lake Wausau; and high ground on the right (south) bank immediately downstream of the US Hwy 51 bridge over the Big Rib River. The modeling was broken up into two main areas; the Big Rib River area and the Eau Claire River and Country Club area. Proposed alternatives at the Big Rib River area included placing a box culvert through the County Road N iii
4 embankment to connect a historic flow path that was cut off when the bridge was reconstructed. A box culvert was also modeled through the high ground just downstream of US Hwy 51 to provide flow to backwater channels. Dredging options were also modeled in the backwater channels and the main Big Rib River channel. Proposed alternatives at the Eau Claire River area included the construction of a 1,400 feet long jetty along the Eau Claire River channel following naturally high ground along the left (south) bank as it makes its way towards the centerline of the Wisconsin River. Different culvert options and an open channel through the jetty were modeled to look at maintaining flow in the backwater channel along the Lake Wausau shoreline between the Eau Claire River and the Country Club Road. Dredging options were also modeled of the Eau Claire River and specific backwater channels between the Eau Claire River and the Country Club Road. The modeled scenarios show the relative impacts of the proposed alternatives for habitat and water quality improvement in Lake Wausau specifically for the areas where the Big Rib River and the Eau Claire River enter Lake Wausau. Overall the velocities from both existing conditions and the scenarios modeled were quite low and in many cases less than 1 ft/sec. The scenarios modeled for the Big Rib River area reflected positive impacts in regards to increasing flows through the backwater channels referred to as upper slough, middle slough and even lower slough. Placement of the box culvert through the County Road N embankment did show flow being conveyed through the pipe however, the flows were lower than hoped and with the very low velocities may not be able to maintain a channel. The scenarios modeled for the Eau Claire River area showed some positive impacts in terms of increasing flows through the larger backwater channels between the Eau Claire River and the Country Club Road. Flows through the smaller backwater channels closer to the Country Club had minor increases. Placing the jetty with culvert alongside the Eau Claire River where it enters Lake Wausau resulted in retaining most of the flow in the Eau Claire River compared to existing conditions. Once through the culvert in the jetty the flows dropped off along the shoreline channel indicating that the flows were spreading out across the shallower water areas. It is anticipated that rate of sediment deposition in the Eau Claire River channel will decrease with a jetty in place since the jetty would block lateral transport of sediment into the channel from the south due to the blocking of wave action and prevent the Eau Claire River flows from spreading out across the shallow water towards the Country Club Road with increased velocity even though the larger velocity is still too low to transport much sediment. Readers are reminded that the model is un calibrated and can be used to compare relative differences between existing and proposed conditions only. The Lake Wausau system is dynamic and has a lot of factors that can change results depending upon the timing and details of a specific climatological event. The 2D hydrodynamic model is not a sediment transport or water quality model. A holistic approach would be the best method when looking for solutions to water quality issues in Lake Wausau. Besides using the 2D model to refine alternatives and make construction decisions; a major issue that needs to be kept in mind is looking at ways to decrease nutrient load to Lake Wausau, which will be especially important in the area near the golf course and downstream of the Eau Claire River where potential changes to velocity are extremely difficult due to the nearly flat pool created by the Domtar Dam at the downstream end of Lake Wausau. The 2D model could be converted into a sediment transport model in the future if sufficient sediment load data can be collected over a few years. A sediment transport model could examine deposition trends, evaluate impacts of dredging, and develop better informed solutions. January 2018 iv
5 Table of Contents Executive Summary... iii Table of Contents... v Tables... v Figures... vi CHAPTER Introduction Background Project Location and Study Area Purpose and Need... 3 CHAPTER Methods Data Collection Model Construction Hydraulic Model Unsteady Flow Data CHAPTER Scenarios Modeled and Results Existing Conditions Modeled Scenarios for the Big Rib River Area Modeled Scenarios for the Eau Claire River Area CHAPTER Conclusions General Comparison of Existing and Proposed Alternatives Model Limitations Next Steps CHAPTER References Tables Table 2 1 Streamflow Gages utilized in the Project Area... 4 Table 2 2 Upstream River Inflow Locations utilized in the Project Area..4 Table 2 3 Regression Equations for Flood Frequency Estimates...6 Table 2 4 Flood Frequency Data for Gage Sites and at Lake Wausau...7 Table 2 5 Flow Duration Data at Gage Sites and at Lake Wausau...8 Table 2 6 Bathymetric Data Availability at Bridges in the Project Area...9 Table 2 7 Land Cover and Manning's n Values..11 Table 3 1 Big Rib River Area Modeled Scenarios Table 3 2 Big Rib River Area Flow Profile Peaks by Scenario and Location Table 3 3 Eau Claire River Area Modeled Scenarios Table 3 4 Eau Claire River Area Flow Profile Peaks by Scenario and Location January 2018 v
6 Figures Figure 1 1 Overview of the Modeling Study Area... 2 Figure 2 1 USGS Gages near the Modeling Study Area... 5 Figure 2 2 Relationship of Discharge to Drainage Area for Selected Flood Frequencies Wisconsin River... 7 Figure 2 3 Merged DEM Constructed for the Hydraulic Model Figure 2 4 Layout of 2D Hydraulic Model Geometry Figure 2 5 Wisconsin River Hydrographs Figure 2 6 Big Rib River Hydrographs Figure 2 7 Eau Claire River Hydrographs Figure 2 8 Wisconsin River Full and Spliced Hydrographs Figure 2 9 Big Rib River Full and Spliced Hydrographs Figure 2 10 Eau Claire River Full and Spliced Hydrographs Figure 2 11 Rating Curve Headwater at Domtar Dam (Rothschild) Figure 3 1 2D Area Connection: Country Club Road Figure 3 2 2D Area Connection: Big Rib River County Road N South Bridge Embankment Figure 3 3 2D Area Connection: Big Rib River Downstream of US Hwy 51 South Side Figure 3 4 2D Area Connection: Eau Claire River South Bank Figure 3 5 All Modeled Proposed Big Rib River Area Improvements Figure 3 6 Big Rib River Area Flow Profile Locations Figure 3 7 All Modeled Proposed Eau Claire River Area Improvements Figure 3 8 Eau Claire River Area Flow Profile Locations January 2018 vi
7 CHAPTER Introduction Lake Wausau 2D Hydrodynamic Model 1.1 Background Lake Wausau is formed by blocking flow of the Wisconsin River by the Domtar Paper Mill Dam at Rothschild, WI. The Domtar Dam is used for hydroelectric power generation for the paper mill. Flows into the lake come from the Wisconsin River, Big Rib River and the Eau Claire River Flowage. The Wisconsin River has 25 hydroelectric dams and the Wausau Dam is located just upstream of the modeled area. The Brooks and Ross Dam is located on the Eau Claire River Flowage immediately upstream of the modeled area. Lake Wausau covers 1,971 acres (including 157 acres of islands) and has a volume of 12,994 acre feet at the full pool elevation of ft. The maximum depth is 35.4 feet, however; the average depth is only 6.7 feet. There are many shallow areas within the lake such that 24.4 percent of the lake is less than 3 feet deep at the full pool elevation. A common circumstance of shallow lake areas are the areas of algae, emergent, submergent and floating leaf vegetation. The longest wind fetch in the north south direction is about 3,800 ft long and the longest wind fetch is about 7,800 ft long in the northwest to southeast direction. Longer wind fetches generally produce larger wave, results in loss of shoreline, and can affect emergent, submergent and floating leaf vegetation. The Lake Wausau Association (LWA) works to protect, maintain, and enhance Lake Wausau and its surrounding area. Lake Wausau is a multiple use lake which includes boating and swimming recreation, hunting and fishing, hydropower generation, fish habitat and scenic appreciation. The Wisconsin River Basin is part of a water quality improvement project being conducted by the Wisconsin Department of Natural Resources (DNR) in partnership with many organization. As part of the water quality study, Total Maximum Daily Load (TMDL) criteria is being developed. Water quality issues in Lake Wausau include high phosphorus levels, suspended solids, areas of low dissolved oxygen and algal blooms, which contribute to concerns for human health, damaged fish and aquatic life, impaired water quality, and decreases in tourism. The LWA is leading an evaluation project of the lake with plans to complete the project and develop a management plan by early Other project partners are the DNR, University of Wisconsin Steven s Point (UW StP), Golden Sands Research Conservation and Development, USACE, and local municipalities. The role of USACE in this project was to conduct two dimensional hydrodynamics modeling of Lake Wausau to look at velocities within different areas of the lake and develop alternatives for improvement of fish habitat and water quality. One specific concern is the fishery habitat at the upper end of Lake Wausau above and below the County Road N Bridge over the Big Rib River. This habitat has been degrading since the replacement of the bridge in 2004 due to the change in location of the northern end of the bridge and the extension of the causeway on the southern end of the bridge that cut off one of the flow channels. A second concern that LWA wanted examined with the hydrodynamic model was the water quality in the small channels near the golf course where the nutrient loading is high. Increased water velocity in historic backwater channels can increase the dissolved oxygen levels and potentially reduce aquatic vegetation growth due to the moving water. January


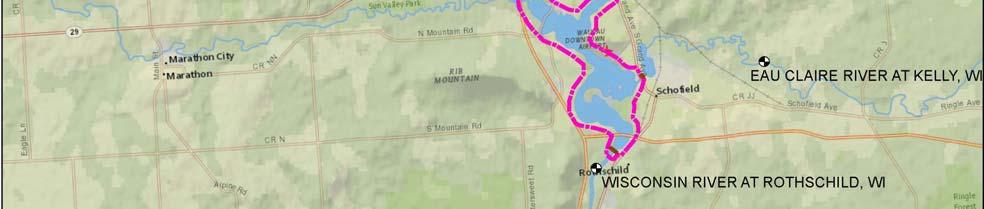
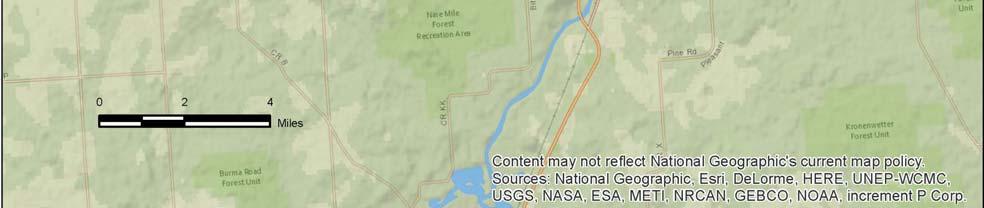
8 1.2 Project Location and Study Area Lake Wausau 2D Hydrodynamic Model The study area is within Lake Wausau. The southern end of the modeling is at the Domtar Dam on the Wisconsin River in Rothschild. The eastern end of the model is immediately downstream of the Brooks and Ross Dam on the Eau Claire River Flowage at Schofield. The western limit of the model is on the Big Rib River at the US Hwy 51 Bridge near Rib Mountain and Wausau. The northern limit of the model is just downstream of the Wausau Dam and Whitewater Park in Wausau. The study area is shown in Figure 1 1. Figure 1 1 Overview of the Modeling Study Area January
9 1.3 Purpose and Need Lake Wausau 2D Hydrodynamic Model The role of USACE in this project was to conduct two dimensional hydrodynamics modeling of Lake Wausau to look at velocities within different areas of the lake and develop alternatives for improvement of fish habitat and water quality. One specific concern is the fishery habitat at the upper end of Lake Wausau above and below the County Road N Bridge over the Big Rib River. This habitat has been degrading since the replacement of the bridge in 2004 due to the change in location of the northern end of the bridge and the extension of the causeway on the southern end of the bridge that cut off one of the flow channels. A second concern that LWA wanted examined with the hydrodynamic model was the water quality in the small channels near the golf course where the nutrient loading is high. Increased water velocity in historic backwater channels can increase the dissolved oxygen levels and potentially reduce aquatic vegetation growth due to the moving water. January
10 CHAPTER Methods Lake Wausau 2D Hydrodynamic Model 2.1 Data Collection Flow and Stage Gage data Water surface elevation data and flow records are important pieces of data for both the construction and calibration of a hydraulic model. The United States Geological Survey (USGS) collects water surface elevation at established gaging stations which can be converted to a continuous record of discharge or streamflow by maintaining a stage discharge relationship for each gage location through the periodic measuring of discharge at that location (Olson & Norris, 2007). A summary of the available gage locations operated by the USGS within the model study area is shown in Table 2 1. The table summarizes the gage ID, gage title, river and location description, the types of available data, and the years of record for the gage. Figure 2 1 shows the locations of the USGS gages available for the modeling. Table 2 1 Streamflow Gages utilized in the Project Area USGS Gage Gage Description Drainage Area (Sq. Mi.) Period of Record Wisconsin River at Merrill, WI 2, Present Big Rib River at Rib Falls, WI , 2009 Present Eau Claire River at Kelly, WI , 1939 Present Wisconsin River at Rothschild, WI 4, Present The USGS gage on the Big Rib River at Rib Falls is the closest gage to the project area however, it is located about 20 miles upstream of Lake Wausau. The USGS gage on the Wisconsin River at Merrill is the USGS gage upstream of the project are however, that gage is also located about 20 miles upstream of Lake Wausau. The USGS gage on the Eau Claire River at Kelly is only 4.5 miles upstream from the mouth (Lake Wausau). The USGS gage at Rothschild is at the very downstream end of the modeling area and can be used to check the model calibration of flows through Lake Wausau. Table 2 2 below shows the locations of the rivers at the upstream modeling limits and the drainage area for comparison to the gages shown above. These inflow locations can be seen at the northern, western and eastern limits of the modeling area shown in Figure 1 1 and correspond to the Wisconsin River, Big Rib River, and Eau Claire River, respectively. The gage locations in relation to the modeled area can be seen in Figure 2 1. Table 2 2 Upstream River Inflow Locations utilized in the Project Area Drainage Area Model Limit (Sq Mi.) Wausau River at Wausau Dam 3,060 Big Rib River at Wausau / Rib Mountain 495 Eau Claire River at Schofield 431 January


11 Figure 2 1 USGS Gages near the Modeling Study Area January
12 The flow data obtained from the upstream USGS gages had to be transferred downstream to Lake Wausau. The USGS report, Flood Frequency Characteristics of Wisconsin Streams (Walker and Krug, 2003) was consulted to determine the appropriate drainage area transfer relationships. The state of Wisconsin is divided into five flood frequency areas based on the appropriate regression equations for different basin characteristics. The Big Rib River watershed was located in area in Area 2 where the parameters in the regression equations were only drainage area, soil permeability and slope. The Eau Claire River watershed was located in Area 3 where the parameters in the regression equations were drainage area, soil permeability, percent storage and the precipitation index. Table 2 3 (Walker p. 10) shows the regression equations, where Q is flow in cfs for the recurrence interval (subscript), A is the drainage area (square miles), SP is soil permeability (inches/hour), S is main channel slope (feet/mile), ST is storage (percent), and I is the precipitation index, calculated as the 25 year, 24 hour precipitation intensity in inches minus 4.2. Table 2 3 Regression Equations for Flood Frequency Estimates Flood frequency statistics and basin characteristics at the four USGS gage sites were provided in tables of the report. The drainage area transfer method consisted of solving the regression equations for the downstream site (at Lake Wausau) and the gaged site. Then an adjustment ratio was calculated based on a comparison relationship between the actual flood frequency statistics at the gage and the regression equation values. As long as the size of the drainage area between the downstream site and the gage did not differ by more than 150% then the adjustment ratio was used. Note that for the Big Rib River at Lake Wausau the drainage area of 495 square miles was more than 150% of the gage drainage area of 303 square miles so the regression equation values could be used without applying the adjustment ratio. The Wisconsin River has 25 hydroelectric dams that regulate the flow on the river. The report provided tables of the flood frequency statistics for both of the Wisconsin River gages. The report also included a graph showing the relationship between drainage area and flood frequency data on the Wisconsin River. Because of the regulated nature of the Wisconsin River, the normal regression equations were not applicable to the Wisconsin River below the Wausau Dam. The graph was used to determine the floodfrequency data for the Wisconsin River below the Wausau Dam. January
13 Table 2 4 provides the flood frequency data at the gages and Lake Wausau locations, note that the data for the gages are highlighted. Whereas the non highlighted gages are located at the inflow locations to Lake Wausau. Table 2 4 Flood Frequency Data for Gage Sites and at Lake Wausau Drain Area (sq. mi.) Flows for Percent Chance Exceedance (cfs) 50% 20% 10% 4% 2% 1% Wisconsin River at Merrill 2,760 13,600 18,800 21,900 25,500 28,000 30,400 Wisconsin River Wausau Dam 3,060 16,600 22,900 26,600 30,800 33,700 36,400 Wisconsin River at Rothschild 4,020 27,900 38,300 44,200 50,500 54,700 58,400 Rib River at Rib Falls 303 6,950 11,800 15,200 19,400 22,400 25,400 Big Rib River at Lake Wausau ,835 18,038 22,997 29,028 33,297 37,528 Eau Claire River at Kelly 375 3,180 4,740 5,780 7,100 8,070 9,030 Eau Claire River at Lake Wausau 431 3,216 4,727 5,722 6,976 7,896 8,796 The graph from the USGS report (Walker p. 12) showing the relationship between drainage area and flow for flood frequency data is shown below in Figure 2 2. The flow values for the Wisconsin River below Wausau Dam was determined by estimating the value from the graph below and then plotting the estimated value and adjusting so that the line for that flood frequency is a straight line between the values for Merrill (2,760 sq mi) and Rothschild (4,020 sq mi). Figure 2 2 Relationship of discharge to drainage area for selected flood frequencies along the Wisconsin River January
14 The USGS Stream Stats online application was used to determine drainage area and basin characteristics of ungauged sites. The application was also used to obtain flow duration data for the four USGS gages. Since the most critical time for water quality issues happens during times of low flow, the flood frequency data wouldn t be very useful for actual 2D modeling of Lake Wausau. Flow duration data calculates the percent of time that a specific flow is equaled or exceeded. Flow duration statistics for the gage locations were calculated using the Stream Stats online application through the USGS website (see references). As a rough estimate of flows at the inflows to Lake Wausau the flow frequency data was examined to determine the factor that was used to multiply the gage data by to transfer downstream for the specific stream. In general for the tributaries (Big Rib River and the Eau Claire River) the proportion of the flow that came from the tributaries increased as the total amount of flow decreased and the duration of time increased. For the lower discharges, it was assumed that the inflows could be summed to equal the flow at the Rothschild Dam. The flow duration data is shown in Table 2 5 below. Table 2 5 Flow Duration Data for Gage Sites and at Lake Wausau Drain Area (Sq. Mi.) Flow Duration (Annual) 95% 75% 50% 20% 10% Wisconsin River at Merrill 2,760 1,030 1,600 2,040 3,000 4,320 Wisconsin River at Wausau Dam 3,060 1,073 1,672 2,162 3,267 4,817 Wisconsin River at Rothschild 4,020 1,200 1,900 2,500 4,100 6,420 Rib River at Rib Falls Big Rib River at Mouth ,060 Eau Claire River at Kelly Eau Claire Flowage at Mouth The Domtar Paper Mill Dam at Rothschild, WI is used to generate hydropower for the paper mill. There has been very limited data found regarding the operation of the dam. An internet search found an order issued September 22, 2016 by the Federal Energy Regulatory Commission (FERC) authorizing a draw down plan for a 5 week period in the fall (September to November time frame) of 2016 so that Domtar could make concrete repairs to the dam. In that order it states the normal operating parameters for background information. Article 402 requires the licensee to operate the project in a run of river mode in which the reservoir surface elevation remains between 1,160.6 and 1,160.8 feet National Geodetic Vertical Datum. The author assumes this is the same as NGVD29. There is a USGS gaging station ( Wisconsin River at Rothschild, WI) located near the Domtar Dam however, it is located 0.5 miles downstream of the dam. A flow record is available from October 1944 to present. Only the most recent gage heights are available online however since these are from the downstream side of the dam they are not applicable to this study. A request for pool stage data (Lake Wausau elevations) was sent to the Domtar Dam operators, however the requested data was received in December 2017 too late to be incorporated into the project. January
15 2.1.2 Digital Elevation Model (DEM) Lake Wausau 2D Hydrodynamic Model The depths in Lake Wausau were surveyed with GPS tracking and sonar equipment by staff from the UW StP in May through October Depths obtained from the surveys were subtracted from surveyed surface water elevations to obtain elevations of the bottom of the lake. This data was provided as GIS point shapefile data in the Marathon County projected coordinate system in US survey feet with a vertical datum of NAVD88 ft. ArcGIS was used to reproject the data to the Albers Equal Area projection (horizontal coordinate system), which is a USACE standard. The overall Lake Wausau surveys conducted by UW StP did have some missing data at the bridges over Lake Wausau. The Wisconsin Department of Transportation (DOT) was contacted to obtain bathymetric survey data collected as part of the bridge inspection program to fill in the bathymetric data gaps. Some of the bridge data sets were obtained from Ayres and Associates as contractors for the DOT. The bridge inspection bathymetric data used to supplement the bathymetry is summarized and compared to the UW StP data in table 2 3 below. Where there was overlap in the data sets the most recent data was used. Refer to Figure 1 1 for a review of the bridge locations. Table 2 6 Bathymetric Data Availability at bridges in the Project Area Bridge Location WI Hwy 29 Bridge on Wisconsin River 0.5 miles US of Domtar Dam Co N Bridge on Wisconsin River 6.0 miles US of Domtar Dam Co N Bridge on Big Rib River 5.0 miles US of Domtar Dam US 51 / Hwy 29 Bridge on Big Rib River 5.4 miles US of Domtar Dam Business US 51 Bridge on Eau Claire River 3.9 miles US of Domtar Dam UW StP WSEL & Date ft ft ft ft ft 2012 WI DOT WSEL & Date ft 8/20/ ft 8/14/ ft 8/18/ ft 8/13/2012 Ayres WSEL & Date ft 8/25/ ft * 8/25/ ft** 9/5/2012 * The actual water surface elevation measured at the Co N Bridge on the Wisconsin River by Ayres was ft. Further investigation has revealed that the benchmark elevation used to determine the water surface elevation at the Co N (Thomas St) Bridge on the Wisconsin River is erroneous resulting in all of the depth data being off. A tail water elevation of ft from the Wausau Dam upstream of the Co N Bridge was recorded by the dam operators on the date of Ayres survey. The Wisconsin River flow on the date of survey was used in the preliminary FIS model for Lake Wausau (1D, steady state) model obtained from the DNR to generate water surface profiles. The modeled water surface profiles were compared to the water surface elevation from the WI Hwy 29 Bridge survey downstream (also surveyed by Ayres on 8/25/2016) for verification. The water surface elevation on 8/25/2016 would have likely been approximately ft and this value was used to adjust the elevations of the survey data points. The lake wide UW StP sonar and bridge inspection datasets were merged with above low water Light Detection and Ranging (LiDAR) data collected by Wisconsin DNR in Marathon County. These datasets have been merged for this study and a triangulated irregular network (TIN) created. This TIN was converted to a raster (grid data) using natural neighbors to create a single Digital Elevation Model (DEM) with a 5 ft grid size as shown in Figure 2 3. This DEM is used to attribute elevation data to the hydraulic model features. January

16 The vertical datum for the DEM and hydraulic model is NAVD88, ft. The horizontal projection for the DEM and hydraulic model is USA Contiguous Albers Equal Area Conic USGS Version, GCS North American 1983 datum. The Albers projection is a USACE standard. Figure 2 3 Merged Digital Elevation Model (DEM) Constructed for the Hydraulic Model January
17 2.2 Model Construction The selected software for the modeling effort is HEC RAS version (USACE, 2016). This software, originally developed as a one dimensional (1D), steady flow hydraulic modeling software package, now has capabilities for unsteady flow, sediment modeling, and two dimensional (2D) flow. For this effort, the software is used to construct a 2D, unsteady flow, hydraulic river model; develop alternatives for improving velocities in backwater channels; and provide recommendations. Due to the fact that since Lake Wausau is formed by a dam across the Wisconsin River at Rothschild, WI it behaves much like a lake in terms of flow patterns. The head differential from the northern end of Lake Wausau to the southern end is very small. Therefore, a 2D model was built for the lake to look at flow currents throughout the lake instead of a 1D model of the Wisconsin River. The terrain of the 2D mesh was taken directly from the DEM shown in Figure 2 3 in HEC RAS. Mesh cell size was 10 feet. Boundary condition lines were created at the upstream limits of the model on the Wisconsin River (below Wausau Dam), Big Rib River (at US Hwy 51 / WI Hwy 29), and the Eau Claire River (just below the Brooks and Ross Dam). The downstream boundary condition was set at the Domtar Dam. Existing ungated culverts under Country Club Road were included in the model. Since the model was looking at lower flow ranges the large bridges across Lake Wausau were not included in the model Manning s n Values The Wisconsin Department of Natural Resources has land cover data available online for the State of Wisconsin. From the User Guide (WDNR 2016), The Wiscland 2 land cover project was a collaborative effort of the Wisconsin Department of Natural Resources (WDNR), University of Wisconsin Madison (UW), and the Wisconsin State Cartographer s Office (SCO) conducted between the fall of 2013 and August The database has geometric accuracy of 12 to meters. Manning s n values were obtained by using the Wiscland 2 Land Cover data and defining corresponding Manning s n values. The land classifications found within the Lake Wausau project area are listed below. The 2D Modeling User s Manual (USACE 2016) provides guidance on Manning s n values to use for different land classifications. Table 2 7 below lists the land classification and the Manning s n values used. Table 2 7 Land Cover and Manning s n Values Classification Level 2 Description Manning s n Value 1100 Developed, High Intensity Developed, Low Intensity Crop Rotation Forage Grassland Idle Grassland Coniferous Forest Broad leaved Deciduous Forest Open Water Floating Aquatic Herbaceous Vegetation Emergent / Wet Meadow Lowland Scrub / Shrub Forested Wetland Barren 0.04 January

18 In places where the modeling scenario had to reflect either plant harvesting or dredging, those locations were given the open water Manning s n value of Dredging scenarios also had the actual bathymetry elevations changed to reflect the dredging. The final layout of the 2D model is shown in Figure 2. Wisconsin River Big Rib River Eau Claire River Figure 2 4 Layout of 2D Hydraulic Model Geometry January
19 All elevations used in the modeling effort and presented in this report are in North American Vertical Datum of 1988 (NAVD88). The conversion from the National Geodetic Vertical Datum of 1929 (NGVD29) to NAVD88 is only 0.04 feet. 2.3 Hydraulic Model Unsteady Flow Data The hydraulic model was unable to be calibrated to water surface elevation data at the Domtar Dam downstream boundary (Wisconsin River at Rothschild) because the stage data was made available too late into the project. This modeling and results are intended to look at relative differences between existing conditions and the modeled scenarios. Flow hydrographs were obtained online from the USGS for the four gaging stations in the project area. These flows were transferred downstream using the factors developed for the flow duration data. The time period chosen for the 2D hydraulic model was September 2016 because in November 2016 there was a drawdown of Lake Wausau to facilitate repairs to the Domtar Dam. Possible compaction of the soils on the bottom of Lake Wausau could affect the bathymetry data used for the model. Due to the recent flow data the values obtained were in 30 minute increments. In addition the upstream and downstream boundary conditions on the Wisconsin River are dams which don t reflect open river conditions. There is also a dam at Merrill. Because of this, a 5 period moving average was applied to the the upstream inflow hydrograph to smooth out the flows on the Wisconsin River just downstream of the Wausau Dam. The Merrill Gage is located about 20 miles upstream of Lake Wausau. By doing a visual comparison of hydrograph peaks a 1/2 day lag time was used in transferring the hydrograph downstream. The hydrographs of the Merrill Gage and just downstream of the Wausau Dam are plotted below in Figure Wisconsin River Flow Hydrographs Merrill Gage & Transferred to Wausau Dam Flow (cfs) Days, Starting September 2, 2016 Wausau Dam (Smoothed) Merrill Gage Figure 2 5 Wisconsin River Hydrographs January
20 The Rib Falls gage on the Big Rib River is located about 20 miles upstream of Lake Wausau. By doing a visual comparison of hydrograph peaks a 1/2 day lag time was used in transferring the hydrograph downstream. The hydrographs of the Rib Falls Gage and just downstream of the US Hwy 51 Bridge are plotted below in Figure 2 4. Flow (cfs) Big Rib River Flow Hydrographs Rib Falls Gage & Transferred to Rib Mountain (US HWy 51) Days, Starting September 2, 2016 Rib Mountain (US Hwy 51) Rib Falls Figure 2 6 Big Rib River Hydrographs The Kelly gage on the Eau Claire River is only 4.5 miles upstream from the mouth at Lake Wausau. The hydrographs of the Kelly gage and just downstream of the Brooks and Ross Dam are shown in Figure Eau Claire River Flow Hydrographs Kelly Gage & Transferred to Schofield (Brooks & Ross Dam) 200 Flow (cfs) Days, Starting September 2, 2016 Brooks & Ross Dam Kelly Gage Figure 2 7 Eau Claire River Hydrographs January
21 Determining the impacts of alternatives proposed to alleviate the habitat and water quality problems in Lake Wausau was the focus of the modeling. September was chosen because typically the lowest flows and poor water quality in Midwestern lakes occur at the end of summer. Keeping run times reasonable in 2D modeling can be difficult depending upon the complexity of the model. The initial run times for the 18 day simulation took over 2 hours. Since the modeling is only looking at relative impacts of the alternatives the 18 day hydrographs were cut down to 4.5 days, thereby reducing model run time to around 30 minutes. The shape of parts of the hydrograph was kept and spliced together for each inflow hydrograph and the spikes in flows were removed to improve model stability. Actual flows in each river are variable depending upon the current climatic factors and dam operation so these flows are just an example. The comparison of the full hydrograph and the spliced hydrograph for each river is shown in Figures 2 6, 2 7, and 2 8. Figure 2 8 Wisconsin River Full and Spliced Hydrographs January
22 Figure 2 9 Big Rib River Full and Spliced Hydrographs Figure 2 10 Eau Claire River Full and Spliced Hydrographs January
23 Since the full hydrographs were developed, the model could be calibrated at any time using the full flow hydrographs once the stage hydrograph for the pool elevation at the Domtar Dam is made available. A rating curve was used for the downstream boundary condition at the Domtar Dam in Rothschild. The upper portion (adopted stages for 10%, 2%, 1%, and 0.2% annual chance exceedance flood events) of the rating curve was taken from the effective Flood Insurance Study (FIS) for Marathon County (FEMA 2010). The Federal Regulatory Energy Commission (FERC) requires the Domtar Paper Company to maintain the pool at the Domtar Dam (FERC Project No ) between and ft National Geodetic Vertical Datum (Weyerhaeuser 1996). Figure 2 9 shows the downstream rating curve at the Domtar Dam pool (headwater) level (NAVD88). Figure 2 11 Rating Curve Headwater at the Domtar Dam (Rothschild) January
24 CHAPTER 3. Lake Wausau 2D Hydrodynamic Model 3. Scenarios Modeled and Results 3.1 Existing Conditions The existing conditions scenario was the base scenario to which all alternatives were compared. The existing conditions model uses the base DEM described earlier. The goal was to keep the same geometry file for all scenarios as much as possible. During hydrodynamic calculations the terrain (DEM or DEM with dredging) is combined with the geometry data file allowing the same geometry file to be used for different scenarios. The geometry file consists of a 2D mesh (or grid), hydraulic structures (2D area connections), and Manning s n values. There were four 2D area connections defined in Lake Wausau. The top elevations (called a weir in the model) of all four 2D area connections for existing conditions matched the elevations from the LiDAR data and was part of the geometry files. Some of the alternatives looked at adding culverts through embankments to connect backwater areas to each other or a tributary channel. The culverts from these alternatives were included in the embankments of the 2D area connections. The software doesn t allow for culverts to be buried and trenches had to be cut into the existing bathymetry to be able to connect the culverts to their inverts on either end. The unsteady flow file provides the inflow hydrographs, starting water surface elevation for Lake Wausau and the downstream rating curve. For existing conditions the only culverts modeled the existing culverts under Country Club Road. The top of the weir on the 2D area connection filled in the trench where it crossed the connection. The bullets below summarize the scenario. Existing bathymetry, except for trenches for the proposed culverts (no proposed culverts) 2D Area Connections o o Country Club Road: existing un gated 5 culverts are always open Big Rib River: County Road N (southern embankment) o Big Rib River: high ground on south side immediately downstream of US Hwy 51 o Eau Claire River: south side high ground (Jetty) (extends west from the lakeshore) The overall layout of the 2D Hydraulic Model geometry was provided in Figure 2 2. The following figures provide closer up views of the 2D Area Connections defined above. January


25 Figure 3 1 2D Area Connection: Country Club Road Figure 3 2 2D Area Connection: Big Rib River County Road N South Bridge Embankment January


26 Figure 3 3 2D Area Connection: Big Rib River Downstream of US Hwy 51 South Side Figure 3 4 2D Area Connection: Eau Claire River South Bank January

27 3.2 Modeled Scenarios for the Big Rib River Area The goal for improvements in the Big Rib River area was to increase velocities in the backwater channels for fish habitat (and improved water quality). Some of the alternatives included placing a culvert through the County Road N embankment on the south side where the 2004 bridge replacement filled in a flow path; dredging of the two main backwater channels on the south side of the river; placing a culvert through high ground on the south side immediately downstream of the US Hwy 51 to reconnect a historic flow path; and dredging deposition from the main Rib River channels upstream, at, and downstream of the County Road N bridge. The historic flow path on the south side (right bank) immediately downstream of US Hwy 51 is referred to as the Upper Slough. The backwater channel located on the south side of the river between US Hwy 51 and Co Rd N is referred to as the Middle Slough. The backwater channel downstream of the confluence of the Upper Slough and Middle Slough is referred to as the Lower Slough. Two different bottom elevations were considered for the Big Rib River dredging. The minimum dredging elevation for the Big Rib River dredging was ft (NAVD88); compared to the full dredging bottom elevation of ft (NAVD88).All of the proposed improvements to the Big Rib River Area are shown in Figure 3 5. Figure 3 5 All Modeled Proposed Big Rib River Area Improvements January
28 The LWA indicated that their overall plan for improvements to Lake Wausau will need to be developed in phases due to funding and requested some information about impacts of only doing part of the improvements at a time. Multiple scenarios were run for the Big Rib River area to look at creating the improvements in phases and an initial look at culvert sizes. Note that box culvert sizes are listed as the span (ft) x rise (ft). Each scenario modeled had different combinations of the improvements described above. The scenarios modeled are shown in Table 3 1 below indicating which improvement(s) was part of the scenario. Scenario Name Table 3 1 Big Rib River Area Modeled Scenarios County Road N Pipe (Dredge Invert 1155) Upper Slough Pipe & Dredging (Invert ) Middle Slough Dredging (Invert ) Lower Slough Dredging (Invert 1153) Big Rib River Channel Dredging ExistingSpliceHydro No No No No No BigRibCoNonlyNoDredge Yes 6'x6' Box No No No No BigRibNoMainChDredgeUS8x4 Yes 6'x6' Box Yes 8'x4' Box Yes Yes No BigRibUS_8x4 Yes 6'x6' Box Yes 8'x4' Box Yes Yes Yes Invert 1152 BigRibUS_6x4 Yes 6'x6' Box Yes 6'x4' Box Yes Yes Yes Invert 1152 BigRibUS_2 6x4 Yes 6'x6' Box Yes (2) 6'x4' Box Yes Yes Yes Invert 1152 BigRibUS_5x5 Yes 6'x6' Box Yes 5'x5' Box Yes Yes Yes Invert 1152 BigRibMinMainChDrdgUS5x5 Yes 6'x6' Box Yes 5'x5' Box Yes Yes Yes Invert 1153 BigRibMinMainChDrdgUS8x4 Yes 6'x6' Box Yes 8'x4' Box Yes Yes Yes Invert 1153 Overall the velocities from both existing conditions and the scenarios modeled were quite low and in many cases less than 1 ft/sec. Examining the flow hydrograph at a specific location provided more information to show where flow was increased or decreased compared to the existing conditions. Specific profile locations were chosen strategically located upstream and downstream of improvements to evaluate the effectiveness of the improvement. These profile locations for the Big Rib River Area are shown in Figure 3 6 and each location is labeled for easy reference. The total flow across each specific profile location was examined and the peak flow is shown in table 3 2. January

29 Figure 3 6 Big Rib River Area Flow Profile Locations January
30 Table 3 2 Big Rib River Area Flow Profile Peaks By Scenario and Location Peak Flow At Profile Locations by Scenario (cfs) Upper Slough Area Middle Slough Area Scenario Name Up1 Up2 UpBox BRlb BRrb1 BRrb2 Md1 Md2 BRm1 BRm2 ExistingSpliceHydro BigRibCoNonlyNoDredge BigRibNoMainChDredgeUS8x BigRibUS_8x BigRibUS_6x BigRibUS_2 6x BigRibUS_5x BigRibMinMainChDrdgUS5x BigRibMinMainChDrdgUS8x Lower Slough Area / Co Rd N Scenario Name Lw1 Lw2 CoNBox BR1 BR2 BR3 BRlb2 ExistingSpliceHydro BigRibCoNonlyNoDredge BigRibNoMainChDredgeUS8x BigRibUS_8x BigRibUS_6x BigRibUS_2 6x BigRibUS_5x BigRibMinMainChDrdgUS5x BigRibMinMainChDrdgUS8x January
31 One of the considerations was to put the proposed improvements to the Big Rib River area in place in phases due to funding. The first step being considered would be to place the box culvert through County Road N without doing any channel dredging. The box culvert (CoNBox) provides about 17 cfs because the back water from the Wisconsin River results in minimal difference in water surface elevation between the upstream and downstream sides of the County Road N embankment. The only modeled feature that resulted in a higher flow of 24.5 cfs occurred with minimial main channel dredging and the largest box culvert size providing flow to the upper slough. There was interest in getting flow through the upper slough area for fish habitat. Dredging was modeled for the upper slough, middle slough and lower slough. Different box culvert sizes and even the number of box culverts was examined. There was little variation, 13 to 18 cfs, between the results for the different culvert sizes, however, all culvert options showed a noticeable improvement in the peak flow through the upper slough. Using two box culverts through the high ground leading to the upper slough showed the largest flow increase of cfs. Dredging of the middle slough and lower slough showed an increase in flows through these sloughs. Another location for improvement was to dredge the main channel of the Big Rib River for improved boat access in general from the upstream to the downstream side of County Road N. The initial model runs looked at dredging in the main channel to a bottom elevation of ft. Adding the dredging impacted the flow in the backwater channels by reducing them by 3 percent in the upper slough, 7 percent in the middle slough and 7 percent in the lower slough. One scenario had the main channel dredging of the Big Rib River minimized by raising the bottom elevation to ft instead of ft. This dramatically reduced the area needing dredging. Minimizing the main channel dredging impacted the flow in the backwater channels by reducing them by 1 percent in the upper slough, 2 percent in the middle slough and 3 percent in the lower slough. 3.3 Modeled Scenarios for the Eau Claire River Area The goal for the 2D modeling in the Eau Claire River area was to increase velocities in the backwater channels hoping to improve water quality and reduce nuisance aquatic vegetation growth. The improvements consisted of dredging of the Eau Claire River bottom and constructing a jetty approximately 1,400 feet long following natural high ground along the left bank (south side) of the Eau Claire River channel as it makes it way to the centerline of the Wisconsin River through Lake Wausau. Some scenarios placed box culvert(s) through the jetty to allow flow to enter the existing backwater channel along the Lake Wausau shoreline that has been narrowing over time. Another option looked at keeping a 30 feet bottom width channel open through the jetty near the Lake Wausau shoreline. The jetty will help maintain a defined channel for the Eau Claire River by reducing sedimentation from wave action from the south side and help create shallow water mud flats on the south side of the jetty for waterfowl habitat. The top elevation chosen for the jetty was ft NAVD88, which is about 5 to 6 feet above the lake bottom elevation here. There are many vegetation harvest areas in the backwater areas between the Eau Claire River and the golf course. The proposed scenarios included some dredging of the specific backwater channels. In Lake Wausau aquatic plants are growing in water depths of up to 8 feet. This modeling looked at changes in flows and velocity in the Eau Claire River and backwater channels. Modeling scenarios varied the size and number of culverts through the jetty. Note that box culvert sizes are listed as the span (ft) x rise (ft). Each scenario modeled had different combinations of the improvements described above and are shown in Figure 3 7. The scenarios modeled are shown in Table 3 3 below indicating which improvement(s) was January
32 part of the scenario. Lake Wausau 2D Hydrodynamic Model Table 3 3 Eau Claire River Area Modeled Scenarios Scenario Name Jetty Eau Claire River, Side Channel Dredging & Invert Elevation Culvert(s) through Jetty ExistingSpliceHydro No No No No Yes Eau Claire 1150, Channel No ECjetty8x8 Yes Min 1154, Channels 1153 (1) 8'x8' Box Yes Eau Claire 1150, Channel No ECjetty2 8x8 Yes Min 1154, Channels 1153 (1) 8'x8' Box Yes Eau Claire 1150, Channel No ECjetty9x9 Yes Min 1154, Channels 1153 (2) 9'x9' Box ECjettyChannel Yes Yes Eau Claire 1150, Channel Min 1154, Channels 1153 No Yes Channel through the Jetty Specific profile locations were chosen strategically located upstream and downstream of improvements to evaluate the effectiveness of the improvement. These profile locations for the Eau Claire River Area are shown in Figure 3 8 and each location is labeled for easy reference. January

33 Figure 3 7 All Modeled Proposed Eau Claire River Area Improvements January

34 Figure 3 8 Eau Claire River Area Flow Profile Locations January
Plan B Dam Breach Assessment
 Plan B Dam Breach Assessment Introduction In support of the Local Sponsor permit applications to the states of Minnesota and North Dakota, a dam breach analysis for the Plan B alignment of the Fargo-Moorhead
WMS 8.4 Tutorial Hydraulics and Floodplain Modeling HY-8 Modeling Wizard Learn how to model a culvert using HY-8 and WMS
 v. 8.4 WMS 8.4 Tutorial Hydraulics and Floodplain Modeling HY-8 Modeling Wizard Learn how to model a culvert using HY-8 and WMS Objectives Define a conceptual schematic of the roadway, invert, and downstream
OFFICE OF STRUCTURES MANUAL FOR HYDROLOGIC AND HYDRAULIC DESIGN CHAPTER 11 APPENDIX B TIDEROUT 2 USERS MANUAL
 OFFICE OF STRUCTURES MANUAL FOR HYDROLOGIC AND HYDRAULIC DESIGN CHAPTER 11 APPENDIX B TIDEROUT 2 USERS MANUAL APRIL 2011 APRIL 2011 Page 1 Preface TIDEROUT 2, Build 1.22 dated June 29, 2006 is the current
Sussex County, DE Preliminary Study Overview
 Sussex County, DE Preliminary Study Overview Coastal study scope: 102 miles of entire County shoreline Revised 102 panels for coastal study Riverine study scope: 14 streams, 67.1 miles, within the Nanticoke
CALCASIEU SALINITY STRUCTURES. HYDRODYNAMIC MODELING (To Support Design of Salinity Barriers)
") CALCASIEU SALINITY STRUCTURES HYDRODYNAMIC MODELING (To Support Design of Salinity Barriers) Presentation Overview 1 2 3 4 5 Project Overview and CEA Circulation Modeling Vessel Hydrodynamics Modeling
CALCASIEU SALINITY STRUCTURES HYDRODYNAMIC MODELING (To Support Design of Salinity Barriers) Presentation Overview 1 2 3 4 5 Project Overview and CEA Circulation Modeling Vessel Hydrodynamics Modeling
APPENDIX C. Fluvial and Tidal Hydraulics Report
 APPENDIX C Fluvial and Tidal Hydraulics Report BUENA VISTA LAGOON ENHANCEMENT PROJECT FLUVIAL AND TIDAL HYDRAULICS ANALYSES Prepared for: SANDAG 401 B Street, Suite 800 San Diego, California 92101 Contact:
APPENDIX C VEGETATED EMERGENCY SPILLWAY. VERSION 1.0 March 1, 2011
 APPENDIX C VEGETATED EMERGENCY SPILLWAY VERSION 1.0 March 1, 2011 [NOTE: Could use a better photo more clearly showing the emergency spillway in the context of the dam.] SECTION C-1: DESCRIPTION OF PRACTICE
STUDY REPORT W&AR-03 RESERVOIR TEMPERATURE MODEL ATTACHMENT B DON PEDRO RESERVOIR BATHYMETRIC STUDY REPORT
 STUDY REPORT W&AR-03 RESERVOIR TEMPERATURE MODEL ATTACHMENT B DON PEDRO RESERVOIR BATHYMETRIC STUDY REPORT DON PEDRO RESERVOIR BATHYMETRIC STUDY REPORT Prepared for: TURLOCK IRRIGATION DISTRICT MODESTO
APPENDIX J HYDROLOGY AND WATER QUALITY
 APPENDIX J HYDROLOGY AND WATER QUALITY J-1 Technical Report on Airport Drainage, Northern Sector Airport and Ordinance Creek Watershed / Preliminary Creek Constructed Natural Channel Culvert J-2 Preliminary
FINAL Caples Lake Fisheries Management Plan. Version 4.0
 FINAL Caples Lake Fisheries Management Plan Version 4.0 August 15, 2008 Purpose The Caples Lake Fisheries Management Plan (Plan) outlines the stocking plan to reestablish a sport fishery in Caples Lake
APPENDIX H LAKE OKEECHOBEE FLOOD ROUTINES
 1 2 3 APPENDIX H LAKE OKEECHOBEE FLOOD ROUTINES 1 2 3 4 5 6 7 8 9 10 11 12 13 14 15 16 17 18 19 20 21 22 23 24 25 26 27 28 29 30 31 32 33 34 35 36 37 38 39 40 41 42 43 44 45 LAKE OKEECHOBEE FLOOD ROUTINGS
SECTION 2 HYDROLOGY AND FLOW REGIMES
 SECTION 2 HYDROLOGY AND FLOW REGIMES In this section historical streamflow data from permanent USGS gaging stations will be presented and discussed to document long-term flow regime trends within the Cache-Bayou
Packwood Lake Intake Screen Velocity Test Report for Energy Northwest's Packwood Lake Hydroelectric Project FERC No Lewis County, Washington
 for Energy Northwest's Packwood Lake Hydroelectric Project FERC No. 2244 Lewis County, Washington Submitted to P.O. Box 968 Richland, Washington 99352-0968 Submitted by EES Consulting 1155 North State
CLAIBORNE LOCK AND DAM PERTINENT DATA
 CLAIBORNE LOCK AND DAM PERTINENT DATA GENERAL Location Clarke, Monroe, & Wilcox Counties, Alabama; Alabama River, river mile 72.5 Drainage area Millers Ferry to Claiborne sq. mi. 836 Total drainage area
PROFILE OF SACRAMENTO RIVER, FREEPORT TO VERONA, CALIFORNIA,
 PROFILE OF SACRAMENTO RIVER, FREEPORT TO VERONA, CALIFORNIA, FLOOD OF FEBRUARY 1986 By J.C. Blodgett and J.B. Lucas U.S. GEOLOGICAL SURVEY Open-File Report 88-82 CO CM I m r-h CM Sacramento, California
Chapter 11. Culverts and Bridges Design Checklist for Culvert Design
 Yes No N/A Design Requirements I. GENERAL DESIGN GUIDELINES Chapter 11. Culverts and Bridges A. Culvert design is in accordance with the Culverts chapter of Volume 2 of the UDFCD Manual for additional
Technical Report Culvert A Hydraulic Analysis
 DATE: November 3, 2011 Technical Report Culvert A Hydraulic Analysis TO: FROM: RE: Jim Reiser, P.E. Project Manager Parsons Brinckerhoff, Inc. Kurt Killian, P.E., CFM Parsons Brinckerhoff, Inc. Design
Total Suspended Solids, Stable Flow, and Wet Weather Event Monitoring in the Bass River Watershed. December The Cadmus Group, Inc.
 Total Suspended Solids, Stable Flow, and Wet Weather Event Monitoring in the Bass River Watershed December 2004 The Cadmus Group, Inc. Grand Valley State University Annis Water Resources Institute Submitted
Culvert Design for Low and High Gradient Streams in the Midwest. Dale Higgins, Hydrologist Chequamegon-Nicolet National Forest
 Culvert Design for Low and High Gradient Streams in the Midwest Dale Higgins, Hydrologist Chequamegon-Nicolet National Forest Overview Culvert Design Considerations Hydraulic Terms Culvert Impacts Low
VIRGINIA SOIL AND WATER CONSERVATION BOARD GUIDANCE DOCUMENT ON DAM BREAK INUNDATION ZONE AND INCREMENTAL DAMAGE ANALYSIS AND MAPPING PROCEDURES
 (Approved XXXXX, 2010) Working Draft Version January 14, 2010 VIRGINIA SOIL AND WATER CONSERVATION BOARD GUIDANCE DOCUMENT ON DAM BREAK INUNDATION ZONE AND INCREMENTAL DAMAGE ANALYSIS AND MAPPING PROCEDURES
FACT SHEET MCGREGOR LAKE RESTORATION HABITAT PROJECT POOL 10, UPPER MISSISSIPPI RIVER, WISCONSIN ENVIRONMENTAL MANAGEMENT PROGRAM
 FACT SHEET MCGREGOR LAKE RESTORATION HABITAT PROJECT POOL 10, UPPER MISSISSIPPI RIVER, WISCONSIN ENVIRONMENTAL MANAGEMENT PROGRAM LOCATION McGregor Lake is located within a mid-river island in Pool 10
APPENDIX A STRUCTURE DESCRIPTIONS AND RATING CURVES
 3 4 5 6 7 8 9 0 3 APPENDIX A STRUCTURE DESCRIPTIONS AND RATING CURVES Kissimmee River Vol December 005 Version Draft 4 3 4 5 6 7 8 9 0 3 4 5 6 7 8 9 0 3 4 5 6 7 8 9 30 3 3 33 34 35 36 37 38 39 40 4 4 43
Total Suspended Solids, Stable Flow, and Wet Weather Event Monitoring in the Unnamed Tributary to the Grand River Watershed.
 Total Suspended Solids, Stable Flow, and Wet Weather Event Monitoring in the Unnamed Tributary to the Grand River Watershed December 2004 The Cadmus Group, Inc. Grand Valley State University Annis Water
Eastern Brook Trout Joint Venture Annual Report The Nature Conservancy 2013
 Eastern Brook Trout Joint Venture Annual Report The Nature Conservancy 2013 2013 Annual Performance Report Enhancing Connectivity in the Ash-Black Rock Sub-basin of the West Branch Narraguagus River. Project
Appendix G Whitewater Recreation Flow Study Plan
 Appendix G Whitewater Recreation Flow Study Plan Study Plan Whitewater Recreation Flow Study Grandfather Falls Hydroelectric Project FERC Project No. 1966 March 2013 An Integrys Energy Group Company Section
JadEco, LLC PO BOX 445 Shannon, IL 61078
 Introduction: With the assistance of Lake Holiday staff and volunteers, we were able to conduct an AC electrofishing survey on May 8, 27. Water temperatures were 2.3 C (8.5 F) and water clarity was decent
STREAM SURVEY File form No..
 scanned for KRIS THE RESOURCES AGENCY OF CALIFORNIA California Department of Fish and Game STREAM SURVEY File form No.. Date: September 4, 1969. NAME: North Fork Schooner Gulch Creek COUNTY: Mendocino.
Discussion on the Selection of the Recommended Fish Passage Design Discharge
 Discussion on the Selection of the Recommended Fish Passage Design Discharge Introduction The provision of fish passage is a requirement for most proposed culvert and bridge installations in Alberta, depending
Ermenek Dam and HEPP: Spillway Test & 3D Numeric-Hydraulic Analysis of Jet Collision
 Ermenek Dam and HEPP: Spillway Test & 3D Numeric-Hydraulic Analysis of Jet Collision J.Linortner & R.Faber Pöyry Energy GmbH, Turkey-Austria E.Üzücek & T.Dinçergök General Directorate of State Hydraulic
STRUCTURE S-65 PURPOSE SPILLWAY OPERATION
 STRUCTURE S-65 This structure is a reinforced concrete, gated spillway with discharge controlled by three cable operated, vertical lift gates, and a reinforced concrete lock structure with two pairs of
WASHINGTON CONSERVATION DISTRICT STANDARD OPERATING PROCEDURE (S.O.P.)
") Page 1 of 18 Water Monitoring Program WASHINGTON CONSERVATION DISTRICT STANDARD OPERATING PROCEDURE (S.O.P.) No. 1 FLOW MONITORING Page 2 of 18 Water Monitoring Program Standard Operating Procedure No.
Page 1 of 18 Water Monitoring Program WASHINGTON CONSERVATION DISTRICT STANDARD OPERATING PROCEDURE (S.O.P.) No. 1 FLOW MONITORING Page 2 of 18 Water Monitoring Program Standard Operating Procedure No.
BC Ministry of Forests. March Fish Stream Crossing Guidebook. Forest Practices Code of British Columbia.
 FRST 557 Lecture 7c Bridges and Culverts: Water Velocity and Discharge Lesson Background and Overview: The previous two lessons presented methods for estimating water volume flow at a particular site and
Big Spring Creek Habitat Enhancement and Fishery Management Plans
 Big Spring Creek Habitat Enhancement and Fishery Management Plans November 5, 2012 Big Spring Events and Activities Center Newville, PA Charlie McGarrell Regional Habitat Biologist Pennsylvania Fish and
Ellis Y. Byeon, PE Bryan VanderGheynst, PE 1
 Ellis Y. Byeon, PE Bryan VanderGheynst, PE 1 Background Information: City of Trenton, Mercer County Assunpink Creek, Pond Run and Delaware River Lower 2.5 miles of the Assunpink Creek Lower 0.6 miles of
Annex E Bridge Pier Protection Plan
 Annex E Bridge Pier Protection Plan Table E1 Bridge Types and Locations Table E2 Flow Conditions For River Sections Figure E1 Bridge Abutment Protection Figure E2 Bridge Pier Protection Figure E3 Central
NEED FOR SUPPLEMENTAL BATHYMETRIC SURVEY DATA COLLECTION
 305 West Grand Avenue, Suite 300 Montvale, New Jersey 07645 Phone 201.930.9890 Fax 201.930.9805 www.anchorqea.com M EMORANDUM To: Caroline Kwan and Nica Klaber U.S. Environmental Protection Agency Region
Washington State Fish Passage Barrier Removal Projects. Casey Kramer, PE WSDOT State Hydraulics Engineer
 Washington State Fish Passage Barrier Removal Projects Casey Kramer, PE WSDOT State Hydraulics Engineer 2014 National Hydraulic Engineering Conference Iowa City, IA August 20 th, 2014 WSDOT Fish Passage
Evaluation of June 9, 2014 Federal Emergency Management Agency Flood Insurance Study for Town of Weymouth, Norfolk, Co, MA
 Evaluation of June 9, 2014 Federal Emergency Management Agency Flood Insurance Study for Town of Weymouth, Norfolk, Co, MA Prepared For: Woodard & Curran 95 Cedar Street, Suite 100 Providence, RI 02903
HISTORY OF CONSTRUCTION
 HISTORY OF CONSTRUCTION CFR 257.73(c)(1) West Boiler Slag Pond Clifty Creek Plant Madison, Indiana October, 2016 Prepared for: Indiana Kentucky Electric Corporation Prepared by: American Electric Power
Assateague Island National Seashore North End Restoration Project Timeline
 Assateague Island National Seashore North End Restoration Project Timeline Date Event Some information provided in the Project Introduction document. Detailed events are available in a timeline compiled
Information for File # SEW
 Information for File #2014-02744-SEW Applicant: Minnesota Department of Transportation (MnDOT), District 3; c/o Mr. Robert Nibbe Corps Contact: Sarah Wingert, U.S. Army Corps of Engineers, 180 5 th Street
Cumberland River Flood Preparedness Mapping and Products
 Cumberland River Flood Preparedness Mapping and Products Barry P. Moran, P.E. Hydraulic Engineer Nashville District September 2013 US Army Corps of Engineers BUILDING STRONG Authority: As a result of the
SOUTH CAROLINA ELECTRIC & GAS COMPANY COLUMBIA, SOUTH CAROLINA
 SOUTH CAROLINA ELECTRIC & GAS COMPANY COLUMBIA, SOUTH CAROLINA SALUDA HYDROELECTRIC PROJECT FERC NO. 516 DOWNSTREAM TEMPERATURE STUDY DRAFT REPORT MAY 28 Prepared by: SOUTH CAROLINA ELECTRIC & GAS COMPANY
Quantifying Performance of Stream Simulation Culverts in the Chehalis Basin, WA
 Quantifying Performance of Stream Simulation Culverts in the Chehalis Basin, WA AUTHORS: Joe Richards, Environmental Science Associates Jane Atha, Washington Department of Fish & Wildlife Colin Thorne,
HURRICANE SANDY LIMITED REEVALUATION REPORT UNION BEACH, NEW JERSEY DRAFT ENGINEERING APPENDIX SUB APPENDIX D SBEACH MODELING
 HURRICANE SANDY LIMITED REEVALUATION REPORT UNION BEACH, NEW JERSEY DRAFT ENGINEERING APPENDIX SUB APPENDIX D SBEACH MODELING Rev. 18 Feb 2015 1 SBEACH Modeling 1.0 Introduction Following the methodology
Pre-Application Document Kaweah Project (FERC Project No. 298)
") TABLE OF CONTENTS Page 3.12 Aesthetic Resources... 3.12-1 3.12.1 Information Sources... 3.12-1 3.12.2 Setting... 3.12-1 3.12.3 Project Facilities... 3.12-2 3.12.4 Previous Visual Resources Assessment...
TABLE OF CONTENTS Page 3.12 Aesthetic Resources... 3.12-1 3.12.1 Information Sources... 3.12-1 3.12.2 Setting... 3.12-1 3.12.3 Project Facilities... 3.12-2 3.12.4 Previous Visual Resources Assessment...
Impact of Dredging the Lower Narrow River on Circulation and Flushing
 Impact of Dredging the Lower Narrow River on Circulation and Flushing Craig Swanson Ph.D. Swanson Environmental Alex Shaw Ocean Engineering, URI Prof. Malcolm L. Spaulding Ocean Engineering, URI 29 January
JAP Additional Information Sheet
 JAP Additional Information Sheet Block 15: Purpose and Need The USACE purpose of the project is to provide a safe and reliable whitewater park for the recreational public in a city park, which will provide
Modeling of Long Culverts and Stormdrains A Comparison of Different Methods
 Modeling of Long Culverts and Stormdrains A Comparison of Different Methods Shrinivas Kaulgud, P.E., CFM Cheryl Hannan, P.E., CFM, LEED AP October 12, 2017 Presentation Outline Introduction Case Studies
Boothbay Harbor Rotary Club May 12, 2016
 Mapping Potential Sea Level Rise and Storm Surge in Boothbay Harbor, ME Boothbay Harbor Rotary Club May 12, 2016 Peter A. Slovinsky, Marine Geologist Maine Geological Survey S.M. Dickson, MGS Quickly,
CHAPTER 4 SPALDING COUNTY, GEORGIA 4.0 CULVERT DESIGN
 SPALDING COUNTY, GEORGIA CHAPTER 4 4.0 CULVERT DESIGN... 4-1 4.1 INTRODUCTION... 4-1 4.2 SYMBOLS AND DEFINITIONS... 4-1 4.3 ENGINEERING DESIGN CRITERIA... 4-2 4.3.1 FREQUENCY FLOOD... 4-2 4.3.2 VELOCITY
Hydraulic Modeling of Stream Enhancement Methods
 Hydraulic Modeling of Stream Enhancement Methods Matthew J. Curry John J. Levitsky Abstract Development within watersheds increases the amounts of runoff causing stream erosion and degradation of stream
SELBY CREEK SILVERADO TRAIL CULVERT FISH PASSAGE ASSESSMENT
 SELBY CREEK SILVERADO TRAIL CULVERT FISH PASSAGE ASSESSMENT NAPA COUNTY, CALIFORNIA PREPARED BY NAPA COUNTY RESOURCE CONSERVATION DISTRICT 1303 JEFFERSON ST. SUITE 500B NAPA, CALIFORNIA 94559 WWW.NAPARCD.ORG
Corte Madera Creek Flood Control Channel
 Corte Madera Creek Flood Control Channel Prepared for Friends of Corte Madera Creek Watershed Marin County Flood Control and Water Conservation District U.S. Army Corps of Engineers Prepared by Michael
Trout Unlimited Comments on the Scope of Environmental Impact Statement for the Constitution Pipeline Project, Docket No. PF12-9
 October 9, 2012 Kimberly D. Bose, Secretary Federal Energy Regulatory Commission 888 First Street, NE, Room 1A Washington, DC 20426 RE: Trout Unlimited Comments on the Scope of Environmental Impact Statement
Technical Brief - Wave Uprush Analysis Island Harbour Club, Gananoque, Ontario
 Technical Brief - Wave Uprush Analysis RIGGS ENGINEERING LTD. 1240 Commissioners Road West Suite 205 London, Ontario N6K 1C7 October 31, 2014 Table of Contents Section Page Table of Contents... i List
DRAFT. October 17, 2014 File No Mr. Brendhan Zubricki Town Administrator Essex Town Hall 30 Martin Street Essex, MA.
 GZA GeoEnvironmental, Inc. Engineers and Scientists October 17, 2014 File No. 18.0171857.00 Mr. Brendhan Zubricki Town Administrator Essex Town Hall 30 Martin Street Essex, MA. 01929 DRAFT Re: Essex River
Gamefish Assessment Report
 MINNESOTA DEPARTMENT OF NATURAL RESOURCES Gamefish Assessment Report Spring Gamefish Assessment on the Mississippi River from Little Falls to Brainerd, MN May 31 through June 4, 2013 River Miles 966 to
Red River Basin and FM Diversion Hydrology. North Dakota Water Education Foundation Executive Briefing July 13, 2012
 Red River Basin and FM Diversion Hydrology North Dakota Water Education Foundation Executive Briefing July 13, 2012 Red River Basin Total Drainage Area: 45,000 square miles North Dakota Fargo, ND Moorhead,
Packwood Hydroelectric Project Barrier Analysis December 12, 2006
 Packwood Hydroelectric Project Barrier Analysis December 12, 2006 Study Area Natural barriers to upstream fish passage on Lake Creek at RM 1.03 and RM 1.95 Snyder Creek culvert under the Project tailrace
SUBMERGED VENTURI FLUME. Tom Gill 1 Robert Einhellig 2 ABSTRACT
 SUBMERGED VENTURI FLUME Tom Gill 1 Robert Einhellig 2 ABSTRACT Improvement in canal operating efficiency begins with establishing the ability to measure flow at key points in the delivery system. The lack
Creek Trash Assessment (CTA) Methodology (Demonstration: Mill Run Creek, Cheltenham, Pa.)
 Methodology (Demonstration: Mill Run Creek, Cheltenham, Pa.)") Creek Trash Assessment (CTA) Methodology (Demonstration: Mill Run Creek, Cheltenham, Pa.) Mill Run Creek emerges from a storm sewer in Philadelphia to an open creek in Cheltenham. The Creek downstream
Creek Trash Assessment (CTA) Methodology (Demonstration: Mill Run Creek, Cheltenham, Pa.) Mill Run Creek emerges from a storm sewer in Philadelphia to an open creek in Cheltenham. The Creek downstream
1.Mill Creek Watershed Summary Description and Land Use
 1.Mill Creek Watershed Summary Description and Land Use Table xxx: Mill Creek Watershed Overview Watershed Size 31,435 acres/49.1 sq miles/ 127.1 sq km Elevation Range 5,594 feet [4,967-10,561] Stream
NUMERICAL AND PHYSICAL MODELING
 POINTE DU BOIS GENERATING STATION SPILLWAY REPLACEMENT PROJECT NUMERICAL AND PHYSICAL MODELING Kara Hurtig, Northwest Hydraulic Consultants, North Vancouver, BC, Canada David S. Brown, KGS Group, Winnipeg,
Indiana LTAP Road Scholar Core Course #10 Culvert Drainage. Presented by Thomas T. Burke, Jr., PhD, PE Christopher B. Burke Engineering, Ltd.
 Indiana LTAP Road Scholar Core Course #10 Culvert Drainage Presented by Thomas T. Burke, Jr., PhD, PE Christopher B. Burke Engineering, Ltd. Objectives Review culvert shapes, end sections, and materials
Sediment Basin 7E-12. Design Manual Chapter 7 - Erosion and Sediment Control 7E - Design Information for ESC Measures BENEFITS.
 7E-12 Design Manual Chapter 7 - Erosion and Sediment Control 7E - Design Information for ESC Measures Sediment Basin BENEFITS Flow Control Erosion Control Sediment Control Runoff Reduction Flow Diversion
Yale Reservoir Kokanee (Oncorhynchus nerka) Escapement Report 2016
 Escapement Report 2016") Yale Reservoir Kokanee (Oncorhynchus nerka) Escapement Report 2016 North Fork Lewis River Hydroelectric Project Yale FERC No. 2071 Prepared by: Jeremiah Doyle, PacifiCorp April 4, 2017 1.0 INTRODUCTION
Yale Reservoir Kokanee (Oncorhynchus nerka) Escapement Report 2016 North Fork Lewis River Hydroelectric Project Yale FERC No. 2071 Prepared by: Jeremiah Doyle, PacifiCorp April 4, 2017 1.0 INTRODUCTION
Utilizing Vessel Based Mobile LiDAR & Bathymetry Survey Techniques for Survey of Four Southern California Breakwaters
 Utilizing Vessel Based Mobile LiDAR & Bathymetry Survey Techniques for Survey of Four Southern California Breakwaters Western Dredging Association: Pacific Chapter September 2012 Insert: Pipe Location
Outline. 1. Overview 2. Population 3. Flooding 4. Land Use 5. References. Overview
 Outline 1. Overview 2. Population 3. Flooding 4. Land Use 5. References Overview The two main rivers in the Cannon River watershed are the Cannon and Straight Rivers. The Cannon River originates in Shields
The Hydraulic Design of an Arced Labyrinth Weir at Isabella Dam
 Utah State University DigitalCommons@USU International Symposium on Hydraulic Structures Jun 28th, 1:30 PM The Hydraulic Design of an Arced Labyrinth Weir at Isabella Dam E. A. Thompson Sacramento District
USING A LABYRINTH WEIR TO INCREASE HYDRAULIC CAPACITY. Dustin Mortensen, P.E. 1 Jake Eckersley, P.E. 1
 USING A LABYRINTH WEIR TO INCREASE HYDRAULIC CAPACITY Dustin Mortensen, P.E. 1 Jake Eckersley, P.E. 1 Plum Creek Floodwater Retarding Structure No. 6 is located in an area of Kyle, Texas, that is currently
Massachusetts Stream Crossing Case Studies
 Massachusetts Stream Crossing Case Studies Amy Singler Associate Director, River Restoration Program Carrie Banks River Continuity Coordinator Case Studies: Public Benefits: Movement of goods and people
COST EFFECTIVE STORAGE CAPACITY INCREASE FOR ALUMINA TAILINGS DISPOSAL AREA THROUGH SPILLWAY OPTIMISATION
 COST EFFECTIVE STORAGE CAPACITY INCREASE FOR ALUMINA TAILINGS DISPOSAL AREA THROUGH SPILLWAY OPTIMISATION Abstract Lonie I * Tailings and Dams, GHD Brisbane, QLD, Australia Queensland Alumina Limited operates
Temperature Profiling Within the Trout Creek Sub-Watershed 2013 Prepared by the Kennebecasis Watershed Restoration Committee January 2014
 Temperature Profiling Within the Trout Creek Sub-Watershed 2013 Prepared by the Kennebecasis Watershed Restoration Committee January 2014 A partnership project between the KWRC and Agriculture and Agri-Foods
3.0 Basin and Watershed Characteristics
 3.0 Basin and Watershed Characteristics 3.1 Basin Characteristics 3.1.1 Crystal Lake Crystal Lake, located in the cities of Burnsville and Lakeville (Dakota County), covers an area of approximately 292
CORPS FACTS. Harbor Dredging U.S. ARMY CORPS OF ENGINEERS BUILDING STRONG
 CORPS FACTS Harbor Dredging U.S. ARMY CORPS OF ENGINEERS BUILDING STRONG Disaster Response Sedimentation in the channel is caused by the normal cycle of silt movement, erosion from high water or heavy
Figure 4, Photo mosaic taken on February 14 about an hour before sunset near low tide.
 The Impact on Great South Bay of the Breach at Old Inlet Charles N. Flagg and Roger Flood School of Marine and Atmospheric Sciences, Stony Brook University Since the last report was issued on January 31
INTERNATIONAL JOURNAL OF CIVIL AND STRUCTURAL ENGINEERING Volume 5, No 2, 2014
 INTERNATIONAL JOURNAL OF CIVIL AND STRUCTURAL ENGINEERING Volume 5, No 2, 2014 Copyright by the authors - Licensee IPA- Under Creative Commons license 3.0 Research article ISSN 0976 4399 Modification of
APPENDIX B HYDRAULIC DESIGN DATA FOR CULVERTS
 TM 5-820-4/AFM 88-5, Chap 4 APPENDIX B HYDRAULIC DESIGN DATA FOR CULVERTS B-1. General. a. This appendix presents diagrams, charts, coefficients and related information useful in design of culverts. The
Minnesota Department of Natural Resources Division of Fish and Wildlife Section of Fisheries. Stream Survey Report. Cold Spring Creek.
 Minnesota F-29-R(P)-24 Area 315 Study 3 March 2015 Minnesota Department of Natural Resources Division of Fish and Wildlife Section of Fisheries Stream Survey Report Cold Spring Creek 2014 Mark Pelham Montrose
Sontek RiverSurveyor Test Plan Prepared by David S. Mueller, OSW February 20, 2004
 Sontek RiverSurveyor Test Plan Prepared by David S. Mueller, OSW February 20, 2004 INTRODUCTION Sontek/YSI has introduced new firmware and software for their RiverSurveyor product line. Firmware changes
HEC 26 Aquatic Organism Passage Design Manual Evolution & Application
 HEC 26 Aquatic Organism Passage Design Manual Evolution & Application Sven Leon, P.E., Hydraulics Engineer Federal Highway Administration 2015 Alaska Fish Passage Meeting October 13 14, 2015 VTRC, Juneau,
STRUCTURAL STABILITY ASSESSMENT
 STRUCTURAL STABILITY ASSESSMENT CFR 257.73(d) Fly Ash Reservoir II Cardinal Plant Brilliant, Ohio October, 2016 Prepared for: Cardinal Operating Company Cardinal Plant Brilliant, Ohio Prepared by: Geotechnical
INTERNATIONAL HYDROGRAPHIC SURVEY STANDARDS
 INTERNATIONAL HYDROGRAPHIC SURVEY STANDARDS by Gerald B. MILLS 1 I. Background The International Hydrographic Organization (IHO) traces its origin to the establishment of the International Hydrographic
Skagit River Historical Flood Elevations and Peak Flow Estimates
 Skagit River Historical Flood Elevations and Peak Flow Estimates to be presented at Skagit River GI H&H Technical Workshop Wednesday, June 17, 2009 Background Corps of Engineers began a General Investigation
Little Spokane River Stream Gage Report: Deadman Creek, Dragoon Creek, and the West Branch of the Little Spokane River
 Little Spokane River Stream Gage Report: Deadman Creek, Dragoon Creek, and the West Branch of the Little Spokane River June 2010 Spokane County Conservation District N. 210 Havana St. Spokane, WA 99202
ATTACHMENT F. Minnesota Department of Natural Resources. Marsh Lake Ecosystem Restoration Project
 ATTACHMENT F Minnesota Department of Natural Resources Marsh Lake Ecosystem Restoration Project Mussel Rescue and Translocation Plan for Pomme de Terre River Restoration (Prepared June, 2016) Attachment
Large-scale Field Test
 Vaskinn 1 Large-scale Field Test Kjetil Arne Vaskinn kav@trh.statkraftgroner.no Statkraft Grøner AS SUMMARY The objective the controlled failure of large-scale embankment is to monitor and record the failure
Evaluating Surge Potential in CSO Tunnels
 14 Evaluating Surge Potential in CSO Tunnels Karen E. Ridgway Tunnels are being proposed to control combined sewer overflow (CSO) in numerous cities in the United States and Canada. The tunnels are intended
LAKE TANEYCOMO 2011 ANNUAL LAKE REPORT
 LAKE TANEYCOMO 211 ANNUAL LAKE REPORT Shane Bush Fisheries Management Biologist Missouri Department of Conservation Southwest Region March 1, 212 EXECUTIVE SUMMARY Lake Taneycomo was formed by the construction
CHAPTER 5 CULVERT DESIGN
 CHAPTER 5 CULVERT DESIGN HYDRAULICS OF CULVERTS There are two major types of culvert flow: 1) flow with inlet control, and 2) flow with outlet control. For each type, different factors and formulas are
TOP:001.3 U.S. Fish and Wildlife Service TECHNICAL OPERATING PROCEDURE
 TOP:001.3 March 12, 2015 U.S. Fish and Wildlife Service Marquette Biological Station 3090 Wright Street Marquette, Michigan 49855 U.S.A. and U.S. Fish and Wildlife Service Ludington Biological Station
Water Resources Report RKLD Annual Meeting July 30, 2016
 Water Resources Report RKLD Annual Meeting 2016 July 30, 2016 Topics Hydrology Report Indianford Dam trash rack cleanout performance Experimental Project update Review of PAS project Twin floods- 1 to
HYDROGRAPHIC SURVEY OF DAVE BOYER (WALTERS) LAKE
 LAKE") HYDROGRAPHIC SURVEY OF DAVE BOYER (WALTERS) LAKE Prepared by: Oklahoma Water Resources Board December 20, 2005 TABLE OF CONTENTS TABLE OF CONTENTS... 2 TABLE OF FIGURES... 3 TABLE OF TABLES... 3 INTRODUCTION...
HYDROGRAPHIC SURVEY OF DAVE BOYER (WALTERS) LAKE Prepared by: Oklahoma Water Resources Board December 20, 2005 TABLE OF CONTENTS TABLE OF CONTENTS... 2 TABLE OF FIGURES... 3 TABLE OF TABLES... 3 INTRODUCTION...
Illinois State Water Survey
 Illinois State Water Survey HYDROLOGY DIVISION SWS Contract Report 508 COMPARISON OF 1987 AND 1989 BED PROFILE SURVEYS OF THE LOWER CACHE RIVER by Richard Allgire Office of Sediment and Wetland Studies
Columbia Lake Dam Removal Project
 Columbia Lake Dam Removal Project The Columbia Lake dam located 1/4 mile upstream of the Paulins Kill River's confluence with the Delaware River in Knowlton Township, Warren County has been proposed for
Chadbourne Dam Repair and Fish Barrier
 Chadbourne Dam Repair and Fish Barrier Final Report for the Western Native Trout Initiative Prepared by: Carol Endicott Yellowstone Cutthroat Trout Conservation Biologist Montana Fish, Wildlife & Parks
Figure 1 Example feature overview.
 1. Introduction This case focuses on the northeastern region of Onslow Bay, NC, and includes an initial shoreline, regional contour, wave gauges, inlets, dredging, and beach fills. Most of the features
Emergent Sandbar Habitat Program Middle Missouri River
 Emergent Sandbar Habitat Program Middle Missouri River Jeremiah Szynskie, P.E. Hydrologic Engineering Branch Introduction Main Stem System Dam Closures Fort Peck 1937 Fort Randall 1952 Garrison - 1953
International Journal of Technical Research and Applications e-issn: , Volume 4, Issue 3 (May-June, 2016), PP.
, PP.") DESIGN AND ANALYSIS OF FEED CHECK VALVE AS CONTROL VALVE USING CFD SOFTWARE R.Nikhil M.Tech Student Industrial & Production Engineering National Institute of Engineering Mysuru, Karnataka, India -570008
DESIGN AND ANALYSIS OF FEED CHECK VALVE AS CONTROL VALVE USING CFD SOFTWARE R.Nikhil M.Tech Student Industrial & Production Engineering National Institute of Engineering Mysuru, Karnataka, India -570008