In the spring of 2006, national newspaper headlines screamed
|
|
|
- Bartholomew Anderson
- 5 years ago
- Views:
Transcription
1
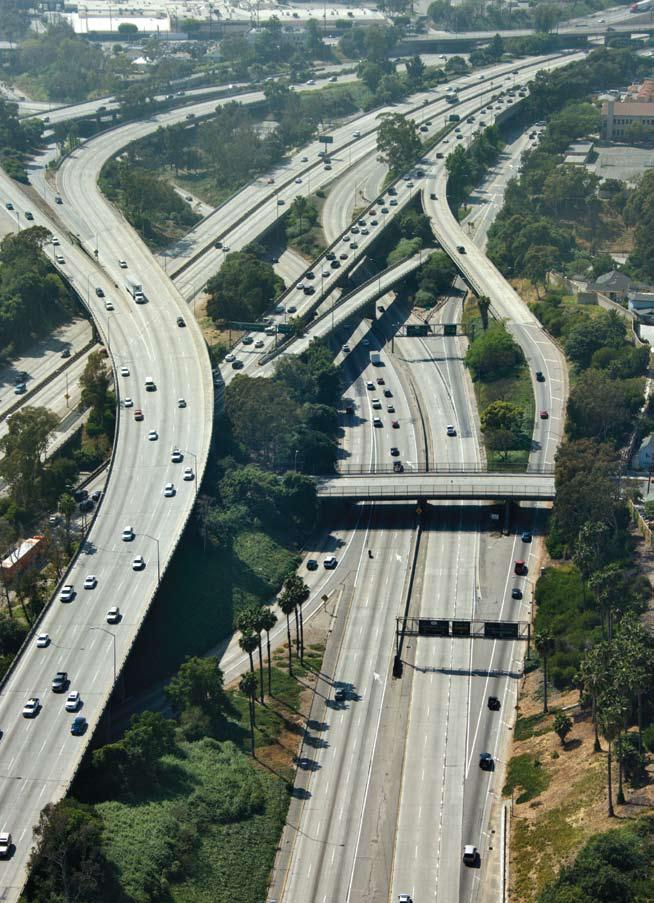
2 Toll vs. Nontoll: Toll Facilities Are Safer By Jeff Campbell In the spring of 2006, national newspaper headlines screamed that toll plazas were the most dangerous place on the highway. The articles were based on a National Transportation Safety Board (NTSB) study of a 2003 multivehicle accident in a toll plaza that underscored the apparent dangers of such facilities. In response to the headlines, naturally, many in the government and media contacted IBTTA as well as individual transportation agencies for a response. Unfortunately, at the time, we had no concrete statistics of our own to refute the NTSB s claims. Since then, however, we ve surveyed our members extensively about their operations, the results of which are maintained in the IBTTA Data Warehouse. The data show resoundingly that toll facilities in this country are as safe as or safer than their nontoll counterparts. The Goal of the Research The primary goal of our research (see Methodology) was to determine how fatality and accident rates on U.S. toll facilities compare with the same statistics for all U.S. roads, bridges, and tunnels. In addition, in studying the survey results we examined the effect of fatalities and accidents on various transportationrelated costs and analyzed several factors that might significantly affect fatality and accident rates. Connecting People, Places & Ideas 55
3 The primary goal of our research was to determine how fatality and accident rates on U.S. toll facilities compare with the same statistics for all U.S. roads, bridges, and tunnels. The variables we analyzed that could affect fatality or accident rates include: Types of toll configurations, including: n Mainline barriers (main exits and entrances), n Barriers at interchanges, and n Open road tolling (ORT) segments. Types of managed lanes used: n Electronic toll collection (ETC) only lanes, n ORT lanes, n High occupancy toll (HOT) lanes, n High occupancy vehicle (HOV) lanes, n Reversible or zipper lanes, and n Slip ramps. Traffic management information services used: n Message signs, n Highway advisory radio, n Dedicated broadcasts, and n Traffic operations centers. Annual budgets for the following: n Operations, n Capital improvements, n Maintenance, and n Marketing. We also considered the number of years since a facility had undergone a major renovation (or since the facility had opened if no major renovations had been done). Additionally, we hypothesized that high fatality and accident rates would have an impact on the following costs: n Emergency roadside assistance (mechanical), n Emergency roadside assistance (medical), n Fire, n Police, n Maintenance, and n Debris removal. Study Sample The study sample represents various toll entities throughout the United States. Table 1 presents the types of toll entities included in the study by three main categories: roads, bridges, and tunnels. The sample includes 39 toll-road facilities, 30 toll bridges, and 6 tunnels. Table 2 shows the number of toll entities examined by state. The sample includes toll entities from each of the 20 states that currently have toll facilities and is representative of U.S. toll facilities in general. 56 Tollways n Winter 2008
4 Table Table 2 Number of Toll Facilities Surveyed by State CA 2 IN 1 NH 1 PA 7 CO 2 KS 1 NJ 3 SC 2 DE 3 MA 1 NY 16 TX 4 FL 10 MD 2 OH 1 VA 5 IL 2 MI 1 OK 10 WV 1 Connecting People, Places & Ideas 57
5 Toll facilities in the United States have a much lower fatality rate than do U.S. roads overall and lower fatality rates than both urban and rural interstate highways. Measures Used The industry standard measure for fatality rates is fatalities per 100 million vehicle miles traveled, which is used by the U.S. Department of Transportation. Vehicle miles traveled is calculated by totaling the number of miles each vehicle travels. This measure allows us to compare a wide variety of toll entities regardless of their length or the number of vehicles they serve. In analyzing the data, we used a similar measure for accidents, calculating the number of accidents per 100 million vehicle miles traveled. As we went to press with this edition of Tollways, we were unable to locate a comparable number for all U.S. roads. One reason for this is that the industry definition of accident is not as clear as it is for fatalities, which are those traffic incidents in which one or more people are killed. Further investigation will be required to ensure that similar measures are used by all toll facilities. Nonetheless, we present below some interesting findings regarding accidents on U.S. roads. Study Results Overall safety. The primary question we were interested in examining in this study was how the accident and fatality rates of toll facilities compare with the overall national statistics (see Table 3). As Table 3 shows, toll facilities in the United States have a much lower fatality rate than do U.S. roads overall. A more appropriate comparison however, is with the fatality rates of interstate highways which have much lower fatality rates. Toll facilities in the United States have lower fatality rates than both urban and rural interstate highways. The Fatality Analysis Reporting System of the National Highway Traffic Safety Administration s National Center for Statistics and Analysis reports that in 2005 the overall road fatality rate for the United States was 1.47 fatalities per 100 million vehicle miles traveled. The fatality rates for urban and rural interstate highways in 2004 (the last year for which data was available) were.55 and 1.21 respectively. The fatality rate for toll facilities was slightly lower than the rate for urban interstate highways and significantly lower than the rate for rural interstates. Of the toll facilities, toll roads had the highest fatality rate, at 0.52 fatalities per 100 million vehicle miles traveled. The fatality rates for toll bridges and tunnels were significantly lower, at 0.27 and 0.14 fatalities, respectively. 58 Tollways n Winter 2008
6 We are uncertain why bridges and tunnels have lower fatality rates than toll roads, but one could surmise that a bridge or tunnel is a known obstacle that motorists are aware they are approaching before they reach it, whereas open-road accidents are likely to be spontaneous events and take place at higher speeds, leading to more fatalities. We also looked at the accident rates for toll facilities, although, as noted above, similar figures weren t available for U.S. roads as a whole (see Table 4). While toll roads have much higher fatality rates than bridges or tunnels, the opposite is true for accident rates: toll bridges and tunnels have significantly higher accident rates than toll roads. This may be the result of measurement differences. For example, it may be that accidents are more likely to be recorded for bridges and tunnels, where accidents are more likely to impede traffic. Predictors of accident and fatality rates. As part of our analysis, we examined several budget items to determine whether there was a correlation between budget amounts and the accident and fatality rates for facilities. We compared budget figures by dividing Table 3 Table Connecting People, Places & Ideas 59
7 the figures by the total vehicle miles traveled for each facility. For this part of the analysis, we analyzed roads, bridges, and tunnels separately and calculated Pearson s product-moment correlation coefficients for both fatality and accident rates. Pearson's correlation reflects the degree of linear relationship between two variables. It ranges from +1 to -1. A correlation of +1 means that there is a perfect positive linear relationship between variables. A correlation of -1 means that there is a perfect negative linear relationship between variables. A correlation of 0 means there is no linear relationship between the two variables. We also analyzed a number of variables using a Student s t-test. The t-test assesses whether the means of two groups differ statistically from each other. For example, does the average fatality rate of facilities with ETC differ from those without ETC? (See Table 6 for more on this question.) The following relationships had a significance level of.05 or lower, which means that there is less than a.05 probability that the relationship occurred by chance. Fatality rates on toll roads. Both the amount budgeted for capital improvement and the amount budgeted for debris removal positively correlated with fatality rates. That is, the higher the amount spent for capital improvement and debris removal, the higher the fatality rate. The amount of capital improvement had a correlation of 0.766, while the correlation for debris removal was These findings may reflect the disruption caused by ongoing construction and a problem with higher levels of debris on these roads. It may also indicate recognition on the part of their operators that the safety and performance of these facilities need improvement. Other factors related to fatality rates included whether the road utilized barriers at interchanges and whether the road had ETC-only lanes. Tables 5 and 6 illustrate the findings for these two groups. Three of the toll roads we analyzed lacked barriers at interchanges. These 3 had significantly higher fatality rates, five times the fatality rates of the 34 toll roads that had barriers at interchanges. This would make sense, as one could reasonably assume that the speed of travel on such open roads is higher than in traffic that is forced to slow down when encountering barriers at interchanges. Only 3 toll roads reported that they had no ETC-only lanes. These facilities had an average fatality rate that was much higher than that of the 35 facilities that reported having ETC-only lanes. It is difficult to explain this result without further investigating the specific facilities involved and their particular setups, but possible causes for the higher fatality rate could be an absence of 60 Tollways n Winter 2008
8 Table Table Table Connecting People, Places & Ideas 61
9 IBTTA s research shows that toll roads actually have a lower fatality rate than nontolled roads.this is true for even the safest type of roads, our interstate highways. dedicated lanes, severe space constraints, and short approaches to the toll plaza that give motorists little forewarning of a potential traffic backup ahead. Accident rates on toll roads. Accident rates correlated positively with the number of years since the facility last had a major renovation. If no major renovations had been done, the year the facility was opened was used instead. This relationship showed a moderate correlation, at Two facilities reported that they lacked a toll configuration that included mainline barriers. These two facilities had significantly higher accident rates than those facilities with mainline barriers. Again, as with interchanges, one could reasonably assume that barriers may help prevent accidents by reducing overall speeds. Toll bridge fatalities. The amount spent for emergency mechanical assistance and fire on toll bridges correlated positively with fatality rates (0.721 and 0.725, respectively). This is most likely due to the costs associated with clearing serious accidents. Toll bridge accidents. The most significant finding regarding accidents on toll bridges is a negative correlation between the percentage of ETC users during peak operating times and accidents. In other words, with respect to toll bridge facilities, as the percentage of ETC users during peak operating times goes up, accident rates go down. Toll tunnels. The only significant relationship we found relating to tunnels was a strong positive correlation between the amount budgeted for capital improvement and fatality rates. This could be due to an increase in construction work leading to more fatal accidents. Study Conclusions Toll facilities are safer than nontoll facilities. Toll entities in the United States have lower fatality rates than nontoll entities. There may be a number of reasons for this. For example, it may be that toll facilities are in better condition as a whole than other roads. Fatality rates may also be lower on toll facilities because of faster accident response and clearance times. At this point, however, these are only hypotheses and should be examined further in future analyses. Some toll facilities are safer than others. Our analysis revealed that toll facilities can vary in their degree of safety based on certain features. For example, as noted above, there appears 62 Tollways n Winter 2008
10 to be a significant relationship between the use of ETC and ETC-only lanes and fatality rates indicating that the presence of ETC has a positive effect on the overall safety of a toll facility. We also detected a relationship between fatality rates and the amount a facility has budgeted for capital improvements. This may indicate a need for additional safety measures during periods of construction. Finally, as described above, the use of barrier toll systems at interchanges seems to yield lower fatality rates compared with facilities that lack such systems. Accidents are costly. Fatalities and accidents have a clear impact on overall costs for a toll facility. The areas that were most significant are debris removal, emergency mechanical assistance, and fire, all of which are associated with serious accidents. True Value In contrast to the 2003 news reports suggesting that toll roads are dangerous, IBTTA s research shows that toll roads actually have a lower fatality rate than nontolled roads. This is true for even the safest type of roads, our interstate highways. Our research also contradicts previous findings that the introduction of ETC-only lanes has a negative or no impact on accidents and fatalities. In fact, facilities with ETC-only lanes have much lower accident and fatality rates than do facilities that lack such lanes. Some have also hypothesized that toll facilities are more dangerous than their nontolled counterparts because vehicles have to slow down and stop at them. In some situations, on the contrary, this appears to have a positive effect on accident and fatality rates. Indeed, our research shows that barrier systems at both mainline entrances and interchanges tend to reduce the number of accidents and fatalities. This underscores the potential benefits of forcing traffic to slow down or stop before merging with other traffic. We will continue to maintain and update the IBTTA Data Warehouse, which has proven to be a valuable resource in illustrating the safety of U.S. toll facilities for all who use them. Methodology The data for this analysis come from IBTTA s Data Warehouse, which contains the most complete compilation of statistics available about the toll industry. Its information includes data gathered during IBTTA s 2006 Toll Information Survey, conducted from January through April During the survey, we collected data through online and printed surveys, telephone inquiries, and annual reports. Jeff Campbell is manager of information and research at IBTTA. He may be reached at jcampbell@ibtta.org. Connecting People, Places & Ideas 63


11
Iragavarapu, Khazraee, Lord, Fitzpatrick PEDESTRIAN FATAL CRASHES ON FREEWAYS IN TEXAS
 Iragavarapu, Khazraee, Lord, Fitzpatrick PEDESTRIAN FATAL CRASHES ON FREEWAYS IN TEXAS By Vichika Iragavarapu, P.E. (Corresponding author) Assistant Research Engineer Texas A&M Transportation Institute,
HSIS. Association of Selected Intersection Factors With Red-Light-Running Crashes. State Databases Used SUMMARY REPORT
 HSIS HIGHWAY SAFETY INFORMATION SYSTEM The Highway Safety Information Systems (HSIS) is a multi-state safety data base that contains accident, roadway inventory, and traffic volume data for a select group
Chapter 4 Traffic Analysis
 Chapter 4 Traffic Analysis PURPOSE The traffic analysis component of the K-68 Corridor Management Plan incorporates information on the existing transportation network, such as traffic volumes and intersection
Technology and the Changing Face of Tollways
 Technology and the Changing Face of Tollways Harris County Toll Road Authority Lisa Castañeda, PE, Assistant Director ITS Texas 2009 November 12, 2009 Topics Growth and Evolution of Tollways in Houston
Beginning School Bus Driver Curriculum UNIT IX. FIELD TRIPS and TRAFFIC CONTROL DEVICES. Revised 09/2011 Revised 10/2013 (Instructional Content)
") Beginning School Bus Driver Curriculum UNIT IX FIELD TRIPS and TRAFFIC CONTROL DEVICES Revised 09/2011 Revised 10/2013 (Instructional Content) Unit IX FIELD TRIPS AND TRAFFIC CONTROL DEVICES TABLE OF CONTENTS
Beginning School Bus Driver Curriculum UNIT IX FIELD TRIPS and TRAFFIC CONTROL DEVICES Revised 09/2011 Revised 10/2013 (Instructional Content) Unit IX FIELD TRIPS AND TRAFFIC CONTROL DEVICES TABLE OF CONTENTS
Session 1 23 CFR 772: Type I Project Definitions
 Session 1 23 CFR 772: Type I Project Definitions Facilitator: Carole Newvine, Oregon DOT Participants: Carole Newvine, Oregon DOT Mariano Berrios, Florida DOT Tom Hanf, Michigan DOT Greg Smith, North Carolina
SUMMARY MEMBERSHIP ANALYSIS FOR THE STATE OF. Trends of first-time 4 to 8 year-old male ice hockey players to
 SUMMARY MEMBERSHIP ANALYSIS FOR THE STATE OF New Mexico Trends of first-time 4 to 8 year-old male ice hockey players 1997-98 to 27-8 p.2 -Background and Methodology p.3 -National Acquisition and Retention
Purdue Road Show IN-TIME Executive Session March 8, 2016
 Purdue Road Show IN-TIME Executive Session March 8, 2016 Sources of Congestion Traffic Congestion and Reliability. FHWA (September 2005) Traffic Congestion and Reliability. FHWA (September 2005) 2 Secondary
CHAPTER 2G. PREFERENTIAL AND MANAGED LANE SIGNS
 2011 Edition - Revision 2 Page 275 Section 2G.01 Scope CHAPTER 2G. PREFERENTIAL AND MANAGED LANE SIGNS 01 Preferential lanes are lanes designated for special traffic uses such as high-occupancy vehicles
Sketch Level Assessment. of Traffic Issues. for the Fluor Daniel I-495 HOT Lane Proposal. Ronald F. Kirby
 Sketch Level Assessment of Traffic Issues for the Fluor Daniel I-495 HOT Lane Proposal Ronald F. Kirby Director of Transportation Planning National Capital Region Transportation Planning Board (TPB) Metropolitan
PLACEMENT OF SIGNS RECOMMENDED PRACTICES SUB-SECTION
 Page 1 of 6 RECOMMENDED PRACTICES PART SECTION SUB-SECTION HIGHWAY SIGNS GENERAL General Proper positioning of signs is an important element in the overall control of traffic within a roadway network.
The I-85 Express Lanes Project NASCIO Recognition Award Nomination
 The I-85 Express Lanes Project 2012 NASCIO Recognition Award Nomination Submitting Agency: State Road and Tollway Authority Nomination Category: Information Communications Technology Contact: Malika Reed
Characteristics of. Entering & Exiting High Speed Considerations
 Mod 6 Characteristics of Expressways Entering & Exiting High Speed Considerations Characteristics of an Expressway Controlled access (limited entry and exit) High speed (up to 65 mph) Divided by a barrier
Idaho Driver Education and Training
 Idaho Driver Education and Training Strategies for Controlled Access Highways Part I M13-1 Introduction to Controlled Access Highways Plans for the Interstate System," began in the late 1930s The system
Subject: Use of Pull-off Areas in Work Zones Page: 1 of 13. Brief Description: Guidance for the use and placement of pull-off area in work zones.
 6 - G2 Subject: Use of Pull-off Areas in Work Zones Page: 1 of 13 MdMUTCD REF. NO. None Date Issued: 09/09 Effective Date: 09/09 Brief Description: Guidance for the use and placement of pull-off area in
17t h Ann u a l Re p o r t on th e ( ) POLICY STUDY
 POLICY STUDY") July 2008 17t h Ann u a l Re p o r t on th e Per f o r m a n c e of Stat e Hi g h w a y Sy s t e m s (1984 2006) By David T. Hartgen, Ph.D., P.E., and Ravi K. Karanam Project Director: Adrian T. Moore,
July 2008 17t h Ann u a l Re p o r t on th e Per f o r m a n c e of Stat e Hi g h w a y Sy s t e m s (1984 2006) By David T. Hartgen, Ph.D., P.E., and Ravi K. Karanam Project Director: Adrian T. Moore,
2009 URBAN MOBILITY REPORT: Six Congestion Reduction Strategies and Their. Effects on Mobility
 2009 URBAN MOBILITY REPORT: Six Congestion Reduction Strategies and Their Effects on Mobility David Schrank Associate Research Scientist and Tim Lomax Research Engineer Texas Transportation Institute The
Traffic Safety Facts. State Traffic Data Data. Overview
 Traffic Safety Facts 2015 Data June 2017 DOT HS 812 412 State Traffic Data Key Findings Traffic fatalities increased by 7 percent from 2014 to 2015 (32,744 to 35,092) for the United States. The fatality
FYG Backing for Work Zone Signs
 Report Title Report Date: 2001 FYG Backing for Work Zone Signs Principle Investigator Name Kamyab, Ali Affiliation Western Transportation Institute Address c/o Caltrans, 1227 O Street, 5th Floor Sacramento,
Access Management Regulations and Standards
 Access Management Regulations and Standards January 2014 Efficient highway operation Reasonable property access Concept of Access Management The way to manage access to land development while preserving
Speed Control & Limits
 Speed Control & Limits Exceeding the speed limit is a common contributing factor of fatal and other types of accidents. *25 mph* School zones, business or residential districts *55 mph* Certain state highways
SUMMARY MEMBERSHIP ANALYSIS FOR THE STATE OF. Trends of first-time 4 to 8 year-old male ice hockey players to
 SUMMARY MEMBERSHIP ANALYSIS FOR THE STATE OF New York Trends of first-time 4 to 8 year-old male ice hockey players 1997-98 to 27-8 p.2 -Background and Methodology p.3 -National Acquisition and Retention
Bicycle - Motor Vehicle Collisions on Controlled Access Highways in Arizona
 Bicycle - Motor Vehicle Collisions on Controlled Access Highways in Arizona Analysis from January 1, 1991 to June 30, 2002 Richard C. Moeur, PE Traffic Design Manager, Northern Region Michelle N. Bina
Safety Features of Expressways. Cresencio M. MONTALBO Jr., PhD Assoc. Prof., SURP Faculty Affiliate, NCTS University of the Philippines
 Safety Features of Expressways Cresencio M. MONTALBO Jr., PhD Assoc. Prof., SURP Faculty Affiliate, NCTS University of the Philippines Outline of Presentation Profile of Philippine Expressways Characteristics
Corridor Studies. LA 415 and LA 73
 Corridor Studies LA 415 and LA 73 Project Approach for Both Corridors 1. Data Collection 2. Data Summary 3. Traffic Analysis 4. Micro-Simulation modeling 5. Generation of alternatives 6. Modeling alternatives
SUMMARY MEMBERSHIP ANALYSIS FOR THE STATE OF. Trends of first-time 4 to 8 year-old male ice hockey players to
 SUMMARY MEMBERSHIP ANALYSIS FOR THE STATE OF Rhode Island Trends of first-time 4 to 8 year-old male ice hockey players 1997-98 to 27-8 p.2 -Background and Methodology p.3 -National Acquisition and Retention
Module 5: Navigating Roadways
 Module 5: Navigating Roadways Topic 1: Intersections 1. One out of FATAL crashes occur at intersections. 2. Label the intersection warning signs: 3. When possible, begin searching seconds ahead of the
MOVEABLE BARRIER. Congestion Management Solutions
 MOVEABLE BARRIER Congestion Management Solutions 1 Portland area morning congestion (AM) 2 Portland area afternoon congestion (PM) 3 30 year planning - Portland Area 100% Growth over 30 years 4 Movable
Northern Virginia Express Lanes Design Challenges and Solutions. IBTTA Maintenance and Roadway Operations Workshop June 25, 2018
 Northern Virginia Express Lanes Design Challenges and Solutions IBTTA Maintenance and Roadway Operations Workshop June 25, 2018 Virginia Express Lanes Overview 60 miles of managed lanes (4 projects) Long
SUMMARY MEMBERSHIP ANALYSIS FOR THE STATE OF. New Hampshire. Trends of first-time 4 to 8 year-old male ice hockey players to
 SUMMARY MEMBERSHIP ANALYSIS FOR THE STATE OF New Hampshire Trends of first-time 4 to 8 year-old male ice hockey players 1997-98 to 27-8 p.2 -Background and Methodology p.3 -National Acquisition and Retention
Signs. signs, signals and road markings. in this chapter
 3 signs, signals and road markings in this chapter Signs regulatory signs school, playground and crosswalk signs lane use signs turn control signs parking signs reserved lane signs warning signs object
Access Location, Spacing, Turn Lanes, and Medians
 Design Manual Chapter 5 - Roadway Design 5L - Access Management 5L-3 Access Location, Spacing, Turn Lanes, and Medians This section addresses access location, spacing, turn lane and median needs, including
WHAT IFS: Over the course of
 WHAT IFS: Over the course of the 422plus Project certain questions have arisen multiple times at meetings, briefings and on-line at the website. Most of these questions start with WHAT IF. WHAT IF vehicle
CHAPTER 3 SIGNS, SIGNALS AND PAVEMENT MARKINGS. Responsible Driving (Red book) NOTES & STUDY GUIDE
 NOTES & STUDY GUIDE") CHAPTER 3 SIGNS, SIGNALS AND PAVEMENT MARKINGS Responsible Driving (Red book) NOTES & STUDY GUIDE Regulatory Signs Warning Signs International Signs Guide Signs Types of Road Signs Sub category (construction
CHAPTER 3 SIGNS, SIGNALS AND PAVEMENT MARKINGS Responsible Driving (Red book) NOTES & STUDY GUIDE Regulatory Signs Warning Signs International Signs Guide Signs Types of Road Signs Sub category (construction
Ch Driving on Expressways. Characteristics of Expressway Driving. Expressway. Types of Expressways. Why do they have fewer collisions?
 Ch 11 Driving on Expressways 11.1 Characteristics of Expressway Driving Expressway Is a limited-access or controlled-access highway. Types of Expressways Interstate highways Freeways Parkways * Most of
ICBC Driving Habits DRIVING HABITS AND BEHAVIOURS
 ICBC Driving Habits Methodology: Results are based on an online study conducted from February 20 to February 28, 2017, among 1,126 drivers in British Columbia aged 21 and over. The data has been statistically
ATTACHMENT NO. 18 GMI-C. National Committee on Uniform Traffic Control Devices GMI SIGNS TECHNICAL COMMITTEE RECOMMENDATION
 1 2 3 ATTACHMENT NO. 18 GMI-C 4 5 6 7 8 9 10 11 12 13 14 15 16 17 18 19 20 21 22 23 24 25 26 27 28 29 30 31 32 33 34 35 36 37 38 39 GMI agenda item II.H.2., January 19, 2012 National Committee on Uniform
THE FUTURE OF THE TxDOT ROADWAY DESIGN MANUAL
 THE FUTURE OF THE TXDOT ROADWAY DESIGN MANUAL Kenneth Mora, P.E. (Design Division) 10/10/2017 Table of contents 1 2 Reduction in FHWA design controlling criteria Innovative Intersection Guidance 3-7 8-42
Florida Department of Transportation District Six Project FM # Public Information Meeting Tuesday, July 24, 2018
 Florida Department of Transportation District Six Project FM #432687-1-52-01 Public Information Meeting Tuesday, July 24, 2018 South Florida Express Lanes Network The I-75/SR 826 Palmetto Express Lanes
FACT SHEET VirginiaDOT.org
 FACT SHEET VirginiaDOT.org Interstate 64 East Hampton Roads Bridge-Tunnel (HRBT) Paving Project Hampton/ Norfolk Contractor: Basic Construction (part of the I-64 paving project in Hampton) Contract Amount:
June 26 27, Gainesville, Florida
 June 26 27, 2018 Gainesville, Florida Welcome, Introductions + Agenda Chris Craig Introductions Name Agency/organization Number of years you ve worked in traffic safety Agenda DAY 1 DAY 2 Action Plan Group
Post impact trajectory of vehicles at rural intersections
 Post impact trajectory of vehicles at rural intersections Doecke SD., Woolley JE. and Mackenzie JR. Centre for Automotive Safety Research Abstract This report describes the path of vehicles after a collision
Access Management Regulations and Standards
 Access Management Regulations and Standards Efficient highway operation Reasonable property access Concept of Access Management The way to manage access to land development while simultaneously preserving
Toll Rate Public Hearing
 Toll Rate Public Hearing I-77 Express Toll Rate Hearing September 13, 2018 AGENDA AND HOUSEKEEPING Speaker Signup Bathrooms/Exits Facebook Live Introductions Thanks and Recognition 6:30-6:35 6:35-6:55
c. continue onto the expressway and use the next exit ramp.
 Chapter 11 - Practice Questions Multiple Choice Identify the letter of the choice that best completes the statement or answers the question. 1) The exit ramp you want to use is entirely blocked by traffic.
Attachment No. 17 GMI No. 1. National Committee on Uniform Traffic Control Devices GMI SIGNS TECHNICAL COMMITTEE RECOMMENDATION
 1 2 3 Attachment No. 17 GMI No. 1 4 5 6 7 8 9 10 11 12 13 14 15 16 17 18 19 20 21 22 23 24 25 26 27 28 29 30 31 32 33 34 35 36 37 GMI agenda item II.H.2., January 19, 2012 National Committee on Uniform
Section 3A.04 Colors. Section 3B.10 Approach Markings for Obstructions
 Section 3A.04 Colors Markings shall be yellow, white, red, or blue, or purple. The colors for markings shall conform to the standard highway colors. Black in conjunction with one of the above colors shall
Owl Canyon Corridor Project Overview and Summary
 Owl Canyon Corridor Project Overview and Summary December 22, 2008 The Owl Canyon corridor (generally the connection between the I-25 / Larimer County Road 70 interchange and the US 287 / Larimer County
Driver Education Ch. 4: Safe Driving Rules & Regulations. Ms. Marx
 Driver Education Ch. 4: Safe Driving Rules & Regulations Ms. Marx Speed Control Speed is one of the most common contributing factors of fatal & other types of accidents School zones, business or residential
Figure 3B-1. Examples of Two-Lane, Two-Way Marking Applications
 Figure 3B-1. Examples of Two-Lane, Two-Way Marking Applications A - Typical two-lane, two-way marking with passing permitted in both directions B - Typical two-lane, two-way marking with no-passing zones
CONGESTION AROUND THE WORLD
 CONGESTION AROUND THE WORLD Social costs : Situation in Europe : +/- 100 billions /year Situation in the USA : +/- 90 billions $/Year TIME IS MONEY * Livre Blanc, La politique des transports à l
SEASON FINAL REGISTRATION REPORTS
 Materials Included: 2015-2016 SEASON FINAL REGISTRATION REPORTS 2014-15 & 2015-16 Comparison by Group 2 2015-16 USA Hockey Member Counts 3 2015-16 8 and Under Report 4 2015-16 Players & Girls/Women by
Pennsylvania Highway Statistics
 Pennsylvania Highway Statistics 2011 Highway Data PUB 600 (12-12) I-83 North Harrisburg 2011 HIGHWAY STATISTICS INTRODUCTION Pennsylvania Highway Statistics is annually updated to summarize a variety of
Truck Climbing Lane Traffic Justification Report
 ROUTE 7 (HARRY BYRD HIGHWAY) WESTBOUND FROM WEST MARKET STREET TO ROUTE 9 (CHARLES TOWN PIKE) Truck Climbing Lane Traffic Justification Report Project No. 6007-053-133, P 101 Ι UPC No. 58599 Prepared by:
APPENDIX S REVISED PAGES OF THE SUPPLEMENTAL TRAFFIC IMPACT ANALYSIS
 APPENDIX S REVISED PAGES OF THE SUPPLEMENTAL TRAFFIC IMPACT ANALYSIS The capacity of the toll plaza was estimated based on data from numerous studies as well as traffic counts conducted at the toll plaza
An Easier Commute. Learn how to use I-77 Express to save you time.
 An Easier Commute Learn how to use I-77 Express to save you time PUBLIC-PRIVATE PARTNERSHIP I-77 Express is the first-ever toll lane public-private partnership with NCDOT I-77 Mobility Partners is financing,
LAGUNA BEACH POLICE DEPARTMENT MEMORANDUM
 LAGUNA BEACH POLICE DEPARTMENT MEMORANDUM TO: FROM: Christa Johnson, Assistant City Manager Jason C. Kravetz, Captain DATE: January 16, 2015 SUBJECT: Laguna Canyon Road Collision Analysis Within the last
appendix b BLOS: Bicycle Level of Service B.1 Background B.2 Bicycle Level of Service Model Winston-Salem Urban Area
 appendix b BLOS: B.1 Background Winston-Salem Urban Area Bicycle Level of Service Level of Service (LOS) is a framework that transportation professionals use to describe existing conditions (or suitability)
CHAPTER 2F. TOLL ROAD SIGNS. Table 2F-1. Toll Road Sign and Plaque Minimum Sizes
 2011 Edition Page 249 Section 2F.01 Scope CHAPTER 2F. TOLL ROAD SIGNS 01 Toll highways are typically limited-access freeway or expressway facilities. A portion of or an entire route might be a toll highway,
Traffic safety manual for the citizens of the Sultanate of Oman.
 Traffic safety manual for the citizens of the Sultanate of Oman. A traffic safety manual designed for the citizens of Oman for the age s between 18-30. Created by: Al Balushi, Khadija April 25 th, 2014
Chapter 2: Visual Description of Data
 Chapter 2: Visual Description of Data El Mechry El Koudous Fordham University January 24, 2018 Meshry (Fordham University) Chapter 2 January 24, 2018 1 / 35 Introduction In this chapter we will cover:
Public Meeting. I-35 Corridor from John Kilpatrick Turnpike North to Waterloo Road October 26, 6:00pm Edmond Community Center Auditorium
 Public Meeting I-35 Corridor from John Kilpatrick Turnpike North to Waterloo Road October 26, 2017 @ 6:00pm Edmond Community Center Auditorium Before we get started Please turn off or mute any electronic
Traffic Control: An Overview. May 2016
 Traffic Control: An Overview May 2016 Introduction Traffic Control as an Occupation Why Traffic Control? The Planning Process Communication Legislation TCM Committee Training Additions to 2014 TCM Work
RE: 2007 NPA Text (Clean Version)
") 1 2 3 4 5 6 7 8 9 10 11 12 13 14 15 16 17 18 19 21 20 22 23 24 25 26 27 28 29 30 31 32 33 34 35 36 RE: 2007 NPA Text (Clean Version) P. 230, Lines 29-30 SECTION 3B.04 White Lane Line Pavement Markings
1 2 3 4 5 6 7 8 9 10 11 12 13 14 15 16 17 18 19 21 20 22 23 24 25 26 27 28 29 30 31 32 33 34 35 36 RE: 2007 NPA Text (Clean Version) P. 230, Lines 29-30 SECTION 3B.04 White Lane Line Pavement Markings
Safety Assessment of Installing Traffic Signals at High-Speed Expressway Intersections
 Safety Assessment of Installing Traffic Signals at High-Speed Expressway Intersections Todd Knox Center for Transportation Research and Education Iowa State University 2901 South Loop Drive, Suite 3100
Turnpike System Projected Debt Service Coverage Ratio ($000)*
*") Fiscal Year Toll Concession Turnpike System Projected Debt Service Coverage Ratio ($000)* Toll Administrative Charges** Total Gross O&M Expenses*** Net Existing Annual Senior Debt Service Requirement****
Fiscal Year Toll Concession Turnpike System Projected Debt Service Coverage Ratio ($000)* Toll Administrative Charges** Total Gross O&M Expenses*** Net Existing Annual Senior Debt Service Requirement****
TRIM Queue, Vejle N Denmark. Evaluation report
 EUROPEAN COMMISSION DIRECTORATE GENERAL ENERGY AND TRANSPORT TRIM Queue, Vejle N Denmark Evaluation report November 2009 Version 1.0 TRIM_Queue_EasyWay_Evaluation_Report_DK Updated: November 09 Document
CHAPTER 2 LITERATURE REVIEW
 CHAPTER 2 LITERATURE REVIEW 2.1 Introduction This chapter presents some background information of the available literature related to the development of accident rates, accident models and accident statistic
MoPac South: Impact on Cesar Chavez Street and the Downtown Network
 MoPac South: Impact on Cesar Chavez Street and the Downtown Network Prepared by: The University of Texas at Austin Center for Transportation Research Prepared for: Central Texas Regional Mobility Authority
ITARDA INFORMATION. No.128. Special feature
 ITARDA INFORMATION No.128 Special feature Special feature Accidents when four-wheel vehicles are reversing ~ Drivers must thoroughly check behind them, especially in parking lots! ~ Introduction You may
Review of A Detailed Investigation of Crash Risk Reduction Resulting from Red Light Cameras in Small Urban Areas by M. Burkey and K.
 Review of A Detailed Investigation of Crash Risk Reduction Resulting from Red Light Cameras in Small Urban Areas by M. Burkey and K. Obeng Sergey Y. Kyrychenko Richard A. Retting November 2004 Mark Burkey
Operational Comparison of Transit Signal Priority Strategies
 Operational Comparison of Transit Signal Priority Strategies Revision Submitted on: November, 0 Author: Adriana Rodriguez, E.I Assistant Engineer Parsons Brinckerhoff 0 South Orange Avenue, Suite 00 Orlando,
Toll Collection and Violation Enforcement. August 9,
 Toll Collection and Violation Enforcement August 9, 2012 1 New Jersey Turnpike Authority The New Jersey Turnpike 152 miles (including extensions and spurs) 28 interchanges 366 toll lanes 59 years in business
Setting Regional and National Road Safety Targets
 10 th Meeting of the United Nations Road Safety Collaboration 3-4 June 2009, Bangkok Setting Regional and National Road Safety Targets Commemorating 60 years in Thailand 1949-2009 Lives at stake people
FARS Acc_Aux Analytical Users Manual. The Tables in this Manual Contain Fatal Crash Counts
 FARS Acc_Aux Analytical Users Manual The Tables in this Manual Contain Fatal Crash Counts FARS Acc_Aux File s 2005-2014 ANCHOR Table of Contents 1 A_CRAINJ A_CT A_D15_19 A_D15_20 A_D16_19 A_D16_20 A_D16_24
Capital Beltway HOT Lanes Project
 New Travel Choices Ahead Capital Beltway HOT Lanes Project Update January 2011 Major Milestones Reached in 2010 Project is 55% complete New bridge spans completed at every interchange; Second phase well
Turquoise Trail Corridor Management Plan Version 1.0
 9.0 NMSH & TD road crew maintaining the Turquoise Trail 9.1 SAFETY RECORD The accident data used in this chapter are derived from the NMSH&TD, primarily from their 1996 and 1997 database and from their
STUDY PROCESS & SCHEDULE
 STUDY PROCESS & SCHEDULE Route Centennial Bridge Study KDOT Project No. -52 KA-3229-01 STUDY OVERVIEW STUDY SCHEDULE The Kansas Department of Transportation (KDOT) has identified a future need to replace
MONROE COUNTY NEW YORK
 MONROE COUNTY NEW YORK Intersection Accident Database Enhancement Project (UPWP 4380) FINAL January 2008 Prepared By: Prepared For: Bergmann Associates 200 First Federal Plaza 28 East Main Street Rochester,
PERFORMANCE ACTIVITY 405 LIMB MANAGEMENT
 PERFORMANCE ACTIVITY 405 LIMB MANAGEMENT 405 LIMB MANAGEMENT ACTIVITY DESCRIPTION Cut and/or remove and/or grind tree limbs from the right-of-way. TRAFFIC CONTROL Utilize intermittent mobile operations
Highway 217 Corridor Study. Phase I Overview Report
 Highway 217 Corridor Study Phase I Overview Report November 3, 24 BACKGROUND AND OVERVIEW Study purpose The Highway 217 Corridor Study is developing multi-modal transportation solutions for traffic problems
Attachment No. 13. National Committee on Uniform Traffic Control Devices RWSTC RECOMMENDATION FOLLOWING SPONSOR COMMENTS
 1 2 3 4 Attachment No. 13 5 6 7 8 9 10 11 12 13 14 15 16 17 18 19 20 21 22 23 24 25 26 27 28 29 30 31 32 33 34 35 36 37 38 39 40 41 42 43 RWSTC agenda item IV. 2 June 2011 National Committee on Uniform
Chapter #4 Traffic Control Devices and Laws
 Chapter #4 Traffic Control Devices and Laws Chapter #4 Overview Unit 4 will introduce the student to traffic control devices, including signs, signals and pavement markings, as well as traffic laws specific
K-10 in Douglas and Johnson Counties
 KANSAS DEPARTMENT OF TRANSPORTATION K-10 in Douglas and Johnson Counties 2014 Corridor Review - Final Report Kansas Department of Transportation 12/8/2014 In response to concerns about median crossover
Road safety on motorways
 Accident prediction models, accident modification factors and user manual for calculation tool Søren Underlien Jensen February 2018 Transformervej 18 2860 Søborg www.trafitec.dk Table of content Introduction...
New Jersey State Police / New Jersey Department of Transportation Incident Management Partnership
 New Jersey State Police / New Jersey Department of Transportation Incident Management Partnership July 17, 2013 Presented by: SFC John C. McMahon, Jr. #5380 Assistant Unit Supervisor New Jersey State Police
FARS Acc_Aux Analytical Users Manual
 FARS Acc_Aux Analytical Users Manual The s Included in the 'ACC_AUX' database are produced from definitions defined in the 'NCSA - Analytical Data Classification Manual' The Tables in this Manual Contain
Appendix PIT Pittsburgh, Pennsylvania 2003 Annual Report on Freeway Mobility and Reliability
 (http://mobility.tamu.edu/mmp) Office of Operations, Federal Highway Administration Appendix PIT Pittsburgh, Pennsylvania 2003 Annual Report on Freeway Mobility and Reliability This report is a supplement
Access Management Regulations and Standards for Minor Arterials, Collectors, Local Streets
 Access Management Regulations and Standards for Minor Arterials, Collectors, Local Streets September 2009 Paul Grasewicz Access Management Administrator Concept of Access Management The way to manage access
THE ROAD ZIPPER SYSTEM. Moving People. Safer. Faster. Smarter... Better
 THE ROAD ZIPPER SYSTEM Moving People. Safer. Faster. Smarter... Better BEN FRANKLIN BRIDGE: PHILADELPHIA, PA BEFORE: The Ben Franklin Bridge between Philadelphia, Pennsylvania and Camden, New Jersey, needed
Highway 17 Transportation Improvement Study
 Final Report Highway 17 Transportation Improvement Study prepared for Santa Cruz County Regional Transportation Commission (SCCRTC) prepared by Planning and Engineering, Inc. 1155 North First Street, Suite
Mobility and Congestion
 Technical Memorandum Mobility and Congestion Prepared for: Prepared by: September 25, 2013 1 Table of Contents 1. Introduction... 1 2. Congestion Forecasting Process... 1 2.1 Mobility and Congestion Terms...
A Residential Guide to Neighborhood Speed Enforcement
 A Residential Guide to Neighborhood Speed Enforcement City of Delaware, Ohio A Residential Guide to Neighborhood Speed Enforcement Introduction: The perception of speeding on local streets is probably
Roadway Safety S.O.G. and Training Outline. Captain Rodney J. Palmer. Oak Creek Fire Department
 Roadway Safety S.O.G. 1 Roadway Safety S.O.G. and Training Outline Captain Rodney J. Palmer Oak Creek Fire Department 7000 S. 6 th Street Oak Creek Wisconsin, 53154 414-570-5630 rpalmer@oakcreekwi.org
METHODOLOGY. Signalized Intersection Average Control Delay (sec/veh)
") Chapter 5 Traffic Analysis 5.1 SUMMARY US /West 6 th Street assumes a unique role in the Lawrence Douglas County transportation system. This principal arterial street currently conveys commuter traffic
Chapter 5 Traffic Analysis 5.1 SUMMARY US /West 6 th Street assumes a unique role in the Lawrence Douglas County transportation system. This principal arterial street currently conveys commuter traffic
Federal Regulatory Update WTBA/WisDOT Contractor/Engineer Conference
 Federal Regulatory Update 2019 WTBA/WisDOT Contractor/Engineer Conference by Nick Goldstein ARTBA Vice President of Regulatory & Legal Issues January 17, 2019 How the Public Feels Regulations and Transportation
Analysis of Factors Affecting Train Derailments at Highway-Rail Grade Crossings
 Chadwick et al TRB 12-4396 1 1 2 3 Analysis of Factors Affecting Train Derailments at Highway-Rail Grade Crossings 4 5 TRB 12-4396 6 7 8 9 Submitted for consideration for presentation and publication at
Student Pedestrian Safety Fiddlers Canyon Elementary Community Council 2012
 Student Pedestrian Safety Fiddlers Canyon Elementary Community Council 2012 Introduction Fiddlers Canyon Elementary students must cross North Wedgewood Lane and Fiddlers Canyon Drive in order to come to
7.0 FREEWAYS CONGESTION HOT SPOT PROBLEM & IMPROVEMENT PROJECT ANALYSIS & DEFINITION
 7.0 FREEWAYS CONGESTION HOT SPOT PROBLEM & IMPROVEMENT PROJECT ANALYSIS & DEFINITION 7.1 INTRODUCTION & METHODOLOGY FEASIBILITY REPORT Congestion hot spot problem locations have been assessed using the
State Road & Tollway Authority Georgia 400 Demolition Project Frequently Asked Questions
 State Road & Tollway Authority Georgia 400 Demolition Project Frequently Asked Questions 1. When will toll collection end? Toll collection is scheduled to end on Friday, November 22, weather permitting.