PINELLAS TRAIL USERS SURVEY 2014
|
|
|
- Willa Fox
- 5 years ago
- Views:
Transcription


1 PINELLAS TRAIL USERS SURVEY 2014 July 2015
2 Page intentionally left blank 2014 Pinellas Trail Users Survey Page 2
3 Pinellas County Metropolitan Planning Organization s 2014 Pinellas Trail Survey of Users Councilman Jim Kennedy Chairman Commissioner John Morroni Vice Chairman Commissioner Joanne Cookie Kennedy Secretary Councilmember Doreen Hock-DiPolito Treasurer Commissioner Karen Seel Commissioner Dave Eggers Mayor Julie Ward Bujalski Councilmember Darden Rice Commissioner Kevin Piccarreto Mayor Sandra Bradbury Commissioner Michael Smith Commissioner John Tornga Commissioner Cliff Merz Whit Blanton MPO Executive Director Paul Steinman (Non-voting Advisor) Florida Department of Transportation, District VII Secretary July 2015 This project has been developed in compliance with Title VI of the Civil Rights Act of 1964 and other federal and state nondiscrimination authorities. Neither FDOT nor this project will deny the benefits of, exclude from participation in, or subject to discrimination to anyone on the basis of race, color, national origin, age, sex, disability, or family status Pinellas Trail Users Survey Page 3
4 Page intentionally left blank 2014 Pinellas Trail Users Survey Page 4
5 TABLE OF CONTENTS EXECUTIVE SUMMARY... 7 SURVEY RESPONSES... 7 TRIP MODE... 7 TRIP PURPOSE... 7 DISTANCE TO TRAIL... 8 DISTANCE ON TRAIL... 8 FREQUENCY OF USE... 8 RESIDENTS or VISITOR... 9 AGE GROUPS... 9 GENDER... 9 INTRODUCTION THE SURVEY THE METHODOLOGY THE MODE SHIFT KEY FINDINGS Question #1 How did you get to the Trail? Question #2 - How far did you travel to get to the Trail? Question #3 Why do you usually use the Trail? Question #4 What other uses? (check all that apply) Question #5 On the trail, do you usually? Question #6 How many days per week do you usually travel on the trail? Question #7 How far (one way) do you usually travel on the Trail? Question #8 Would you use more trails countywide? Question #9 Do you feel safe using the Trail? Questions #10 and #11 What do you like and dislike about the Trail? Question #12 Are you a year-round resident? or a tourist/seasonal resident? Question #13 What is your age group? Question #14 - What is your gender? CONCLUSION FIGURES Figure Pinellas Trail Survey Sites Figure Pinellas Trail Survey Questions Figure Pinellas Trail Friday Shift Chart Figure Pinellas Trail Saturday Shift Chart Pinellas Trail Users Survey Page 5
6 APPENDIX Total Responses Survey Questions Question #2 How far did you travel to get to the Trail? Question #3 Why do you usually use the Trail? (check one) Question #4 What other uses? (check all that apply) Questions #3 and #4 Mode Share, Commuting Uses on the Trail Question #5 On the trail, do you usually? Question #6 How many days per week do you usually travel on the trail? Question #7 How far (one way) do you usually travel on the Trail? Question #8 Would you use more trails countywide? Question #9 Do you feel safe using the Trail? Questions #10 and #11 What do you like and dislike about the Trail? Question #12 Are you a year-round resident? Or are you a tourist/seasonal resident? Question #13 What is your age group? Question #14 - What is your gender? Pinellas Trail Users Survey Page 6
7 EXECUTIVE SUMMARY SURVEY RESPONSES A total of 2,513 surveys were received on April 4th and 5th, 2014; 1,230 on Friday at 8 sites, and 1,283 on Saturday at 6 sites. There were 1,518 responses to the 1999 survey on November 5th and 6th; 721 on Friday and 797 on Saturday at 6 sites. Approximately 60% more surveys were collected in 2014 than in The increase in the number of surveys may in some part be due to the use of eight (8) survey locations on Friday vs. six (6) locations for the other days. As with the 1999 survey, more Trail users participated in the survey on Saturday than on Friday. Survey staff observed and reported that some Trail users who declined the survey were commuting and had very limited time to spare. Staff also reported a number of Spanish-speaking Trail users who declined the survey. Staff at the downtown Clearwater survey site reported that Spanish-speaking Trail users were more receptive to answering the survey when translated to Spanish. TRIP MODE Through analyzing questions #1 and #5, nearly 2/3 of Trail users primarily ride bicycles to the Pinellas Trail, as well as on the Trail itself. Nearly three times the users bicycled or skated to the Trail than walked to the Trail. When comparing the 2014 survey responses with the 1999 responses, the percentage of users walking on the Trail remained consistent at 23%. Bicycling represents the majority mode choice on the Trail (66% Friday; 69 %Saturday). As the bicycling mode share on the Trail is slightly higher than those bicyclists traveling to the Trail, it is logical to assume that some of those traveling to the Trail by motor vehicle or other bring or rent bicycles for Trail use. TRIP PURPOSE Another focus of the Trail Survey is to better understand how and why people use the Pinellas Trail. Several trip purpose options were offered for question #3 and #4, including work, school, shopping, socializing, traveling to a restaurant, park or beach, exercise or recreation. It can be assumed that before the Trail existed, a significant percentage of those who now indicate they use the Trail for any purpose would have required a motorized vehicle in order to travel to their destination. For the purposes of this survey, all trip purpose options were categorized as a commuter mode share, with the exception of exercise and recreation. Trip purposes which cite specific destinations were categorized and compared with the 1999 survey responses. It is interesting to note that the mode share traveling to school remained fairly consistent in both data years (4%). The mode share traveling to work on the Trail increased slightly from 1999 to 2014, about 2% (6% to 8%). The relatively small increase in the percentage of Trail users commuting to work may reflect several transportation system improvements, policy changes, and the expanded nonmotorized countywide network of bicycle lanes and other trails. The improved off-road multi-use trail network and on-road bicycle lanes offer additional destinations, activities, and allow more flexibility when planning a route. The improved network of sidewalks and bicycle lanes may also explain the average decrease in percentages for the remaining categories (shopping, socializing, traveling to restaurants, park or beach) Pinellas Trail Users Survey Page 7

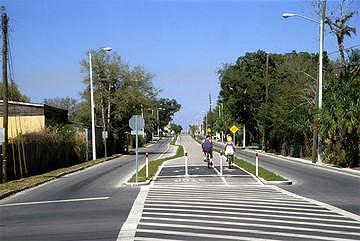
8 The responses from the various survey locations closest to the downtown areas, or central business districts, showed higher-than-average trip to work usage. On Friday in Downtown Clearwater, more than 35 users, or 31.3%, responded they were on their way to work; St. Petersburg surveys indicated 22 users, or 23.2% were going to work; Gulfport surveys listed 17 users or 14.4% going to work. Survey responses from those three locations on Friday were greater than the average response of 9.8% of all users traveling to work. On Saturday, users at St. Petersburg and, Seminole City Park indicated a higher-than-average percentage of work trips (St. Petersburg totaled 22 users or 8.1%; Seminole City Park totaled 20 users or 6.3%). The average percentage of work trips was 5.8% overall. The users responding to the survey at Main Street Dunedin totaled 11 users or 5.8 % of users going to work. Regarding school-related trips on Friday, the Gulfport (34 users, 28.8%) and Seminole City Park (20 users or 8.7%) survey locations yielded higher-than-average numbers of users who made school trips, with a 5.5% overall average. Survey results on Saturday identified Seminole City Hall (5 users at 1.6%), Taylor Park (4 users at 1.8%), St. Petersburg (3 users at 1.1 %), and Main Street in Dunedin (2 users at 1.1%) showed equal-to or higher-than-average users going to school. The percentage of Trail users whose trip purpose was purely recreational and/or for exercise increased significantly from the 1999 results. Recreational users responding to the survey increased by 13% from 1999, and those reportedly using the Trail for exercise more than doubled (25% in 1999 to 57% in 2014). DISTANCE TO TRAIL In order to determine how far Trail users are willing to travel to get to the Trail, question #2 offered three responses: 2-miles or less, 2 to 10 miles, or 10-miles or more. The 2014 results were similar to the responses from the 1999 survey in that the majority of users traveled 2-miles or less to the Trail. An average of 34% of users traveled between 2- and 10-miles to get on the Trail, and slightly less than 20% traveled 10-miles or more to use the Trail. DISTANCE ON TRAIL 2014 survey question #7 asked how far Trail users were usually willing to travel (one-way) to use the Pinellas Trail. In general, the percentage of Trail users traveling longer distances more than 10-miles increased significantly from 1999 (from 22% to 42%). When comparing the distance traveled to the Trail (question #2, above) and the distance traveled on the Trail, the percentage of users traveling 2-miles or less, or 2-miles to 10-miles decreased from the 1999 survey. However, there were almost twice as many users (about 20%) who travel longer distances of 10-miles or more (22% in 1999; 42% in 2014) on the Trail. In addition, both survey results indicate weekend Trail users continue to travel longer distances per trip than weekday users. Wayfinding signs on the Pinellas Trail in downtown Dunedin, Florida. FREQUENCY OF USE 2014 Survey question #6 was asked to determine how often respondents use the Trail. The responses were compared to those from the 1999 survey (question #4), and showed that slightly fewer users traveled on the Trail one day or two days per week (7-12% decreased use) Pinellas Trail Users Survey Page 8

9 RESIDENTS or VISITOR Many businesses in Pinellas County are supported in part by tourism, seasonal residents, and visitors. The results from 2014 Survey question #12 yielded interesting information regarding full-time residents and our seasonal visitors, and the role that the Pinellas Trail might have in attracting tourists and nonresidents. A higher percentage of residents used the Trail in 1999 (87%) than in 2014 (72%). In addition, the percentage of responses by visitors or seasonal residents more than doubled (from 13% to 28%) in the latest survey. It is interesting to note that more residents (approximately 9%) use the Trail on Saturday than on Friday, based on the 2014 responses. AGE GROUPS In order to statistically compare age groups of those using the Trail with other relevant datasets, the age ranges used for survey question #13 are the same as those groupings used for other transportationrelated reports and documents. It is important to consider other factors that impact Trail user responses, such as the higher average age of Pinellas County residents as compared to the rest of Florida (average 43-years in Pinellas; average 40-years in Florida), origin/destination information for out-oftown or out-of-state visitors, ages of those currently employed as well as retired individuals. The age group categories were identified as: 18-years and younger; 19 to 34-years; 35 to 49-years; 50 to 64-years; and 65-years and older. When compared to the 1999 results, the percentages of Trail users within the three oldest age groups increased (10% to 15%). Survey responses from the two youngest age groups decreased 4-5% (age groups younger than 34-years). On Friday there were twice as many users aged 18-years or younger (8%) than on Saturday (4%). Among ages 19 to 34-years and 35 to 49-years, the percentage is fairly consistent on the weekday (11% and 16%) and the weekend (13% and 17%). There were 5% more users 50 to 64- years old on Saturday than on Friday. Slightly more survey respondents (3%) 65-years and older used the Trail on Friday than on Saturday. Pedestrians and bicyclists enjoy the Pinellas Trail. GENDER The gender of each survey respondent was tabulated and compared with the results of the 1999 survey. The results were consistent with respect to a slightly higher percentage of males than females on both Friday and Saturday (59% males in 2014; 61% in 1999). The percentage of female responses increased about 3% from the 1999 survey (42% females in 2014; 39% females in 1999). Both surveys indicated that a higher percentage of males used the Trail on Friday vs. Saturday, while the percentage of female users was slightly higher on Saturday than Friday Pinellas Trail Users Survey Page 9

10 INTRODUCTION In 1989, the Pinellas County Board of County Commissioners (BCC) began to convert an abandoned rail corridor into a multi-use trail facility. Since that time, the Fred Marquis Pinellas Trail has expanded to be approximately 45 miles long and traverses several jurisdictions from Tarpon Springs in northern Pinellas County, to St. Petersburg in southern Pinellas County. The Pinellas Trail (hereinafter referred to as the Trail ) provides access to a variety of popular destinations, major employers, recreational opportunities, public schools and higher educational institutions. Consequently, a significant number of persons use the Trail as a transportation corridor that allows them to access employment centers, travel to parks and natural areas, or accomplish utilitarian tasks/errands along the corridor without conflicts with motor vehicles. Average attendance on the Trail totals approximately 600,000 persons per year. 1 In order to better understand how people use the Trail, the Pinellas County Metropolitan Planning Organization (MPO) conducted the first survey of Trail users in That survey yielded results which indicated approximately one-third of the Trail users on weekdays chose the Trail as their preferred route to travel without using a motor vehicle. Trips on the Trail that would otherwise have been completed via motor vehicle may be indicative of a shift to an alternative mode of transportation. As the Trail serves as a transportation corridor, it qualifies for federal transportation funds to construct overpasses, improve atgrade extensions, implement safety projects, and improve wayfinding. Many of the local jurisdictions have constructed local off-road trails and paths to link residential neighborhoods with popular destinations to expand the countywide bicycle/pedestrian network. A few jurisdictions have utilized sections of the existing trailways network to revitalize stagnant downtown areas, stimulate urbanized development, and attract targeted demographic sectors. The expansion of the Pinellas Trailways Network plan, and the Pinellas Trail Loop in particular, has been identified as a priority for the bicycle pedestrian program in the MPO s Adopted Long Range Transportation Plan (LRTP). The Pinellas Trail Loop, a 75-mile separated off-road facility, will provide safe, accessible pedestrian and bicycle access countywide. The Loop plan includes approximately 20-miles of planned trail along sections of a major utility easement. The 2014 Pinellas Trail Survey was designed to continue the collection and evaluation of relevant user information to document and support future federal and state transportation MPO s Pinellas Trail Loop funding, as well as to more accurately gauge the public s desire for additional non-motorized infrastructure and related amenities. The survey also included questions to determine community satisfaction with the existing facilities. 1 User statistics provided by Pinellas County Parks and Conservation Resources, PCR Pinellas Trail Users Survey Page 10

11 i The survey was conducted on Friday, April 4 and Saturday, April 5, 2014 from 7:30 a.m. to 6:30 p.m. A total of 2,511 responses were received during the two-day survey; 1,227 on Friday and 1,284 on Saturday. Results for each question are summarized and presented as key findings. Detailed responses to individual questions are included in the appendix. THE SURVEY The Pinellas Trail Survey questionnaire was developed by MPO staff, with input from other county departments, survey professionals and a variety of citizen advisory groups. Additional questions were considered to determine user travel mode, travel mode shifts, perception of safety, satisfaction with amenities, and whether users are residents or visitor/non-residents. The final survey results can be compared to previous baseline data for long range planning and to assess existing conditions. Volunteers and staff ask Pinellas Trail users to complete the survey. Water and promotional items were provided to thank the participants. After a detailed review of the Pinellas Trail corridor, parking and access points, MPO staff determined that a minimum of eight (8) survey sites would be sufficient to provide acceptable coverage of the corridor and user characteristics. Each site would require the staging of several tables and chairs, offer adequate parking options and restroom facilities, and include enough area for advance signs, maps, printed safety materials, posters or banners. Each survey site also offered water and promotional items for volunteers and survey respondents. Pinellas County Parks and Conservation Resources (PCR) provided staff support and assistance with survey site set-ups and supplies for both days. The recommended locations for the survey sites offered a wide variety of adjacent land uses and local trip generators. The survey sites selected included: Wall Springs Park Taylor Park in Largo Curlew Road Seminole City Park Main Street in Dunedin Gulfport (58th Street South/ 6th Avenue South) Downtown Clearwater Downtown St. Petersburg Each survey site required staff personnel and volunteers, who were recruited from various local government and volunteer agencies, MPO advisory committee members, Auxiliary Rangers, bicycle clubs, chambers of commerce, Rotary Club members and local law enforcement. THE METHODOLOGY In order to determine if a respondent was using the Trail instead of making the trip via motor vehicle (choosing to change or shift their mode of travel), two methodologies were applied. The answers to survey question #3 why do you usually use the Trail, were designed to indicate the primary destination/trip purpose of each respondent. The percentage for each of the eight options (work, school, shopping, exercise, socialize, recreation, or park/beach) was calculated using the total surveys received. (Total of 1,230 surveys received on Friday; total of 1,283 surveys received on Saturday.) Survey question #4, what other uses was designed to indicate all the various uses, or destination types, of those on the Trail on any random day. The respondents were encouraged to list multiple answers for 2014 Pinellas Trail Users Survey Page 11

 THE MODE SHIFT One of the primary objectives of the Trail survey was to determine the average percentage of Pinellas Trail users who previously traveled by motor vehicle, thus changed their mode of")

12 this question from the same eight (8) options as were provided in question #3. Thus, the total responses to question #4 were used to calculate the percentage of Trail users who changed their mode of travel, or mode shift. (Total of 2,373 responses received on Friday; total of 2,384 responses received on Saturday.) THE MODE SHIFT One of the primary objectives of the Trail survey was to determine the average percentage of Pinellas Trail users who previously traveled by motor vehicle, thus changed their mode of travel (also referred to as a mode shift). Applicable trip purposes, such as shopping, traveling to a restaurant or social activities, clearly indicate many users chose the Pinellas Trail as an alternative transportation corridor to avoid potential crashes or conflicts with motor vehicles. The results from the 2014 survey were then compared to the 1999 survey for trending conditions. Pinellas Trail crossing in downtown Dunedin, Florida. It is important to note that since the 1999 survey, both the sidewalk network and bicycle facilities network have been improved countywide. In addition, several local jurisdictions have invested in trailways, upgraded many existing sidewalks, enhanced pedestrian crossings, and improved safety for pedestrian and bicycle travel. Other initiatives to support and encourage a mode shift include the installation of bicycle racks at popular destinations and transit accommodations such as bicycle racks mounted on buses 2 as well as installing bicycle racks at transit stops and stations. Wayfinding signs for Ream Wilson Clearwater Trail and the Pinellas Trail Loop at Bright House Field, Clearwater, Florida. Improvements for the Pinellas Trail along Safford Avenue, Tarpon Springs, Florida. 2 The Bikes-On-Buses program began in 1998, initially requiring the cyclist to acquire a permit issued by PSTA (Pinellas Suncoast Transit Authority) to use the racks. The program proved extremely popular and permits were no longer required by Pinellas Trail Users Survey Page 12
13 KEY FINDINGS The major results of the survey are presented below. Additional details and specifics are provided in the appendixes. Question #1 How did you get to the Trail? The largest percent of those surveyed (59%) bicycled or skated to the Trail; the lowest percent (4%) used some other mode of travel to reach the Trail. Bicycling to the Trail was the preferred mode of travel for both Friday and Saturday (58%/60%); the second most popular mode was walking/running (22%/18%). Question #2 - How far did you travel to get to the Trail? The majority of respondents traveled 2-miles or less to get onto the Trail (56% on Friday, 54% on Saturday). Although the lowest number of Trail users traveled 10-miles or more to reach the Trail, the average percentage remains significant (16%), and represents a 2% increase from Question #3 Why do you usually use the Trail? This question was included to identify the one primary reason people use the Trail. The raw totals indicate that exercise is the primary purpose for using the Trail (57%). Work and school trips remained relatively stable (average 8% in 2014 vs. 6% in 1999). A few categories may be grouped and characterized as commuter trips. Generally, commuter trips to and/or from an intended destination would otherwise have required a motor vehicle. Those trips on the Trail represent mode shifts. The commuter mode shift was determined by considering the results from Question #3 along with analyzing Question #4 as described below. Question #4 What other uses? (check all that apply) Question #4 was included to identify all the discernible reasons the Trail was being used. Since multiple responses were encouraged, the number of responses to Question #4 is greater than the number of surveys received (4,757 responses to Q#4 vs. 2,513 total surveys collected in 2014). The same categories from Question #3 were used for consistency and to more easily compare responses as well as the two surveys (2014 and 1999). The total responses for each category were divided by the total number of responses to determine percentage of use by SURVEY RESULTS COMPARISON 2014 to 1999 Q #1 How did you get to the Trail? Bicycling/Skating increased 13% Travel by car decreased approx 11% Walk/Run 20 % 26 % Bike/Skate 59 % 46 % Car 17 % 28 % Other 4 % 1 % Q #2 How far did you travel to get to the Trail? 8% increase w/i 2-miles or less Slightly fewer % of users travel more than 2-miles to Trail miles or less 54 % 46 % 2- to 10-miles 31 % 37 % 10-miles or more 16 % 18 % Q #3 Why do you usually use the Trail? 32% increased use for exercise 18% decreased use for socializing Work 8 % 6 % School 4 % 4 % Shopping 4 % 17 % Exercise 57 % 25 % Socialize 4 % 22 % Recreation 21 % 8 % Restaurants 1 % 8 % Park/Beach 2 % 12 % Q #4 What other uses? 21% increased use for recreation 10% increased use to restaurants 9% increased use to park or beach Work 3 % 3 % School 1 % 2 % Shopping 10 % 9 % Exercise 18 % 13 % Socialize 13 % 12 % Recreation 25 % 4 % Restaurants 14 % 4 % Park/Beach 17 % 6 % 2014 Pinellas Trail Users Survey Page 13
14 category. The resulting percentages were compared to those from the 1999 survey for trends and commuter share. Question #5 On the trail, do you usually? The largest percentage of Trail users traveled by bicycle on the Trail. On Friday, approximately 66% of respondents usually travel via bicycle; on Saturday, there were approximately 69% using bicycles. Those jogging/running or skating represent the lowest percentage of Trail users; in addition, the percentage of those categories decreased significantly from the 1999 survey results. Question #6 How many days per week do you usually travel on the trail? According to the 2014 survey results, approximately 33% of Trail users traveled on the Trail 3-5 days per week, and another 33% of users traveled 5-7 days per week on the Trail. Both categories increased slightly from the 1999 survey results. The results from the Friday 2014 surveys indicated approximately 10% more users frequently use the Trail than on Saturday, which is fairly consistent with the 1999 survey statistics. Question #7 How far (one way) do you usually travel on the Trail? On Friday, 43% of Trail users traveled between 2- and 10- miles; on Saturday, 44% of users traveled 10-miles or more. The average distance traveled by respondents in 2014 compared with the 1999 results reveal fewer Trail users traveling shorter distances and a significant increase in those users traveling 10-miles or more. Question #8 Would you use more trails countywide? As with the results of the 1999 survey, the 2014 survey results showed solid support for new connecting trails. The overall totals for both surveys showed 90 % of Trail users support expanding the trailways network. SURVEY RESULTS (continued) Q #5 On the Trail, do you usually? Bicycling increased 16% Skating decreased approx 12% Walk 23 % 23 % Bicycle 67 % 52 % Jog/Run 7 % 10 % Skate 3 % 15 % Q #6 How many days per week do you travel on the Trail? 5% increased use 3-5 days per week 4% increased use 5-7 days per week 8% decreased use one-day per week One (1) Day or less 17 % 25 % Two (2) Days 18 % 19 % 3 5 Days 33 % 28 % 5 7 Days 33 % 29 % Q #7 How far do you usually travel? 20% increased use 10-miles or more 12% decreased use 2- to 10-miles 7% decreased use 2-miles or less miles or less 16 % 23 % 2- to 10-miles 43 % 55 % 10-miles or more 42 % 22 % Q #8 Would you use more trails countywide? 90% of both survey respondents support additional trails countywide Yes 90 % 90 % Question #9 Do you feel safe using the Trail? Question #9 was included in the survey to gauge the perception of safety on the Trail from the users themselves. An overwhelming percentage of users (more than 90%) view the Trail as a safe, secure non-motorized corridor. Additional Q #9 Do you feel safe using the Trail? More than 90% of Trail users feel safe using the Trail Yes 92 % 98 % 2014 Pinellas Trail Users Survey Page 14
15 survey comments regarding the perception of safety is available in the appendices. Questions #10 and #11 What do you like and dislike about the Trail? Question #10 and #11 required survey respondents to briefly explain what they like or dislike about the Pinellas Trail. Since the wide array of comments is not quantitative, the answers to these two questions are not measurable. Overall, the information provided by the survey was positive, and can be utilized to explore additional amenities, enhancements, or other improvements. The replies and comments to questions #10 and #11 have been summarized and are provided in the appendices. Question #12 Are you a year-round resident? or a tourist/seasonal resident? The 1999 survey results indicated the majority of Trail users were Pinellas County residents. When tabulated, 87% of users lived locally, as compared to 13% of users were visitors or seasonal residents. It should be noted the 2014 survey results showed an increase in the number and percentage of tourists or seasonal residents using the Trail (15%) from the 1999 results. In addition, when comparing the 2014 use by residents on Friday vs. Saturday, 9% more Pinellas residents used the Trail on the weekends. Question #13 What is your age group? For statistical comparisons, the same age groupings were used for both the 1999 and 2014 surveys. There were 15% more Trail users over 64 years of age in 2014 than in 1999; 13% more Trail users between the ages of 35 and 49 years of age; 10% more Trail users between the ages of 50 and 64 years of age; and 4 5% decrease in the use by those 19 to 34 years of age and those users 18 years of age or younger. Additional statistics for each location are provided in the appendices. Question #14 - What is your gender? In 1999, the majority of Trail users responding to the survey were male (average 61%). On Friday, a slightly higher percentage of male users completed the survey than on Saturday (63% vs. 59%). The percentage of female Trail users increased slightly in 2014 from 1999 (average 42% as compared to 39% average). SURVEY RESULTS (continued) Q #12 Resident or Tourist/Seasonal? 15% increased use by Tourists in % increased use in 2014 by Residents on Saturday vs. Friday Resident 72 % 87 % Tourist/ Seasonal 28 % 13 % Q #13 Age Groups 15% increased use by over 64 yrs 13% increased use by yrs 10% increased use by yrs 4%-5% decrease in other age groups yrs or younger 6 % 11 % yrs 12 % 16 % yrs 17 % 30 % yrs 37 % 27 % Over 64 yrs 30 % 15 % Q #14 Gender Female Trail users increased by 3% on average Male 58 % 61 % Female 42 % 39 % 2014 Pinellas Trail Users Survey Page 15
16 CONCLUSION While there are several benefits to conducting a survey of Pinellas Trail users, it must also be acknowledged that there are several limitations to this data. In particular, the timing and coverage of the field work limits the extent to which the results can be generalized to overall trail users. Our goal was not to get a representative sample of trail users or to project total usage; rather, this data is most useful to get insights into patterns of trail use and trail users opinions as a basis for future work. Our analysis indicates the majority of people using the trail are doing so for exercise and recreation. Survey respondents reported using the trail several days each week, and a third reported using the trail 5 or more days each week. It appears that the trail is helping residents of Pinellas County achieve the recommended weekly levels of physical activity. Future trail user survey efforts should examine the frequency of trail use as it relates to factors that the County can control. For example, better connectivity by improving trail access points would increase the number of people that utilize the trail for a variety of reasons. Along these lines, project staff were surprised to find that about one-third of trail users traveled between 2 to 10 miles to the trail, which is more than twice the usershed distance (how far people will travel to use a trail or park) of about half a mile commonly used by transportation professionals. This suggests that the Pinellas Trail is a destination for users who are willing to travel relatively long distances to access its scenic qualities for recreation and other purposes. Although no data was collected with respect to the volume of trail use, people are generally attracted by scenery along the trail, separation from cars, and convenience. Improving scenery, connecting trails and providing more access points, and changing routes or improving crossings where the trail currently runs along or across streets could have a positive impact on the number of trail users. The expansion of access points along the trail and improved connectivity between destinations is also supported by the data showing about 8% of respondents using the trail for a work commute, and 10% using the trail for shopping-related trips. Better connectivity might result in increased non-recreational use of the trail. While it is possible these results are biased in that commuters may not have had time to stop to complete a survey, they do suggest one strategy the local governments can employ to increase trail use. Other strategies may include allowing commercial land uses the ability to provide direct access to the trail, continue to work to acquire outside funding sources to complete the Pinellas Trail Loop, and provide a wayfinding system to direct potential users to the most convenient access points. MPO staff and community stakeholders have noted that perceptions about crime and threats to physical safety may be a barrier to trail use. While users are attracted by natural scenery, some sections of the trail are wooded and secluded and hence may be perceived as less safe. Although our preliminary analysis does not demonstrate a clear pattern regarding trail users perceptions of safety, there are certain site-specific safety concerns along the trail. Fortunately, the Pinellas Trail Security Task Force, local law enforcement, Pinellas Trails, Inc., the Auxiliary Rangers and other stakeholders have been monitoring these occurrences and been involved in strategies to mitigate these safety concerns. The survey data may provide some support for this observation. The data yields an unequal distribution of males and females on the trail that could reflect women s greater concerns about safety. Additionally, male trail users may rate the safety and security along the trail more positively than females. This suggests that security concerns may prevent women from using the trail more than men. However, it is 2014 Pinellas Trail Users Survey Page 16
17 important to remember that surveys were conducted only with current trail users. Further investigation into the extent of concerns about safety and security as a barrier to trail use may be warranted in the future. Current local efforts in Pinellas County also encourage the use of CPTED (Crime Prevention Through Environmental Design) principles in new and redevelopment projects. Incorporating CPTED principles into trail system plans, may also help address perceived crime and safety issues. Increasing trail usage may help to reduce actual and perceived crime. For example, careful trail design (such as improving visibility or clearing brush) can increase users perception of safety and minimize opportunities for crime along trails. Recommendations Based on the findings of this survey the following recommendations are made for improving the use of the Pinellas Trail. 1. Continue to work to expand the Pinellas Trail network. 2. Allow commercial land uses direct access to the Pinellas Trail. 3. The Pinellas County MPO take the lead role in standardizing a regional approach to counts and surveys, and handle tracking and reporting. In this way, the MPO can track user trends over time, and evaluate the impact of new projects and policies Pinellas Trail Users Survey Page 17
18 FIGURES 2014 Pinellas Trail Users Survey Page 18

19 Figure Pinellas Trail Survey Sites 2014 Pinellas Trail Users Survey Page 19

20 Figure Pinellas Trail Survey Questions 2014 Pinellas Trail Users Survey Page 20
21 Figure Pinellas Trail Friday Shift Chart 2014 Pinellas Trail Users Survey Page 21
22 Figure Pinellas Trail Saturday Shift Chart 2014 Pinellas Trail Users Survey Page 22
23 APPENDIX Response Numbers and Percentages 2014 Pinellas Trail Users Survey Page 23

24 Total Responses 2014 Pinellas Trail Users Survey Page 24

25 Survey Questions Question #1 How did you get to the trail today? 2014 Pinellas Trail Users Survey Page 25

26 Question #2 How far did you travel to get to the Trail? 2014 Pinellas Trail Users Survey Page 26
 2014 Pinellas Trail Users Survey")
27 Question #3 Why do you usually use the Trail? (check one) 2014 Pinellas Trail Users Survey Page 27
 2014 Pinellas Trail")
28 Question #4 What other uses? (check all that apply) 2014 Pinellas Trail Users Survey Page 28

29 Questions #3 and #4 Mode Share, Commuting Uses on the Trail 2014 Pinellas Trail Users Survey Page 29

30 Question #5 On the trail, do you usually? 2014 Pinellas Trail Users Survey Page 30

31 Question #6 How many days per week do you usually travel on the trail? 2014 Pinellas Trail Users Survey Page 31

32 Question #7 How far (one way) do you usually travel on the Trail? 2014 Pinellas Trail Users Survey Page 32

33 Question #8 Would you use more trails countywide? 2014 Pinellas Trail Users Survey Page 33

34 Question #9 Do you feel safe using the Trail? 2014 Pinellas Trail Users Survey Page 34
35 Questions #10 and #11 What do you like and dislike about the Trail? Wall Springs Park beauty wellmaintained convenient access safety amenities shade Curlew Road safety beauty well-maintained convenient access few stops amenities shade length Q #10 -- WHAT DO YOU LIKE ABOUT THE TRAIL? Main Street Dunedin safety convenient access proximity to destinations beauty shade wellmaintained length Taylor Park Downtown Clearwater proximity to destinations safety beauty wellmaintained shade convenient access beauty safety wellmaintained length rangers Seminole City Park convenient access shade beauty wellmaintained length safety rangers amenities Gulfport Spur length safety wellmaintained convenient access proximity to destinations Downtown St. Petersburg convenient access beauty wellmaintained length convenience proximity to destinations safety shade Wall Springs Park maintenance trail length is too short lack of security busy crossings inexperienced trail users no nighttime access no amenities no east-west connections lack of parking need more rangers dogs Curlew Road busy crossings no east-west connections maintenance speeding bicyclists lack of nighttime access dogs lack of security inexperienced trail users lack of parking no police presence no amenities no lighting no mile posts lack of connections Q #11 -- WHAT DO YOU DISLIKE ABOUT THE TRAIL? Main Street Dunedin inexperienced trail users too many stops lack of security no nighttime access no east-west connections maintenance dogs no police presence no amenities no mile posts no lighting busy crossings narrow pedestrian lane Downtown Clearwater no lighting lack of security maintenance no east-west connections inexperienced trail users no amenities no mile posts dogs busy crossings Taylor Park maintenance busy crossings lack of security no amenities lack of nighttime access no east-west connections inexperienced trail users no mile posts no lighting no police presence not a complete trail loop speeding bicyclists dogs Seminole City Park lack of security busy crossings maintenance inexperienced trail users dogs no shade no police presence no lighting speeding bicyclists no amenities trail length is too short not a complete trail loop no mile posts motorcycles on trail no east-west connections narrow trail width Gulfport Spur no lighting maintenance busy crossings lack of security dogs high overpasses no amenities motorized bicycles trail length is too short no shade Downtown St. Petersburg lack of security no shade no lighting maintenance lack of nighttime access no police presence busy crossings not a complete trail loop dogs trail length is too short no amenities no mile posts no connection to the beach not enough overpasses 2014 Pinellas Trail Users Survey Page 35

36 Question #12 Are you a year-round resident? Or are you a tourist/seasonal resident? 2014 Pinellas Trail Users Survey Page 36

37 Question #13 What is your age group? 2014 Pinellas Trail Users Survey Page 37

38 Question #14 - What is your gender? 2014 Pinellas Trail Users Survey Page 38
Corpus Christi Metropolitan Transportation Plan Fiscal Year Introduction:
 Introduction: The Safe, Accountable, Flexible, Efficient Transportation Equity Act: A Legacy for Users (SAFETEA-LU) has continued the efforts started through the Intermodal Surface Transportation Efficiency
NM-POLICY 1: Improve service levels, participation, and options for non-motorized transportation modes throughout the County.
 Transportation PRINCE WILLIAM COUNTY 2008 COMPREHENSIVE PLAN NON-MOTORIZED PLAN CONTENTS Goals, Policies, and Action Strategies Table 4 (Bike Facility Classifications and Descriptions) Table 5 (Bike Facility
WILMAPCO Public Opinion Survey Summary of Results
 Wilmington Area Planning Council WILMAPCO Public Opinion Survey Summary of Results Prepared by: 2955 Valmont Road, Suite 300 Boulder, Colorado 80301 t: 303-444-7863 f: 303-444-1145 www.n-r-c.com Table
Goal 3: Foster an environment of partnerships and collaboration to connect our communities and regions to one another.
 Non-Motorized Transportation Plan (NMTP) Draft Vision, Goal and,, Tri-County Regional Planning Commission (TCRPC) Purpose The purpose of the Tri-County Regional Planning Commission (TCRPC) Non-Motorized
AAMPO Regional Transportation Attitude Survey
 AAMPO Regional Transportation Attitude Survey Traditionally Underserved Populations helping organizations make better decisions since 1982 2018 Submitted to the AAMPO By: ETC Institute 725 W. Frontier
Bikeway action plan. Bicycle Friendly Community Workshop March 5, 2007 Rochester, MN
 Bikeway action plan Summary The was held on March 5, 2007 at the Rochester Mayo Civic Center. The workshop was hosted by Rochester-Olmsted County Planning Department in collaboration with the League of
SANTA CLARA COUNTYWIDE BICYCLE PLAN August 2008
 SANTA CLARA COUNTYWIDE BICYCLE PLAN August 2008 To assist VTA and Member Agencies in the planning, development and programming of bicycle improvements in Santa Clara County. Vision Statement To establish,
APPENDIX A: Complete Streets Checklist DRAFT NOVEMBER 2016
 APPENDIX A: Complete Streets Checklist DRAFT NOVEMBER 2016 Complete Streets Checklist MetroPlan Orlando s Complete Streets Checklist is an internal planning tool for staff to further implementation of
1999 On-Board Sacramento Regional Transit District Survey
 SACOG-00-009 1999 On-Board Sacramento Regional Transit District Survey June 2000 Sacramento Area Council of Governments 1999 On-Board Sacramento Regional Transit District Survey June 2000 Table of Contents
Chapter 2. Bellingham Bicycle Master Plan Chapter 2: Policies and Actions
 Chapter 2 Bellingham Bicycle Master Plan Chapter 2: Policies and Actions Chapter 2: Policies and Actions The Bicycle Master Plan provides a road map for making bicycling in Bellingham a viable transportation
Investment in Active Transport Survey
 Investment in Active Transport Survey KEY FINDINGS 3 METHODOLOGY 7 CYCLING INFRASTRUCTURE 8 Riding a bike 9 Reasons for riding a bike 9 Mainly ride on 10 Comfortable riding on 10 Rating of cycling infrastructure
TOWN OF PORTLAND, CONNECTICUT COMPLETE STREETS POLICY
 TOWN OF PORTLAND, CONNECTICUT COMPLETE STREETS POLICY I. VISION, GOALS & PRINCIPLES VISION To improve the streets of Portland making them safer and more accessible for all users including pedestrians,
Capital Bikeshare 2011 Member Survey Executive Summary
 Capital Bikeshare 2011 Member Survey Executive Summary Prepared by: LDA Consulting Washington, DC 20015 (202) 548-0205 June 14, 2012 EXECUTIVE SUMMARY Overview This report presents the results of the 2012
Exhibit 1 PLANNING COMMISSION AGENDA ITEM
 Exhibit 1 PLANNING COMMISSION AGENDA ITEM Project Name: Grand Junction Circulation Plan Grand Junction Complete Streets Policy Applicant: City of Grand Junction Representative: David Thornton Address:
The Florida Bicycle and Pedestrian Partnership Council
 The Florida Bicycle and Pedestrian Partnership Council Input to the Update of the Florida Transportation Plan March 2015 This document presents input from the Florida Bicycle and Pedestrian Advisory Council
BIKE PLAN CONTENTS GATEWAY
 CONTENTS Acknowledgments...vii Great Rivers Greenway District Board of Directors... vii Great Rivers Greenway District Staff... vii Project Consultants... vii Committees... viii Citizens Advisory Committee
Typical Rush Hour Commute. PennyforTransportation.com
 Typical Rush Hour Commute In the News Overview of the Plan Collaborative plan with projects in every community Prioritizing connectivity and congestion relief Dedicated transportation-specific funding;
ADOT Statewide Bicycle and Pedestrian Program Summary of Phase IV Activities APPENDIX B PEDESTRIAN DEMAND INDEX
 ADOT Statewide Bicycle and Pedestrian Program Summary of Activities APPENDIX B PEDESTRIAN DEMAND INDEX May 24, 2009 Pedestrian Demand Index for State Highway Facilities Revised: May 29, 2007 Introduction
RESOLUTION NO ?? A RESOLUTION OF THE CITY OF NEPTUNE BEACH ADOPTING A COMPLETE STREETS POLICY
 RESOLUTION NO. 2018-?? A RESOLUTION OF THE CITY OF NEPTUNE BEACH ADOPTING A COMPLETE STREETS POLICY WHEREAS, safe, convenient, and accessible transportation for all users is a priority of the City of Neptune
Solana Beach Comprehensive Active Transportation Strategy (CATS)
") Solana Beach Comprehensive Active Transportation Strategy (CATS) 3.0 Goals & Policies The Solana Beach CATS goals and objectives outlined below were largely drawn from the Solana Beach Circulation Element
Solana Beach Comprehensive Active Transportation Strategy (CATS) 3.0 Goals & Policies The Solana Beach CATS goals and objectives outlined below were largely drawn from the Solana Beach Circulation Element
Madison Urban Area and Dane County. Bicycle Transportation Plan Summary. September Introduction. Bicycle Plan Scope and Planning Process
 Bicycle Transportation Plan Summary Madison Urban Area and Dane County Introduction September 2000 Bicycling is an important mode of transportation in the Madison urban area and countywide that is available
PEDESTRIAN ACTION PLAN
 ATTACHMENT 2 CITY OF SANTA MONICA PEDESTRIAN ACTION PLAN CITY OF SANTA MONICA PEDESTRIAN ACTION PLAN This page intentionally left blank EXECUTIVE SUMMARY CHAPTER 1 EXECUTIVE SUMMARY Setting the Stage
CONNECTING PEOPLE TO PLACES
 CONNECTING PEOPLE TO PLACES 82 EAST BENCH MASTER PLAN 07 Introduction The East Bench transportation system is a collection of slow moving, treelined residential streets and major arteries that are the
CITY OF COCOA BEACH 2025 COMPREHENSIVE PLAN. Section VIII Mobility Element Goals, Objectives, and Policies
 CITY OF COCOA BEACH 2025 COMPREHENSIVE PLAN Section VIII Mobility Element Goals, Objectives, and Policies Adopted August 6, 2015 by Ordinance No. 1591 VIII MOBILITY ELEMENT Table of Contents Page Number
City of Novi Non-Motorized Master Plan 2011 Executive Summary
 City of Novi Non-Motorized Master Plan 2011 Executive Summary Prepared by: February 28, 2011 Why Plan? Encouraging healthy, active lifestyles through pathway and sidewalk connectivity has been a focus
Travel and Rider Characteristics for Metrobus
 Travel and Rider Characteristics for Metrobus 040829040.15 Travel and Rider Characteristics for Metrobus: 2012-2015 Overview The Miami Dade County Metropolitan Planning Organization (MPO) conducted a series
ACTIVE TRANSPORTATION
 ACTIVE TRANSPORTATION Mobility 2040 Supported Goals Improve the availability of transportation options for people and goods. Support travel efficiency measures and system enhancements targeted at congestion
Tulsa Metropolitan Area LONG RANGE TRANSPORTATION PLAN
 Tulsa Metropolitan Area LONG RANGE TRANSPORTATION PLAN Indian Nations Council of Governments August 2005 CONTACTING INCOG In developing the Destination 2030 Long Range Transportation Plan, INCOG s Transportation
METROPOLITAN TRANSPORTATION PLAN OUTREACH: INTERACTIVE MAP SUMMARY REPORT- 10/03/14
 METROPOLITAN TRANSPORTATION PLAN OUTREACH: INTERACTIVE MAP SUMMARY REPORT- 10/03/14 INTRODUCTION This document summarizes the results of the online interactive mapping exercise implemented by MIG for the
2016 Capital Bikeshare Member Survey Report
 2016 Capital Bikeshare Member Survey Report Prepared by: LDA Consulting Washington, DC 20015 (202) 548-0205 February 24, 2017 EXECUTIVE SUMMARY Overview This report presents the results of the November
INTRODUCTION. Specifically, the objectives are to:
 INTRODUCTION The River to Sea Transportation Planning Organization (TPO) conducts the Tell the TPO Transportation Trends Survey to better understand the transportation preferences and priorities for the
Perryville TOD and Greenway Plan
 Perryville TOD and Greenway Plan Greenway Glossary Pathway: A bicycle and pedestrian path separated from motorized vehicular traffic by an open space, barrier or curb. Multi-use paths may be within the
APPENDIX D. BICYCLE AND PEDESTRIAN AWARENESS SURVEY (Completed by Zogby International)
") APPENDIX D BICYCLE AND PEDESTRIAN AWARENESS SURVEY (Completed by Zogby International) Residents Views On Bicycling, Walking, and Jogging In Onondaga County Submitted to: Danielle Zebley Syracuse Metropolitan
APPENDIX D BICYCLE AND PEDESTRIAN AWARENESS SURVEY (Completed by Zogby International) Residents Views On Bicycling, Walking, and Jogging In Onondaga County Submitted to: Danielle Zebley Syracuse Metropolitan
EXECUTIVE SUMMARY: TRANSIT-ORIENTED DEVELOPMENT IN SMITHS FALLS, ONTARIO; A COMPARISON BETWEEN TWO SITES
 EECUTIVE SUMMARY: TRANSIT-ORIENTED DEVELOPMENT IN SMITHS FALLS, ONTARIO; A COMPARISON BETWEEN TWO SITES Topic and Purpose In 2007, the Mayor of Ottawa s Task Force on Transportation suggested adding a
City of Elizabeth City Neighborhood Traffic Calming Policy and Guidelines
 City of Elizabeth City Neighborhood Traffic Calming Policy and Guidelines I. Purpose: The City of Elizabeth City is committed to ensure the overall safety and livability of residential neighborhoods. One
Pinellas County Safety Initiatives
 Florida Department of TRANSPORTATION Pinellas County Safety Initiatives Whit Blanton, FAICP Pinellas County MPO A Distinctive County A unique geography Multi-jurisdictional Key demographics seniors and
MASTER BICYCLE AND PEDESTRIAN PLAN
 VILLAGE OF NORTHBROOK MASTER BICYCLE AND PEDESTRIAN PLAN DRAFT PLAN OPEN HOUSE May 2, 2018 AGENDA 1. Community Engagement 2. Vision and Goals 3. General Structure of Plan 4. Recommendations Overview 5.
TRANSPORTATION & MOBILITY
 TRANSPORTATION & MOBILITY ROADWAY SYSTEM There are approximately 40 miles of roadways in Manitou Springs. For planning purposes, roadways are typically assigned a functional classification which defines
Pinellas County Metropolitan Planning Organization (MPO) 2014 Crash Data Report
 2014 Crash Data Report") Pinellas County Metropolitan Planning Organization (MPO) 2014 Crash Data Report MPO Board July 8, 2015 2 Crash Data Collection Motorcycle drove between stopped cars, ran a red light and collided with a
Pinellas County Metropolitan Planning Organization (MPO) 2014 Crash Data Report MPO Board July 8, 2015 2 Crash Data Collection Motorcycle drove between stopped cars, ran a red light and collided with a
Chapter 7. Transportation. Transportation Road Network Plan Transit Cyclists Pedestrians Multi-Use and Equestrian Trails
 Chapter 7 Transportation Transportation Road Network Plan Transit Cyclists Pedestrians Multi-Use and Equestrian Trails 7.1 TRANSPORTATION BACKGROUND The District of Maple Ridge faces a number of unique
Rider Satisfaction Survey Phoenix Riders 2004
 Rider Satisfaction Survey Riders Prepared For: Valley Metro Spring 2720 E. Thomas Rd. Bldg. A, Arizona 85016-8296 602-707-0050 answers@westgroupresearch.com Valley Metro Rider Satisfaction Survey - Page
2010 Pedestrian and Bicyclist Special Districts Study Update
 2010 Pedestrian and Bicyclist Special Districts Study Update Pedestrian and Bicyclist Special Districts Program Overview H-GAC s Special Districts Program aims to provide strategic investments in pedestrian
CHAPTER 3: Vision Statement and Goals
 Davidson Walks & Rolls: Active Transportation Master Plan CHAPTER 3 Contents: Overview Vision Statement Measurable Goals Public Outreach CHAPTER 3: Vision Statement and Goals Overview The vision statement
Non-Motorized Transportation 7-1
 Non-Motorized Transportation 7-1 Transportation facilities no longer mean just accommodating a vehicle powered by a combustion engine. Pedestrian and non-motorized facilities are important modes of travel
Table of Contents Introduction. 2 Purpose of the Plan...2 The Benefits of Walking and Bicycling...3 Vision and Goals of the Plan...
 BICYCLE AND This plan was created through a grant from the Healthy Communities Program with the cooperation of the City of Cynthiana, Cynthiana Main Street, Cynthiana-Harrison County-Berry Joint Planning
Living Streets Policy
 Living Streets Policy Introduction Living streets balance the needs of motorists, bicyclists, pedestrians and transit riders in ways that promote safety and convenience, enhance community identity, create
CONNECTIVITY PLAN. Adopted December 5, 2017 City of Virginia Beach
 CONNECTIVITY PLAN Adopted December 5, 2017 City of Virginia Beach CONTENTS 1.0 Background & Purpose... 2 2.0 Existing Inventory & Analysis... 3 ViBe District Existing Walking Conditions... 4 3.0 ViBe District
BICYCLE FACILITIES & PROGRAMS
 CHAPTER 5 BICYCLE FACILITIES & PROGRAMS This component reviews existing bicycle facilities and issues associated with bicycling in the region. The chapter also presents the regional bicycle route system
MEMORANDUM. Charlotte Fleetwood, Transportation Planner
 MEMORANDUM Date: Updated August 22, 2017 To: Organization: Charlotte Fleetwood, Transportation Planner Boston Transportation Department From: Jason DeGray, P.E., PTOE, Regional Director of Engineering
Community & Transportation Preferences Survey
 Community & Transportation Preferences Survey Webinar: August 5, 2015 Hugh Morris, AICP, LEED Realtor.org Jennifer Dill, Ph.D. trec.pdx.edu 1 Introduction National Association of Realtors Over 1,000,000
o n - m o t o r i z e d transportation is an overlooked element that can greatly enhance the overall quality of life for the community s residents.
 N o n - m o t o r i z e d transportation is an overlooked element that can greatly enhance the overall quality of life for the community s residents. 84 Transportation CHAPTER 11 INTRODUCTION Transportation
TRAVEL PLAN: CENTRAL EUROPEAN UNIVERSITY CAMPUS REDEVELOPMENT PROJECT TRAVEL PLAN. Central European University Campus Redevelopment Project.
 TRAVEL PLAN Central European University Campus Redevelopment Project Page 1 Table of Contents Introduction... 3 Background... 7 Building Users... 7 Transportation in Community Consultation... 7 Summary
DRAFT. Table of Contents. Background
 Douglas County Table of Contents Existing Infrastructure 86 Funding 89 Policy and Program Recommendations 90 Infrastructure Recommendations 92 Conclusion 95 Background Home to 4,500 residents and Baker
2014 Fishers Trail Count
 2014 Fishers Trail Count July 2014 Table of Contents Introduction...1 Trail Count Locations...3 Ellipse Parkway at Holland Drive...4 Lantern Road at Sunblest Boulevard...5 126th Street at Cumberland Road...6
MTP BICYCLE ELEMENT UPDATE. November 2017
 MTP BICYCLE ELEMENT UPDATE November 2017 TIME FOR AN UPDATE Bicycle Element adopted in July 2008 Almost 10 years old Many planned facilities have been implemented 10 years more experience in planning,
Encouragement. Chapter 4. Education Encouragement Enforcement Engineering & Facilities Evaluation & Planning. Encouragement Chapter 4
 Encouragement Education Encouragement Enforcement Engineering & Facilities Evaluation & Planning Photo above: Children show off their ribbons at the Tour de Virginia Beach. Virginia Beach Bikeways and
Pennsylvania Avenue (CR 484) Design Alternatives Study
 Design Alternatives Study") MEMORANDUM Pennsylvania Avenue (CR 484) Design Alternatives Study Prepared for: APRIL 2016 Prepared By TABLE OF CONTENTS Project Background... 2 Previous Concept... 2 Existing Conditions... 4 New Alternatives...
MEMORANDUM Pennsylvania Avenue (CR 484) Design Alternatives Study Prepared for: APRIL 2016 Prepared By TABLE OF CONTENTS Project Background... 2 Previous Concept... 2 Existing Conditions... 4 New Alternatives...
EXECUTIVE SUMMARY. Vision
 Vision Walking and bicycling in Salt Lake City will be safe, convenient, comfortable, and viable transportation options that connect people to places, foster recreational and economic development opportunities,
Goodlettsville Bicycle and Pedestrian Plan Executive Summary
 Goodlettsville Bicycle and Pedestrian Plan July 2010 In Cooperation with the Nashville Area Metropolitan Planning Executive Organization Summary Introduction Progressive and forward thinking communities
Nanaimo Transportation Master Plan. Phase 1 Consultation Summary
 Nanaimo Transportation Master Plan Phase 1 Consultation Summary Transportation Advisory Committee Meeting Wednesday December 12, 2012 Agenda Study Update Phase 1 Consultation Process Phase 1 Consultation
Transportation Issues Poll for New York City
 2016-17 Transportation Issues Poll for New York City 82% support Vision Zero and reducing traffic deaths 72% on average, support more street space for children to play, protected bike lanes and other safety
Baseline Survey of New Zealanders' Attitudes and Behaviours towards Cycling in Urban Settings
 Baseline Survey of New Zealanders' Attitudes and Behaviours towards Cycling in Urban Settings Highlights 67% of urban New Zealanders, 18 years of age or more own or have access to a bicycle that is in
City of Cape Coral Traffic Calming. City Council May 16,
 City of Cape Coral Traffic Calming City Council May 16, 2016 1 In This Presentation Why Traffic Calming? What is Traffic Calming? Examples Traffic Calming in the City of Cape Coral How to develop a Traffic
NOTES FROM JUNIOR COUNCIL ORIENTATION SESSION HELD ON MONDAY, JANUARY 22, 2018, AT 3:30 PM IN COUNCIL CHAMBERS, CITY HALL
 CITY OF KAMLOOPS Junior Council Meeting Agenda March 12, 2018, at 3:30 pm in Council Chambers, 7 Victoria Street West, Kamloops, BC Page 1. APPROVAL OF THE AGENDA 2. MINUTES Attachment Recommendation:
FINAL PLAN APPENDIX D CITY OF BERKELEY BIKE PLAN D-1
 CITY OF BERKELEY BIKE PLAN D-1 . Proposed Programs D.1. EDUCATION This appendix presents the recommended bicycle-related programs for the City of Berkeley. The recommendations are organized in four E s:
Bike/Multipurpose Trail Study for Glynn County, Georgia MAY 16, 2016
 Bike/Multipurpose Trail Study for Glynn County, Georgia MAY 16, 2016 Agenda» Project Status Update» Draft Recommendations Overview» Next Steps» Questions/Discussion Project Overview» Comprehensive Bikeway
AGENDA ITEM G-2 Public Works
 AGENDA ITEM G-2 Public Works STAFF REPORT City Council Meeting Date: 12/6/2016 Staff Report Number: 16-214-CC Regular Business: Approve the Oak Grove University Crane Bike Improvement Concept Plan, authorize
Vision. Goals and Objectives. Walking
 Vision Walking and biking is an accepted and valued part of everyday life in Portsmouth. People of all ages and abilities include walking and biking as part of their daily activities which helps to make
Kelowna On the Move. Pedestrian and Bicycle Master Plan
 Kelowna On the Move Pedestrian and Bicycle Master Plan Executive Summary April 2016 Purpose of the Plan The Pedestrian and Bicycle Master Plan identifies infrastructure, planning, and policy requirements
EAST VILLAGE SHOPPERS STUDY A SNAPSHOT OF TRAVEL AND SPENDING PATTERNS OF RESIDENTS AND VISITORS IN THE EAST VILLAGE
 EAST VILLAGE SHOPPERS STUDY A SNAPSHOT OF TRAVEL AND SPENDING PATTERNS OF RESIDENTS AND VISITORS IN THE EAST VILLAGE CONTENTS 2 4 5 6 7 16 17 19 SUMMARY INTRODUCTION BACKGROUND METHODOLOGY RESULTS CONCLUSION
4 Goals, Objectives & Actions
 Chapter4 4 This chapter presents goals, objectives, and recommended actions to support the vision of making Overland Park a safer and easier place to ride a bicycle. 35 4.1 Recommendations Structure The
Transportation 2040 Update: Eudora Public Input As of June 1, 2017
 Transportation 2040 Update: Eudora Public Input As of June 1, 2017 Overview... 1 Survey Responses... 2 Overview The Lawrence Douglas County Metropolitan Planning Organization (MPO) is updating our long
Gordon Proctor Director Policy on Accommodating Bicycle and Pedestrian Travel on ODOT Owned or Maintained Facilities
 Approved: Policy: 20-004(P) Responsible Office: Planning Gordon Proctor Director Policy on Accommodating Bicycle and Pedestrian Travel on ODOT Owned or Maintained Facilities I. POLICY STATEMENT: This policy
TABLE OF CONTENTS. Executive Summary
 Executive Summary Background... ES-1 Pedestrian Network... ES-2 Bikeway Network... ES-2 Collision History... ES-2 Public Input... ES-4 Conclusions and Recommendations... ES-4 1. Introduction and Setting
NASHUA REGIONAL PLANNING COMMISSION REGIONAL BICYCLE AND PEDESTRIAN PLAN
 NASHUA REGIONAL PLANNING COMMISSION REGIONAL BICYCLE AND PEDESTRIAN PLAN June, 2005 Prepared by the Nashua Regional Planning Commission 2005 NRPC Regional Bicycle and Pedestrian Plan- JUNE 2005 ACKNOWLEDGEMENTS
East Burke Transportation, Safety and Capacity Improvements
 East Burke Transportation, Safety and Capacity Improvements The purpose of this project is to increase mobility and improve safety for pedestrians, cyclists, and motor vehicles along VT Route 114 in the
Sistrunk Corridor DOTMOCRACY SUMMARY
 DOTMOCRACY SUMMARY The TOUCH initiative is a true collaborative working with multi- sector community organizations and agencies to reduce tobacco use and exposure to secondhand smoke, improve access to
Engagement Summary: Round 1
 Engagement Summary: Round 1 June 21, 2018 REPORT FOR: City of Courtenay 830 Cliff Avenue Courtenay, BC V9N 2J7 PREPARED BY: Urban Systems Ltd. 550 1090 Home Street Vancouver, BC V6B 2W9 ALONG WITH: Kathleen
US 19 Pedestrian and Bicycle Safe Access to Transit Corridor Study
 US 19 Pedestrian and Bicycle Safe Access to Transit Corridor Study DRAFT Technical Memorandum #3 Active Bus Stop Review and Observations August 2016 Prepared for: FLORIDA DEPARTMENT OF TRANSPORTATION DISTRICT
CITY OF GRAND JUNCTION URBAN TRAILS COMMITTEE 2017 ANNUAL REPORT
 CITY OF GRAND JUNCTION URBAN TRAILS COMMITTEE 2017 ANNUAL REPORT INTRODUCTION INTRODUCTION Resolution No. 48 94 created the Grand Junction Trails Board in 1994 as a subcommittee of the Riverfront Commission
U.S. Bicycling Participation Study
 U.S. Bicycling Participation Study Report of findings from the 2016 survey Conducted by Corona Insights Commissioned by PeopleForBikes Released July 2017 Table of Contents Background and Objectives 3 Research
5. Pedestrian System. Accomplishments Over the Past Five Years
 5. Pedestrian System Accomplishments Over the Past Five Years The Alamo Area Metropolitan Planning Organization (MPO) and its partner agencies recognize the importance of improving pedestrian mobility.
EXCELLENCE. Executive Summary. Destination: 2014 Downtown Detroit Perceptions Survey
 Executive Summary Destination: EXCELLENCE 2014 Downtown Detroit Perceptions Survey Capturing the Voice of Detroit so we can continue to take giant leaps forward. 1 Executive Summary Overall Impressions
National Bicycle and Pedestrian Documentation Project INSTRUCTIONS
 National Bicycle and Pedestrian Documentation Project INSTRUCTIONS The National Documentation Project (NBPD) is an annual bicycle and pedestrian count and survey effort sponsored by the Institute of Transportation
Community Bicycle Planning
 Community Bicycle Planning City of Mentor s Bicycle Facility Plan Allen E. Pennington, P.E. Civil Engineer - Traffic Office of the Mentor City Engineer Why has Mentor participated in bicycle planning?
Proposed. City of Grand Junction Complete Streets Policy. Exhibit 10
 Proposed City of Grand Junction Complete Streets Policy Exhibit 10 1 City of Grand Junction Complete Streets Policy Vision: The Complete Streets Vision is to develop a safe, efficient, and reliable travel
1
 swadle@wichita.gov 1 I expect not only to take all of their [Seattle and Portland s] bikers but I also want all the jobs that come with this, all the economic growth that comes with this, all the opportunities
BICYCLE/PEDESTRIAN ACCESS TO TRANSIT SAFETY ASSESSMENT FOR EXISTING AND PLANNED SECTIONS OF US 19
 BICYCLE/PEDESTRIAN ACCESS TO TRANSIT SAFETY ASSESSMENT FOR EXISTING AND PLANNED SECTIONS OF US 19 Project Advisory Committee Meeting December 2, 2015 A JOINT EFFORT OF THE PINELLAS METROPOLITAN PLANNING
General Design Factors
 Chapter 3: 3-1.0 Introduction General Design Factors Mn/DOT s goals include encouraging and accommodating safe bicycling. From a design perspective, these goals are achieved by first having an understanding
Eliminate on-street parking where it will allow for a dedicated bus only lane %
 Traffic Dashboard Priorities Survey Responses Introduction 1) Are you familiar with bus rapid transit (BRT)? a. No, BRT is new to me. 597 23.5% b. I ve heard of BRT, but I don t know much about it. 1,136
Arlington s Master Transportation Plan
 Arlington s Master Transportation Plan The Master Transportation Plan (MTP) Adopted in eight parts Goals & Policies element and MTP Map adopted in 2007 Bicycle, Pedestrian and Demand and Systems Management
Planning Guidance in the 2012 AASHTO Bike Guide
 Planning Guidance in the 2012 AASHTO Bike Guide Presentation by: RJ Eldridge Peter Lagerwey August 22, 2012 WEBINAR 2: PLANNING GUIDANCE IN THE 2012 AASHTO BIKE GUIDE Today s Webinar Significant Updates
US 19 Pedestrian and Bicycle Safe Access to Transit Corridor Study
 US 19 Pedestrian and Bicycle Safe Access to Transit Corridor Study Summary Report October 2016 Prepared for: FLORIDA DEPARTMENT OF TRANSPORTATION DISTRICT 7 (FDOT) Contract No: C 9B41, FAP No: 8886 318
2017 Florida Commuter Transportation Summit
 2017 Florida Commuter Transportation Summit Building Bicycle Friendly Universities Ron Fuller, Assistant Director Transportation and Parking Services University of Florida Achieving the Silver Level a
University of Victoria Campus Cycling Plan Terms of Reference. 1.0 Project Description
 University of Victoria Campus Cycling Plan Terms of Reference 1.0 Project Description The Campus Cycling Plan, a first for the University, will provide a comprehensive and coordinated approach to support
Modal Shift in the Boulder Valley 1990 to 2009
 Modal Shift in the Boulder Valley 1990 to 2009 May 2010 Prepared for the City of Boulder by National Research Center, Inc. 3005 30th Street Boulder, CO 80301 (303) 444-7863 www.n-r-c.com Table of Contents
Proposed Amendment to the City-Wide Trails Plan
 Proposed Amendment to the City-Wide Trails Plan Planning and Zoning Commission June 23, 2015 Comprehensive Plan 2010 Sustainable Community Recommendations 2 Goal: Walking and Cycling are Encouraged throughout
PEDESTRIAN/BICYCLIST CRASH ANALYSIS 2015
 PEDESTRIAN/BICYCLIST CRASH ANALYSIS 2015 Central Arkansas Regional Transportation Study Table of Contents Executive Summary... 3 CARTS Pedestrian/Bicycle Crash Analysis... 3 Report Format... 3 Results...
MEETING OF THE CITY OF CONCORD BICYCLE, PEDESTRIAN AND SAFE ROUTES TO TRANSIT PLAN ADVISORY COMMITTEE AGENDA
 MEETING OF THE CITY OF CONCORD BICYCLE, PEDESTRIAN AND SAFE ROUTES TO TRANSIT PLAN ADVISORY COMMITTEE Monday, June 22, 2015 5:30 p.m., Regular Meeting PERMIT CENTER CONFERENCE ROOM 1950 Parkside Drive,
Active Transportation Infrastructure Investment A Business Case
 Active Transportation Infrastructure Investment A Business Case In 2016, the Real Estate Foundation awarded the Capital Regional District a $50,000 grant for Shifting Gears: Land Use Change through Active