Health impact assessment of cycling network expansions in European cities
|
|
|
- Jacob Lindsey
- 5 years ago
- Views:
Transcription

1 Mueller et al. forthcoming Under Review in Preventive Medicine Health impact assessment of cycling network expansions in European cities Natalie Mueller a,b,c,*, David Rojas-Rueda a,b,c, Maëlle Salmon a,b,c, David Martinez a,b,c, AlbertAmbros a,b,c, Christian Brand d, Audrey de Nazelle e, Evi Dons f, Mailin Gaupp-Berghausen g, Regine Gerike h, Thomas Götschi i, Francesco Iacorossi j, Luc Int Panis f,k, Sonja Kahlmeier i, Elisabeth Raser g, Mark Nieuwenhuijsen a,b,c, on behalf of the PASTA consortium

2 The problem Car-centric mobility plans Physical inactivity Greenhouse gas emissions High levels of air pollution High levels of noise pollution Traffic incidents with injury Space scarcity Disappearance of natural outdoor environments and eco-systems Economic issues Congestion costs Financing infrastructure

 non-emitting mode of transport However, well")
3 The solution?! Promoting a mode-shift to cycling Promising strategy to overcome aforementioned issues: Cycling can (1) provide transport, (2) increase physical activity (PA) levels and the bicycle is a (3) non-emitting mode of transport However, well designed and safe infrastructure is needed to promote a mode shift to cycling
 the cost-benefit tradeoff between cycling network expansions and economic benefits from avoided premature")
4 Specific objectives To assess (1) the association between cycling network (km) and cycling mode share (%) (2) how an increase in cycling mode share might alter expected premature mortality in terms of changes in PA, exposure to air pollution and the risk of fatal traffic incidents (3) the cost-benefit tradeoff between cycling network expansions and economic benefits from avoided premature mortality
5 Cycling infrastructure cycling mode share Link between cycling infrastructure and cycling mode share (Buehler & Pucher 2012, Schoner & Levinson, 2014, Buehler & Dill 2015, Marqués et al. 2015, Schoner et al. 2015) Exposure-response relationship is unknown in European cities Cycling network (km) Cycling mode share (%)?

 Amongst those 167 cities")
 Other 160")

 4) Spatial boundaries of administrative")
6 Data sources I Data on population size, cycling mode share and cycling network length for 167 cities located in 11 European countries ( ) Amongst those 167 cities were the 7 PASTA cities (Antwerp, Barcelona, London, Rome, Örebro, Vienna, Zurich) Other 160 cities were chosen based on 1) Geographic representativeness of Northern, Central, Southern Europe 2) Population size 100,000 people 3) Mode share (%) 4) Spatial boundaries of administrative municipality area
 Modal Split Tool")
 Cycling network length for all 167 cities")
 for the seven PASTA")
7 Data sources II Mode share (%) European Platform on Mobility Management (EPOMM) Modal Split Tool (TEMS) Cycling network length (km) OpenStreetMap (OSM) Cycling network length for all 167 cities Labels of designated, non-shared cycling ways Street network length (km) for the seven PASTA cities

 a is the")
8 Gompertz growth model Non-linear least square regression to calculate corresponding cycling mode share (%) a is the asymptote (i.e. maximal cycling mode share associated with cycling network) b sets the displacement along the x-axis c sets the displacement along the y-axis (i.e. growth rate) t is the cycling network (km/ 100,000 persons)

9 Counterfactual scenarios Scenario analyses S1 10% increase in cycling network S2 50% increase in cycling network S3 100% increase in cycling network S4 all streets of city with cycling ways


10 HIA model 25% 75% Car Public transport Bicycle + 10 min walk Walking 5 km 13 km/h Physical activity Air pollution cyclist Traffic fatalities Mortality
 Benefits Avoided premature deaths Value of Statistical Life ( 3.2 7.")
11 Cost-benefit analysis Costs 2 million per km (reconstructing road mixed traffic) 4,000 per km/ year for maintenance (Scheepers et al. 2015) Benefits Avoided premature deaths Value of Statistical Life ( million) 5-year buildup of health benefits 5% discounting rate Time horizon 30 years
12 Association between cycling network and cycling mode share A cycling network of 315 km/ 100,000 persons was associated with maximal cycling mode share of 24.7% (99.9% of asymptotic value) PASTA City Population Car (%) PT (%) Bike (%) Walk (%) Cycling km (OSM) Km/ 100,000 persons Street km (OSM) Km/ 100,000 persons Antwerp 493, Barcelona 1,620, London 8,673, Örebro 138, Rome 2,869, Vienna 1,797, Zurich 410,

13 Antwerp, Belgium
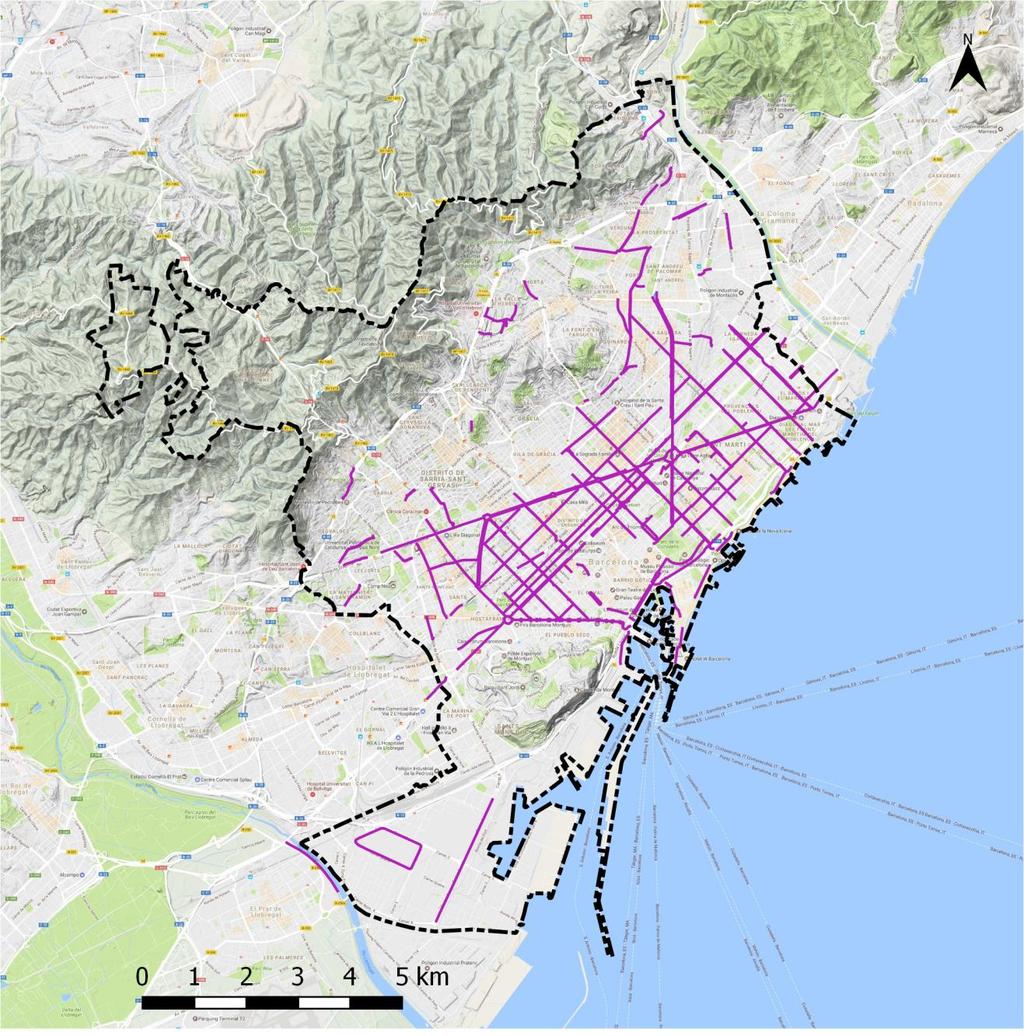
14 Barcelona, Spain

15 London, UK

16 Örebro, Sweden

17 Rome, Italy

18 Vienna, Austria
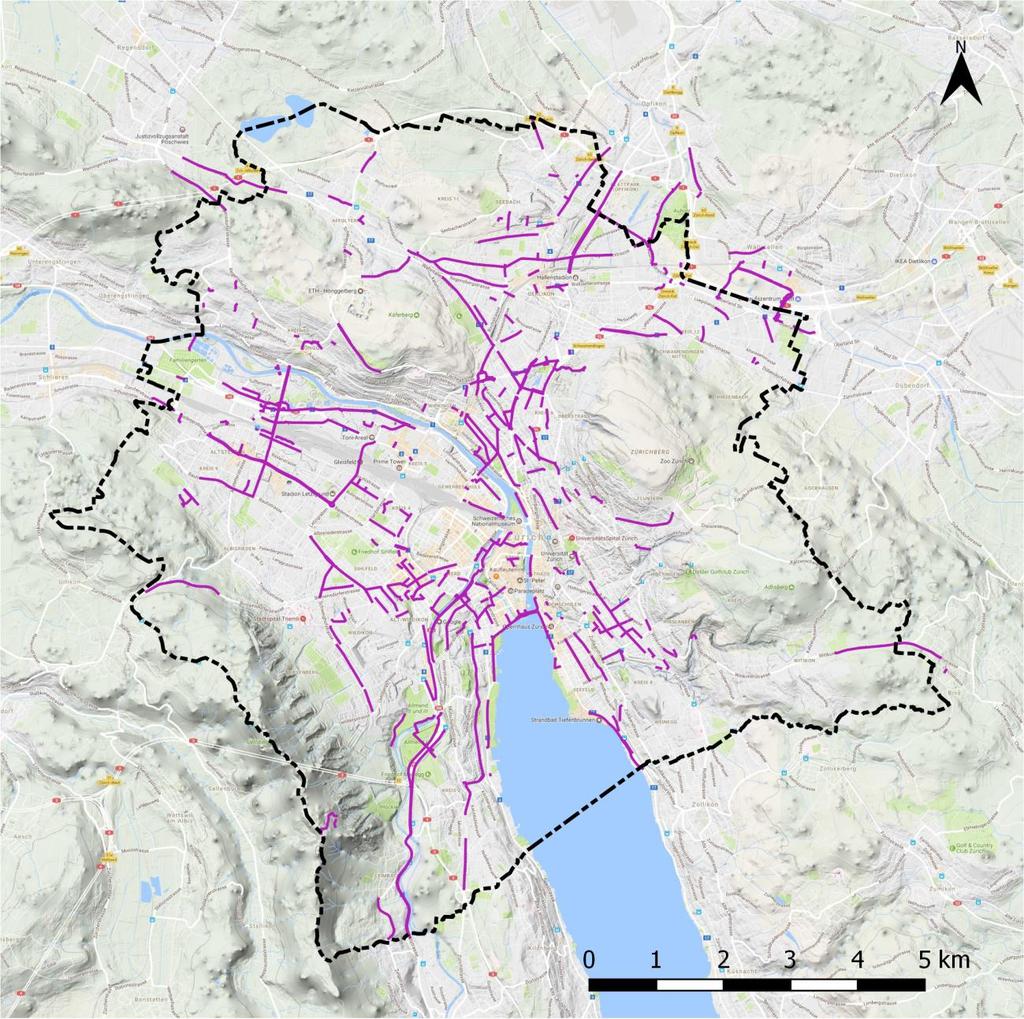
19 Zurich, Switzerland

20 Results Gompertz growth model
21 Antwerp Barcelona London Örebro Rome Vienna Zurich Premature mortality impacts Scenario Physical activity Air pollution Traffic fatalities Total deaths Total deaths (100,000) S1 10% 0 (0;0) 0 (0;0) 0 (0;0) 0 (0;0) 0 (0;0) S2 50% 0 (0;0) 0 (0;0) 0 (0;0) 0 (0;0) 0 (0;0) S3 100% -3 (-1;-4) 1 (0;1) 0 (-1;1) -2 (-1;-4) 0 (0;-1) S4 all streets -5 (-3;-6) 1 (1;1) 0 (-1;-2) -4 (-1;-6) -1 (0;-1) S1 10% -10 (-7;-13) 1 (1;2) 1 (-3;4) -8 (-3;-12) 0 (0;-1) S2 50% -15 (-11;-21) 2 (1;3) 1 (-4;6) -12 (-7;-19) -1 (0;-2) S3 100% -24 (-17;-32) 3 (2;4) 1 (-6;9) -20 (-12;-29) -1 (-1;-3) S4 all streets -152 (-112;-209) 20 (12;25) 8 (-40;57) -124 (-55;-192) -8 (1;-16) S1 10% -12 (-9;-17) 2 (1;2) 1 (-3;5) -9 (-4;-15) 0 (0;0) S2 50% -43 (-31;-59) 6 (4;8) 3 (-11;17) -34 (-14;-53) 0 (0;-1) S3 100% -84 (-62;-116) 12 (7;16) 6 (-21;33) -66 (-27;-105) -1 (0;-3) S4 all streets -806 (-594;-1116) 117 (68;149) 56 (-205;317) -633 (-262;-1004) -7 (13;-28) S1 10% 0 (0;0) 0 (0;0) 0 (0;0) 0 (0;0) 0 (0;0) S2 50% 0 (0;0) 0 (0;0) 0 (0;0) 0 (0;0) 0 (0;0) S3 100% 0 (0;0) 0 (0;0) 0 (0;0) 0 (0;0) 0 (0;0) S4 all streets 0 (0;0) 0 (0;0) 0 (0;0) 0 (0;0) 0 (0;0) S1 10% -14 (-11;-20) 3 (2;3) 1 (-4;5) -11 (-4; -18) 0 (0;-1) S2 50% -17 (-13;-24) 3 (2;4) 1 (-5;6) -13 (-5; -21) 0 (0;-1) S3 100% -21 (-16;-29) 4 (2;5) 1 (-6;8) -16 (-7;-26) -1 (0;-1) S4 all streets -292 (-215;-404) 55 (32;70) 12 (-82;106) -225 (-90;-360) -8 (5;-21) S1 10% -23 (-17;-32) 5 (3;6) 1 (-7;8) -17 (-7;-28) -1 (0;-2) S2 50% -43 (-31;-60) 9 (5;11) 1 (-13;15) -33 (-13;-53) -2 (1;-4) S3 100% -64 (-47;-89) 13 (8;17) 2 (-19;23) -49 (-19;-79) -3 (1;-6) S4 all streets -106 (-78;-148) 22 (13;28) 3 (-32;38) -81 (-32;-131) -5 (1;-11) S1 10% -5 (-4;-7) 1 (0;1) 0 (-1;2) -4 (-2;-7) -1 (0;-2) S2 50% -10 (-7;-13) 2 (1;2) 1 (-3;4) -7 (-3;-12) -2 (-1;-3) S3 100% -15 (-11;-21) 2 (1;3) 1 (-4;6) -12 (-5;-19) -3 (-1;-5) S4 all streets -34 (-25;-48) 5 (3;7) 2 (-9;13) -27 (-11;-43) -6 (-2;-11)
 could be avoided WHO study estimated 10,000 premature deaths preventable in 50 European cities under assumption that")
22 Rapid HIA for all 167 cities If all 167 cities with a total population of 75.2 million people, achieved a cycling mode share of 24.7% each year 14,500 premature deaths (95% CI: 5,316; 23,684) could be avoided WHO study estimated 10,000 premature deaths preventable in 50 European cities under assumption that Copenhagen cycling mode share (=26%) was achieved (WHO 2014)

23 Results cost-benefit analysis Cost-effective Largest cost-benefit ratios were found for 10% increase Non-linearity of exposure response relationship Rome 37:1 Zurich 28:1 Barcelona 18:1 Vienna 13:1 London 4:1 Antwerp Örebro S4 all streets: Cost-benefit ratios smaller Large amount of additional infrastructure Horizon of 30 years almost not being enough time to compensate


24 Conclusions PA benefits outweigh risks of traffic incidents and air pollution Cycling network expansions promising policy Cycling network cycling mode share Increase in cycling net health and economic benefits

25 Thank you!
What does active mobility mean for health? Lessons from health impact assessment
 What does active mobility mean for health? Lessons from health impact assessment Linking active Mobility & Health Linking active mobility and health is the key issue of the Physical Activity Through Sustainable
Active mobility and health: Insights from the PASTA Project
 Active mobility and health: Insights from the PASTA Project According to the PASTA survey, over 40% of car and public transport trips are less than 5km. Shifting such short trips to active mobility, such
Active Travel & Health
 Active Travel & Health Audrey de Nazelle APRIL meeting June 2017 Burden of disease from physical inactivity Coronary heart disease Type 2 diabetes Breast cancer Colon cancer All-cause mortality Global
SUSTAINABILITY, TRANSPORT, & HEALTH. Ralph Buehler, Virginia Tech
 SUSTAINABILITY, TRANSPORT, & HEALTH Ralph Buehler, Virginia Tech Prepared for National Academies Roundtable on Science and Technology for Sustainability 6 December 2013 Overview Trends in Motorization
Progetto P.A.S.T.A REGIO-MOB. Analisi delle buone pratiche di mobilità sostenibile
 Progetto P.A.S.T.A REGIO-MOB Analisi delle buone pratiche di mobilità sostenibile The role of the Mobility Agency The Agency manages the bus service contracts performed by ATAC, the PT Operator in charge
Exposure-adjusted fatality rates for cycling and walking in European countries
 Epidemiology, Biostatistics and Prevention Institute Exposure-adjusted fatality rates for cycling and walking in European countries Alberto Castro Sonja Kahlmeier Thomas Götschi University of Zurich, Epidemiology
Active mobility and health:
 Active mobility and health: Insights from the PASTA project Evi Dons, VITO, Belgium Thomas Götschi, UZH, Switzerland on behalf of the PASTA consortium This project has received funding from the European
Progetto P.A.S.T.A Physical activity through sustainable transport approaches. Incentivare il cambiamento comportamentale nella mobilità
 Progetto P.A.S.T.A Physical activity through sustainable transport approaches Incentivare il cambiamento comportamentale nella mobilità The role of the Mobility Agency The Agency manages the bus service
Sustainable Transport in Vienna
 Sustainable Transport in Vienna and Graz Banja Luka, 25 th of November, 2011 simone.feigl@global2000.at Need for Sustainable Transport Air Pollution Particulate matter CO 2 -emissions Limited Resources
Greenhouse gas emissions from transport have been rising and are expected to continue to rise both in higher & lower income countries.
 1 Greenhouse gas emissions from transport have been rising and are expected to continue to rise both in higher & lower income countries. Transport is seen as a hard area for mitigation 2 However, there
Erfurt, April
 Erfurt, 12.-13. April 2012 www.bicy.it www.bicy.it OVERALL GOAL: Increase & improve cycling in Central Europe Scope: Seven countries, 16 areas (14 cities), 3 years Diverse Strategy: Media, Resources, Events,
Parallel Workshop: Avoid
 Parallel Workshop: Avoid Vitoria-Gasteiz The commitment of a city towards active and sustainable mobility. Juan Carlos Escudero Environmental Studies Centre Vitoria-Gasteiz City Council A compact, diverse
Welcome Pre-conference Workshop Walk21, Vienna, 20 October 2015
 Welcome Pre-conference Workshop Walk21, Vienna, 20 October 2015 Measuring Walking (part VII): International Walking Data Standard and its benefit Daniel Sauter, Urban Mobility Research, Zurich, Switzerland
CYCLING & HEALTH. Randy Rzewnicki, PhD, Brussels, September 2013
 ECF gratefully acknowledges financial support from the European Commission. CYCLING & HEALTH Randy Rzewnicki, PhD, Randy@ecf.com Brussels, September 2013 In this presentation: 1. Health benefits of cycling
Canada. UK France. Walk, Bike, Transit Share of Trips
 1950s 1960s Today Relationship between Share of Urban Trips by Transit, Bicycle, and Foot and Per Capita Annual CO 2 Emissions from Road and Rail Transport in Australia, Canada, the USA and EU Countries,
Can PRT overcome the conflicts between public transport and cycling?
 Can PRT overcome the conflicts between public transport and cycling? J. Meggs, F. Rupi, J. Schweizer Università di Bologna - DICAM Abstract Personal Rapid Transit (PRT) offers exceptional service characteristics,
Valuing health benefits of cycling HEAT for Cycling workshops Benoit Blondel Policy Officer
 Valuing health benefits of cycling 2012 HEAT for Cycling workshops Benoit Blondel Policy Officer ECF? Over 70 members in 39 countries The European Cyclists Federation (ECF) is pledged to ensure that bicycle
Concept of Sustainable Transport and integrated Land Use Planning- An Overview. Manfred Breithaupt GIZ Water, Energy, Transport
 Concept of Sustainable Transport and integrated Land Use Planning- An Overview Manfred Breithaupt GIZ Water, Energy, Transport The adverse impacts of growth in motorization - in economic, environmental
Infrastructure and Programs. What does the data say? Advancing Non-motorized Transportation in Vermont 11/15/09
 Advancing Non-motorized Transportation in Vermont A reply from the university point of view Lisa Aultman-Hall Professor and Director Figure 4 Why Canadians Cycle more than Americans: A Comparative Analysis
Cycling, air pollution exposure & health An overview of research findings
 Cycling, air pollution exposure & health An overview of research findings Michael Brauer, Christie Cole The University of British Columbia School of Population and Public Health VeloCity 2012 June 27,
Konstantin Glukhenkiy Economic Affairs Officer
 Konstantin Glukhenkiy Economic Affairs Officer Rapid growth of urban areas Very rapid increase in motorisation Substantial increases in traffic congestion Relative decline of public transport usage and
Road safety and bicycle usage impacts of unbundling vehicular and cycle traffic in Dutch urban networks
 Road safety and bicycle usage impacts of unbundling vehicular and cycle traffic in Dutch urban networks Paul Schepers Ministry of Infrastructure and the Environment SWOV Institute for Road Safety Research
Cycling and Health. The Austrian Masterplan on Cycling. Promoting Cycling for Health, Environment and Quality of Life
 Cycling and Health The Austrian Masterplan on Cycling Promoting Cycling for Health, Environment and Quality of Life Content Physical Inactivity as a result of changing travel behaviour Promoting Cycling
Gdynia s bicycle model
 Gdynia s bicycle model Problems related to cycling network and demand modelling Michał Miszewski, city of Gdynia Development of tool for transport analysis - MST Statistical data (baseline and forecasts)
Behavioural Changes. Project Results: More cyclists + more train passengers = fewer car drivers
 Behavioural Changes Project Results: More cyclists + more train passengers = fewer car drivers Chiara Bresciani- Senior Researcher at Poliedra - Politecnico di Milano Improvement of BiTiBi Services Project
TRANSPORTATION TOMORROW SURVEY
 Clause No. 15 in Report No. 7 of was adopted, without amendment, by the Council of The Regional Municipality of York at its meeting held on April 17, 2014. 15 2011 TRANSPORTATION TOMORROW SURVEY recommends
THE PEP Partnership on Cycling
 THE PEP Partnership on Cycling Pan-European Master Plan for Cycling THE PEP Bureau Meeting, July 4 th /5 th, 2017 Robert Thaler Head of Division Mobility, Transport, Noise Austrian Federal Ministry of
VILNIUS SUMP. Gintarė Krušinskaitė International project manager place your logo here
 VILNIUS SUMP Gintarė Krušinskaitė International project manager Gintare.krusinskaite@vilniustransport.lt place your logo here 19 April, 2017 WHERE DID WE CAME FROM? Mobility management and mobility planning
SUSTAINABLE MOBILITY AND WEALTHY CITIES
 SUSTAINABLE MOBILITY AND WEALTHY CITIES CIVITAS Summer Course: Sustainable mobility for a better life 7 10 June 2016 Malaga, Spain Table of contents Theoretical section Introduction: sustainable mobility
Road Safety Initiatives at the International Transport Forum :
 Road Safety Initiatives at the International Transport Forum : IRTAD 2016 annual report Zero Road Deaths and Serious Injuries Report Safer City Streets Initiatives TRB Annual Meeting Joint IRTAD / NHTSA
Vision Zero Advocate Conference 2018
 Vision Zero Advocate Conference 2018 Pedestrian and Cyclist Safety in Toronto: From Evidence to Practice Kate Bassil Associate Director (A) Healthy Public Policy Toronto Public Health 1 Building Healthy
FASTER. EASIER. COOLER.
 FASTER. EASIER. COOLER. BiTiBi. The sole responsibility for the content of this publication etc lies with the authors. It does not necessarily reflect the opinion of the European Union. Neither the EASME
Capacity of transport infrastructure networks
 Most infrastructure extension work is concentrated on roads. The total length of the motorway network has increased dramatically during the past two decades (about 3 % per year). Construction of the high-speed
HEALTH ECONOMIC ASSESSMENT TOOL FOR WALKING & CYCLING. Luc Int Panis, Michelle Laeremans, Evi Dons & Jurgen Buekers
 HEALTH ECONOMIC ASSESSMENT TOOL FOR WALKING & CYCLING Luc Int Panis, Michelle Laeremans, Evi Dons & Jurgen Buekers VITO Not for distribution 28/02/2018 CYCLE HIGHWAY ACADEMY Essen 1 PASTA Physcial Activity
Relation between traffic safety and environmental protection
 Session II EEF.DEL/32/11 8 April 2011 ENGLISH only 19TH OSCE ECONOMIC AND ENVIRONMENTAL FORUM Promotion of common actions and co-operation in the OSCE area in the fields of development of sustainable energy
International cooperation to improve the safety of European pedestrian crossings
 International cooperation to improve the safety of European pedestrian crossings Francesco Mazzone Head of International Assessment Programmes ACI Automobile Club d Italia Polis Conference Barcelona, 25
DOE Climate Change Proposals
 DOE Climate Change Proposals Sustrans response to Proposals for Taking Forward NI Climate Change Legislation January 2016 About Sustrans Sustrans makes smarter travel choices possible, desirable and inevitable.
Estimating the Health Economic Benefits of Cycling
 *Manuscript 1 Estimating the Health Economic Benefits of Cycling Gerard Deenihan and Brian Caulfield 1 Department of Civil, Structural and Environmental Engineering Trinity College Dublin Dublin 2 Ireland
Transport statistics as exposure data in road safety analysis. Alexandre Santacreu 5 th ITF TRANSPORT STATISTICS MEETING, April 2018, Paris
 Transport statistics as exposure data in road safety analysis Alexandre Santacreu 5 th ITF TRANSPORT STATISTICS MEETING, 25-26 April 2018, Paris 2 International Traffic Safety Data and Analysis Group IRTAD
Safety in numbers What comes first safety or numbers? Jan Garrard School of Health and Social Development Deakin University
 Safety in numbers What comes first safety or numbers? Jan Garrard School of Health and Social Development Deakin University The safety in numbers theory As the number of cyclists increases, injury rates
Development, transport and traffic management in Copenhagen
 Development, transport and traffic management in Copenhagen / Mikkel Balskilde Hansen, Head of Traffic Unit The Technical and Environmental Administration 2. October 2017 Copenhagen facts INHABITANTS Municipality
Complete Streets 101: The Basics
 Complete Streets 101: The Basics Michigan Municipal League - Capital Conference March 21, 2017 Chip Smith, AICP - Senior Planner - Wade Trim Inc. and City Council member City of Ann Arbor 2017 MML Capital
Walking and Cycling Action Plan Summary. A Catalyst for Change The Regional Transport Strategy for the west of Scotland
 Walking and Cycling Action Plan Summary A Catalyst for Change The Regional Transport Strategy for the west of Scotland 2007-2021 Strathclyde Partnership for Transport Contents Purpose...2 Issues, Constraints
Congestion Management in Singapore. Assoc Prof Anthony TH CHIN Department of Economics National University of Singapore
 Congestion Management in Singapore Assoc Prof Anthony TH CHIN Department of Economics National University of Singapore anthonychin@nus.edu.sg Introduction 2 Introduction and What is Traffic Congestion?
Canada s Capital Region Delegation to the Velo-City Global 2010 Conference
 Canada s Capital Region Delegation to the Velo-City Global 2010 Conference Report of Findings from Visits, Meetings & Presentations In Amsterdam-Den Haag, Utrecht, Berlin & Copenhagen The Itinerary Copenhagen
Cycling policy of the Province of Groningen. Öresund som cykelregion Malmö 13th of December 2012
 Cycling policy of the Province of Groningen Öresund som cykelregion Malmö 13th of December 2012 Presentation by: COR VAN DER KLAAUW c.j.vander.klaauw@provinciegroningen.nl Presentation Facts & Figures
Cycling makes sense. Phillip Darnton Chairman, Cycling England
 Cycling makes sense Phillip Darnton Chairman, Cycling England Original budget 5 million p/a Increased to 140m over three years 2008-11 Funding directed to: - 18 cycling towns - Bikeability for every 10
Čezmejno sodelovanje mest Graz - Maribor. Projekt financira EU. Active Mobility - efficient and enjoyable Ljubljana, 2018 Karl Reiter, FGM-AMOR
 Čezmejno sodelovanje mest Graz - Maribor Projekt financira EU Leibnitz (AT), 12.000 inhabitants 5 min by bicycle 15 min by bicycle Exercise and health: Dose-Response Relationship The lower the starting
TomTom European Congestion Index
 TomTom European Congestion Index Disclaimer All copyrights, commercial rights, design rights, trademarks and other elements considered intellectual property that are published in this report are reserved
Dipl.-Ing. Thomas FISCHER Reggio Emilia, 22. October 2010
 Dipl.-Ing. Thomas FISCHER 2 Overview General data and statistics Planning principles Tempo 30/50 project Traffic Safety Activities 3 City of Graz European Cultural Capital City 2003 Area 127 km² ~ 255.000
European Commission Policy, Promotion & Funding for Cycling Madeleine Kelly-Tychtl Directorate-General for Mobility & Transport
 European Commission Policy, Promotion & Funding for Cycling Madeleine Kelly-Tychtl Directorate-General for Mobility & EC Policy 1. policy 2011 White Paper: Two urban mobility goals Ø Halve the use of conventionally
Stockholm City Bikes. OBIS final conference School of Architecture and the Built Environment
 Stockholm City Bikes OBIS final conference 2011-06-21 1 Stockholm City Bikes (SCB) Run by Clear Channel Outdoor street furniture with advertisement Service concession prolonged until 2017 Started in Sep
Making THE Link The Transport, Health and Environment Pan-European Programme (THE PEP)
") 17th European conference on mobility management Gävle, Sweden, 29 31 May 2013 Making THE Link The Transport, Health and Environment Pan-European Programme (THE PEP) Christian Schweizer World Health Organization
17th European conference on mobility management Gävle, Sweden, 29 31 May 2013 Making THE Link The Transport, Health and Environment Pan-European Programme (THE PEP) Christian Schweizer World Health Organization
8 TH INTERNATIONAL SCIENTIFIC CONFERENCE ON KINESIOLOGY. Opatija, Croatia, May 10 14, Proceedings. Editors-in-Chief
 1857 2017 8 TH INTERNATIONAL SCIENTIFIC CONFERENCE ON KINESIOLOGY 20 th Anniversary Opatija, Croatia, May 10 14, 2017 Proceedings Editors-in-Chief Dragan Milanović, Goran Sporiš, Sanja Šalaj and Dario
The Limassol SUMP Planning for a better future. Apostolos Bizakis Limassol, May 16, th Cyprus Sustainable Mobility and ITS conference
 The Limassol SUMP Planning for a better future Apostolos Bizakis Limassol, May 16, 2017 5 th Cyprus Sustainable Mobility and ITS conference Αbout Limassol Αbout Limassol The second largest city in Cyprus
The Nine Challenges for the Development of Transport in the Fast Growing Capital of Vietnam: Hanoi.
 The Nine Challenges for the Development of Transport in the Fast Growing Capital of Vietnam: Hanoi. Challenge 1:Economic growth Higher Incomes. More people can afford cars and motorbikes. In good old times
A District Council of the Urban Land Institute
 A District Council of the Urban Land Institute Thank you to our sponsors! A District Council of the Urban Land Institute Thank you to our Community Partners! A District Council of the Urban Land Institute
CITY PLANNING ADMINISTRATION. The walkable city. Michael Erman, City of Stockholm Vienna/CORP 2012, 15 May 2012
 CITY PLANNING ADMINISTRATION The walkable city the concept of Stockholm Michael Erman, City of Stockholm Vienna/CORP 2012, 15 May 2012 2012-06-18 SIDAN 2 Stockholm The capital of Scandinavia Stockholm
Economic Appraisal of Active Travel Schemes
 Economic Appraisal of Active Travel Schemes Practice and Guidance in the UK Philipp Thiessen and Robin Cambery 1 October 15 Appraisal 2 The Five-Case Business Case Financial Is it affordable? Strategic
TOWARDS A BIKE-FRIENDLY CANADA A National Cycling Strategy Overview
 TOWARDS A BIKE-FRIENDLY CANADA A National Cycling Strategy Overview NationalCyclingStrategFrameworkv3.indd 1 Potential for this modal shift can be found in municipalities of all sizes, in every population
York Scarborough Bridge Economic Appraisal Update Technical Note
 York Scarborough Bridge Economic Appraisal Update Technical Note Specification No. 1 Client name West Yorkshire Combined Authority Client reference M088 Discipline Transportation Project name CCAG2 Economics
ThinkBike Workshop. Los Angeles September 22-23, 2011
 September 22-23, 2011 The Experts Cor van der Klaauw Groningen Province Richard ter Avest Goudappel Coffeng Consultancy The Experts Tonny Bosch Goudappel Coffeng Consultancy Hillie Talens CROW Cycling
Michael Cramer MEP. Closing Plenary Velo-City Global. Cycling in Europe. Presentation by Michael Cramer Taipei, March 1 st 2016
 Michael Cramer MEP Closing Plenary Velo-City Global Cycling in Europe Presentation by Michael Cramer Taipei, March 1 st 2016 The fundamental problem in Europe without a change of mobility we will not stop
Willingness to Pay for Bike Detection Safety Systems: a European study
 Institute for Transport Studies FACULTY OF ENVIRONMENT Willingness to Pay for Bike Detection Safety Systems: a European study 7 th September 2018 Jeremy Shires, Eva Heinen & Dan Johnson PREMISE - CYCLING
Green mobility and traffic safety in Copenhagen
 Green mobility and traffic safety in Copenhagen / Steffen Rasmussen, Head of Projects City of Copenhagen The Technical and Environmental Administation 15 September 2018 Dramatic development over the last
RE-CYCLING A CITY: EXAMINING THE GROWTH OF CYCLING IN DUBLIN
 Proceedings ITRN2013 5-6th September, Caulfield: Re-cycling a city: Examining the growth of cycling in Dublin RE-CYCLING A CITY: EXAMINING THE GROWTH OF CYCLING IN DUBLIN Brian Caulfield Abstract In the
Sustainable urban mobility: challenges, trends & opportunities
 Sustainable urban mobility: challenges, trends & opportunities Jens Schippl (KIT- ITAS) EIONET Meeting on Transport and Environment, 24 May 2013, EEA Copenhagen INSTITUTE FOR TECHNOLOGY ASSESSMENT AND
outline 1. why cycle? 2. (safety health) 3. safe system 4. what next
 3. safe system 4. what next") outline 1. why cycle? 2. (safety health) 3. safe system 4. what next In a city of many cyclists, why do they ride? Copenhageners reasons for cycling to and from work (multiple answers) 56% it s faster
outline 1. why cycle? 2. (safety health) 3. safe system 4. what next In a city of many cyclists, why do they ride? Copenhageners reasons for cycling to and from work (multiple answers) 56% it s faster
Reducing the default speed limit in built-up areas: Highlighting the health benefits of 20mph
 Reducing the default speed limit in built-up areas: Highlighting the health benefits of 20mph Position Statement: Areas with slower vehicle speeds are associated with increased opportunities for walking
WORK-RELATED ROAD SAFETY
 WORK-RELATED ROAD SAFETY UGT DE CATALUNYA (labour union) Barcelona, 15 May 2014 VI INTERNATIONAL CONFERENCE ON EUROPEAN ROAD POLICIES UGT de Catalunya GENERAL CONSIDERATIONS ON MOBILITY: The current model,
Lessons from Copenhagen. John L Bowman 2013
 Lessons from Copenhagen John L Bowman 2013 Bicycle Strategy Official municipal policy Goals for the next 15 years Updated after 5-10 years 32 page glossy brochure BAC December 2, 2013 John L Bowman 2 Bicycle
Cycling the Danish way Workshop Euro Velo 3 St. James Way. Klaus Bondam, Director at The Danish Cultural Institute/Benelux Thursday December
 Cycling the Danish way Workshop Euro Velo 3 St. James Way Klaus Bondam, Director at The Danish Cultural Institute/Benelux Thursday December 8 2011 Our two main visions in Copenhagen Ecometropolis
Usage differences between bikes and e-bikes
 Usage differences between bikes and e-bikes Mobile Ghent 13 October 24 th 25 th 2013 Ghent, Belgium Dominik Allemann 1, Martin Raubal 1, Moritz Meenen 2 1 Institute of Cartography and Geoinformation, ETH
Healthy and Environmental Friendly Transport in the City Region
 Healthy and Environmental Friendly Transport in the City Region Reindert Augustijn Team manager traffic and transport Arnhem Nijmegen City Region www.polisnetwork.eu/2014conference #polis14 Fact and figures
Aalborg. T51.1 Cycle Motorway in Aalborg
 Aalborg T51.1 Cycle Motorway in Aalborg Aalborg Kommune August 2011 Project no. Project Name Start date of the Project Duration: Measure: Task: Deliverable: Due date of Deliverable: Actual 14 th August
 Supporting Policy and Action for Active Environments MEASURING THE VALUE OF AN URBAN ACTIVE ENVIRONMENT, USING THE WHO HEALTH ECONOMIC ASSESSMENT TOOL (HEAT) www.activeenvironments.eu Supporting Policy
Public Health in the Public Realm: Influencing Street Design with Health in Mind Dr. David McKeown Medical Officer of Health
 Public Health in the Public Realm: Influencing Street Design with Health in Mind Dr. David McKeown Medical Officer of Health Complete Streets Forum April 23, 2010 Common Goals of Public Health and Complete
Young Researchers Seminar 2009
 Young Researchers Seminar 2009 Torino, Italy, 3 to 5 June 2009 LOCALISATION OF SHOPPING MALLS IN SCANDINAVIA Planning regulations as a policy instrument for reducing greenhouse gas emissions Institute
Public Transport as a Necessity for Active Transport
 03.05.2017 Seite 1 Public Transport as a Necessity for Active Transport Manfred Breithaupt Urban Transport Consultant to GIZ Active Transport requires an attractive Public Transport System and its Integration
FAQ sheet Dutch Cycling Embassy
 FAQ sheet Dutch Cycling Embassy Table of Contents Benefits of cycling... 2 The development of cycling in the Netherlands... 3 Accident liability... 4 Bicycle parking in the Netherlands... 4 E-bike & Speed
ANNEX1 The investment required to achieve the Government s ambition to double cycling activity by 2025
 ANNEX1 The investment required to achieve the Government s ambition to double cycling activity by 2025 May 2016 About Sustrans Sustrans makes smarter travel choices possible, desirable and inevitable.
Speed Limits in the Hoddle Grid
 Speed Limits in the Hoddle Grid Recent History of speed limits March 2013 Docs # 7738485 1 Introduction Muncipalities have power to Erect speed limit signs BUT Municipalities DO NOT have the power to approve
Matt Dykstra PSU MGIS Program
 Matt Dykstra PSU MGIS Program Outline Background Objective Existing Research Methodology Conclusions Significance and Limitations Two-way cycle track: Streetsblog.org Background What is bicycle infrastructure?
FACTSHEET on Bike sharing and public bicycle system
 FACTSHEET on Bike sharing and public bicycle system This paper was prepared by: SOLUTIONS project This project was funded by the Seventh Framework Programme (FP7) of the European Commission www.uemi.net
Public transport and town planning from a retroactive point of view C. Wallstrom, S. Johansson et al
 Public transport and town planning from a retroactive point of view C. Wallstrom, S. Johansson et al The aim of this project is to estimate the effect of town planning on traffic volumes and modal split
Using parking policy and parking levies to tackle transport and environmental issues
 Using parking policy and parking levies to tackle transport and environmental issues Stephen Joseph, Chief Executive Campaign for Better Transport Campaign for Better Transport Charitable trust promoting
What s the issue for transport in Cardiff?
 Demand for travel The number of commuters travelling to work in Cardiff has increased from 190,000 in 2001 to 198,000 in 2010, with some 124,000 Cardiff residents travelling across the city daily to their
Impact Assessment of a new parking pricing scheme in Madrid City Centre
 Impact Assessment of a new parking pricing scheme in Madrid City Centre Andres Monzon Professor of Transportation Transport Research Centre Universidad Politecnica de Madrid Spain María E. López-Lambas,
Total 20 creating a paradigm shift
 Total 20 creating a paradigm shift Agenda Thanks to Transportation Alternatives 20 s Plenty for Us Why we need slower streets Establishment changes guidance Portsmouth UK s first 20mph city Successes around
reviewed paper REAL CORP 2017 Proceedings/Tagungsband September 2017
 reviewed paper Active Mobility the New Health Trend in Smart Cities, or even More? Sandra Wegener, Elisabeth Raser, Mailin Gaupp-Berghausen, Esther Anaya, Audrey de Nazelle, Ulf Eriksson, Regine Gerike,
European Golf Statistics 2017
 European Golf Statistics 2017 Leading the Business of Golf Photo by Aidan Bradley Distribution of registered golfers over the last year: Male golfers: 66% Female golfers: 25% Junior golfers: 9% Total number
Traffic calming. Joan DELORT i MENAL Manager of Prevention, Safety and Mobility Barcelona Municipality. Thursday 15 May 2014
 Plenari del Pacte per la Mobilitat 5 de març de 2014 Traffic calming Joan DELORT i MENAL Manager of Prevention, Safety and Mobility Barcelona Municipality Thursday 15 May 2014 1. The city 2 1.1. Barcelona,
Understanding the trip and user characteristics of the combined bicycle and transit mode
 Delft University of Technology Understanding the trip and user characteristics of the combined bicycle and transit mode Shelat, Sanmay; Huisman, R.; van Oort, Niels Publication date 2017 Document Version
University of Leeds Travel Plan
 University of Leeds Travel Plan 2015-2018 Contents 1: Introduction 1.1 What is a Travel Plan? 1.2 Why do we need one? 1.3 Sustainability Strategy 2: Overview 2.1 The bigger picture 2.2 The City scale 2.3
CIVITAS Peer to Peer Exercise in Reggio Emilia 11 November km zone: Reggio Emilia gets to know the experience of Odense and Vitoria-Gasteiz
 CIVITAS Peer to Peer Exercise in Reggio Emilia 11 November 2014 30 km zone: Reggio Emilia gets to know the experience of Odense and Vitoria-Gasteiz The City of Reggio Emilia Reggio Emilia is a medium sized
Cycling in the Netherlands The City and the region Utrecht
 Cycling in the Netherlands The City and the region Utrecht 8-5-2006 1 The ultimate European lesson? I think we need to make people aware that our traffic concepts of today are not sustainable and will
CPB. Exposure-Adjusted Road Fatality Rates for Cycling and Walking in European Countries Discussion Paper. Alberto Castro.
 CPB Exposure-Adjusted Road Fatality Rates for Cycling and Walking in European Countries Discussion Paper 168 Alberto Castro University of Zurich Sonja Kahlmeier University of Zurich Thomas Gotschi University
Building a sustainable world city: the role of transport and land use in London. London s relationship with transport
 Building a sustainable world city: the role of transport and land use in London Peter Wright Policy Manager, TfL Overview London s relationship with transport Past Current Future Questions? 1 London s
SUMP in Emilia Romagna Region and the national level»
 Local Public Transport and Sustainable Mobility Department SUMP in Emilia Romagna Region and the national level» Andrea Normanno Eleonora Tu SUMP in Europe: best practices and multi-level governance The
2 nd Road Safety PIN Conference 23 June 2008 Countdown to only two more years to act!
 2 nd Road Safety PIN Conference 23 June 2008 Countdown to 2010 - only two more years to act! EU ambition EU target to cut by 50% yearly road deaths between 2001 and 2010 Countries have similar national