International cooperation to improve the safety of European pedestrian crossings
|
|
|
- Donald Eaton
- 6 years ago
- Views:
Transcription


1 International cooperation to improve the safety of European pedestrian crossings Francesco Mazzone Head of International Assessment Programmes ACI Automobile Club d Italia Polis Conference Barcelona, 25 November 2008

2 Outline EuroTest Initiatives The Pedestrian Crossing Project - Test of pedestrian crossings - The awareness campaign 2
3 EuroTEST 18 automobile FIA clubs in 17 countries put Europe to the test for the mobile consumers A pan European independent testing programme Independent Assessments (Safety inspections) of quality and safety of Europe s mobility infrastructures and services Regular and consistent benchmarking to foster a more market driven and consumer oriented mobility infrastructure 3


4 EuroTEST and Road Safety Applying to road infrastructures the successful experience of EURONCAP Testing Informing Improving? 4


5 EuroTEST and Road Safety Testing Informing Improving 5
 Pedestrians account for 15% of all road fatalities Ordinary risk : in 30% of accidents involving a pedestrian and a car travelling at 40 km/h, the pedestrian will be killed Why a")
6 Why a project about pedestrian safety? Every day, almost 22 pedestrians are killed on European roads (about in EU-27) Pedestrians account for 15% of all road fatalities Ordinary risk : in 30% of accidents involving a pedestrian and a car travelling at 40 km/h, the pedestrian will be killed Why a project about pedestrian crossings? One in four of pedestrian fatalities occur on or close to pedestrian crossings (estimate ACI) It s a matter of behaviour, but safer crossings help better behaviours, and viceversa 6

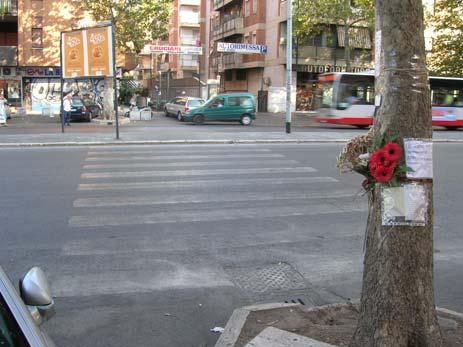
7 Some examples.. 7
8 Pedestrian Crossings Assessment Programme : : A three-year Programme -statistical analisys -rules for pedestrians/drivers -pedestrian crossing design -Observatory on Pedestrian fatalities -Test of Pedestrian Crossings in 17 European cities -Survey on pedestrian traffic lights in Europe -Awareness Campaign Walk safe : -Observatory on Pedestrian fatalities -Full-scale test of Pedestrian Crossings -Awareness Campaign Walk safe 8
9 Objectives To highlight the potential risk of using pedestrian crossings in the different countries. To make the users (drivers and pedestrian) aware of their obligations. To highlight, in each country, the best and the worst pedestrian crossing design. To draw the attention of European, national and regional authorities to the measures urgently required to reduce fatalities and accidents occurring on pedestrian crossings. 9

10 Pedestrian fatalities Observatory Pedestrians fatality rate per million of population, ,0 18,0 15,0 10,0 5,0 13,7 13,3 12,9 12,4 11,6 11,3 11,1 10,1 9,3 8,6 8,4 Average = ,4 5,8 4,0 0,0 Slovenia Spain Austria Italy Luxembourg Belgium Great Britain Denmark Switzerland Finland Germany France Norway Sweden Netherlands - The fatality rates are 4 times higher in Slovenia than in the Netherlands - Italy has the highest number of pedestrians killed on the roads (758 in 2006) - Better ranked countries in the pedestrian fatalities analysis (Netherlands, Sweden, Norway) are also the best ones when the overall road fatalities are compared. Thi applies also to the worst situations 10
11 6,0 4,0 2,0 0,0 4,1 Pedestrian fatality rates on pedestrian crossings Year ,4 3,4 3,3 2,7 Average = 2.3 1,9 1,8 1,8 1,5 1,4 1,1 1,0 11 Luxembourg Finland Norway Italy Switzerland Austria Denmark Sweden Germany Spain Great Britain Netherlands

![C Number of lanes [dir1] n [dir2] n 9.D Pedestrian conflict points n 9.E Pedestrian island / median Y N 9.](/docs-images/79/79459792/images/12-2.jpg "F Pedestrian island / median width (l) m Dir Side Dir Side Reference schema 1 (main elements and measurements of pedestrian crossing) Amsterdam Barcelona Berlin Bruxelles Copenhagen")
 - 12-15 crossings tested per each city, selected on the ground of traffic requirements - 140 km walked by two teams of three")
12 Test of pedestrian crossings 17 cities Not Signalized Pedestrian Crossing - Data Collection Form time City 1. Date: 2. Road Name: Intersection? Y N 3. Direction 1 Roundabout? Y N 4. Direction 2 n of approaches 7. Side A Photo 8. Side B Photo 9. Spatial and Temporal Design: 9.A Carriageway single dual 9.B Directions one way two-way 9.C Number of lanes [dir1] n [dir2] n 9.D Pedestrian conflict points n 9.E Pedestrian island / median Y N 9.F Pedestrian island / median width (l) m Dir Side Dir Side Reference schema 1 (main elements and measurements of pedestrian crossing) Amsterdam Barcelona Berlin Bruxelles Copenhagen Helsinki Ljubljana London Madrid Munich Oslo Paris Rome Stockholm Wien Zagreb Zurich - 17 Cities, 215 crossings, 2 checklists (with/without traffic lights) - Test Area defined on common criteria (tourism, traffic, dimensions, land-use) crossings tested per each city, selected on the ground of traffic requirements km walked by two teams of three ACI Inspectors - Daily test and night test performed for each city - Test stage: 2 July 23 September
13 The methodology Developed in cooperation with University La Sapienza of Rome 22 Safety factors selected from a detailed literature review grouped into 4 Safety categories (Spatial and temporal design, daylight visibility, night-time visibility, Accessibility) Weighting process based on crosscomparison submitted to a qualified focus group (Analytical Hierarchy Process) Validation of the results with in-depth investigation data records 4 safety indicators (one for each safety category), one overall indicator 13

14 The evaluation process Not Signalized Pedestrian Crossing - Data Collection Form Single crossings 1. Date: time City 2. Road Name: Intersection? Y N 3. Direction 1 Roundabout? 4. Direction 2 Y N n of approaches 7. Side A Photo 8. Side B Photo 9. Spatial and Temporal Design: 9.A Carriageway single dual 9.B Directions one way two-way 9.C Number of lanes [dir1] n [dir2] n 9.D Pedestrian conflict points n 9.E Pedestrian island / median Y N 9.F Pedestrian island / median width (l) m Dir Side Dir Side Reference schema 1 (main elements and measurements of pedestrian crossing) From the inspections to the single results Qualitative evaluation for each safety category (very good to very poor) Qualitative overall evaluation Pictures supporting the single evaluation Pedestrian Crossing 1 2a 2b 3a 3b a b LONDON Spatial and OVERALL Visibility DAYTIME Visibility NIGHTTIME Accessibility Temporal Design EVALUATION Poor Very Good Good Good Good o Acceptable Very Good Good Good Good Good Very Good Good Good Good o + Good Very Good Good Acceptable Good + Good ++ 7Very Good + Good + Good + Good Good Very Good Very Good Very Good Very Good o Acceptable Very Good Good Good Good o Acceptable Very Good Very Good Good Good o 9 Acceptable o Acceptable - Poor o Acceptable - Poor o o + Acceptable Very Good Very Good Acceptable Good Good Very Good Very Good Good Very Good o Acceptable Very Good Good Poor Good o Acceptable Very Good Good Good Good o ++ + o + Acceptable Very Good Good Acceptable Good ALL PEDESTRIAN o CROSSING Acceptable Very Good Good Good Good City results City ranking Best and worst crossings Main deficiencies detected 14
15 The test results 28 crossings out of 215 (one in 8) failed the test, achieving a poor rating. Just more than half crossings (118) were rated positively. Only two crossings earned a very good rating. 69 crossings were considered Acceptable. Worst crossing found in Brussels (the European Capital!), the best one in London. In Rome the least accessible crossings. Number of crossing and rating classes Overall results 100% n. of crossings 80% 60% 40% 20% 0% Overall rating Spatial and temporal design Visibility Daytime Visibility Night time Accessibility ++ + o
16 The city comparison Number of crossings and rating groups o n. crossings London Oslo Copenaghen Amsterdam Helsinki Paris Stockholm Wien Zagreb Zurich Barcelona Ljubljana Berlin Madrid Munich Rome Brussels


17 Keyword: Improving! The comparison among different situations is aimed at fostering improvements. 17

18 The results variability A marked finding of this survey was the very wide degree of variation in the quality of the pedestrian crossings examined in each city, as reflected in the range of ratings given. This was mainly due to the presence of obstacles reducing the visibility even in the well designed layouts! 18


19 The main deficiences Pedestrian phases at traffic lights, missing refuge islands (Spatial and Temporal Design) Parked vehicles behind crossings, reduced sight distance for the turning vehicles (Daylight Visibility and Nighttime Visibility) Lighting conditions and road marking visibility at night (Night-time Visibility) Obstacles reducing accessibility to visually impaired and disabled users (Accessibility) Limited adoption of advanced technology (intelligent pedestrian traffic lights, countdown devices, smart lighting systems, etc.) 19


 Different design standards (parking bans behind")
20 The pan-european crossings In Germany zebra crossings are not adopted In some Spanish cities zebra crossing are being deleted at signalized pedcross In Switzerland yellow zebra markings are used Different solutions for pedestrian traffic lights (colours and more ) Different Behavioural rules (eg: right of way on crossings) Different design standards (parking bans behind crossings) 20
")

21 Available deliverables Overall ranking (215 crossings) Ranking for each safety indicator City outline with strenghts and weaknesses Complete city dossiers for each tested city (single crossing results and pictures) Recommendations fo authorities on how to make safer crossings Report on pedestrian traffic lights (colours, exclusive phases, transition times, mandatory red, etc.). Top 10 Ranking City ID crossing Spatial and temporal design Daylight visibility Nighttime visibility Accessibility Overall rating 1 London London Berlin 07 o Zurich 01 o Wien 06 o London 06 o London 03b London 09 o o + 9 Ljubljana London 07 o Spatial and Worst ten Daylight Nighttime City ID crossing temporal Accessibility Overall rating Ranking visibility visibility design 206 Copenaghen o Madrid 09 o Berlin 09 o - -- o Amsterdam Berlin 11 o Brussels o Munich Brussels Brussels Brussels


22 The awareness campaign Walk safe 22


23 The pedestrian safety leaflet Developed by the ACI with the cooperation of all the 18 EuroTEST partners On-going translation in 12 languages Behavioural tips beyond the single national rules Specific sections targeted to: pedestrians, pedestrians crossing the road, drivers Information section on very important figures (Did you know?) Key tips. 23


24 Some key tips 24

: safer crossings save lives Behavioral aspects should be targeted with growing")
25 Conclusions Excellent experience of international cooperation aimed at improving pedestrian safety Large room for improvement of pedestrian crossings (visibility and accessibility as key issues!): safer crossings save lives Behavioral aspects should be targeted with growing intensity (Walk Safe Campaign) Common behavioral rules to be adopted Europe wide 25
26 Thank you! Francesco Mazzone EuroTest links:
Francesco Mazzone, Enrico Pagliari, Antida Aversa ACI Automobile Club of Italy
 EPCA Programme: the evaluation of pedestrian crossing safety Annual Polis Conference Innovation in Transport for Sustainable Cities and Regions Brussels, 29 and 30 November 2011 Francesco Mazzone, Enrico
Pedestrian crossings survey in Europe
 Pedestrian crossings survey in Europe Introduction The issue of accidents on pedestrian crossings is highly emotional and raises a very strong interest within the public opinion and the media, mainly because
2 nd Road Safety PIN Conference 23 June 2008 Countdown to only two more years to act!
 2 nd Road Safety PIN Conference 23 June 2008 Countdown to 2010 - only two more years to act! EU ambition EU target to cut by 50% yearly road deaths between 2001 and 2010 Countries have similar national
THE PEP Partnership on Cycling
 THE PEP Partnership on Cycling Pan-European Master Plan for Cycling THE PEP Bureau Meeting, July 4 th /5 th, 2017 Robert Thaler Head of Division Mobility, Transport, Noise Austrian Federal Ministry of
IMPROVING THE SAFETY OF NON-MOTORIZED ROAD USERS
 XII International Symposium "ROAD ACCIDENTS PREVENTION 2014" Hotel Jezero, Borsko Jezero, 09 th and 10 th October 2014. UDK: IMPROVING THE SAFETY OF NON-MOTORIZED ROAD USERS Aversa Antida a a ACI - Automobile
Country fact sheet South Korea
 ESRA results Country fact sheet South Korea The ESRA project is a joint initiative of research institutes in 25 countries aiming at collecting comparable national data on road users opinions, attitudes
TomTom European Congestion Index
 TomTom European Congestion Index Disclaimer All copyrights, commercial rights, design rights, trademarks and other elements considered intellectual property that are published in this report are reserved
Summer Study: Europe. A look at European hotel performance during summer 2017 (June - August) Key Findings
 Key Findings") Summer Study: Europe A look at European hotel performance during summer 2017 (June - August) Key Findings - This was the strongest summer overall for European hotels dating back to 2000 - with record-breaking
Summer Study: Europe A look at European hotel performance during summer 2017 (June - August) Key Findings - This was the strongest summer overall for European hotels dating back to 2000 - with record-breaking
CEDR N5 Improvements in the field of Road Safety New trends in member states Road Safety strategies
 CEDR N5 Improvements in the field of Road Safety New trends in member states Road Safety strategies CEDR Strategic Plan 2013-2017 TD3 Network Management Thorshavn, Faroe Islands, March 30th 2016 Auður
THE PEP Partnership on Cycling Pan-European Master Plan for Cycling
 THE PEP Partnership on Cycling Pan-European Master Plan for Cycling International Cycling Conference, Mannheim, September 2017 THE PEP Relay Race Robert Thaler Head of Division Mobility, Transport, Noise
Transport statistics as exposure data in road safety analysis. Alexandre Santacreu 5 th ITF TRANSPORT STATISTICS MEETING, April 2018, Paris
 Transport statistics as exposure data in road safety analysis Alexandre Santacreu 5 th ITF TRANSPORT STATISTICS MEETING, 25-26 April 2018, Paris 2 International Traffic Safety Data and Analysis Group IRTAD
Road Safety Attitudes and Perceptions of Pedestrians in Europe
 Athens, Greece April 23-26 2012 Transport Research Arena Europe 2012 Road Safety Attitudes and Perceptions of Pedestrians in Europe E. Papadimitriou a, A. Theofilatos a, G. Yannis a, G.M. Sardi b, R. Freeman
EVENT LOCATION DATE. Training Course 2 London 19 June. Study Club Clinical Topic High Wycombe 24 June
 United Kingdom. Training Course 2 London 19 June Study Club Clinical Topic High Wycombe 24 June MasterClass (carried from previous year) London 26 June Training Course 2 London 26 June MasterClass (carried
Road Safety Pledge. Route to vision zero 2050 in Europe The Hague, June 14th, Malta. Luxembourg Lithuania Latvia Italy
 Malta Luxembourg Lithuania Latvia Italy Ireland The Netherlands Sweden Spain Slovenia Slovakia Romania Portugal Poland 1965 Road Safety Pledge Route to vision zero 2050 in Europe The Hague, June 14th,
Road Safety Vademecum
 Road Safety Vademecum Road safety trends, statistics and challenges in the EU 2010-2013 March, 2014 European Commission DG for Mobility and Transport Unit C.4 Road Safety Contents Summary of findings...
outline 1. why cycle? 2. (safety health) 3. safe system 4. what next
 3. safe system 4. what next") outline 1. why cycle? 2. (safety health) 3. safe system 4. what next In a city of many cyclists, why do they ride? Copenhageners reasons for cycling to and from work (multiple answers) 56% it s faster
outline 1. why cycle? 2. (safety health) 3. safe system 4. what next In a city of many cyclists, why do they ride? Copenhageners reasons for cycling to and from work (multiple answers) 56% it s faster
ROAD TRAFFIC SAFETY IN BELARUS CURRENT SITUATION
 ROAD TRAFFIC SAFETY IN BELARUS CURRENT SITUATION Yuri VAZHNIK ian Association of Transport Experts and Surveyors BAES ian National Technical University Dzmitri NAVOI State Automobile Inspection of Ministry
Relation between traffic safety and environmental protection
 Session II EEF.DEL/32/11 8 April 2011 ENGLISH only 19TH OSCE ECONOMIC AND ENVIRONMENTAL FORUM Promotion of common actions and co-operation in the OSCE area in the fields of development of sustainable energy
Country fact sheet Germany
 Country fact sheet Germany ESRA 2015 results The ESRA project is a joint initiative of research institutes in 17 European countries aiming at collecting comparable national data on road users opinions,
OLDER PEOPLE INDEPENDENT MOBILITY FOR LIVEABLE COMMUNITIES. Christopher G B (Kit) Mitchell
 Mitchell") OLDER PEOPLE INDEPENDENT MOBILITY FOR LIVEABLE COMMUNITIES by Christopher G B (Kit) Mitchell Independent mobility is necessary for a high quality of adult life In developed countries, the automobile has
OLDER PEOPLE INDEPENDENT MOBILITY FOR LIVEABLE COMMUNITIES by Christopher G B (Kit) Mitchell Independent mobility is necessary for a high quality of adult life In developed countries, the automobile has
Road Safety in Sweden and the Effect of Speed on Safety
 Road Safety in and the Effect of Speed on Safety Göran Nilsson Dr. Eng. Swedish Road and Transport Research Institute-VTI Abstract has one of the best traffic safety situation in the developed countries.
El progreso hacia el objetivo europeo de reducción de la accidentalidad. Resultados del 3er informe PIN
 El progreso hacia el objetivo europeo de reducción de la accidentalidad Resultados del 3er informe PIN Presentation outline Introduce ETSC and its PIN programme Present some of the findings of our new
BLACK SPOTS MANAGEMENT - SLOVENIAN EXPERIENCE
 BLACK SPOTS MANAGEMENT - SLOVENIAN EXPERIENCE PhD Marko Renčelj, Assoc. Prof. Matjaž Šraml, University of Maribor, Faculty for Civil Engineering X International Symposium "ROAD ACCIDENTS PREVENTION 2010"
SUSTAINABILITY, TRANSPORT, & HEALTH. Ralph Buehler, Virginia Tech
 SUSTAINABILITY, TRANSPORT, & HEALTH Ralph Buehler, Virginia Tech Prepared for National Academies Roundtable on Science and Technology for Sustainability 6 December 2013 Overview Trends in Motorization
Traffic Safety Basic Facts Main Figures. Traffic Safety Basic Facts Road Safety. Urban Areas. Country Overview.
 Traffic Safety Basic Facts 2013 - Main Figures Traffic Safety Basic Facts 2015 Road Safety Urban Areas Country Overview Lithuania Structure and Culture Basic Data Lithuania has a low population density.
OECD employment rate increases to 68.4% in the third quarter of 2018
 Paris, 17th January 2019 News Release: 3rd Quarter 2018 OECD employment rate increases to 68.4% in the third quarter of 2018 The OECD area employment rate the share of the working-age population with jobs
BUILDING THE CZECH ROAD SAFETY OBSERVATORY
 BUILDING THE CZECH ROAD SAFETY OBSERVATORY Jiří Ambros Centrum dopravního výzkumu, v.v.i. (Transport Research Centre) Czech Republic jiri.ambros@cdv.cz Abstract The main purpose of SENZOR project is to
Traffic Safety Basic Facts Main Figures. Traffic Safety Basic Facts Road Safety. Urban Areas. Country Overview.
 Traffic Safety Basic Facts 2013 - Main Figures Traffic Safety Basic Facts 2015 Road Safety Urban Areas Country Overview Latvia Structure and Culture Basic Data 67,4% of Latvian population lives inside
Capacity of transport infrastructure networks
 Most infrastructure extension work is concentrated on roads. The total length of the motorway network has increased dramatically during the past two decades (about 3 % per year). Construction of the high-speed
Complete Streets 101: The Basics
 Complete Streets 101: The Basics Michigan Municipal League - Capital Conference March 21, 2017 Chip Smith, AICP - Senior Planner - Wade Trim Inc. and City Council member City of Ann Arbor 2017 MML Capital
EMPHASIS AREA 1: PEDESTRIANS
 EMPHASIS AREA 1: PEDESTRIANS A pedestrian is seriously injured or killed every 3 days on Toronto s roads. Pedestrian collisions involve any person that is not riding in a vehicle or on a bicycle. 26% OF
IMPLEMENTATION PROCESS OF DIRECTIVE 2008/96/EC IN SLOVENIA
 IMPLEMENTATION PROCESS OF DIRECTIVE 2008/96/EC IN SLOVENIA Zvonko Zavasnik, MSc IMPLEMENTATION PROCESS non-automatic process, transpose the substance, not literally, EU Directive Correlation table Correlation
Time series of Staff PPPs
 Luxembourg, 28 August 2013 Unit C3 A64/13/12 Meeting of the Working Group on Article 64 of the Staff Regulations Luxembourg, 27 th September 2013 Bech Building Room "Ampère" 9.30 a.m. Time series of Staff
Traffic Safety Basic Facts Main Figures. Traffic Safety Basic Facts Junctions
 Traffic Safety Basic Facts 2013 - Main Figures Traffic Safety Basic Facts 2016 Junctions General In 2014, about 26.000 people were killed in road accidents throughout the EU; at least 5.000 of whom were
ThinkBike Workshop. Los Angeles September 22-23, 2011
 September 22-23, 2011 The Experts Cor van der Klaauw Groningen Province Richard ter Avest Goudappel Coffeng Consultancy The Experts Tonny Bosch Goudappel Coffeng Consultancy Hillie Talens CROW Cycling
1) No through traffic except for pedestrians, cyclists or pedestrian and cyclists.
 No through traffic except for pedestrians, cyclists or pedestrian and cyclists.") THE PEP Proposed changes for road signs and signals in the Vienna Convention to make it easier to increase walking and cycling Benoît Hiron Cerema, July the 2nd 2017-07-02 Considering that many countries
THE PEP Proposed changes for road signs and signals in the Vienna Convention to make it easier to increase walking and cycling Benoît Hiron Cerema, July the 2nd 2017-07-02 Considering that many countries
Road Safety Initiatives at the International Transport Forum :
 Road Safety Initiatives at the International Transport Forum : IRTAD 2016 annual report Zero Road Deaths and Serious Injuries Report Safer City Streets Initiatives TRB Annual Meeting Joint IRTAD / NHTSA
Traffic Safety Basic Facts Main Figures. Traffic Safety Basic Facts Road Safety. Urban Areas. Country Overview.
 Traffic Safety Basic Facts 2013 - Main Figures Traffic Safety Basic Facts 2015 Road Safety Urban Areas Country Overview Ireland Structure and Culture Basic Data The Irish population is younger than the
Measuring road congestion. Panayotis CHRISTIDIS, J. Nicolás IBAÑEZ RIVAS
 Measuring road congestion Panayotis CHRISTIDIS, J. Nicolás IBAÑEZ RIVAS JRC - 2012 The mission of the JRC-IPTS is to provide customer-driven support to the EU policymaking process by developing science-based
An International Experience on the Safety Performance of 2+1 cross-section. Basil Psarianos Nat l Techn. Univ. Athens, Greece
 An International Experience on the Safety Performance of 2+1 cross-section Basil Psarianos Nat l Techn. Univ. Athens, Greece bpsarian@mail.ntua.gr What is a 2+1 cross-section? It s a 3 lane rural road
The revival of wolves and other large predators and its impact on farmers and their livelihood in rural regions of Europe
 The revival of wolves and other large predators and its impact on farmers and their livelihood in rural regions of Europe John D. C. Linnell Norwegian Institute for Nature Research 1 Structure of the Presentation
Accident Causation Analysis and the Evaluation of the Safety Benefits of Technologies: The TRACE Project
 Accident Causation Analysis and the Evaluation of the Safety Benefits of Technologies: The TRACE Project On Behalf of the TRACE Consortium Yves Page, LAB PSA / Renault, France Michael Stanzel, Volkswagen,
Child- and Youth-friendly Land-use and Transport Planning Guidelines
 Child- and Youth-friendly Land-use and Transport Planning Guidelines Richard Gilbert Centre for Sustainable Transportation (In April 2006, the Centre moved from Toronto, Canada, to the University of Winnipeg)
AREA TOTALS OECD Composite Leading Indicators. OECD Total. OECD + Major 6 Non Member Countries. Major Five Asia. Major Seven.
 Reference series Composite leading indicators OECD Composite Leading Indicators AREA TOTALS 7-03- 19 OECD Total 19 OECD + Major 6 Non Member Countries 19 Major Seven 19 Major Five Asia 19 Euro area 19
Innovation in Transport for Sustainable Cities & Regions. Road Safety & Vulnerable Road Users
 Annual Polis Conference 29 th 30 th November 2012 Perugia Italy Innovation in Transport for Sustainable Cities & Regions Road Safety & Vulnerable Road Users Safer Mobility for Elderly Road Users Paul Mathieson
Analyses and statistics on the frequency and the incidence of traffic accidents within Dolj County
 UNIVERSITY OF PITESTI SCIENTIFIC BULLETIN Faculty of Mechanics and Technology AUTOMOTIVE series, year XXIV, no. 28 Analyses and statistics on the frequency and the incidence of traffic accidents within
11 November 2016, Nyon, Switzerland. 2016/17 UEFA European Women s Under-17 and Women s Under-19 Championships. Elite round draws
 11 November 2016, Nyon, Switzerland 2016/17 UEFA European Women s Under-17 and Women s Under-19 Championships Elite round draws DRAW PROCEDURE Elite rounds 10th UEFA European Women s Under-17 and 16 th
EuroRAP 2009 Results. Murska Sobota. Gornja Radgona. Lendava Ljutomer. Slovenj Gradec. Maribor. Ptuj. Ormož. Jesenice Velenje. Slovenska.
 Gornja Radgona Murska Sobota Slovenj Gradec Maribor Lendava Ljutomer Jesenice Velenje Slovenska Ptuj Ormož Tolmin Kranj Celje Trbovlje LJUBLJANA Litija Nova Gorica Idrija Krško Trebnje Novo mesto Postojna
Marcus Jones, TRL. Presented by Name Here Job Title - Date
 Segregation Insert the title and of priority your at presentation junctions: a here discussion Marcus Jones, TRL Presented by Name Here Job Title - Date Background: TfL cycle facility trials Infrastructure
The Vision Zero Swedish parliament (1997)
") TMALL 0141 Presentation v 1.0 2018-03-19 How close to zero car fatalities can we get? Prepared by: Matteo Rizzi Presented by: Anders Lie Gordon Moore in 1965 said; "Change will never be this slow again"
TMALL 0141 Presentation v 1.0 2018-03-19 How close to zero car fatalities can we get? Prepared by: Matteo Rizzi Presented by: Anders Lie Gordon Moore in 1965 said; "Change will never be this slow again"
Road User Behaviour WP4
 SafetyCube Safety CaUsation, Benefits and Efficiency Road User Behaviour WP4 Road user behaviour WP4 Contributing partners 1 Objectives Main objective of SafetyCube is to create a repository of estimates
ROSEE Road safety in Sout East European regions: Safe Road Infrastructure
 ROSEE Road safety in Sout East European regions: Safe Road Infrastructure Kostanjsek, Jure; Lipar, Peter; Milotti, Alberto 2014 European Workshop: Road Safety Design InternationalActivities Brussels, November
IGU. Immediate Challenges for Clean and Affordable Gas Mobility in Europe IGU WGCPARIS2015. Eugene Pronin Gazprom export LLC, IGU WOC
 Immediate Challenges for Clean and Affordable Gas Mobility in Europe WGCPARIS2015 WORLD GAS CONFERENCE Eugene Pronin Gazprom export LLC, WOC 1 The Plan Triennium Working Program WOC 5 (Utilization of Gas)
ITS for the safety of vulnerable road users. Johan Scholliers, VTT
 ITS for the safety of vulnerable road users Johan Scholliers, VTT Brussels, 11 February 2014 Main Project Objectives 1. Assess societal impacts of selected ITS, and provide recommendations for policy and
Contents. List of Map. What s New in Europe 1. Planning Your Trip to Europe 3
 Contents List of Map viii What s New in Europe 1 1 Planning Your Trip to Europe 3 1 Visitor Information...............6 2 Entry Requirements & Customs......9 3 Money.......................11 4 When to
European Golf Statistics 2017
 European Golf Statistics 2017 Leading the Business of Golf Photo by Aidan Bradley Distribution of registered golfers over the last year: Male golfers: 66% Female golfers: 25% Junior golfers: 9% Total number
CHECKLIST 4: PRE-OPENING STAGE AUDIT
 CHECKLIST 4: PRE-OPENING STAGE AUDIT 4.1 General topics 4.1.1 Changes since previous audit; translation of design into practice General check: have any matters that have changed since a previous audit
The EuroRAP Journey Success is a journey, not a destination
 Success is a journey, not a destination EuroRAP began as an idea in 1999 to address the unnecessary and preventable toll of death and serious injury on Europe s roads. Within the Safe System approach,
Road Safety Trends, Targets and Safety Programs in New Zealand. by Dr Shane Turner
 Road Safety Trends, Targets and Safety Programs in New Zealand by Dr Shane Turner New Zealand Kiwi s vs Aussies Outline Land transport organisations NZ & US crash/accident trends NZ safety targets & priorities
Operation and safety of tramways in interaction with public space. COST Action TU1103 «STATE OF THE ART» On behalf of the action: Matus Sucha
 Operation and safety of tramways in interaction with public space COST Action TU1103 «STATE OF THE ART» On behalf of the action: Matus Sucha Introduction The COST Action TU1103 deals with the improvement
SMART CITIES & MOBILITY AS A SERVICE
 , SMART CITIES & MOBILITY AS A SERVICE EFFECTIVENESS OF INTELLIGENT SPEED ADAPTATION, COLLISION WARNING AND ALCOLOCK SYSTEMS ON DRIVING BEHAVIOUR AND SAFETY ATHANASIOS THEOFILATOS 1, RICARDO NIEUWKAMP
Key fields for RRSS 7/6/2009
 Support for Implementing Measures for the South East Core Regional Transport Network Multi Annual Plan (EuropeAid/125783/C/SER/MULTI) The 4 approach to the road safety The basis of the Regional Road Safety
Traffic Safety Basic Facts 2012
 Roads outside urban areas During the last decade, more than 206000 people died in accidents on roads outside urban areas (53% of all road traffic fatalities). More than 206.000 people were killed in traffic
NEW COMMERCIAL VEHICLE REGISTRATIONS EUROPEAN UNION 1. July and August 2017
 PRESS EMBARGO: NEW COMMERCIAL VEHICLE REGISTRATIONS EUROPEAN UNION 1 July and August 2017 Next press release: Tuesday 24 October 2017 1 Data for Malta unavailable Page 1 of 12 Commercial vehicle registrations:
PIN Flash 18 - Background tables
 PIN Flash 18 - Background tables Definition of deaths on urban/rural rural roads How the urban/rural distinction is made in the statistics that your country provides to CARE CARE Deaths on rural roads
Risk and Safety Assessment on Road Infrastructure. Olivera Djordjevic
 Risk and Safety Assessment on Road Infrastructure Olivera Djordjevic This presentation: How we score what we score Informed Investments Decisions: Safer Roads Investments Plans How it matters best case
PUBLIC INQUIRY QUESTION
 M4 Corridor around Newport PUBLIC INQUIRY QUESTION REFERENCE NO. : PIQ/091 RAISED BY: Tim Gent of St Modwens DATE: 09/05/2017 RESPONDED BY: Bryan Whittaker and Stephen Bussell DATE: 15/05/2017 SUBJECT:
24 November 2017, Nyon, Switzerland. 2017/18 UEFA European Women s Under-17 and Women s Under-19 Championships. Elite round draws
 November 07, Nyon, Switzerland 07/8 UEFA European Women s Under-7 and Women s Under-9 Championships Elite round draws DRAW PROCEDURE Elite rounds th UEFA European Women s Under-7 and 7th UEFA Women s Under-9
RUE DE L AVENIR FRANCE TRAFFIC CALMING IN FRANCE. MAKING CITIES WALKABLE: the French case RUE DE L AVENIR FRANCE
 ICTCT WORKSHOP OLOMOUC 26-27/10/2017 ANNE FAURE, Created in 1988 after a context of cities dominated by car objective of 70s to adapt the cities to cars but to protect vulnerable users? The 80s : new way
2015 Victorian Road Trauma. Analysis of Fatalities and Serious Injuries. Updated 5 May Page 1 of 28. Commercial in Confidence
 2015 Victorian Road Trauma Analysis of Fatalities and Serious Injuries Updated 5 May 2016 Page 1 of 28 Commercial in Confidence VICROADS_n3445896_2015_Victorian_Trauma_Report_- _updated_may_2016.docx 2015
Introduction Methodology Study area and data collection Results and recommendation Conclusion References
 Introduction Methodology Study area and data collection Results and recommendation Conclusion References It is formal procedure for assessing accident potential and safety performance in the provision
Traffic Safety Basic Facts Main Figures. Traffic Safety Basic Facts Road Safety. Urban Areas. Country Overview.
 Traffic Safety Basic Facts 2013 - Main Figures Traffic Safety Basic Facts 2015 Road Safety Urban Areas Country Overview Luxembourg Structure and Culture Basic Data Luxembourg has one of the highest GDPs
SPORTS PARTICIPATION CHANGES IN LONDON FOLLOWING LONDON 2012 WITH NATIONAL AND INTERNATIONAL COMPARISONS
 SPORTS PARTICIPATION CHANGES IN LONDON FOLLOWING LONDON 2012 WITH NATIONAL AND INTERNATIONAL COMPARISONS Prepared by: James Skinner Chris Gratton Loughborough University in London Institute for Sport Business
2015/16 UEFA European Women s Under-17 and Women s Under-19 Championships Elite round draws
 2015/16 UEFA European Women s Under-17 and Women s Under-19 Championships Elite round draws 13 November 2015, Nyon, Switzerland DRAW PROCEDURE Elite rounds UEFA European Women s Under-17 and Women s Under-19
NZ Transport Agency Cycling Rules
 NZ Transport Agency Cycling Rules https://www.nzta.govt.nz/walking-cycling-and-public-transport/cycling/for-peopl e-involved-in-cycling-programmes-and-projects/cycling-resources-and-research/ General regulatory
The experience of Spain in reducing road deaths in urban areas
 The experience of Spain in reducing road deaths in urban areas PIN Talk in Cyprus How to improve urban road safety Cyprus, 19 March 2015 Álvaro Gómez Méndez Deputy Directorate General for Statistics Analysis
Architecture - the Market
 2 Architecture - the Market Architect: Ibelings van Tilburg architecten Project: De Karel Doorman Winner of the BNA Building of the Year 2013 Public Prize Photographer: Ossip van Duivenbode Place: Rotterdam
Canada s Capital Region Delegation to the Velo-City Global 2010 Conference
 Canada s Capital Region Delegation to the Velo-City Global 2010 Conference Report of Findings from Visits, Meetings & Presentations In Amsterdam-Den Haag, Utrecht, Berlin & Copenhagen The Itinerary Copenhagen
Traffic Safety Basic Facts 2010
 Overall frequencies On ROU areas frequencies Roads During the last decade, more than 174000 people died in accidents on roads (54% of all road traffic fatalities). More than 174.000 people were killed
RIGHT-OF-WAY INTERSECTIONS
 Infrastructure Give Cycling a Push INFRASTRUCTURE/ INTERSECTSIONS AND CROSSINGS RIGHT-OF-WAY INTERSECTIONS Overview Right-of-way mixed traffic is the simplest, most agreeable approach for cyclists on quiet
INTERSECTION SAFETY RESEARCH IN CRACOW UNIVERSITY OF TECHNOLOGY
 12 Marian TRACZ, Andrzej TARKO, Stanislaw GACA Cracow University of Technology INTERSECTION SAFETY RESEARCH IN CRACOW UNIVERSITY OF TECHNOLOGY 1. Trends in traffic safety in Poland Research activity in
DEVELOPMENT AID AT A GLANCE
 DEVELOPMENT AID AT A GLANCE STATISTICS BY REGION 5. EUROPE 2018 edition All the data in this report are available at: http://www.oecd.org/dac/financing-sustainable-development/ 5.1. ODA TO EUROPE - SUMMARY
Beer statistics edition. The Brewers of Europe
 Beer statistics 2017 edition The Brewers of Europe Beer statistics 2017 edition The Brewers of Europe December 2017 ISBN 978-2-9601382-9-0 EAN 9782960138290 1 TABLE OF CONTENTS Foreword by President
Vägbelysning Del 2: Krav på prestanda. Road lighting Part 2: Performance requirements
 SVENSK STANDARD SS-EN 13201-2 Fastställd 2003-12-12 Utgåva 1 Vägbelysning Del 2: Krav på prestanda Road lighting Part 2: Performance requirements ICS 93.080.40 Språk: engelska Publicerad: januari 2004
Walking and urban planning. Maurizio TIRA Environmental Engineer, Full Professor of Town and regional planning Università degli Studi di Brescia
 Walking and urban planning Environmental Engineer, Full Professor of Town and regional planning Università degli Studi di Brescia The presentation analyses the main obstacles to walking and shows how planning
ROAD SAFETY AUDIT IN THE CZECH REPUBLIC
 ROAD SAFETY AUDIT IN THE CZECH REPUBLIC Petr Pokorný Centrum dopravního výzkumu, v.v.i. Transport Research Centre, www.cdv.cz Estimated average annual percentage change in road deaths over the period 2001-2007
Road Safety Sicherheit im Straßenverkehr Seguridad Vial Sécurité Routière Sicurezza Stradale Segurança Rodoviária. English
 Road Safety Sicherheit im Straßenverkehr Seguridad Vial Sécurité Routière Sicurezza Stradale Segurança Rodoviária English teacher s notes page 1 Road Safety This unit is designed to complement work on
Road traffic accidents in European urban areas
 1 st European Road Infrastructure Congress 18-20 October 2016 Leeds, United Kingdom Road traffic accidents in European urban areas Robert Bauer a1, Klaus Machata a, Christian Brandstaetter a George Yannis
Traffic Safety Basic Facts 2008
 Urban road fatalities were reduced by more than 29% between 1997 and 2006. In 2006, more than 8.100 persons died in road accidents inside urban areas in the EU-14. This corresponds to 33,2% of all the
Heavy Goods Vehicles and Buses
 Traffic Safety Basic Facts 2013 - Main Figures Traffic Safety Basic Facts 2015 Heavy Goods Vehicles and Buses General More than 4.000 people died in road accidents involving HGVs in 2013. Heavy Goods Vehicles
Appendix Urban Change in Western Europe, : Statistical Background
 Appendix Urban Change in Western Europe, 1 945-80: Statistical Background ...
Traffic Safety Basic Facts 2012
 Urban areas Fatalities on urban roads were reduced by 39% between 2001 and 2010. In 2010, about 10.830 people died in traffic accidents on urban roads in the EU-19. This corresponds to 38% of all road
Bathing water results 2010 Romania
 Bathing water results 2010 Romania 1. Reporting and assessment This report gives a general overview of bathing water quality in Romania during the 2010 bathing season. Romania reported eight parameters
Traffic Safety Basic Facts Main Figures. Traffic Safety Basic Facts Road Safety. Urban Areas. Country Overview.
 Traffic Safety Basic Facts 2013 - Main Figures Traffic Safety Basic Facts 2015 Road Safety Urban Areas Country Overview Bulgaria Structure and Culture Basic Data In Bulgaria, the GDP per capita and the
Traffic Safety Basic Facts 2010
 Pedestrians In 2008 7,491 pedestrians were killed in road traffic accidents in the EU-23, which is 20.4 % of all fatalities. In the last decade, pedestrian fatalities have reduced by 25.2%, while the total
About RSMA. About ERF
 About ERF Non-profit association established in 1998 Represents road infrastructure sector More than 50 members Road equipment manufacturers (barriers, markings, signs, ITS) Construction companies National
Road accidents. Year 2015 Provisional data
 21 22 23 24 25 26 27 28 29 21 211 212 213 19 July 216 Year Provisional data Well ahead of the traditional dissemination timing, Istat provides provisional data on road, including information on road category
Traffic Safety Basic Facts 2011
 Urban areas Fatalities on urban roads were reduced by 32% between 2000 and 2009. In 2009, about 12.300 people died in traffic accidents on urban roads in the EU-19. This corresponds to 38% of all road
154074/EU XXV. GP. Eingelangt am 14/09/17 PE-CONS 25/1/17 REV 1 EUROPEAN UNION. Strasbourg, 13 September 2017 (OR. en) PE-CONS 25/1/17 REV 1
 PE-CONS 25/1/17 REV 1") 154074/EU XXV. GP Eingelangt am 14/09/17 EUROPEAN UNION THE EUROPEAN PARLIAMT THE COUNCIL Strasbourg, 13 September 2017 (OR. en) 2016/0186 (COD) LEX 1754 PE-CONS 25/1/17 REV 1 CULT 69 AELE 49 EEE 27 CODEC
154074/EU XXV. GP Eingelangt am 14/09/17 EUROPEAN UNION THE EUROPEAN PARLIAMT THE COUNCIL Strasbourg, 13 September 2017 (OR. en) 2016/0186 (COD) LEX 1754 PE-CONS 25/1/17 REV 1 CULT 69 AELE 49 EEE 27 CODEC
10/27/2009. Small Roundabout: Single-Lane-Circle (35 45 m diameter) Mini Roundabout: Single-Lane-Circle (13 22 m diameter) 1. Types of roundabouts
 Mini Roundabout: Single-Lane-Circle (13 22 m diameter) 1. Types of roundabouts") Support for Implementing Measures for the South East Core Regional Transport Network Multi Annual Plan (EuropeAid/125783/C/SER/MULTI) Roundabouts - the safer intersection solution Overview about the presentation
Support for Implementing Measures for the South East Core Regional Transport Network Multi Annual Plan (EuropeAid/125783/C/SER/MULTI) Roundabouts - the safer intersection solution Overview about the presentation