Transport statistics as exposure data in road safety analysis. Alexandre Santacreu 5 th ITF TRANSPORT STATISTICS MEETING, April 2018, Paris
|
|
|
- Letitia Mason
- 5 years ago
- Views:
Transcription
1 Transport statistics as exposure data in road safety analysis Alexandre Santacreu 5 th ITF TRANSPORT STATISTICS MEETING, April 2018, Paris

2 2 International Traffic Safety Data and Analysis Group IRTAD IRTAD-LAC
3 3 Understanding the differences between road safety performance in UK & NL NL / UK fatalities per unit population +36%
4 4 Understanding the differences between road safety performance in UK & NL NL / UK fatalities per unit population +36% fatalities per unit traffic +39%
5 5 Understanding the differences between road safety performance in UK & NL NL / UK fatalities per unit population +36% fatalities per unit traffic +39% pedestrian fatalities per unit distance walked -55%
6 6 Understanding the differences between road safety performance in UK & NL NL / UK fatalities per unit population +36% fatalities per unit traffic +39% pedestrian fatalities per unit distance walked -55% cycling fatalities per unit distance cycled -56% Sources: ITF IRTAD annual report, ITF Cycling Safety Roundtable, DfT Reported Road Casualties Great-Britain 2016
7 7 Cycling exposure and risk by country Country Distance cycled per year per inhabitant (km) Cycling fatalities per year per million inhabitant Cycling fatalities per billion km cycled Austria 223 (2014) 5.4 ( ) 24 Belgium 279 (2009) 6.5 ( ) 24 Denmark 547 (2013) 5.0 ( ) 9 Finland 267 (2011) 4.2 ( ) 16 France 88 (2008) 2.4 ( ) 28 Germany 439 ( ) 4.8 ( ) 11 Ireland 103 ( ) 1.9 ( ) 18 Italy 89 ( ) 4.5 ( ) 51 Netherlands 891 ( ) 7.4 ( ) 8 Norway 255 (2014) 2.0 ( ) 8 Sweden 199 (2014) 2.3 ( ) 12 Switzerland 262 ( ) 4.1 ( ) 16 United Kingdom 83 ( ) 1.8 ( ) 21 USA 48 (2009) 2.4 ( ) 49 Source: adapted from Castro and Götschi (2018), ITF (2013) and ITF IRTAD database

8 Cycling fatalities ( ) per billion kilometre cycled 8

9 9 A question endorsed by the ITF IRTAD group Subgroup on risk exposure data How to collect comparable exposure data, and especially passenger mobility data by mode? Most active members Belgium, Canada, Germany, Finland, France, Greece, Ireland, Korea, Netherlands, UK, USA
10 Belgium Finland France Germany Great Britain Greece Israel Korea Netherlands Sweden Total Pilot survey responses 10 Data source / Dataset Mobility National Travel Survey National Mobility Panel Traffic Traffic Counts Technology Traffic Volume Statistics Vehicle Inspection Data Mileage Survey 1 1 Vehicles Vehicle Registration and Insurance Data Vehicle Fleet data 1 1 People Population and commuters data Driving licenses data Driving test statistics 1 1 Other Crowd sourcing (apps, cellular/bluetooth signals, etc.) Road Length 1 1 Total
11 11 Mobility Countries are replacing face-2-face interviews with telephone or web interviews > how many short trips are being lost in the process? Belgium: NTS 2017 has information on crashes. Germany/Netherlands have two surveys: a classic (cross-sectional) NTS a longitudinal mobility panel
 in European countries")
12 12 National Travel Surveys (NTS) in European countries (2013)
13 13 COST SHANTI Survey Harmonisation with New Technologies Improvement Published 2014 Cost Action TU0804 Contact: Jimmy Armoogum, IFSTTAR
14 14 COST SHANTI Analysis of different methodology of national travel survey in Europe Towards Comparable Passenger Travel Statistics in Europe - Recommendations for Obtaining Comparable Results from National Travel Surveys Post-harmonisation of data from National Travel Surveys across Europe Data needs + proposition of a questionnaire New technology to capture travel behaviour
15 15 EUROSTAT guidelines on passenger mobility Main follow-up from SHANTI Grants have been awarded to several countries for postharmonisation research
16 16 Travel survey harmonisation How about a publication standard for «indicators plus metadata»? Any supranational solutions?
")
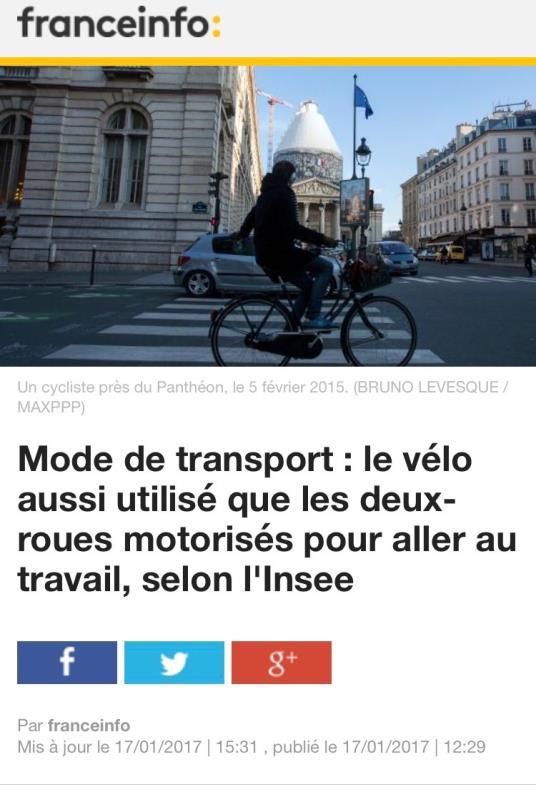

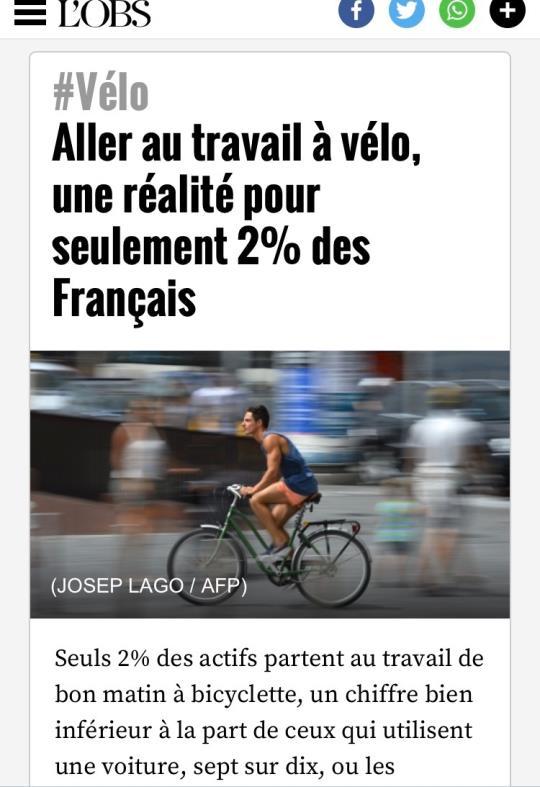
17 Commuter data (FR) 17
")
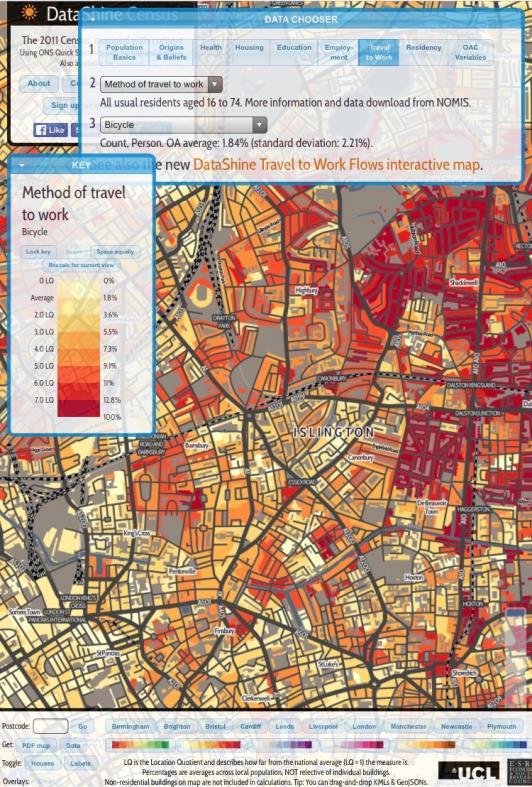

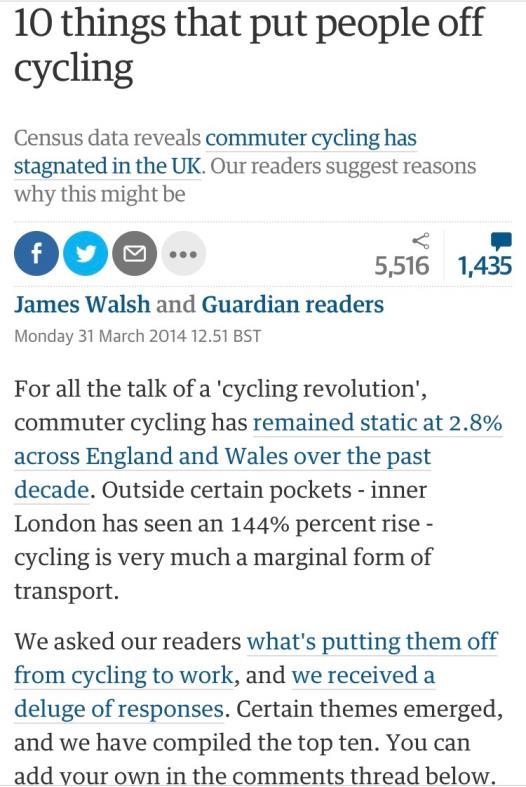
18 Commuter data (UK) 18

19 Google Street View 19 Source: Rahul Goel, Estimating city-level travel patterns using street imagery: a case study of using Google Street View in Britain


20 I m not a robot 20

21 29-30 January 2018 ITF Roundtable on Cycling Safety Experts 16 Countries
22 22 Indicators and targets Monitoring performance and setting objectives Measuring what matters to the end user Comparing performance across countries, areas, user groups, seasons, etc. Performance metrics should control for the underlying volume of pedal cycle traffic Aim to reduce by 50% the number of fatalities per unit distance cycled

23 23 Diversity of bikes Request data on trips and crashes from bike-share operators Disaggregation of shared bikes and electric bikes from classic bikes is desirable, when traffic/mobility data is collected Photo:


24 Safer City Streets the global traffic safety network for liveable cities 45 cities
25 Greater London Inner London Leeds FUA London FUA Manchester FUA Zürich FUA Leicester FUA Liverpool FUA Auckland Buenos Aires Cyclist fatalities per bn km cycled Edinburgh FUA Birmingham FUA Newcastle FUA New York City Milano FUA Nottingham FUA Firenze FUA Napoli FUA Venezia FUA Bari FUA Torino FUA Bologna FUA Roma FUA Lisbon FUA 80% confidence intervals reflecting natural fluctuations in casualty numbers Benchmark is limited to areas with more than 5 fatalities in 5 years average ITF Safer City Streets database Copenhagen Berlin The Hague Montreal Paris City Helsinki FUA Bristol FUA Paris area Greater London Inner London Leeds FUA London FUA Manchester FUA Zürich FUA Leicester FUA Liverpool FUA Auckland Buenos Aires Edinburgh FUA Bogotá D.C. Birmingham FUA Newcastle FUA New York City Milano FUA Nottingham FUA Firenze FUA Napoli FUA Venezia FUA Bari FUA Torino FUA Bologna FUA Roma FUA Lisbon FUA EU-NO-CH 25 USA-CAN-AUS-NZ UK ITA Other Country EU U U IT O
26 26 Key recommendations Consider the recommendations from SHANTI/Eurostat Join forces across local and national authorities to reduce costs and make results comparable Join forces across disciplines: public health (physical activity) + mobility planning + road safety Survey 365/7 Avoid the omission of walking and cycling On-street counts: choice of locations shall be randomised

27 Thank you Alexandre Santacreu
28 28 Abbreviations NTS National Travel Survey NMP National Mobility Panel CAPI Computer-assisted personal interviewing CATI Computer-assisted telephones interviewing CAWI Computer Aided Web Interviewing
Country fact sheet South Korea
 ESRA results Country fact sheet South Korea The ESRA project is a joint initiative of research institutes in 25 countries aiming at collecting comparable national data on road users opinions, attitudes
Road Safety Initiatives at the International Transport Forum :
 Road Safety Initiatives at the International Transport Forum : IRTAD 2016 annual report Zero Road Deaths and Serious Injuries Report Safer City Streets Initiatives TRB Annual Meeting Joint IRTAD / NHTSA
Country fact sheet Germany
 Country fact sheet Germany ESRA 2015 results The ESRA project is a joint initiative of research institutes in 17 European countries aiming at collecting comparable national data on road users opinions,
outline 1. why cycle? 2. (safety health) 3. safe system 4. what next
 3. safe system 4. what next") outline 1. why cycle? 2. (safety health) 3. safe system 4. what next In a city of many cyclists, why do they ride? Copenhageners reasons for cycling to and from work (multiple answers) 56% it s faster
outline 1. why cycle? 2. (safety health) 3. safe system 4. what next In a city of many cyclists, why do they ride? Copenhageners reasons for cycling to and from work (multiple answers) 56% it s faster
Safer City Streets Global Benchmarking for Urban Road Safety
 Safer City Streets Global Benchmarking for Urban Road Safety Working Document Safer City Streets Global Benchmarking for Urban Road Safety Working Document The International Transport Forum The International
SUSTAINABILITY, TRANSPORT, & HEALTH. Ralph Buehler, Virginia Tech
 SUSTAINABILITY, TRANSPORT, & HEALTH Ralph Buehler, Virginia Tech Prepared for National Academies Roundtable on Science and Technology for Sustainability 6 December 2013 Overview Trends in Motorization
TomTom European Congestion Index
 TomTom European Congestion Index Disclaimer All copyrights, commercial rights, design rights, trademarks and other elements considered intellectual property that are published in this report are reserved
International cooperation to improve the safety of European pedestrian crossings
 International cooperation to improve the safety of European pedestrian crossings Francesco Mazzone Head of International Assessment Programmes ACI Automobile Club d Italia Polis Conference Barcelona, 25
OECD employment rate increases to 68.4% in the third quarter of 2018
 Paris, 17th January 2019 News Release: 3rd Quarter 2018 OECD employment rate increases to 68.4% in the third quarter of 2018 The OECD area employment rate the share of the working-age population with jobs
Traffic Safety Basic Facts 2010
 Overall frequencies On ROU areas frequencies Roads During the last decade, more than 174000 people died in accidents on roads (54% of all road traffic fatalities). More than 174.000 people were killed
Exposure-adjusted fatality rates for cycling and walking in European countries
 Epidemiology, Biostatistics and Prevention Institute Exposure-adjusted fatality rates for cycling and walking in European countries Alberto Castro Sonja Kahlmeier Thomas Götschi University of Zurich, Epidemiology
Traffic Safety Basic Facts 2012
 Roads outside urban areas During the last decade, more than 206000 people died in accidents on roads outside urban areas (53% of all road traffic fatalities). More than 206.000 people were killed in traffic
Cycling Safety Summary and Conclusions. 168 Roundtable
 Cycling Safety Summary and Conclusions 168 Roundtable Cycling Safety Summary and Conclusions of the ITF Roundtable on Cycling Safety 29-30 January 2018, Paris Alexandre Santacreu International Transport
2 nd Road Safety PIN Conference 23 June 2008 Countdown to only two more years to act!
 2 nd Road Safety PIN Conference 23 June 2008 Countdown to 2010 - only two more years to act! EU ambition EU target to cut by 50% yearly road deaths between 2001 and 2010 Countries have similar national
Road Safety Pledge. Route to vision zero 2050 in Europe The Hague, June 14th, Malta. Luxembourg Lithuania Latvia Italy
 Malta Luxembourg Lithuania Latvia Italy Ireland The Netherlands Sweden Spain Slovenia Slovakia Romania Portugal Poland 1965 Road Safety Pledge Route to vision zero 2050 in Europe The Hague, June 14th,
outside motorways in 17 European Union countries Figure 1: Fatalities on ROU areas in EU-17 2, ,4
 Roads outside urban areas During the last decade, more than 225000 people died in accidents on roads outside urban areas (5 of all road traffic fatalities). More than 225.000 people were killed in traffic
Traffic Safety Basic Facts Main Figures. Traffic Safety Basic Facts Traffic Safety. Gender Basic Facts Gender
 Traffic Safety Basic Facts 2013 - Main Figures Traffic Safety Basic Facts 2015 Traffic Safety Gender Basic Facts 2017 Gender General In 2015, more than 26.100 people were killed in road accidents throughout
Road traffic accidents in European urban areas
 1 st European Road Infrastructure Congress 18-20 October 2016 Leeds, United Kingdom Road traffic accidents in European urban areas Robert Bauer a1, Klaus Machata a, Christian Brandstaetter a George Yannis
A Critical Review of International Road Safety Databases
 A Critical Review of International Road Safety Databases George Yannis, Eleonora Papadimitriou, Katerina Folla National Technical University of Athens, Greece, Department of Transportation Planning and
AREA TOTALS OECD Composite Leading Indicators. OECD Total. OECD + Major 6 Non Member Countries. Major Five Asia. Major Seven.
 Reference series Composite leading indicators OECD Composite Leading Indicators AREA TOTALS 7-03- 19 OECD Total 19 OECD + Major 6 Non Member Countries 19 Major Seven 19 Major Five Asia 19 Euro area 19
Traffic Safety Basic Facts 2011
 Urban areas Fatalities on urban roads were reduced by 32% between 2000 and 2009. In 2009, about 12.300 people died in traffic accidents on urban roads in the EU-19. This corresponds to 38% of all road
Traffic Safety Basic Facts 2012
 Urban areas Fatalities on urban roads were reduced by 39% between 2001 and 2010. In 2010, about 10.830 people died in traffic accidents on urban roads in the EU-19. This corresponds to 38% of all road
Appendix Urban Change in Western Europe, : Statistical Background
 Appendix Urban Change in Western Europe, 1 945-80: Statistical Background ...
Capacity of transport infrastructure networks
 Most infrastructure extension work is concentrated on roads. The total length of the motorway network has increased dramatically during the past two decades (about 3 % per year). Construction of the high-speed
Traffic Safety Basic Facts Main Figures. Traffic Safety Basic Facts Road Safety. Urban Areas. Country Overview.
 Traffic Safety Basic Facts 2013 - Main Figures Traffic Safety Basic Facts 2015 Road Safety Urban Areas Country Overview Latvia Structure and Culture Basic Data 67,4% of Latvian population lives inside
Road Safety Attitudes and Perceptions of Pedestrians in Europe
 Athens, Greece April 23-26 2012 Transport Research Arena Europe 2012 Road Safety Attitudes and Perceptions of Pedestrians in Europe E. Papadimitriou a, A. Theofilatos a, G. Yannis a, G.M. Sardi b, R. Freeman
Traffic Safety Basic Facts Main Figures. Traffic Safety Basic Facts Road Safety. Urban Areas. Country Overview.
 Traffic Safety Basic Facts 2013 - Main Figures Traffic Safety Basic Facts 2015 Road Safety Urban Areas Country Overview Lithuania Structure and Culture Basic Data Lithuania has a low population density.
THE PEP Partnership on Cycling
 THE PEP Partnership on Cycling Pan-European Master Plan for Cycling THE PEP Bureau Meeting, July 4 th /5 th, 2017 Robert Thaler Head of Division Mobility, Transport, Noise Austrian Federal Ministry of
Total 20 creating a paradigm shift
 Total 20 creating a paradigm shift Agenda Thanks to Transportation Alternatives 20 s Plenty for Us Why we need slower streets Establishment changes guidance Portsmouth UK s first 20mph city Successes around
 Children (Aged
 Road accidents. Year 2015 Provisional data
 21 22 23 24 25 26 27 28 29 21 211 212 213 19 July 216 Year Provisional data Well ahead of the traditional dissemination timing, Istat provides provisional data on road, including information on road category
Deliverable D3.2 Assembly of Basic Fact Sheets 2010
 Road Safety Data, Collection, Transfer and Analysis Deliverable D3.2 Assembly of Basic Fact Sheets 2010 Please refer to this report as follows: Broughton, J and Knowles, J (2011) Assembly of Basic Fact
European Association of Establishments for Veterinary Education. EAEVE Establishments Status
 This table is listing the outcome status of the Veterinary Education Establishments, members of EAEVE, after following the European System of Evaluation of Veterinary Training (ESEVT). Information on the
PIN Flash 18 - Background tables
 PIN Flash 18 - Background tables Definition of deaths on urban/rural rural roads How the urban/rural distinction is made in the statistics that your country provides to CARE CARE Deaths on rural roads
EAEVE Establishments Status
 EAEVE Establishments Status This table is listing the outcome status of the Veterinary Universities and Faculties, members of EAEVE, after following the European System of Evaluation of Veterinary Training
The African Road Safety Observatory
 Committee on Transportation in Tuesday, 15 January 2019 Washington D.C. The African Road Safety Observatory George Yannis 1, Antonino Tripodi 2, Luca Persia 2 1 National Technical University of Athens
Western Health Care Systems: Under Pressure from Demography
 Western Health Care Systems: Under Pressure from Demography Nicholas Eberstadt Henry Wendt Chair in Political Economy American Enterprise Institute eberstadt@aei.org Presentation at Panel on Health Care
EAEVE Establishments Status
 EAEVE Establishments Status This table is listing the outcome status of the Veterinary Universities and Faculties, members of EAEVE, after following the European System of Evaluation of Veterinary Training
TABLE 1: NET OFFICIAL DEVELOPMENT ASSISTANCE FROM DAC AND OTHER DONORS IN 2012 Preliminary data for 2012
 TABLE 1: NET OFFICIAL DEVELOPMENT ASSISTANCE FROM DAC AND OTHER DONORS IN 2012 DAC countries: 2012 2011 2012 ODA ODA/GNI ODA ODA/GNI ODA Percent change USD million % USD million % USD million (1) 2011
Happiness trends in 24 countries,
 Happiness trends in 4 countries, 1946-006 The following graphs shows the trends in happiness levels found in 4 countries, using comparable data from all available surveys for countries having at least
The Herzliya Indices. National Security Balance The Civilian Quantitative Dimension. Herzliya Conference Prof. Rafi Melnick, IDC Herzliya
 The Herzliya Indices National Security Balance The Civilian Quantitative Dimension Herzliya Conference 2015 Prof. Rafi Melnick, IDC Herzliya 1990 1991 1992 1993 1994 1995 1996 1997 1998 1999 2000 2001
Heavy Goods Vehicles and Buses
 Traffic Safety Basic Facts 2013 - Main Figures Traffic Safety Basic Facts 2015 Heavy Goods Vehicles and Buses General More than 4.000 people died in road accidents involving HGVs in 2013. Heavy Goods Vehicles
European Golf Statistics 2017
 European Golf Statistics 2017 Leading the Business of Golf Photo by Aidan Bradley Distribution of registered golfers over the last year: Male golfers: 66% Female golfers: 25% Junior golfers: 9% Total number
BlomURBEX 3D. Coverage Blom Internal, Partners & Customers. Provide an overview of BlomURBEX 3D coverage. Blom Document. Blom, ASA.
 BlomURBEX 3D Coverage 2010 Audience: Abstract: Blom Internal, Partners & Customers Provide an overview BlomURBEX 3D coverage. Date September 2010 Blom Document BU3DC2010 v1.0r1.doc Revision History Document
Traffic Safety Basic Facts 2008
 Urban road fatalities were reduced by more than 29% between 1997 and 2006. In 2006, more than 8.100 persons died in road accidents inside urban areas in the EU-14. This corresponds to 33,2% of all the
Traffic Safety Basic Facts Main Figures. Traffic Safety Basic Facts Traffic Safety. Main Figures Basic Facts 2015.
 Traffic Safety Basic Facts 2013 - Main Figures Traffic Safety Basic Facts 2015 Traffic Safety Main Figures Basic Facts 2015 Main Figures EU road safety targets The European Commission set the ambitious
Traffic Safety Basic Facts Main Figures. Traffic Safety Basic Facts Junctions
 Traffic Safety Basic Facts 2013 - Main Figures Traffic Safety Basic Facts 2016 Junctions General In 2014, about 26.000 people were killed in road accidents throughout the EU; at least 5.000 of whom were
Complete Streets 101: The Basics
 Complete Streets 101: The Basics Michigan Municipal League - Capital Conference March 21, 2017 Chip Smith, AICP - Senior Planner - Wade Trim Inc. and City Council member City of Ann Arbor 2017 MML Capital
Beer statistics edition. The Brewers of Europe
 Beer statistics 2017 edition The Brewers of Europe Beer statistics 2017 edition The Brewers of Europe December 2017 ISBN 978-2-9601382-9-0 EAN 9782960138290 1 TABLE OF CONTENTS Foreword by President
Traffic Safety Basic Facts 2010
 Pedestrians In 2008 7,491 pedestrians were killed in road traffic accidents in the EU-23, which is 20.4 % of all fatalities. In the last decade, pedestrian fatalities have reduced by 25.2%, while the total
Traffic Safety Basic Facts 2008
 More than 5.000 people died in road traffic accidents involving HGVs in 2006 1 (EU-14 plus the Czech Republic, Estonia, Hungary Malta and Poland) Traffic Safety Basic Facts 2008 and Buses (HGVs) are defined
fatalities has reduced by more than 35%. Table 1: Pedestrian fatalities by country by year,
 Pedestrians In 2009, 6.641 pedestrians were killed in road traffic accidents in the EU24, which is 20 % of all fatalities. In the last decade in the EU19 1, pedestrian fatalities have reduced by 34%, while
EAEVE Establishments Status
 This table is listing the outcome status of the Veterinary Education Establishments, members of EAEVE, after following the European System of Evaluation of Veterinary Training (ESEVT). Information on the
Beer statistics edition. The Brewers of Europe
 Beer statistics 2016 edition The Brewers of Europe Beer statistics 2016 edition The Brewers of Europe November 2016 ISBN 978-2-9601382-7-6 EAN 9782960138276 1 TABLE OF CONTENTS Foreword by President
ThinkBike Workshop. Los Angeles September 22-23, 2011
 September 22-23, 2011 The Experts Cor van der Klaauw Groningen Province Richard ter Avest Goudappel Coffeng Consultancy The Experts Tonny Bosch Goudappel Coffeng Consultancy Hillie Talens CROW Cycling
CPB. Exposure-Adjusted Road Fatality Rates for Cycling and Walking in European Countries Discussion Paper. Alberto Castro.
 CPB Exposure-Adjusted Road Fatality Rates for Cycling and Walking in European Countries Discussion Paper 168 Alberto Castro University of Zurich Sonja Kahlmeier University of Zurich Thomas Gotschi University
ROAD TRAFFIC SAFETY IN BELARUS CURRENT SITUATION
 ROAD TRAFFIC SAFETY IN BELARUS CURRENT SITUATION Yuri VAZHNIK ian Association of Transport Experts and Surveyors BAES ian National Technical University Dzmitri NAVOI State Automobile Inspection of Ministry
Road Safety Vademecum
 Road Safety Vademecum Road safety trends, statistics and challenges in the EU 2010-2013 March, 2014 European Commission DG for Mobility and Transport Unit C.4 Road Safety Contents Summary of findings...
ROAD ACCIDENTS. Year 2016
 2001 2002 2003 2004 2005 2006 2007 2008 2009 2010 2011 2012 2013 2014 2017 2018 2019 2020 27 July, 2017 ROAD ACCIDENTS Year In, 175,791 road occurred in Italy resulting in death or injury with 3,283 deaths
THE PEP Partnership on Cycling Pan-European Master Plan for Cycling
 THE PEP Partnership on Cycling Pan-European Master Plan for Cycling International Cycling Conference, Mannheim, September 2017 THE PEP Relay Race Robert Thaler Head of Division Mobility, Transport, Noise
Traffic Safety Basic Facts Main Figures. Traffic Safety Basic Facts Road Safety. Urban Areas. Country Overview.
 Traffic Safety Basic Facts 2013 - Main Figures Traffic Safety Basic Facts 2015 Road Safety Urban Areas Country Overview Luxembourg Structure and Culture Basic Data Luxembourg has one of the highest GDPs
EVENT LOCATION DATE. Training Course 2 London 19 June. Study Club Clinical Topic High Wycombe 24 June
 United Kingdom. Training Course 2 London 19 June Study Club Clinical Topic High Wycombe 24 June MasterClass (carried from previous year) London 26 June Training Course 2 London 26 June MasterClass (carried
New rules, new opportunities: a potential for growth
 #TV year New rules, new opportunities: a potential for growth June 19th, 2015 Jacques Balducci Eurodata TV Worldwide Deputy Sales Director Worldwide TV viewing remains strong World daily viewing time Average
Road Safety Annual Report Summary. International Traffic Safety Data and Analysis Group
 Road Safety Annual Report 2014 Summary International Traffic Safety Data and Analysis Group Table of Contents 5 Table of Contents IRTAD: An International Expert Network and Database on Road Safety Data...
Country
 Life Domain: Income, Standard of Living, and Consumption Patterns Goal Dimension: Disparities, Inequalities, and Social Exclusion Measurement Dimension: Subdimension: Indicator: Definition: Population:
Update of trade weights data underlying the EERs and HCIs
 August 2017 Update of trade weights data underlying the EERs and HCIs The trade weights underlying the calculation of the effective exchange rates (EERs) of the euro and the harmonised competitiveness
DEVELOPMENT AID AT A GLANCE
 DEVELOPMENT AID AT A GLANCE STATISTICS BY REGION 5. EUROPE 2018 edition All the data in this report are available at: http://www.oecd.org/dac/financing-sustainable-development/ 5.1. ODA TO EUROPE - SUMMARY
Traffic Safety Basic Facts 2008
 In 2006 1, more than 4.700 seniors died in road traffic accidents in 14 European countries. Fatalities of elderly people in road traffic accidents reduced by over 3 between 1997 and 2006. Traffic Safety
Traffic Safety Basic Facts Main Figures. Traffic Safety Basic Facts Road Safety. Urban Areas. Country Overview.
 Traffic Safety Basic Facts 2013 - Main Figures Traffic Safety Basic Facts 2015 Road Safety Urban Areas Country Overview Ireland Structure and Culture Basic Data The Irish population is younger than the
Traffic Safety Basic Facts 2010
 Heavy Goods Vehicles and Buses Heavy Goods Vehicles (HGVs) are defined as goods vehicles of over 3,5 tons maximum permissible gross vehicle weight. Road traffic accidents involving HGVs tend to be more
Traits of a Global Market for Advanced Human Capital How can the Global Demand for Post-secondary Education be met...
 Traits of a Global Market for Advanced Human Capital How can the Global Demand for Post-secondary Education be met... Washington D.C. May 23, 2002 .why are we here? Economic and social development are
Canada. UK France. Walk, Bike, Transit Share of Trips
 1950s 1960s Today Relationship between Share of Urban Trips by Transit, Bicycle, and Foot and Per Capita Annual CO 2 Emissions from Road and Rail Transport in Australia, Canada, the USA and EU Countries,
Beer statistics edition. The Brewers of Europe
 Beer statistics 2015 edition The Brewers of Europe Beer statistics 2015 edition The Brewers of Europe Editor: Marlies Van de Walle October 2015 ISBN 978-2-9601382-5-2 EAN 9782960138252 1 TABLE OF CONTENTS
NEW COMMERCIAL VEHICLE REGISTRATIONS EUROPEAN UNION 1. July and August 2017
 PRESS EMBARGO: NEW COMMERCIAL VEHICLE REGISTRATIONS EUROPEAN UNION 1 July and August 2017 Next press release: Tuesday 24 October 2017 1 Data for Malta unavailable Page 1 of 12 Commercial vehicle registrations:
Road Safety in Africa and beyond
 Road Safety in Africa and beyond George Yannis National Technical University of Athens, Greece European Commission DG for Research and Innovation - 11 June 2018 Co-funded by the Horizon 2020 Framework
Traffic Safety Basic Facts 2012
 Heavy Goods Vehicles and Buses More than 4800 people died in road traffic accidents involving HGVs in 2010 (EU-24 1 ). In the last two years, the fatalities involving HGVs in Romania have decreased by
FACT Sheet. FIFA Competition winners at a glance. Men s Competitions. FIFA World Cup (staged every four years)
") FIFA Competition winners at a glance Men s Competitions FIFA World Cup (staged every four years) 2022 Qatar 2018 Russia 2014 Brazil 32/64 2010 South Africa, Johannesburg 32/64 Netherlands Spain 0:1 AET
FIFA Competition winners at a glance Men s Competitions FIFA World Cup (staged every four years) 2022 Qatar 2018 Russia 2014 Brazil 32/64 2010 South Africa, Johannesburg 32/64 Netherlands Spain 0:1 AET
Time series of Staff PPPs
 Luxembourg, 28 August 2013 Unit C3 A64/13/12 Meeting of the Working Group on Article 64 of the Staff Regulations Luxembourg, 27 th September 2013 Bech Building Room "Ampère" 9.30 a.m. Time series of Staff
Traffic Safety Basic Facts Main Figures. Traffic Safety Basic Facts Road Safety. Urban Areas. Country Overview.
 Traffic Safety Basic Facts 2013 - Main Figures Traffic Safety Basic Facts 2015 Road Safety Urban Areas Country Overview Bulgaria Structure and Culture Basic Data In Bulgaria, the GDP per capita and the
Architecture - the Market
 2 Architecture - the Market Architect: Ibelings van Tilburg architecten Project: De Karel Doorman Winner of the BNA Building of the Year 2013 Public Prize Photographer: Ossip van Duivenbode Place: Rotterdam
The economic value of the EU shipping industry. Andrew P Goodwin
 The economic value of the EU shipping industry Andrew P Goodwin 2 nd April 2014 Introduction Shipping is a vital facilitator of world trade 135 % Increase in world GDP in the last two decades 180 % Increase
Current and future challenges of the European Road Safety Observatory
 Current and future challenges of the European Road Safety Observatory Konstandinos Diamandouros 3, Robert Bauer 2, Katerina Folla 1, Alexandra Laiou 1, Klaus Machata 2, Christian Brandstaetter 2, George
Public Service or Golden Goose?
 Public Service or Golden Goose? Safety Cameras in Ireland A Social Cost-Benefit Analysis Derek Rafferty Department of Transport, Tourism & Sport MSc EPS- Trinity College Key Findings Safety Cameras Save
Roundtable on integrated and sustainable urban transport. Mio Suzuki (University of Tokyo) Hiroki Nakamura (Chuo University)
 Hiroki Nakamura (Chuo University)") Roundtable on integrated and sustainable urban transport Mio Suzuki (University of Tokyo) Hiroki Nakamura (Chuo University) Contents Current situation of cycling in Japan Public bike system in Japan Example
Roundtable on integrated and sustainable urban transport Mio Suzuki (University of Tokyo) Hiroki Nakamura (Chuo University) Contents Current situation of cycling in Japan Public bike system in Japan Example
Arms industry statistics
 BRIEFING PAPER Number CBP 7842, 21 December 2016 Arms industry statistics By Rachel Kift and Rob Page Contents: 1. Global defence export market 2. UK defence export market www.parliament.uk/commons-library
CEDR N5 Improvements in the field of Road Safety New trends in member states Road Safety strategies
 CEDR N5 Improvements in the field of Road Safety New trends in member states Road Safety strategies CEDR Strategic Plan 2013-2017 TD3 Network Management Thorshavn, Faroe Islands, March 30th 2016 Auður
Road Safety in Sweden and the Effect of Speed on Safety
 Road Safety in and the Effect of Speed on Safety Göran Nilsson Dr. Eng. Swedish Road and Transport Research Institute-VTI Abstract has one of the best traffic safety situation in the developed countries.
1) No through traffic except for pedestrians, cyclists or pedestrian and cyclists.
 No through traffic except for pedestrians, cyclists or pedestrian and cyclists.") THE PEP Proposed changes for road signs and signals in the Vienna Convention to make it easier to increase walking and cycling Benoît Hiron Cerema, July the 2nd 2017-07-02 Considering that many countries
THE PEP Proposed changes for road signs and signals in the Vienna Convention to make it easier to increase walking and cycling Benoît Hiron Cerema, July the 2nd 2017-07-02 Considering that many countries
to both period for which data are available has been How Big is the Problem? 19 in Of these killed car occupants,
 Car Occupants Introduction This fact sheet explores some of the characteristics of car occupant fatalities. Cars comprise a considerable share of the vehicle fleet in the EU. Therefore, better understanding
Summer Study: Europe. A look at European hotel performance during summer 2017 (June - August) Key Findings
 Key Findings") Summer Study: Europe A look at European hotel performance during summer 2017 (June - August) Key Findings - This was the strongest summer overall for European hotels dating back to 2000 - with record-breaking
Summer Study: Europe A look at European hotel performance during summer 2017 (June - August) Key Findings - This was the strongest summer overall for European hotels dating back to 2000 - with record-breaking
DEVELOPMENT AID AT A GLANCE
 DEVELOPMENT AID AT A GLANCE STATISTICS BY REGION 6. OCEANIA 2018 edition All the data in this report are available at: http://www.oecd.org/dac/financing-sustainable-development/ 6.1. ODA TO OCEANIA - SUMMARY
El progreso hacia el objetivo europeo de reducción de la accidentalidad. Resultados del 3er informe PIN
 El progreso hacia el objetivo europeo de reducción de la accidentalidad Resultados del 3er informe PIN Presentation outline Introduce ETSC and its PIN programme Present some of the findings of our new
Impaired Cycling and Crash Involvement: A Survey Across OECD Countries on Data Availability and Legislation
 Standing Committee on Alcohol, Other Drugs, and Transportation Lectern Session 1275: Impairment on Road Users Other Than Drivers Impaired Cycling and Crash Involvement: A Survey Across OECD Countries on
Traffic Safety Basic Facts Main Figures. Traffic Safety Basic Facts Cyclists
 Traffic Safety Basic Facts 2013 - Main Figures Traffic Safety Basic Facts 2018 Cyclists General In 2016, about 25.600 people were killed in road accidents throughout the EU, a reduction of 40% from the
Traffic Safety Basic Facts Main Figures. Traffic Safety Basic Facts Cyclists
 Traffic Safety Basic Facts 2013 - Main Figures Traffic Safety Basic Facts 2016 Cyclists General In 2014, about 26.000 people were killed in road accidents throughout the EU, a reduction of 42% from the
GLOBAL BAROMETER OF HOPE AND DESPAIR FOR 2011
 GLOBAL BAROMETER OF HOPE AND DESPAIR FOR 2011 Volume 1: Statistical Report Findings based on responses from more than 64,000 scientifically selected cross-section of Men and Women from all socioeconomic
Regional Spread of Inbound Tourism
 Regional Spread of Inbound Tourism Foresight issue 157 VisitBritain Research 1 Contents Introduction Summary Key metrics by UK area Analysis by UK area Summary of growth by UK area Scotland Wales North
CURRENT DEMOGRAPHIC SITUATION IN LATVIA
 CURRENT DEMOGRAPHIC SITUATION IN LATVIA Peteris Zvidrins University of Latvia Workshop Very old people s housing and housing and health situation in Latvia 21 May, 2013 Population and its change in 10
Traffic Safety Basic Facts 2012
 Car Occupants Introduction This fact sheet explores some of the characteristics of car occupant fatalities. Cars comprise a considerable share of the vehicle fleet in the EU. Therefore, better understanding
Road Safety Data, Knowledge and Decision Support Systems Global Challenges in the Digital Era
 Road Safety Data, Knowledge and Decision Support Systems Global Challenges in the Digital Era George Yannis Professor Department of Transportation Planning and Engineering National Technical University