F O R E W O R D. (R.S.Gujral) Secretary. New Delhi March, 2011
|
|
|
- Jemimah Allison
- 5 years ago
- Views:
Transcription

1 GOVERNMENT OF INDIA MINISTRY OF ROAD TRANSPORT AND HIGHWAYS TRANSPORT RESEARCH WING NEW DELHI
2 F O R E W O R D Road safety is both a health and development issue of concern considering its magnitude and gravity and the consequent negative impacts on the economy, public health and the general welfare of the people, particularly those with low incomes. Although we have undertaken initiatives and are implementing various road safety improvement programmes, the overall situation as revealed by data is far from satisfactory. With rising motorization and expanding road network, travel risks and traffic exposure grow at a much faster rate, as the growth of registered vehicles always outnumbers population growth and new roads are constructed. Today road traffic injuries are one of the leading causes of deaths, disabilities and hospitalizations with severe socioeconomic costs across the world. As per the Commission for Global Road Safety (2009), road traffic accidents kill an estimated 1.3 million people and injure 50 million people per year globally, and global road fatalities are forecast to reach 1.9 million by It is estimated that the number of deaths from road accidents in Asia is about 700,000 per year, accounting for more than half of the world s road fatalities even though Asia accounted for only 43% of the global vehicle population in During the year 2009 there were around 4.9 lakh road accidents which killed 1,25,660 people and injured more than 5 lakh persons in India. These numbers translate into one road accident every minute and one road accident death every four minutes for India. Road traffic injuries and fatalities impose a huge economic burden on developing economies in particular. In India more than half of the road accident victims are in the age group (25-65 years), the key wage earning and child raising age group. The loss of the main bread earner and head of household due to death or disability can be catastrophic, leading to lower living standards and poverty, in addition to the human cost of bereavement. Road traffic accidents are amenable to remedial action. Many developed countries have witnessed drop in road accidents and casualty numbers by adopting multipronged approach to road safety that encompasses traffic management, road design, safer vehicles, law enforcement, provision of accident care, etc. The challenge for us is to adapt and evaluate these approaches to suit our needs. The purpose of this publication is to present an in depth analysis and overview of the road accidents in India. The data and analysis on road accidents contained in this volume will help create awareness and assist in informed decision making in the area of road safety. Success of road safety initiatives requires active cooperation and participation of all stakeholders. I hope this document would be useful to administrators, policy makers and civil society organizations involved in the area of road safety. New Delhi March, 2011 (R.S.Gujral) Secretary
3 P R E F A C E Transport Research Wing (TRW) of the Ministry of Road Transport & Highways is the nodal agency for providing information/data on various facets of road and road transport. The present issue Road Accidents in India : 2009 attempts to provide data/information relating to road accidents in terms of its magnitude, incidence, spatial spread, its impact, determinants and policy initiatives undertaken by the government to prevent and mitigate its impact. The volume consists of 14 sections, which dwell on various facets of road accidents in India. As the information contained in the volume is obtained from a large number of source agencies spread across States and Union Territories (UTs), there is a time lag in bringing out collated data. Our endeavour is to reduce the time lag in bringing out the publication with the cooperation of the various source agencies. In particular, we would like to thank source agencies across States/UTs in bringing out this document. Suggestions from the users of information are welcome to improve quality and coverage. The officers and staff of the TRW deserve special mention for considerable effort put in by them leading to the release of this publication. New Delhi March 2011 (Arvind Kumar) Adviser (Transport Research)
4 OFFICERS AND STAFF ASSOCIATED IN PREPARATION OF THIS PUBLICATION Shri Kuntal Sensarma, Director Ms. Nimmi Balani, Junior Investigator Shri Surender Singh Rawat iv
5 List of Contents 1. Introduction 2. Cost of Road Accidents. 3. Trend in Accidents, Injuries, Fatalities, Motor Vehicles & Road Network. Long Term Trends Recent Trends in Number of Accidents, Injuries & Fatalities Profile of Road Accidents 4. Normalized Indicators of Road Accidents, Injuries & Fatalities: All India Averages. 5. Road Accidents: Inter State comparison. Incidence of Road Accidents, Injuries & Deaths: States & UTs Per lakh of population Per Ten Thousand vehicle Severity of Road Accidents across States/UTs 6. Select Cities: Road Accidents Injuries, Deaths and Severity 7. Classification of Accidents Accidents in terms of Road classification Spatial distribution of Road Accidents (Urban vis-à-vis Rural) 8. Accidents in terms of involvement by vehicle type Road Accident and fatalities by type of vehicle involvement 9. Time of occurrence of road accidents. 10. Age profile of accident victims (other than drivers). 11. Causes of road accidents. 12. International comparison of road traffic injury accidents and deaths 13. Road traffic accidents, prevention and control. 14. Recent Road safety initiatives by the Government of India i
6 List of Charts Chart 1 : Total number of road accidents, persons killed and injured Chart 2 a : Number of accidents per lakh population Chart 2 b : Number of accidents per 10,000 vehicles Chart 2 c : Number of accidents per 10,000 km of road length Chart 3 a : Number of persons injured per lakh of population Chart 3 b : Number of persons injured per 10,000 vehicles Chart 3 c : Number of persons injured per 10,000 km of road length Chart 4 a : Number of persons killed per lakh population Chart 4 b : Number of persons killed per 10,000 vehicles Chart 4 c : Number of persons killed per 10,000 km of road length Chart 5 a : Number of Road accidents per lakh population (State wise) Chart 5 b : Number of Road accidents per 10,000 vehicles (Statewise) Chart 6 a : Number of persons killed per lakh population (Statewise) Chart 6 b : Number of persons killed per 10,000 motor vehicles (Statewise) Chart 7 : Severity of road accidents across States/UTs during 2009 Chart 8 a : Accident severity in select cities (2009) Chart 8 b : Accident severity in select cities in terms of population size Chart 9 a : Number of persons killed per lakh of population in select cities (2009) Chart 9 b : Number of persons injured per lakh of population in select cities (2009) Chart 9 c : Number of accidents per lakh population in select cities (2009) Chart 10 a : Road Accidents and road length as per classification of roads. Chart 11 a : Percent share in total accidents by type of motor vehicles involved (primarily responsible) during Chart 11 b : Percent share of persons killed in road accidents by type of motor vehicle involved (primarily responsible). Chart 11 c : Percent share of persons injured in road accidents by type of motor vehicles (primarily responsible) during Chart 11 d : Category-wise Vehicle share in total registered motor vehicle population Chart 12 : Percent share of persons killed in road accidents by type of road user category (2009) Chart 13 : Distribution of total number of road accidents as per time of occurrence during Chart 14 : Road Accident victims (other than drivers) by age group during Chart 15 : Causes of road accidents Chart 16 : Country-wise number of persons Killed per Population. Chart 17 : Total Number of Road/Injury Accidents (India and China). Chart 18 : Total number of Persons Killed in Road Accidents (India and China). ii
7 List of Tables Table 1 : Growth in select accident related parameters Table 2 : Number of accidents and number of persons involved 2001 to 2009 Table 3 : All India share of select states (in %): Road accidents, injuries, deaths and registered motor vehicles. Table 4 : Severity of road accidents in India (Statewise) Table 5 A : Road accident profile for select cities 2009 Table 5 B : Percent share of 23 cities in road accidents during 2009 Table 6 : Number of accidents and number of persons killed and injured as per type of road. Table 7 : Number of accidents, persons killed and injured as per road classification 2009 Table 8 : Share of different vehicles in total road accidents, fatal accidents, persons killed and persons injured (2009) Table 9 : Road accidents as per the time of occurrence (2009) Table 10 : Cross Country Comparison of Incidence of Road related Deaths and Injury Accidents in 2008 Table 11 : Trend in Road Accident Scenario: India and China (2004 to 2008) Table 12 : Leading Causes of Death, 2004 and 2030 compared Table 13 : Funds Allocated and Spent on Road Safety Activities List of Boxes Box: 1 - Causes of Underreporting of Road Traffic Accidents and Injuries Box: 2 - Key Findings of Global Status Report on Road Safety Time for Action Box: 3 - United Nations Resolutions on Road Safety Box: 4 - Select Country Initiatives & Experiences in Road Safety Box: 5 Recommendations of the Committee on Road Safety and Traffic Management relating to setting up of National Road Safety and Traffic Management Board (NRSTMB). iii
8 List of Annexures I : Road Accidents, Persons killed and injured IA : Road Accidents IB : Persons injured IC : Persons killed IIA : Road accidents per lakh of population, ten thousand vehicles and ten thousand kilometres of road length. IIB : Persons injured per lakh of population, ten thousand vehicles and ten thousand kilometres of road length. IIC : Persons killed per lakh of population, ten thousand vehicles and ten thousand kilometres of road length. IIIA : Road accidents on national highways IIIB : Persons killed on national highways IIIC : Persons injured on National Highways IVA : Road Accidents on State Highways IVB : Persons killed on State Highways IVC : Persons injured on State Highways V : Road Accidents according to causes of accidents VI : Accidents caused due to intake of alcohol / drugs and exceeding lawful speed by drivers. VII : Accidents caused due to Over loading/ Overcrowding/Load protruding. VIII : Road accidents according to types of vehicles and objects. IX : Percent share in total registered motor vehicles in India. X : Fatal road accidents XI : Number of accidents, number of persons killed and number of persons injured in road accidents in Urban and Rural areas XII : Number of persons killed by type of vehicles user and pedestrian. XIII : Accidents classified according to educational qualification of drivers. iv
9 1. Introduction 1.1 Expansion in road network, motorization and urbanization in the country has been accompanied by a rise in road accidents leading to road traffic injuries (RTIs) and fatalities as a major public health concern. Today road traffic injuries are one of the leading causes of deaths, disabilities and hospitalizations with severe socioeconomic costs across the world Studies of the relationship between gross domestic product (GDP) per capita, growth of motor vehicles and road fatalities, have shown that fatality rates increase as GDP increases at relatively low levels of GDP per capita, but then start to decline with continued GDP growth. The peak position on this inverted U-shaped curve is not, however, immutable. The challenge now is to bring about a shift in the relationship between economic growth and road fatalities, so that developing countries benefit from a much earlier improvement than traditional models predict based on the experience of high-income countries (Make Roads Safe, Commission for Global Road Safety; 2. Cost of Road Accidents 2.1 Accidents carry high economic and social costs, which are not easy to ascertain. The cost of road related injuries and accidents can be assessed in terms of (a) medical costs (b) other costs related to administrative, legal and police expenditure (c) collateral damage in terms of damage to property and motor vehicle and (d) loss due to income foregone arising out of absence from work or impairment/disability or untimely death. Besides accident survivors often live poor quality of life and have to live with pain and suffering which are difficult to estimate. In developing countries with very little asset ownership and lack of credible social safety net, 1
10 accidents adversely impact the welfare of dependents of accident victims. Hence it is imperative to assess the magnitude and dimensions of road accidents so as to assist in formulating road safety policies. 2.2 In economic terms, the cost of road crash injuries is estimated at roughly 1 percent of gross national product (GNP) in low-income countries, 1.5 percent in middle-income countries and 2 percent in high-income countries. The direct economic costs of global road crashes have been estimated at US $ 518 Billion, with the costs in low income countries estimated at US $ 65 Billion (World Report on Road Traffic Injury Prevention, page 5, WHO, 2004). These estimates take account only of the direct economic costs mainly lost productivity rather than the full social costs often recognized by industrialized countries. For India the socio-economic cost of road accidents in was estimated at 3 % of GDP (Tenth Five Year Plan Vol II, page 963). 3. Trends in accidents, injuries, fatalities, motor vehicles & road network 3.1 Occurrence of accident is an outcome of interplay of a number of factors, which among others include length of road network, vehicle population, human population and adherence/enforcement of road safety regulations etc. Higher exposure to road accident risk may be mitigated by behavioral standards (adherence to road safety regulations) and policy intervention (enforcement). Long Term Trends 3.2 The Compound annual growth rate (CAGR) in number of accidents, injuries, fatalities and motor vehicles (registered) have moderated during 1990s ( ) after a spurt during the 1980s (1980 to 1990) (Table 1). Moderation in the growth of accidents, fatalities and injuries during 1990s has taken place in the backdrop of lower growth in the number of registered vehicles and step up in the growth of road network. However, post-2000 (up to 2009) growth rate of fatalities has accelerated vis-à-vis the preceding decade ( ). 2
11 Table 1: Growth in Select Accident Related Parameters: Compound Annual Growth Rate (CAGR) in percent Period Number of Number of Number of Number of Registered vehicles Road Length (in kilometers) Accidents Injuries Fatalities 1980/ / / / * Note: * refers to 2008/2000. The latest year for which road length data is available is Between 1970 and 2009 the number of accidents increased by 4.3 times with more than 7 fold increase in injuries and about 8.7 times increase in fatalities in the backdrop of about 64 fold increase in the number registered motor vehicles and three fold increase in road network (Annex- I). Recent Trends in Number of Accidents, Injuries and Fatalities During the calendar year 2009, number of accidents reported at 4,86,384 was higher by 0.35 per cent compared with 4,84,704 accidents reported in the year In comparison, the number of persons killed as a result of road accidents at 1,25,660 was higher by 4.8% in 2009 compared with the preceding year. However, the number of persons injured declined to 5,15,458 (a fall of 1.5%). The total number of road accidents, injuries and deaths increased at CAGR of 2.4%, 2.9% and 5.3 % respectively between the years 2000 and Profile of road accidents 3.3 The total number of road accidents reported by all the States/ Union Territories (UTs) in the year 2009 were 4,86,384 of which 1,10,993 were fatal i.e. 22.8% of the road accidents were fatal. The number of persons killed in the accidents were 1,25,660 (i.e. an average of one fatality per 4.4 accidents). Table 2 indicates that the proportion of fatal accidents in total road accidents has consistently increased since 2001 from 17.6% to 22.8% in The severity of road accidents, measured in terms of persons killed per 100 accidents, had also increased from 19.9 in 2001 to 25.8 in
12 Table 2: Number of Accidents and Number of Persons Involved : 2001 to 2009 Year Number of Accidents Number of Persons Accident Total Fatal Killed Injured Severity* ,05,637 71,219 (17.6) 80,888 4,05, ,07,497 73,650 (18.1) 84,674 4,08, ,06,726 73,589 (18.1) 85,998 4,35, ,29,910 79,357 (18.5) 92,618 4,64, ,39,255 83,491(19.0) 94,968 4,65, ,60,920 93,917(20.4) 1,05,749 4,96, ,79,216 1,01,161(21.1) 1,14,444 5,13, ,84,704 1,06,591(22.0) 1,19,860 5,23, (P) 4,86,384 1,10,993(22.8) 1,25,660 5,15, (P): Provisional. Source: Information supplied by States/UTs (Police Departments). Figures within parentheses indicate share of fatal accidents (i.e. involving death) to total accidents. * Accident Severity : No. of Persons Killed per 100 Accidents 3.4 The magnitude of road accidents and fatalities in India is alarming. This is evident from the fact that every hour there are about 56 accidents (about one accident every minute). Similarly, every hour more than 14 deaths occur due to road accidents i.e. one death in every 4 minutes. Chart 1: Total Number of Road Accidents,Person Killed & Persons Injured during Number Year TOTAL NO. OF ROAD ACCIDENTS TOTAL NO. OF PERSONS INJURED TOTAL NO. OF PERSONS KILLED 4
13 4. Normalized Indicators of Road Accidents, Injuries & Fatalities: All India Averages 4.1 To get an appropriate measure of incidence of accidents, normalized/standardized accident rates for India have been worked out in terms of number of accidents (a) per lakh persons, (b) per ten thousand motor vehicles and (c) per ten thousand kilometers of the road length. Some of the broad trends at the all-india level are summarized below. a. Number of accidents per lakh population indicates a rise from 21.2 in 1970 to 22.8 in 1980 followed by a sharp increase to 33.8 in Between 1995 and 2005, the figures fluctuated in the range of 38 to 40 ; increasing to above 42 in recent years(2007 and 2008); a slight dip to 41.9 in Between 1970 and 2009, there had been an increase of about 97% [Chart 2(a)]; b. A significant decline in the number of accidents per ten thousand motor vehicles is discernible from 814 in 1970, 339 in 1980, 148 in 1990, 80 in 2000 and further to 42 in 2009 i.e. decline of almost 95 % since [Chart 2(b)] ; c. The trend in the number of accidents per ten thousand kilometers of the road length shows that the number of accidents have increased over the last few decades, from 960 in 1970 to 1027 in 1980; peaked to 1424 in 1990; but declined thereafter fluctuating within a band of 1100 to 1200 per ten thousand kilometers. For the latest year 2008, the figure stood at 1179 [Chart 2(c)]. d. The number of persons injured per lakh of population indicates a more than three fold increase from 13 in 1970 to 44.4 in 2009 [Chart 3(a)]. Similarly, persons killed per lakh of population indicate a four fold jump from 2.7 in 1970 to 10.8 in 2009 [Chart 4(a)] Exposure of population to road accidents leading to deaths and injuries largely depends on the amount of travel undertaken, defined as the number of trips, the distance travelled, or time in the road environment, number of motor vehicles and the amount of motorized traffic, etc. These factors are associated with development and income levels. In high income countries, risk of road accidents arising out of these factors have been reduced 5
14 through effective road safety engineering, traffic management, enforcement of traffic laws and the severity of penalties for infringement. e. As regards number of persons injured and killed per 10,000 vehicles the decline has been dramatic. To some extent decline in this parameter has been brought about by improvements in vehicle crashworthiness and occupant protection. The number of persons injured per 10,000 vehicles has plummeted from 500 in 1970 to about 45 in 2009 [Chart 3(b)]. It is noteworthy that this parameter has consistently declined since 1996 despite sustained high growth in vehicle population. Similarly, the number of persons killed per 10,000 vehicles in the country has also fallen from about 104 in 1970 to less than 11 in [Chart 4(b)]. However, injuries and deaths per 10,000 motor vehicles as a parameter has a limitation as it does not capture road related accidents and deaths connected with non-motorized forms of transport which are significant in rural areas. f. The number of persons injured and killed per ten thousand km of road length has more than doubled since Modern road systems are largely designed for the motor vehicles exposing vulnerable road users to greater risk of accidents. In developing countries, lack of foot-paths, cycle tracks, traffic calming measures to reduce speed where non motorized mode of transport blend with motorized traffic, increases the risk of accidents and its severity. These factors have contributed towards increase in road related accidents, injuries and deaths in relation to rise in terms of road length. High-income countries have made progress in providing facilities for pedestrians and cyclists alongwith speed reduction schemes thereby weakening the nexus between road accidents, injuries and deaths with expansion in road network. The numbers of persons injured per ten thousand km of road length have risen from 590 in 1970 to 1273 in 2008 [Chart 3 (c)]; similarly persons killed per ten thousand km of road length more than doubled from 122 in 1970 to 292 in 2008 [Chart 4(c)]. However, both these parameters have undergone ups and downs over the last decade. 6
15 Chart 2 a : Number of Road Accidents per lakh population (2009) Chart 2 b : Number of Road Accidents per ten thousand vehicles (2009) Chart 2 c : Number of Road Accidents per ten thousand km of Road Length (2008)
16 Chart 3 a : Number of Persons Injured per Lakh Population (2009) Chart 3 b : Numer of Persons Injured per Ten Thousand Vehicles (2009) Chart 3(c): Number of Persons Injured per Ten Thousand Km. of Road Length (2008)
17 Chart 4 a : Number of Persons Killed per Lakh Population ( 2009) Chart 4( b): Number of Persons Killed per ten thousand Vehicles (2009) Chart 4 c : Number of Persons killed per ten thousand kms. of road length (2008)
18 5. Road Accidents: Inter State Comparisons 5.1 Table 3 provides a share of top five States in India in total number of road accidents, persons killed in road accidents, persons injured in road accidents in the backdrop of their share in India s motor vehicle population. Table: 3 - All India Share of Select States (in %): Road Accidents, Injuries, Deaths and Registered Motor Vehicles State/UT (P) Top 5 States: Share in Total Number of Road Accidents (in %) Share of 5 States Maharashtra Tamilnadu Madhya Pradesh Karnataka Andhra Pradesh Share of the above States in total Registered Vehicles. Top 5 States: Share in Total Number Killed in Road Accidents (in %) Share of 5 States Andhra Pradesh Uttar Pradesh Tamilnadu Maharashtra Karnataka Share of the above States in total Registered Vehicles. Top 5 States: Share in Total Number of Injuries in Road Accidents (in %) Share of 5 States Tamilnadu Karnataka Madhya Pradesh Andhra Pradesh Maharashtra Share of the above States in total Registered Vehicles. Note: Totals may not tally due to rounding. P : Provisional 10
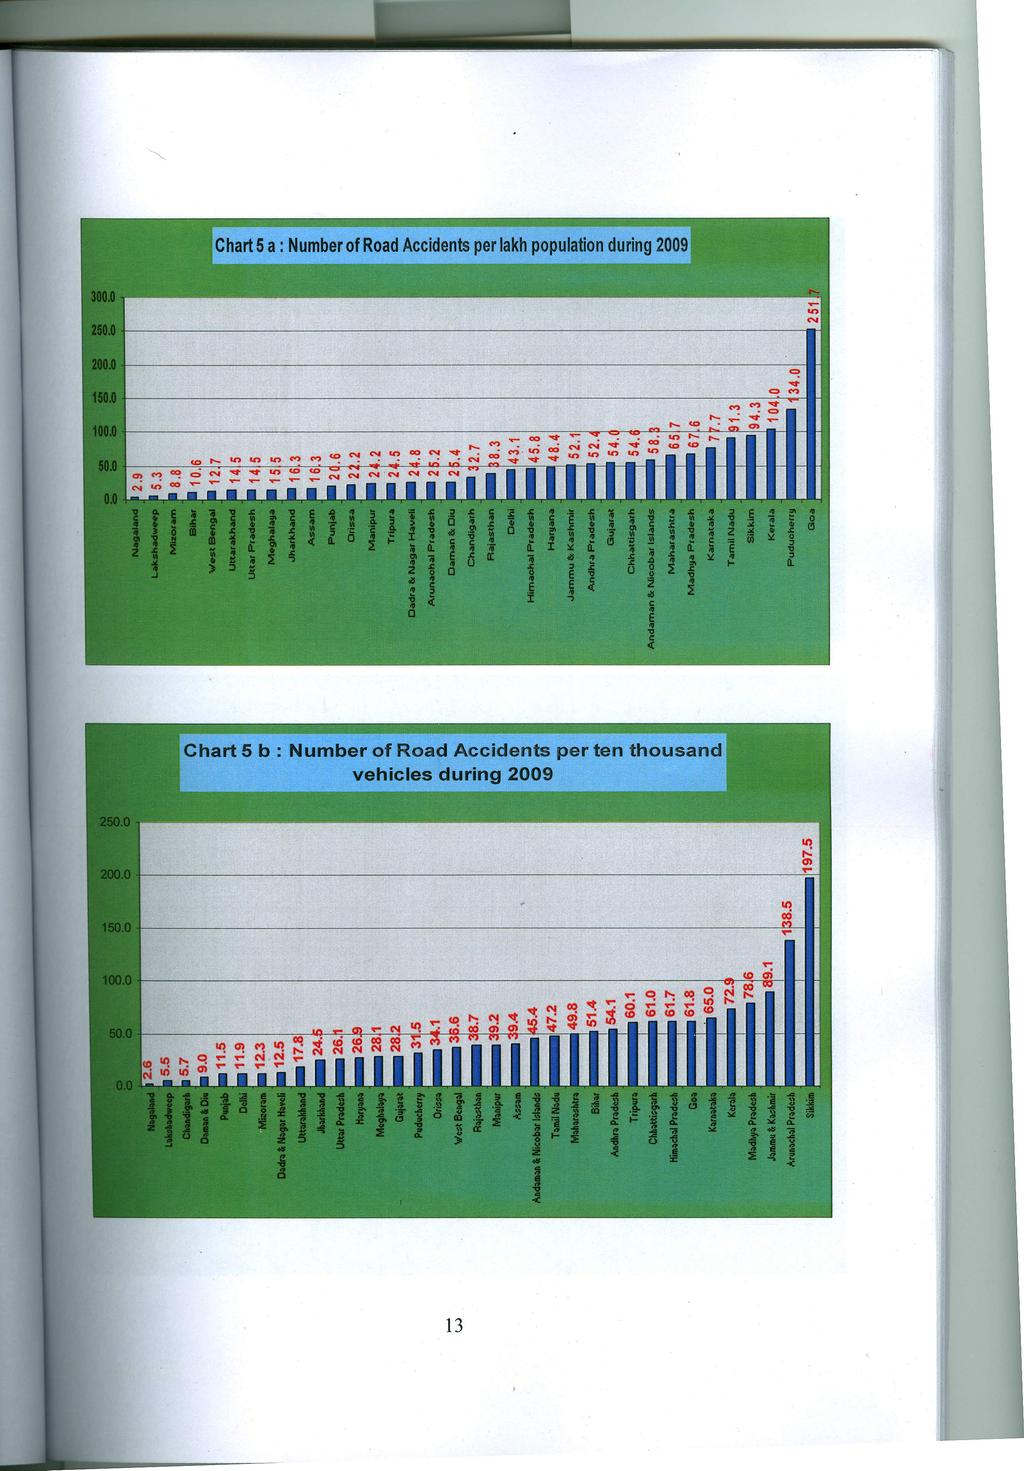
19 5.2 Among the States, Kerala and Gujarat stand out in contrast as regards accidents. Kerala offers an interesting case as it accounts for a share about 4.2 % in total registered vehicles in 2009 compared to its much higher share in total road accidents (7.3% in 2009) [Annex-I A] and persons injured in road accidents (8% in 2009) [Annex-I B]. However, Kerala accounts for a lower share of 3% in the total road accident related deaths during 2009 [Annex-I C]. Factors, which may contribute to high rate of accidents, are population density, road density and composition of vehicle population. 5.3 On the other hand, Gujarat accounts for a share of 9.6% in the number of registered vehicles in 2009 but lower shares of 6.4% [Annex-I A], 6.4% [Annex-I B] and 5.6% [Annex-I C] in total road accidents, persons injured and persons killed respectively in road accidents in Incidence of Road Accidents, Injuries and Deaths: States & UTs. 5.4 Inter State /UT comparisons of accident related data need to be viewed keeping in view the differences in road network, state of roads, size of human and vehicular population, levels of urbanization and accident reporting systems. These parameters have implications for accident rates across the States. 5.5 Incidence of accident normalized in terms of road length, human population or vehicle population provides comparable accident data across States and UTs. Per Lakh of Population 5.6 Number of road accidents per lakh of population at all-india level has slightly edged up from about 40.1 in 2004 to 42 in 2009 [Chart 2a] with wide variations among States. During 2009 the number of road accidents per lakh of population was highest in Goa (252) followed by Puducherry (134) in contrast to a low of 2.9 reported by Nagaland [Chart 5a] [Annex-II A]. 5.7 Number of persons injured per lakh of population at all-india level due to road accidents has increased from about 42 in year 2005 to about 44.4 in 2009 [Chart 3 (a)] [Annex-II B] with significant inter state variations. Goa and Puducherry had the highest number of persons injured 11
20 per lakh of population at 179 and 137 respectively in 2009 followed by Kerala at 122. Lakshadweep, Nagaland and Bihar reported the lowest number of persons injured per lakh of population at around 4, 7 and 7.5 respectively. 5.8 Number of deaths per lakh of population due to road accidents has risen from 8.6 during 2005 to 10.8 during 2009 (Chart 4a) with significant variation across States [Annex-II C]. The highest number of persons killed per lakh of population in 2009 on account of road accidents was in Tamil Nadu (20.7) followed by Goa (19.4), and Haryana(18.7) [Chart 6(a)]. On the other hand, Nagaland reported the lowest figure of 2.5 followed by Lakshadweep at 2.7. Per ten thousand vehicles 5.9 The all-india average of road accidents per ten thousand vehicles has consistently declined over the years and fallen to about 42 in 2009 [Chart 2 (b)] with variations across the States/UTs [Annex- II A]. For the year 2009, Sikkim had the highest number of road accidents per 10,000 vehicle population at about 198 followed by Arunachal Pradesh at 139 [Chart 5b]; the lowest figure reported was by Nagaland (2.6) Similarly, the number of persons injured due to road accidents per 10,000 vehicles has consistently fallen over the years from 500 in 1970 to 45 in 2009 [Chart 3 (b)] with variation across the States /UTs [Annex-II B]. For the year 2009, Arunachal Pradesh had the highest number of persons injured per 10,000 vehicles at around 240 followed by Sikkim at The number of persons killed due to road accidents per 10,000 vehicles has also declined steeply from 28 in 1990 to 10.9 in 2009 with variation across the States [Annex-II C]. In terms of fatalities, Arunachal Pradesh and Sikkim had the highest road related accident deaths per ten thousand vehicles at 72 and 31 respectively during 2009 [Chart 6(b)]. 12
21

22
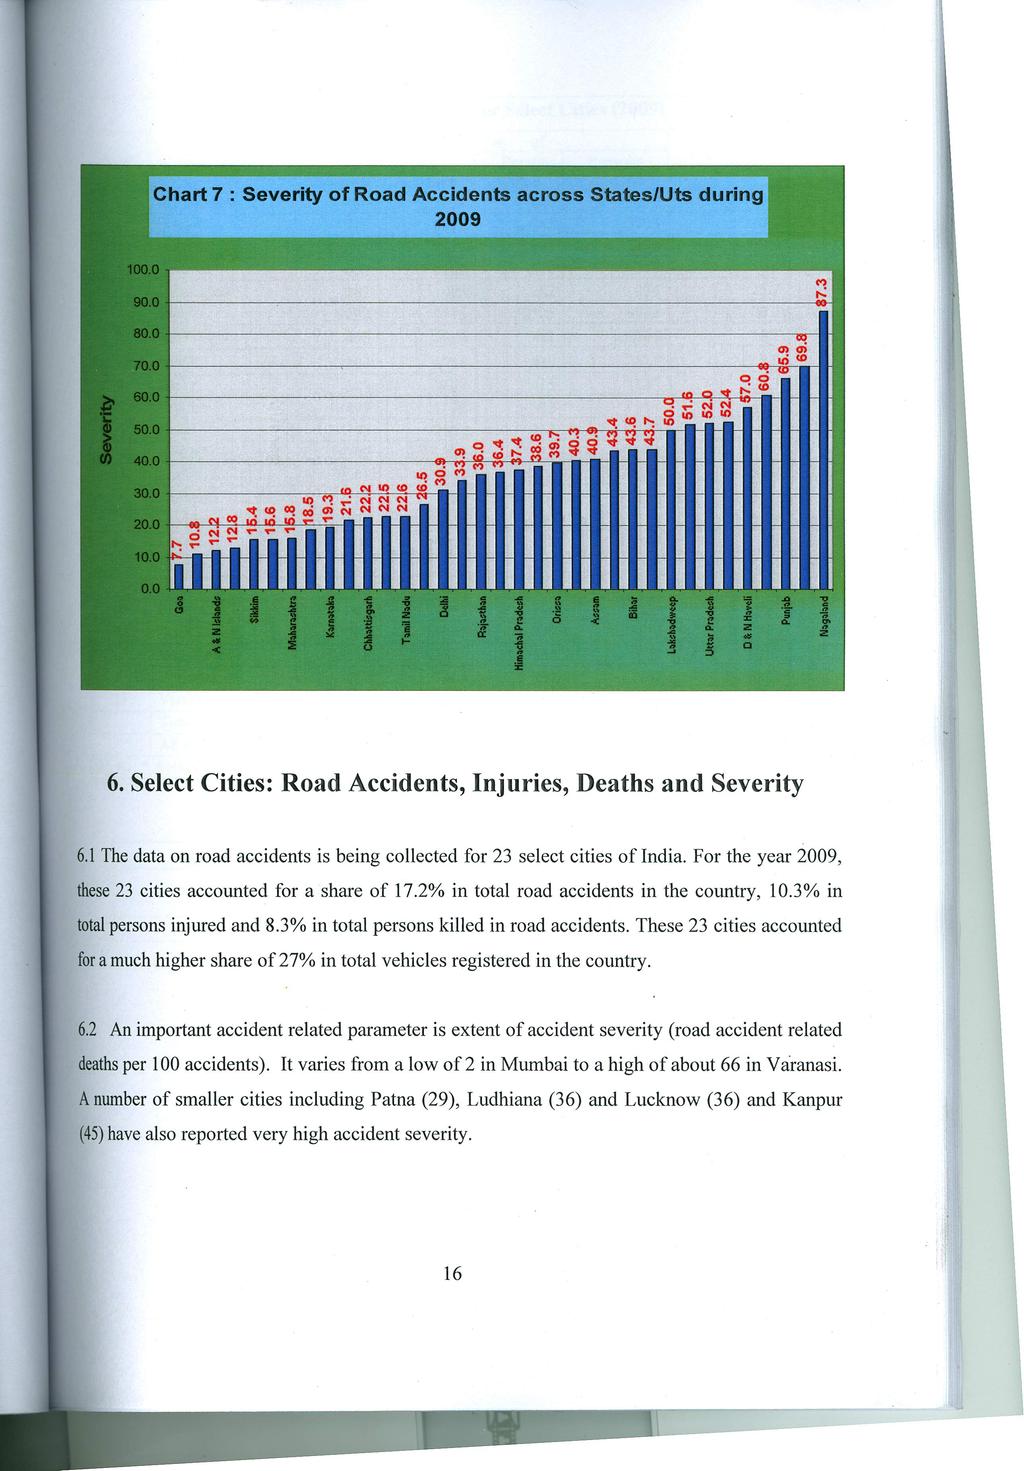
23 Table 4 : Severity of Road Accident in India (Statewise) Persons Killed per 100 Accidents State/UT (P) States 1 Andhra Pradesh Arunachal Pradesh Assam Bihar Chhattisgarh Goa Gujarat Haryana Himachal Pradesh Jammu & Kashmir Jharkhand Karnataka Kerala Madhya Pradesh Maharashtra Manipur Meghalaya Mizoram Nagaland Orissa Punjab Rajasthan Sikkim Tamil Nadu Tripura Uttarakhand Uttar Pradesh West Bengal UTs 1 Andaman & Nicobar Islands Chandigarh Dadra & Nagar Haveli Daman & Diu Delhi Lakshadweep Puducherry National Average P: Provisional 15
24
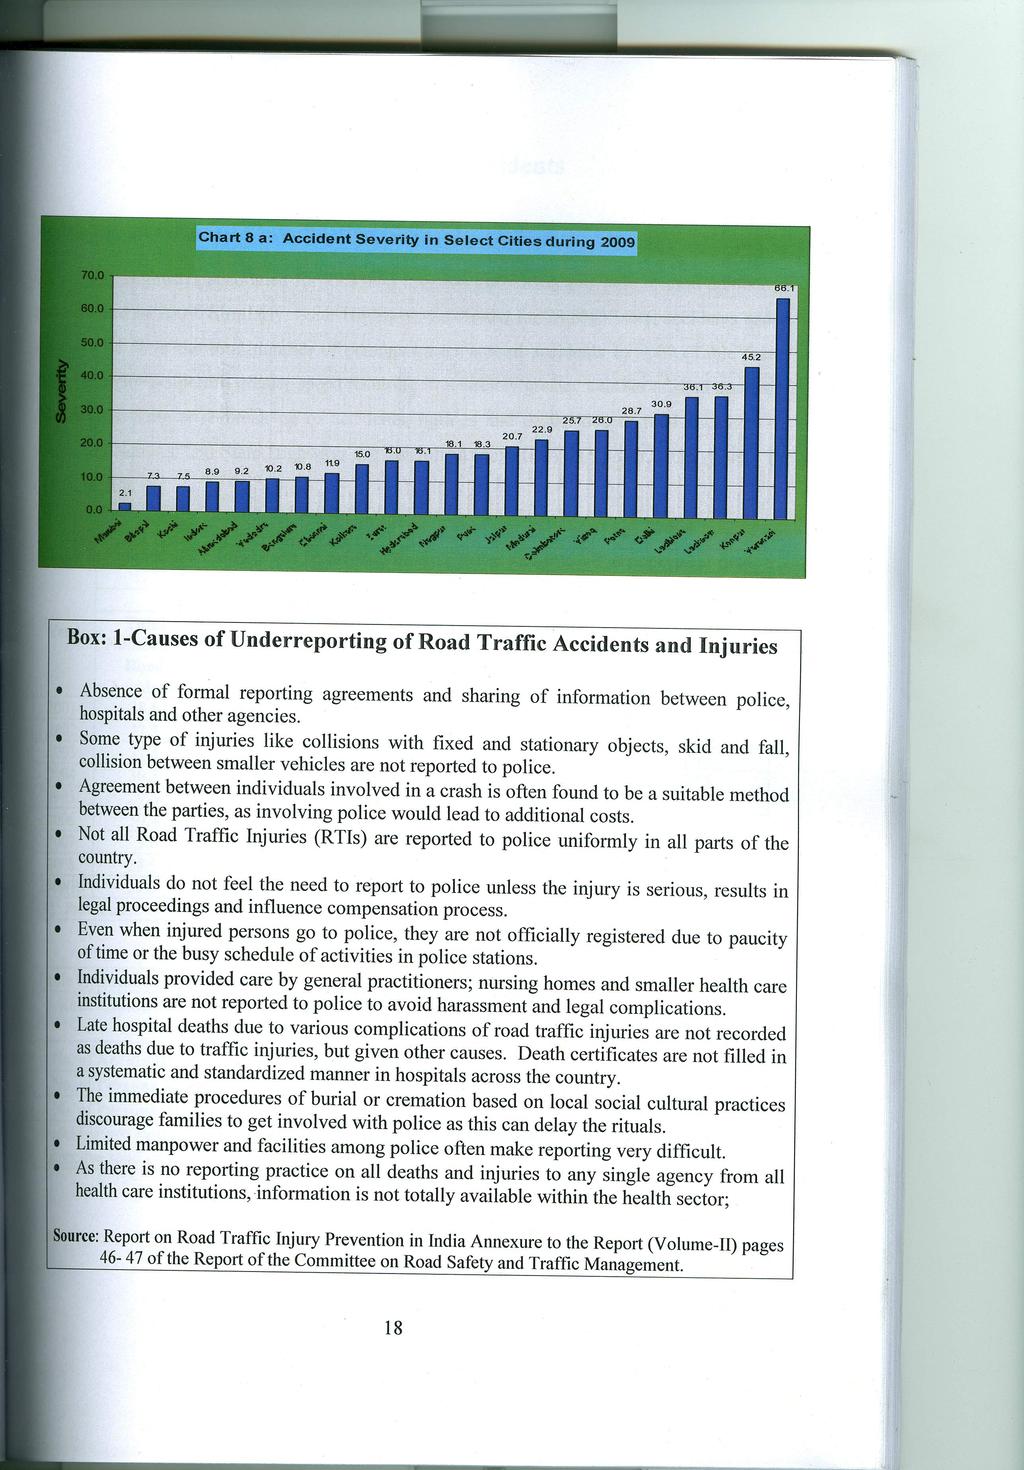
25 Table 5A: Road Accident Profile for Select Cities (2009) Total No. of Accident Sl. No. Name of city Fatal Accidents All Accidents Persons Killed Persons Injured Severity* 1 Ahmedabad Bengaluru Bhopal Chennai Coimbatore Delhi Hyderabad Indore Jaipur Kanpur Kochi Kolkata Lucknow Ludhiana Madurai Mumbai Nagpur Patna Pune Surat Vadodara Varanasi Visakhapatnam Total 23 cities All India Note: * Accident Severity: Road accident deaths/100 accidents Table 5 B : Percent Share of 23 Cities in Road Accidents during All Accidents Fatal Accidents Persons Killed Persons Injured
26
27 7. Classification of Accidents Accidents in terms of Classification of Roads 7.1 National Highways accounted for 29.3% in total road accidents and 36% in total number of persons killed in Similarly, State Highways accounted for 23.8%of total accidents and a share of 27.1 % in the total number of persons killed in road accidents in 2009 (Table 6 and Table 7). Highways permit greater speed resulting in relatively greater number of road accidents and fatalities. State wise break up of accidents, injuries and deaths due to road accidents on stretches of National and State Highways are given in Annex-III (A), (B) & (C) and Annex- IV (A), (B) & (C). Table 6: Number of Accidents and Number of persons Killed and Injured as per type of road National Highways State Highways Percentage share in Percentage share in Year Total Number of Number of Total Number of Number of Number of Persons Persons Number of Persons Persons Road Killed Injured Road Killed Injured Accidents Accidents (P) (P) : Provisional Table 7: Number of Accidents, persons killed & injured as per road classification (2009) Road Classification National State Other Roads Highways Highways No. of Accidents 1,42,511(29.30) 1,15,992(23.85) 2,27,881(46.85) No. of Persons Killed 45,222(35.99) 3,40,93(27.13) 46,345 (36.88) No. of Persons Injured 1,52,816(29.65) 1,31,517(25.51) 2,31,125 (44.84) Note: Figures within parenthesis indicate share in total accidents, killed and injured in the respective road categories. 19
28 Chart 10 a: Road Accidents and Road Length as per Classification of Roads 100% 90% 80% 70% % 50% 40% Other Roads SH NH 30% 20% 10% 0% 29.3 No. of Road Accidents Road Length 2008 Spatial distribution of Road Accidents (Urban vis-à-vis Rural) 7.2 An understanding of spatial distribution of road accidents is vital for diagnosis. At a broad level it helps in identifying places and regions with high incidence of accidents. In 2009, the total number of accidents that occurred in rural areas was more than that in the urban areas; the former accounting for 52.6% (2,55,697) and the latter accounting for 47.4% (2,30,0687) of total accidents. Rural areas also had more fatalities (61.7%) than urban areas (38.3%). The number of persons injured was also more in rural areas (60.2%) as compared to urban areas (39.8%). 20
29 8. Accidents in terms of involvement by Vehicle type 8.1 Motorized vehicles accounted for 92.1% of the total road accidents while the non-motorized vehicles and other objects accounted for a small share of 7.9% in the total number of accidents in the year Amongst the vehicle category - trucks, tempos, tractors and other articulated vehicles accounted for the highest share in total road accidents (22.6%) followed by two wheelers (22.4%), cars, jeeps and taxis (20.6%), buses (8.7%), auto rickshaws (6.9%) and other motor vehicles (10.9 %) in 2009 [Table 8]. Details of accidents in terms of vehicle typology are given in Annex-VII. Table 8: Share of Different Vehicles in total Road Accidents, Fatal Accidents, Persons Killed and Persons Injured (2009) 2- Autorickshaw wheelers Cars Buses Trucks, tempos, tractors and other articulated vehicles Other Motor Vehicles Other Vehicles /Objects Accidents Fatal Accidents Persons Killed Persons Injured Note: Cars includes jeeps & taxis, Two-Wheelers includes Motor cycle, Scooter & Moped; Other Vehicles/Objects includes Cycle, Cycle rickshaws, Hand drawn vehicle, Pedestrian, Animal, Tree, Level crossing & Other fixed objects. 8.2 However, the category of trucks, tempos, tractors and other articulated vehicles accounted for about 28.7% of the persons killed compared to their share of about 22.6 % in the total road accidents. Similarly, buses accounted for a higher share of fatal accidents and deaths 9.5% and 10.3% respectively compared to its share of 8.7% in accidents. The share of various vehicle categories in total road accidents, persons killed and injured are given in Charts 11(a), 11(b) & 11(c) respectively. 21
30 Chart 11 a : Percent Share in Total Road Accidents by Type of Motor Vehicle Involved (Primarily Responsible) during Tw o Wheelers Auto Rickshaw s Car, Jeeps, Taxis Buses Trucks, Tempos,MAVs,,Tractors Others Other Vehicles/Objects Chart 11 b : Percent Share of Persons Killed in Road Accidents by Type of Motor Vehicle (Primarily Responsible) during % 10% 16% 4% 18% 28% 10% Tw o Wheelers Car, Jeeps, Taxis Trucks, Tempos,MAVs,,Tractors Other Vehicles/Objects Auto Rickshaw s Buses Others Chart 11 c : Percent Share of Persons Injured in Road Accidents by Type of Motor Vehicle (Primarily Responsible) during % 10% 16% 4% 18% 28% 10% Tw o Wheelers Car, Jeeps, Taxis Trucks, Tempos,MAVs,,Tractors Other Vehicles/Objects Auto Rickshaw s Buses Others 22
31 Chart 12 : Percent Share of Persons Killed in Road Accidents by Type of Road User Category during Pedestrian Motor Cycles,Scooters,Mopeds Car, Taxis etc. Buses Other Objects Bicycles Auto Rickshaws Trucks Other Motor Vehicles Occupants of (i) two-wheelers, (ii) passenger cars & taxis, (iii) trucks and (iv) buses accounted for 21.9%, 15.8%, 12.5% and 10.3 % of total road fatalities. Bicycle riders (4.3%) & pedestrians (12.7%) are the most unprotected road users and have to share scarce road space with motorized vehicles of different engine power and speed resulting in serious conflicts within traffic flows. For state-wise data refer Annex-XII. 9. Time of Occurrence of Road Accidents 9.1 Information on timing of accidents is important for framing strategies for prevention and for organization of care of accident victims. The distribution of the total accidents during night time (6 PM to 6 AM) and day time (6 AM to 6 PM) is approximately in the ratio of 2:3 i.e. about 41% during night time and 59% during daytime. 23
32 Table:9- Road Accidents as per the Time of Occurrence(2009) Time No. of Accidents Percent Share in total Accidents 06:00-09:00 hrs (Day) 57, :00-12:00 hrs (Day) 78, :00-15:00 hrs (Day) 72, :00-18:00 hrs (Day) 79, :00-21:00 hrs (Night) 76, :00-24:00 hrs (Night) 49, :00-03:00 hrs (Night ) 32, :00-06:00 hrs (Night) 38, Total for 24 hrs whole year 4,86, Chart 13: Distribution of Total No. of Road Accidents as per time of Occurance during :00-06:00 hrs(night) 00:00-03:00 hrs( Night ) 21:00-24:00 hrs(night) 18:00-21:00 hrs(night) 15:00-18:00 hrs(day) 12:00-15:00 hrs(day) 09:00-12:00 hrs(day) 06:00-09:00 hrs(day)
33 10. Age Profile of Accident Victims (Other than drivers) 10.1 As per the detailed age profile of accident victims other than the drivers available for the year 2009 it is observed that the age group (25-65 years) accounted for the largest share of 53% of total road accident casualties followed by the age group (15-24 years) with a share of about 30%. Hence, about half of the road traffic casualties are in the age group (25-65 years), which is the key wage earning age group. The loss of the main earning member can be disastrous, leading to fall in income of the household and lower living standards. Chart 14: Road Accidents victims (other than Drivers) by Age group during Years & above 11. Causes of Road Accidents 11.1 The analysis of accidents in terms of causal factors shows that drivers fault is the single most important factor responsible for accidents, fatalities and injuries. Drivers fault accounted for 78.5% (3,81,648 accidents) of total accidents; 77.4% (3,99,113 persons injured) of the total number of persons injured and 71.7% (90,053 persons killed) of the total number of persons killed in road accidents during The fault of the cyclists and that of the pedestrians appears to be of marginal consequence accounting for a share of 12% and 2.2% respectively of the accidents. Similarly, cyclists and pedestrians were responsible for about 1.6% and 2.8% respectively of total number of persons killed. The accidents caused due to defects in the motor 25
34 vehicles also accounted for 1.8% and 2.5% of road accidents and fatalities respectively. Tables enumerating the causes of accidents across the States are provided in Annex-V Within the category of drivers fault, accidents caused due to Exceeding lawful speed accounted for a high share of 57.5% (2,19,305 out of 3,81,648 accidents). Similarly, persons killed due to excessive speed by drivers was to the tune of 5.9%. State-wise details are at Annex-VI Intake of alcohol / drugs by drivers resulted in 27,152 road accidents and 9,307 fatalities. As percent share of total accidents and deaths due to drivers fault, intake of alcohol/drugs accounted for 7.1% and 10.3% respectively. State-wise details are at Annex-VI Overloading/overcrowding of vehicles accounted for 96,012 road accidents and 28,444 road deaths. As a share of total road accidents and deaths, these figures constituted 19.7% and 22.6% respectively. State-wise details are at Annex-VII. Chart 15: Causes of Road Accidents Fault of Driver Fault of Pedestrian Defect in Road Condition All Other Causes Fault of Cyclist Defect in Condition of Motor Vehicle Weather Condition 26
35 12. International Comparison of Road Traffic Injury Accidents and Deaths 12.1 Cross country comparisons of incidence of road accident related deaths and injury accidents per lakh persons as per World Road Statistics 2010 (published by International Road Federation, Geneva) showed lower incidence of both the parameters for India in comparison to many developed and developing countries. The number of road accident deaths per lakh of population at 10.8 in India was much lower compared with in the Republic of Korea, in USA and the Russian Federation (21.06) (Chart 16). The highest number of deaths per lakh of population was reported for Anguilla (31.25) in 2007, followed closely by South Africa (31.18) in For the year 2008, Malaysia reported the highest figure of and the Philippines reported the lowest number of deaths per lakh population at 1.21 in Countries which showed lower persons killed per 1,00,000 population were Japan (4.04), United Kingdom (4.13), Germany (5.45) and China (5.55). Similarly, injury accidents per lakh of population both in India and China were substantially lower at around and respectively when compared with France (119.63), United Kingdom (287.88), Germany (390.47), Republic of Korea (444.01) and the U.S.A. (536.08). Qatar reported the the highest injury accident rate at in 2002, but for 2008 the highest figure was reported by Japan (599.94). Niger (3.38) and Philippines (4.39)) reported the lowest figures in respect of injury accidents per persons. A cross country comparison of incidence of road related deaths and injury accidents of select countries are given in Table The World Health organization brought out its Global Status Report on Road Safety in June This report involved the first broad assessment of the status of road safety in 178 countries, using data drawn from a standardized survey conducted in The key findings of this report are summarized in Box 2. This report also cites data from the World Health Statistics (refer Table 12) to indicate that road traffic injuries would become the fifth highest leading cause of death, outranking diabetes mellitus, HIV/AIDS, certain form of cancers and tuberculosis, in 2030 as compared to its ninth position in
36 12.3 A comparative status of road accidents and persons killed between China and India is given in Table 11. Chart 17 and Chart 18 clearly brings out that whereas in China both road accidents and fatalities are on a downward slide; in case of India both road accidents and number of persons killed are steadily rising. Chart 16: Country-wise Number of Persons Killed per Population Philippines Niger Japan U.K. Germany China France Denmark Australia Italy Canada Indonesia India Korea, Republic of U.S.A. Jordan Kuwait Qatar Brazil Russian Federation Malaysia South Africa Anguilla 28
37 Table 10: Cross Country Comparison of Incidence of Road related Deaths and Injury Accidents in 2008* Sl. No. Country Killed per Population Injury Accidents per Population 1 Anguilla (2007) N.A. 2 Australia Brazil (2006) (2004) 4 Canada China Denmark France Germany Indonesia India (2009) (2009) 11 Italy Japan Jordan Korea, Republic of Kuwait (2004) 2, (2004) 16 Malaysia Niger Philippines Qatar (2007) 9, (2002) 20 Russian Federation South Africa (2007) (2007) 22 United Kingdom United States of America Note: Injury accident refers to road accident resulting in at least one injury or killed person. * Data for 2008 or for the latest year available & reported in WRS 2010, (indicated in parentheses). Source: 1. For India Transport Research Wing, Ministry of Road Transport & Highways. 2. For Other Countries - World Road Statistics (WRS) Table 11: Trends in Road Accident Scenario: India and China (2004 to 2008) Year No. of Road Accidents No. of Persons Killed India China India China ,29,910 5,17,889 92,618 1,07, ,39,255 4,50,254 94,968 98, ,60,920 3,78,781 1,05,749 89, ,79,216 3,27,209 1,14,444 81, ,84,704 2,65,204 1,19,860 73,484 Source: World Road Statistics 2010, International Road Federation, Geneva, for data on China; State Police Departments for data on India. 29
38 Table 12: Leading Causes of Death, 2004 and 2030 compared TOTAL 2004 TOTAL 2030 Rank Leading Cause % Rank Leading Cause % 1 Ischaemic heart disease Ischaemic heart disease Cerebrovascular disease Cerebrovascular disease Lower respiratory infections Chronic obstructive pulmonary 7.0 disease 4 Chronic Obstructive pulmonary Lower respiratory infections 5.1 disease 5. Diarrhoeal diseases Road traffic injuries HIV/AIDS Trachea, bronchus, lung cancers Tuberculosis Diabetes mellitus Trachea, bronchus, lung cancers Hypertensive heart disease Road traffic injuries Stomach cancer Prematurity and low birth weight HIV/AIDS Neonatal infections and other Nephritis and nephrosis Diabetes mellitus Self-inflicted injuries Malaria Liver cancer Hypertensive heart disease Colon and rectum cancer Birth asphyxia and birth trauma Oesophagus cancer Self-inflicted injuries Violence Stomach cancer Alzheimer and other dementias Cirrhosis of the liver Cirrhosis of the liver Nephritis and nephrosis Breast cancer Colon and rectum cancers Tuberculosis 1.1 Source: World Health Statistics 2008 cited in Global Status Report on Road Safety: A Time for Action, WHO. Chart 17: Total Number of Road / Injury Accidents India China 30
39 Chart 18: Total Number of Persons Killed in Road Accidents India China Box 2: Key Findings of Global Status Report on Road Safety Time for Action Data from the survey conducted during 2008 indicate 0.66 million reported deaths due to road accidents while estimation as per the model used by the Global Status Report on Road Safety indicate 1.23 million deaths globally reflecting a difference of over 46%. Low-income and middle-income countries indicate very high fatality rates (per persons) estimated at 21.5 and 19.5 respectively vis-à-vis 10.3 in high income countries. Among low income countries, the African region has been estimated to have the highest fatality rate of Over 90% of the world s fatalities on the roads occur in low-income and middle-income counties, which have only 48% of the world s registered vehicles. Almost half of those who die in road traffic crashes are pedestrians, cyclists or users of motorized two-wheelers- collectively known as vulnerable road users and this proportion is higher in the poorer economies of the world. Speed is a key risk factor for injury among pedestrians and cyclists, and yet only 29% of counties meet basic criteria for reducing speed in urban areas, while less than 10% of counties rate the enforcement of their speed limits as effective. The adoption and enforcement of traffic laws appears inadequate in many counties. The development of effective enforcement of legislation is critical in reducing drink-driving and excessive speed, and in increasing the use of helmets, seat-belts and child restraints. This survey showed that fewer than half the countries have laws to address all five of these risk factors, while only 15% have laws that can be considered comprehensive in scope. Addressing road safety in a comprehensive manner necessitates the involvement of multiple sectors, such as heath, transport and police. Only one-third of the countries have a national road safety strategy that is endorsed by the government, that includes specific targets, and that has funding allocated for its implementation. Huge gaps remain in the quality and coverage of the data that countries collect and report on road traffic injuries. Underreporting of road traffic fatalities remains a big problem in many countries and the situation is even worse with regard to non-fatal injuries. Just 22% of countries had information on the extent of their road traffic injury problem, the costs incurred by their health sector or their national economies, and the data needed to monitor and evaluate interventions accurately. 31
3. Trends in accidents, injuries, fatalities, motor vehicles & road network
 2.2 In economic terms, the cost of road crash injuries is estimated at roughly 1 percent of gross national product (GNP) in low-income countries, 1.5 percent in middle-income countries and 2 percent in
CHAPTER 1 ACCIDENTAL DEATHS IN INDIA
 CHAPTER 1 ACCIDENTAL DEATHS IN INDIA Incidence and Rate of Accidental Deaths during the Decade (1997-2007) The incidence of accidental deaths has shown a mixed trend during the decade 1997-2007 with an
Road Safety Infrastructure Facility Standards Indian Context
 Road Safety Infrastructure Facility Standards Indian Context Tony Mathew Road Safety Professional Advisor, IRF Tony.maths@gmail.com Contents AH & NH network in India Key Infrastructure Issues affecting
U n i t 1. Magnitude and impact of road traffic injuries
 U n i t 1 Magnitude and impact of road traffic injuries 1 WHO, 2007 Objectives Objectives By the end of this unit, the trainee should be able to: describe the global magnitude and trends of road traffic
A Silent Tsunami on Indian Road: A Comprehensive Analysis of Epidemiological Aspects of Road Traffic Accidents
 . British Journal of Medicine & Medical Research British Journal of Medicine & Medical Research 1(1): 14-23, 2011 SCIENCEDOMAIN international www.sciencedomain.org A Silent Tsunami on Indian Road: A Comprehensive
AN OVERVIEW. Road Accidents in Delhi 2015
 1 AN OVERVIEW Road accident injuries claim more than 1.2 million lives each year and have a huge impact on health and development. In addition to deaths on the roads, up to 50 million people incur non-fatal
1-3 Business Days. 1-3 Business Days. 1-9 Business Days
 HOW TO CALCULATE THE CHARGES THAT APPLY TO YOUR SHIPMENT Choose the service you wish to use. Find the zone in which your destination/origin falls in the Zone Tables. Determine the total weight of your
Introduction. 2
 Introduction In 2010, the United Nations General Assembly adopted Resolution 64/255 proclaiming 2011 2020 to be a Decade of Action for Road Safety. 1 In order to establish a baseline for the road safety
Road Safety: African Action Plan for the Global Decade of Action for Road Safety
 The First Ordinary Session of the African Union Specialized Technical Committee on Transport, Intercontinental and Interregional Infrastructures, Energy and Tourism THEME: Financing Infrastructure in Africa
PLANNING FOR SUSTAINABLE PEDESTRIAN INFRASTRUCTURE NALIN SINHA INITIATIVE FOR TRANSPORTATION & DEVELOPMENT PROG. (ITD), DELHI
, DELHI") PLANNING FOR SUSTAINABLE PEDESTRIAN INFRASTRUCTURE NALIN SINHA INITIATIVE FOR TRANSPORTATION & DEVELOPMENT PROG. (ITD), DELHI India s Road Network 5 million kms: Total road length 2.6 mn kms: Surfaced
PLANNING FOR SUSTAINABLE PEDESTRIAN INFRASTRUCTURE NALIN SINHA INITIATIVE FOR TRANSPORTATION & DEVELOPMENT PROG. (ITD), DELHI India s Road Network 5 million kms: Total road length 2.6 mn kms: Surfaced
SECTION 1. The current state of global road safety
 SECTION 1 The current state of global road safety The number of road traffic deaths each year has not increased but remains unacceptably high at 1.24 million per year. Many countries have successfully
Meerut: Source: RTO & Census Cars Jeeps Taxis Buses. Wheelers. Rise of Vehicle Population in Meerut
 Presenter: Sandeep Laha & Parvez Bashir Mentor: Mr. Pawan Kumar Meerut: Meerut is the 16 th Largest Metropolitan area in India. Urban Population was approx 13.5 lacs in 2011 and Projected compounded annual
Road safety. REGIONAL COMMITTEE Provisional Agenda item 8.5. SEA/RC70/11 Malé, Maldives 6 10 September July Seventieth Session
 REGIONAL COMMITTEE Provisional Agenda item 8.5 Seventieth Session SEA/RC70/11 Malé, Maldives 6 10 September 2017 21 July 2017 Road safety Road traffic injuries constitute a major public health burden with
ROAD SAFETY SCENARIO IN INDIA AND PROPOSED ACTION PLAN
 ROAD SAFETY SCENARIO IN INDIA AND PROPOSED ACTION PLAN P.K. Sikdar * and J.N. Bhavsar ABSTRACT Fatalities in road accidents in India constitute 8-10 per cent of global road deaths. This phenomenon is like
Government of India Earth System Science Organization Ministry of Earth Sciences India
 Government of India Earth System Science Organization Ministry of Earth Sciences India Meteorological Department Dated: 10 May, 2018 Current Weather Status and Outlook for next two weeks Highlights of
Road Accident Analysis of Srinagar City
 Road Accident Analysis of Srinagar City Musaib Ul Zaman 1, Ishfaq Shafi Masoodi 2 1 M.tech, Transportation Engineering, AP Goyal Shimla University, Shimla, India 2 M.tech, Construction Technology & Management,
More than half the world lives on less than $2 a day
 More than half the world lives on less than $2 a day PRB s 2005 World Population Data Sheet reveals persisting global inequalities in health and well-being Presentation by Bill Butz, Carl Haub, Linda Jacobsen,
Road Safety Annual Report 2016 OECD/ITF Chapter 26. Morocco
 Road Safety Annual Report 2016 OECD/ITF 2016 Chapter 26 Morocco This chapter presents 2014 road safety data for Morocco along with provisional data from 2015. It looks at trends in traffic and road safety
Impact of Preservation of Subsoil Water Act on Groundwater Depletion: The Case of Punjab, India
 Impact of Preservation of Subsoil Water Act on Groundwater Depletion: The Case of Punjab, India Amarnath Tripathi 1, Ashok K. Mishra 2, & Geetanjali Verma 3 1 FASAL Programme, Institute of Economic Growth,
Road safety status in the WHO South-East Asia Region, 2013
 Road safety status in the WHO South-East Asia Region, 2013 2013 (1) (2) (3) Key facts at a glance Road traffic crashes accounted for 334 815 deaths in the South-East Asia Region during 2010, with the rate
Road safety in the Eastern Mediterranean Region
 Road safety in the Eastern Mediterranean Region Facts from the Global Status Report on Road Safety 2013 Road safety in the Eastern Mediterranean Region Introduction In 2004, the World Health Organization
CHAPTER 1 INTRODUCTION
 1 CHAPTER 1 INTRODUCTION 1.1 GENERAL Road accidents are one of the major causes of death, injury and disability in all over the world both in developed and developing countries. With a broad estimate,
IDENTIFICATION OF BLACKSPOT REGION ALONG ANANDAPURAM TO ANAKAPALLI STRECH VIA SH-38
 IDENTIFICATION OF BLACKSPOT REGION ALONG ANANDAPURAM TO ANAKAPALLI STRECH VIA SH-38 S.Naveen Kumar 1,O.Ganesh Kumar 2,K.Swetha 3 1,2,3 Assistant Professor,Department of Civil Engineering, Sai Ganapathi
TRIPP ROAD SAFETY IN INDIA STATUS REPORT. Dinesh Mohan, Geetam Tiwari and Kavi Bhalla TRANSPORTATION RESEARCH AND INJURY PREVENTION PROGRAMME
 TRIPP TRANSPORTATION RESEARCH AND INJURY PREVENTION PROGRAMME ROAD SAFETY IN INDIA STATUS REPORT Dinesh Mohan, Geetam Tiwari and Kavi Bhalla WHO COLLABORATING CENTRE 2015 INDIAN INSTITUTE OF TECHNOLOGY
Stop Road Accidents Before They Stop Us
 28 Rajeev D. Mathur..... Stop Road Accidents Before They Stop Us Recently in Jaipur, capital of the state of Rajasthan, India, a senior serving civil servant was killed early in the morning by a speeding
A Road Safety Decade - The Case for Action
 A Road Safety Decade - The Case for Action Presentation by Dmitry Sambuk International Coordinator, Make Roads Campaign, FIA Foundation Monday 12 May 2009, Minsk, Republic of Belarus World Report on Road
No.32-20/2015-NDM-I Ministry of Home Affairs (Disaster Management Division) SOUTHWEST MONSOON-2015: DAILY MONSOON/FLOOD SITUATION REPORT
 SOUTHWEST MONSOON-2015: DAILY MONSOON/FLOOD SITUATION REPORT") No.32-20/2015-NDM-I Ministry of Home Affairs (Disaster Management Division) SITREP NO.150/2015 1700 hours Dated, the 29 th October 2015 Subject: SOUTHWEST MONSOON-2015: DAILY MONSOON/FLOOD SITUATION REPORT
No.32-20/2015-NDM-I Ministry of Home Affairs (Disaster Management Division) SITREP NO.150/2015 1700 hours Dated, the 29 th October 2015 Subject: SOUTHWEST MONSOON-2015: DAILY MONSOON/FLOOD SITUATION REPORT
STUDY AND ANALYSIS OF ACCIDENTS ON NH 71-A
 STUDY AND ANALYSIS OF ACCIDENTS ON NH 71-A SARANSH Department of Civil Engineering Institute of technology and science Bhiwani S.S KAZAL Department of Civil Engineering. Institute of technology and science
SUSTAINABILITY, TRANSPORT, & HEALTH. Ralph Buehler, Virginia Tech
 SUSTAINABILITY, TRANSPORT, & HEALTH Ralph Buehler, Virginia Tech Prepared for National Academies Roundtable on Science and Technology for Sustainability 6 December 2013 Overview Trends in Motorization
International Journal of Research (IJR) Vol-1, Issue-8, September *
 Vol-1, Issue-8, September *") Development towards Sustainable Transportation Planning in India through Management of Non-motorized Transport Akshay Patil 1 * & 2 * 1 3 rd year B. Tech Planning student at College of Engineering Pune,
Development towards Sustainable Transportation Planning in India through Management of Non-motorized Transport Akshay Patil 1 * & 2 * 1 3 rd year B. Tech Planning student at College of Engineering Pune,
Travel and Use of Mass Media and Financial Services by Indian Households
 Report No. 450(54/31/2) Travel and Use of Mass Media and Financial Services by Indian Households NSS 54th Round (Jan June 1998) National Sample Survey Organisation Department Of Statistics Government Of
Road Accidents Study Based On Regression Model: A Case Study of Ahmedabad City
 Road Accidents Study Based On Regression Model: A Case Study of Ahmedabad City Manisha Minesh Desai. ME student, Transportation engg. Civil Engg Dept. L.D. college of engg. Aahmedabad-15,Gujarat, India.
2015 Victorian Road Trauma. Analysis of Fatalities and Serious Injuries. Updated 5 May Page 1 of 28. Commercial in Confidence
 2015 Victorian Road Trauma Analysis of Fatalities and Serious Injuries Updated 5 May 2016 Page 1 of 28 Commercial in Confidence VICROADS_n3445896_2015_Victorian_Trauma_Report_- _updated_may_2016.docx 2015
Deaths/injuries in motor vehicle crashes per million hours spent travelling, July 2007 June 2011 (All ages) Mode of travel
 Mode of travel") Cyclists CRASH STATISTICS FOR THE YEAR ENDED 31 DECEMBER 211 Prepared by the Ministry of Transport CRASH FACTSHEET 212 Cyclists have a number of risk factors that do not affect car drivers. The main risk
Cyclists CRASH STATISTICS FOR THE YEAR ENDED 31 DECEMBER 211 Prepared by the Ministry of Transport CRASH FACTSHEET 212 Cyclists have a number of risk factors that do not affect car drivers. The main risk
A study of road accident deaths in Andhra Pradesh
 A study of road accident deaths in Andhra Pradesh D. Raja Reddy Introduction: A recent ghastly private bus accident in October of 2013 on a national highway in Andhra Pradesh leading to the death of 45
Setting Regional and National Road Safety Targets
 10 th Meeting of the United Nations Road Safety Collaboration 3-4 June 2009, Bangkok Setting Regional and National Road Safety Targets Commemorating 60 years in Thailand 1949-2009 Lives at stake people
SAVE THE NATION ASSOCIATION (SNA)
") SAVE THE NATION ASSOCIATION (SNA) A DRAFT DOCUMENT FOR BRASILLIA DECLARATION ON ROAD SAFETY CONTACT PERSONS: MESGANAW BIMREW, EXECUTIVE DIRECTOR CELL PHONE: +251920717744, EMAIL: mesganaw21@yahoo.com SEIFU
SAVE THE NATION ASSOCIATION (SNA) A DRAFT DOCUMENT FOR BRASILLIA DECLARATION ON ROAD SAFETY CONTACT PERSONS: MESGANAW BIMREW, EXECUTIVE DIRECTOR CELL PHONE: +251920717744, EMAIL: mesganaw21@yahoo.com SEIFU
 Government of India Earth System Science Organization Ministry of Earth Sciences India Meteorological Department Press Release Dated: 29 September, 2016 Subject: Current status of southwestt monsoonn 2016
Sydney, AUSTRALIA Beijing, CHINA Hyderabad, INDIA London, UK. Affiliated with the University of Sydney
 Sydney, AUSTRALIA Beijing, CHINA Hyderabad, INDIA London, UK Affiliated with the University of Sydney Road Traffic Injuries in Asia Professor Rebecca Ivers 2 Major causes of death 3 Million people 2 1.8
People killed and injured per million hours spent travelling, Motorcyclist Cyclist Driver Car / van passenger
 Cyclists CRASH FACTSHEET 27 CRASH STATISTICS FOR THE YEAR ENDED 31 DEC 26 Prepared by Strategy and Sustainability, Ministry of Transport Cyclists have a number of risk factors that do not affect car drivers.
A Study of Road Traffic Accident (RTA) Deaths in a Teaching Hospital in Ahmedabad from January 2014 to June 2014 classified according to ICD-10
 Deaths in a Teaching Hospital in Ahmedabad from January 2014 to June 2014 classified according to ICD-10") Original Article Healthline Journal Volume 6 Issue 2 (July - December 2015) A Study of Road Traffic Accident (RTA) Deaths in a Teaching Hospital in Ahmedabad from January 2014 to June 2014 classified according
Original Article Healthline Journal Volume 6 Issue 2 (July - December 2015) A Study of Road Traffic Accident (RTA) Deaths in a Teaching Hospital in Ahmedabad from January 2014 to June 2014 classified according
Regional Report on Status of Road Safety: the South-East Asia Region. A Call for Policy Direction
 Regional Report on Status of Road Safety: the South-East Asia Region A Call for Policy Direction WHO Library Cataloguing-in-Publication data World Health Organization, Regional Office for South-East Asia.
ROAD SAFETY IN INDIA: CHALLENGES AND OPPORTUNITIES
 UMTRI-2009-1 JANUARY 2009 ROAD SAFETY IN INDIA: CHALLENGES AND OPPORTUNITIES DINESH MOHAN OMER TSIMHONI MICHAEL SIVAK MICHAEL J. FLANNAGAN ROAD SAFETY IN INDIA: CHALLENGES AND OPPORTUNITIES Dinesh Mohan
Rajast. Earth System. Press Release. Subject: forecast. country as. Normal. Regions Rainfall (mm) LPA -29% -61% -34% -4% -9%
 LPA -29% -61% -34% -4% -9%") Government of India Earth System Science Organization Ministry of Earth Sciences India Meteorological Department Press Release Dated: 15 September, 2016 Subject: Current status of southwestt monsoonn 2016
Government of India Earth System Science Organization Ministry of Earth Sciences India Meteorological Department Press Release Dated: 15 September, 2016 Subject: Current status of southwestt monsoonn 2016
Working for a world free of road crash death and injury
 Working for a world free of road crash death and injury Presentation Outline What makes a road user vulnerable? Who is a Vulnerable Road User? What can be done to protect Vulnerable Road Users? Goal 3:
A Critical Review of International Road Safety Databases
 A Critical Review of International Road Safety Databases George Yannis, Eleonora Papadimitriou, Katerina Folla National Technical University of Athens, Greece, Department of Transportation Planning and
Road Safety Vademecum
 Road Safety Vademecum Road safety trends, statistics and challenges in the EU 2010-2013 March, 2014 European Commission DG for Mobility and Transport Unit C.4 Road Safety Contents Summary of findings...
Road Safety Data Availability in Asia
 Road Safety Data Availability in Asia Dongwoo Ha Chief, Transport Infrastructure Section Transport Division United Nations Economic and Social Commission for Asia and the Pacific (UNESCAP) hadw@un.org
Greenhouse gas emissions from transport have been rising and are expected to continue to rise both in higher & lower income countries.
 1 Greenhouse gas emissions from transport have been rising and are expected to continue to rise both in higher & lower income countries. Transport is seen as a hard area for mitigation 2 However, there
Crash Patterns in Western Australia. Kidd B., Main Roads Western Australia Willett P., Traffic Research Services
 Crash Patterns in Western Australia Kidd B., Main Roads Western Australia Willett P., Traffic Research Services Abstract Examination of crash patterns is one way of identifying key factors on which focus
CASUALTY REVIEW
 SOMERSET HEADINGROAD SAFETY PARTNERSHIP CASUALTY REVIEW 22-27 IMPROVING ROAD SAFETY WORKING TOGETHER TO REDUCE CASUALTIES HEADING HEADING CONTENTS 3 1. EXECUTIVE SUMMARY........................................
ROAD SAFETY AND POVERTY
 ROAD SAFETY AND POVERTY BY J. M Y. AMEGASHIE FCILT TECHNICAL DIRECTOR GRSP GHANA TABLE 1: ANNUAL DISTRIBUTION OF FATALITIES BY ROAD USER CLASS ROAD USER CLASS Year PED CAR HGV BUS/MI NI BUS M/CYCLE PICK-
Safety and Active Transport. Dr. Maureen Carew, Medical Officer of Health Renfrew County and District Health Unit May 30, 2014
 Safety and Active Transport Dr. Maureen Carew, Medical Officer of Health Renfrew County and District Health Unit May 30, 2014 Active Transport Vision Increase levels of walking and cycling Reduce vehicle
ANALYSIS OF THE TRENDS IN ACCIDENT RATES IN SRI LANKA
 ANALYSIS OF THE TRENDS IN ACCIDENT RATES IN SRI LANKA Amal S. Kumarage 1, Cammilus R. Abeygoonawardena 2 and Ravindra Wijesundera 3 ABSTRACT INTRODUCTION In Sri Lanka, both the vehicle population as well
MOBILITY CHALLENGES IN HILL CITIES
 MOBILITY CHALLENGES IN HILL CITIES Lalmuansanga Ralte, MCS Pvt Secretary to Minister & Under Secretary Urban Development & Poverty Alleviation Department Govt. of Mizoram DEMOGRAPHIC OVERVIEW INDIA MIZORAM
Research Offices in India. Delhi, Kolkata, Mumbai, Lucknow, Chennai, Bangalore, and. Hyderabad. TNS INDIA Pvt. Ltd
 Research Offices in India Delhi, Kolkata, Mumbai, Lucknow, Chennai, Bangalore, and Hyderabad TNS INDIA Pvt. Ltd 1 ROAD USER SATISFACTION SURVEY OUR EXPERIENCE TNS INDIA Social Research Division Assessment
Road Crash Analysis and Alleviation Measures
 Road Crash Analysis and Alleviation Measures R. Nirmala #1 1 Department of Civil Engineering, Sathyabama University, Chennai-119, India 1 nirmala.civil@sathyabamauniversity.ac.in Abstract Now-a days there
Road Accident Analysis and Identify the black spot location On State Highway-5 (Halol-Godhra Section)
") Road Accident Analysis and Identify the black spot location On State Highway-5 (Halol-Godhra Section) 1 Shah Dhruvit, 2 Shah Pranay M. 1 M.E civil(transportation), 2 M.E civil, P.h.d.(pursuing) 1 Tatva
Road Accident Analysis and Identify the black spot location On State Highway-5 (Halol-Godhra Section) 1 Shah Dhruvit, 2 Shah Pranay M. 1 M.E civil(transportation), 2 M.E civil, P.h.d.(pursuing) 1 Tatva
EGYPT: a national decade of action for road safety
 EGYPT: a national decade of action for road safety 2011 2020 Egypt EGYPT Population: 75 497 913 Income group: Middle Gross national income per capita: $1 580 INSTITUTIONAL FRAMEWORK Lead agency Funded
Study on fatal accidents in Toyota city aimed at zero traffic fatality
 Study on fatal accidents in Toyota city aimed at zero traffic fatality Toru Kiuchi, Yoshihisa Kanno, Makoto Shiota Toyota Motor Corporation, 1 Toyota-cho, Toyota-shi, Aichi 471-8571, Japan Abstract - Since
ROAD SAFETY DEMONSTRATION
 Shaanxi Mountain Road Safety Demonstration Project (RRP PRC 46042) ROAD SAFETY DEMONSTRATION A. Introduction 1. The Shaanxi Mountain Road Safety Demonstration Project (the project) is located in two prefecture-level
Highway Safety Safety Audit & Safety in Work Zones
 Highway Safety Safety Audit & Safety in Work Zones Geetam Tiwari Transportation Research and Injury Prevention Programme Indian Institute of Technology Road Safety Policy Models Intuitive model (penalties,
2014 QUICK FACTS ILLINOIS CRASH INFORMATION. Illinois Emergency Medical Services for Children February 2016 Edition
 2014 QUICK FACTS ILLINOIS CRASH INFORMATION February 2016 Edition Illinois Emergency Medical Services for Children www.luhs.org/emsc Illinois Emergency Medical Services for Children TABLE OF CONTENTS
2012 QUICK FACTS ILLINOIS CRASH INFORMATION. Illinois Emergency Medical Services for Children September 2014 Edition
 2012 QUICK FACTS ILLINOIS CRASH INFORMATION September 2014 Edition Illinois Emergency Medical Services for Children www.luhs.org/emsc Illinois Emergency Medical Services for Children TABLE OF CONTENTS
Road Accidental Analysis: A Case Study of Rajasthan State, India
 IOSR Journal Of Humanities And Social Science (IOSR-JHSS) Volume 19, Issue 5, Ver. V (May. 2014), PP 34-40 e-issn: 2279-0837, p-issn: 2279-0845. Road Accidental Analysis: A Case Study of Rajasthan State,
Economics of Road Safety What does it imply under the 2030 Agenda for Sustainable Development?
 Presentation issued without formal editing FOR PARTICIPANTS ONLY 14 March 2017 ENGLISH ONLY UNITED NATIONS CENTRE FOR REGIONAL DEVELOPMENT In collaboration with Ministry of Public Works and Transport,
MDB Road Safety Initiative: A Development Priority
 MDB Road Safety Initiative: A Development Priority Every six seconds, someone is killed or maimed on the world s roads. Over 90 percent of these injuries occur in low- and middle-income countries. The
4. WIDER SOCIAL DETERMINANTS OF HEALTH
 4. WIDER SOCIAL DETERMINANTS OF HEALTH 4.6 Road Safety Road safety affects all road users; pedestrians, cyclists and vehicle drivers and passengers. This section describes the impact of road safety and
Road Safety Strategy of Nepal for Resilient and Sustainable Development
 Road Safety Strategy of Nepal for Resilient and Sustainable Development Intergovernmental Ninth Regional Environmentally Sustainable Transport (EST) Forum in Asia 17-20 November 2015, Kathmandu Saroj Kumar
Analyses and statistics on the frequency and the incidence of traffic accidents within Dolj County
 UNIVERSITY OF PITESTI SCIENTIFIC BULLETIN Faculty of Mechanics and Technology AUTOMOTIVE series, year XXIV, no. 28 Analyses and statistics on the frequency and the incidence of traffic accidents within
Road Safety in Asia and the Pacific and The Updated Regional Road Safety Goals and Targets for Asia and the Pacific
 Regional EST Policy Dialogue and Training Workshop for South Asia and South-East Asia 10-12 October 2017, Pathumthani, Thailand Road Safety in Asia and the Pacific and The Updated Regional Road Safety
The burden of road crashes on the health system in Asia Pacific
 The burden of road crashes on the health system in Asia Pacific Professor Peter F.M. Choong Sir Hugh Devine Professor of Surgery, University of Melbourne Department of Surgery Director of Orthopaedics,
Lincolnshire JSNA: Road Traffic Accidents
 Road Traffic Accidents What do we know? Summary A higher proportion of road traffic collisions in Lincolnshire result in death compared to other areas. This may be due to the types of road in the County
SAFETY EVALUATION OF AN UNCONTROLLED
 SAFETY EVALUATION OF AN UNCONTROLLED INTERSECTION USING SURROGATE SAFETY MEASURES By S. Shekhar Babu Research scholar (Ext) IITB Asso Prof CME Pune Prof. P. Vedagiri Asst Prof Dept of civil Engg IIT Bombay
ROAD SAFETY ANNUAL REPORT 2018 ISRAEL
 ROAD SAFETY ANNUAL REPORT 2018 ISRAEL ISRAEL Israel recorded 321 road fatalities in 2017, representing a 3.9% decrease when compared to 2016. The mortality rate is 3.6 deaths per 100 000 population. Since
ROAD SAFETY IN THE SOUTH-EAST ASIA REGION 2015
 ROAD SAFETY IN THE SOUTH-EAST ASIA REGION 2015 World Health Organization 2016 All rights reserved. Requests for publications, or for permission to reproduce or translate WHO publications whether for sale
Cambridge International Examinations Cambridge International General Certificate of Secondary Education
 Cambridge International Examinations Cambridge International General Certificate of Secondary Education *4574868004* GEOGRAPHY 0460/43 Paper 4 Alternative to Coursework October/November 2017 Candidates
Delivering Accident Prevention at local level in the new public health system
 1 Safety issue accidents don t have to happen Delivering Accident Prevention at local level in the new public health system Part 2: Accident prevention in practice Raise awareness Fact Sheet Road casualties
RECENT PROGRESS IN ROAD SAFETY IN THE ESCAP REGION
 RECENT PROGRESS IN ROAD SAFETY IN THE ESCAP REGION A.S.M. Abdul Quium and Thanattaporn Rasamit 1 ABSTRACT Road safety in developing countries of the ESCAP region is a development issue of serious concern,
the Ministry of Transport is attributed as the source of the material
 Pedestrians 216 Disclaimer All reasonable endeavours are made to ensure the accuracy of the information in this report. However, the information is provided without warranties of any kind including accuracy,
the Ministry of Transport is attributed as the source of the material
 Cyclists 2015 Disclaimer All reasonable endeavours are made to ensure the accuracy of the information in this report. However, the information is provided without warranties of any kind including accuracy,
ZERO DRAFT OF THE BRASILIA DECLARATION ON ROAD SAFETY (VERSION PROPOSED BY BRAZIL DATED 26 MARCH 2015)
") ZERO DRAFT OF THE BRASILIA DECLARATION ON ROAD SAFETY (VERSION PROPOSED BY BRAZIL DATED 26 MARCH 2015) Second Global High-Level Conference on Road Safety: Time for Results Brasilia, 18-19 November 2015
ZERO DRAFT OF THE BRASILIA DECLARATION ON ROAD SAFETY (VERSION PROPOSED BY BRAZIL DATED 26 MARCH 2015) Second Global High-Level Conference on Road Safety: Time for Results Brasilia, 18-19 November 2015
DEPARTMENT OF TRANSPORT AND PUBLIC WORKS SAFELY HOME: ROAD SAFETY OVERVIEW
 DEPARTMENT OF TRANSPORT AND PUBLIC WORKS SAFELY HOME: ROAD SAFETY OVERVIEW Fifth Monthly Road Safety Workshop Childsafe-Woolworths Building, Hector Eliott Red Cross Children's Hospital 26 February 2015
Enhancing the Success of Road Safety Initiatives
 Enhancing the Success of Road Safety Initiatives Cessie Petchi Working for a world free of road crash death and injury About GRSP Founded in 1999 in response to recognition of the road safety issue as
Projections of road casualties in Great Britain to 2030
 5 Projections of road casualties in Great Britain to 2030 C G B (Kit) Mitchell and R E Allsop Published March 2014 Contents Section 1 Introduction 4 Section 2 Trends in road casualty rates 6 Section 3
CONSUMER PRICE INDEX NUMBERS FOR ALL INDIA & VARIOUS CENTRES FOR INDUSTR
 CONSUMER PRICE INDEX NUMBERS FOR ALL INDIA & VARIOUS CENTRES FOR INDUSTR BASE 1982 = 100 JANUARY FEBRUARY MARCH APRIL MAY JUNE JULY 2004 2004 2004 2004 2004 2004 2004 ***************************** ****************
Pedestrian Safety in Cities
 Pedestrian Safety in Cities Priorities for India Geetam Tiwari MoUD Chair Professor, Coordinator, TRIPP Indian Institute of Technology Delhi, India URBAN MOBILITY INDIA 2013 IIT Delhi 2013 RTI in Urban
the Ministry of Transport is attributed as the source of the material
 Disclaimer All reasonable endeavours are made to ensure the accuracy of the information in this report. However, the information is provided without warranties of any kind including accuracy, completeness,
SITUATIONS AND CHALLENGES OF ROAD SAFETY IN CHINA
 SITUATIONS AND CHALLENGES OF ROAD SAFETY IN CHINA Li Yaning Road Administration of Beijing Municipal Commission of Transport No.317, Guangnei Street, Xicheng District, Beijing, P.R. China E-mail: liyaning@bjlzj.gov.cn
Active and Passive Safety Passenger Car Technologies: Potentials to Save Lives in India. Pradeep Puthan, Prateek Thalya, Nils Lubbe
 Active and Passive Safety Passenger Car Technologies: Potentials to Save Lives in India Pradeep Puthan, Prateek Thalya, Nils Lubbe I. INTRODUCTION Mobility plays an important role in socio economic growth
Analysis and Countermeasure Research on the Death Rate of the Vulnerable Road Users in Traffic Accidents. Ying MEI
 2nd Annual International Conference on Social Science and Contemporary Humanity Development (SSCHD 2016) Analysis and Countermeasure Research on the Death Rate of the Vulnerable Road Users in Traffic Accidents
CONCLUSIONS AND RECOMMENDATIONS
 CHAPTER 5: CONCLUSIONS AND RECOMMENDATIONS 5.1 General This chapter presents the conclusions and main recommendations flowing from the analysis of level crossing systems and safety performance in several
Road Safety Status of Nepal Arjun Jung Thapa DDG, Department of Roads Planning and Design Branch
 Road Safety Status of Nepal 2013 Arjun Jung Thapa DDG, Department of Roads Planning and Design Branch Introduction of the Country Introduction of the Country NEPAL in brief Situated between China and India
Health and Transportation: Integrated Transport and Health Impact Model in the Nashville Region. Leslie Meehan, AICP June 2015
 THE HONORABLE Mayor KEN WILBER, Karl Dean, CHAIRMAN Chairman Health and Transportation: Integrated Transport and Health Impact Model in the Nashville Region Leslie Meehan, AICP June 2015 Metropolitan Planning
Background. The scale of the problem. The scale of the problem. Road Safety in London, the statistics. 280 Fatalities from road crashes in 2002
 Impacts: 8th Intercontinental Conference - Geneva Thursday, 13 November 23 European Road Safety Programme Implementation by Cities AN OVERVIEW OF THE LONDON PICTURE Lukman Agboola Senior Road Safety Engineer
The experience of Spain in reducing road deaths in urban areas
 The experience of Spain in reducing road deaths in urban areas PIN Talk in Cyprus How to improve urban road safety Cyprus, 19 March 2015 Álvaro Gómez Méndez Deputy Directorate General for Statistics Analysis
Merseyside Road Safety Partnership s Annual Road Traffic Casualties Report 2015
 Merseyside Road Safety Partnership s Annual Road Traffic Casualties Report 2015 Contents 1. Overview of KSI s 2 2. Cyclists 4 3. Motorcyclists 8 4. Senior Road Users 10 5. Pedestrians 14 6. Car Drivers
APPENDIX C. Systems Performance Report C-1
 APPENDIX C Systems Performance Report C-1 System Performance Report & Requirements According to the FAST Act, a long range transportation plan needs to include a system performance report and subsequent
Low Carbon Mobility Plan For Indian Cities
 Low Carbon Mobility Plan For Indian Cities Data Requirement and BAU Scenario Workshop on Developing Policies and Strategies for Low Carbon Transport in India, 24-25 August, 2012 In Indian context NMT and
Pedestrians safety. ROAD SAFETY SEMINAR PIARC/AGEPAR/GRSP Lome, Togo October 2006 Lise Fournier, Canada-Qu
 Pedestrians safety ROAD SAFETY SEMINAR Lome, Togo October 2006 Lise Fournier, Canada-Qu Québec Contents WHO s data Risk factors Pedestrian needs Pedestrian facilities Conclusion Source: WHO WHO reports