Archival copy: for current recommendations see or your local extension office.
|
|
|
- Lorin O’Brien’
- 6 years ago
- Views:
Transcription


1


2 This is a publication of the Florida Sea Grant College Program, supported by the National Sea Grant College Program of the United States Department of Commerce, National Oceanic and Atmospheric Administration under NOAA Grant #NA16RG Additional support was provided by the West Coast Inland Navigation District and Sarasota County, Florida. The views expressed herein are those of the authors and do not necessarily reflect the views of these agencies. Online copies are available without charge at the Florida Sea Grant website, seagrant.org. Additional print copies can be obtained by contacting Florida Sea Grant, University of Florida, PO Box , Gainesville, FL, , (352) Revised January 2007 TP 152 January 2006
3 A Recreational Boating Characterization of Sarasota County by Charles Sidman Coastal Planning Specialist Florida Sea Grant University of Florida Robert Swett Assistant Professor Fisheries and Aquatic Sciences University of Florida Timothy Fik Associate Professor Department of Geography University of Florida Susan Fann Editorial and GIS Specialist Florida Sea Grant University of Florida Bill Sargent Research Scientist Florida Wildlife Conservation Commission Fish and Wildlife Research Institute St. Petersburg, Florida
4 Table of Contents LIST OF FIGURES... iii LIST OF TABLES... iii ACKNOWLEDGMENTS... vi ABSTRACT... vii CHAPTERS 1. INTRODUCTION... 1 Background... 1 Study Goal and Objectives... 2 Study Region MAIL SURVEY... 6 Survey Instrument... 6 Sample Design... 7 Sample Selection... 8 Survey Return Breakdown GIS DATABASE DEVELOPMENT Spatial Database Design MAPPING BOATING PATTERNS General Clustering Patterns Large Scale Mapping of Selected Locales BOATER-GROUP CHARACTERISTICS Overview Vessel and Boater Profile Trip and Seasonal Use Profile Rationale for Selecting Departure Sites and Travel Routes Boater Activity Profile Perceived Congestion PERCEIVED DETRACTORS AND NEEDS Overview Detractors Needs CONCLUSIONS AND RECOMMENDATIONS Study Findings ii
5 Sampling Results Survey Non-Response Boat Ramp Service Area Analysis Analysis of Seasonal Boating Trends LITERATURE CITED APPENDICES FIGURES Figure 1. The Sarasota County Study Area... 4 Figure 2. Popular Sarasota County Boating Locales... 5 Figure 3. Sarasota County Public Ramps Surveyed Figure 4. Sarasota County Marinas Surveyed Figure 5. Spatial Distribution of Sarasota County Private Dock Sample Figure 6. Example of GIS Attribute Query and Display: Nature Viewing Spots Figure 7. Example of GIS Attribute Query and Display: Reported Travel Routes Figure 8. Travel Corridors as Summarized with the GIS Figure 9. Favorite Destinations as Summarized with the GIS Figure 10. Congested Areas as Summarized with the GIS Figure 11. South Sarasota Bay: Congestion Hot Spots Figure 12. South Sarasota Bay: Travel Corridors and Destination Hot Spots Figure 13. Little Sarasota Bay and Blackburn Bay: Congestion Hot Spots Figure 14. Little Sarasota Bay and Blackburn Bay: Travel Corridors and Destination Hot Spots Figure 15. Venice Inlet: Congestion Hot Spots Figure 16. Venice Inlet: Travel Corridors and Destination Hot Spots Figure 17. Lemon Bay: Congestion Hot Spots Figure 18. Lemon Bay: Travel Corridors and Destination Hot Spots TABLES Table 1. Estimated Survey Requirements... 7 Table 2. Unique Tag Numbers Collected and VTRS Matches by Ramp iii
6 Table 3. Vessel Bow Numbers Collected from Marinas... 9 Table 4. Survey Return Breakdown Table 5. Breakdown of Sarasota County Boaters Trip Features Associated with Inlets and Bays Table 6. Vessel Type Table 7. Boater Waterway Access Categories Table 8. Average Monthly Residence per year in the State of Florida Table 9. Boating Experience (in years) Table 10. Years of Boating Experience in Florida by Waterway Access Category Table 11. Boaters Having Completed a Boat Safety/Seamanship Course by Waterway Access Category Table 12. Age of Boaters by Waterway Access Category Table 13a. Boater Willingness to Participate in a Future Internet Survey Table 13b. Boater Willingness to Participate in a Future Mail Survey Table 14. Drive Time from Home to Marina Table 15. Number of Times Per Year that Ramp/Shoreline is Used to Launch a Boat Table 16. Drive Time to Boat Ramp or Shoreline / Causeway (in minutes) Table 17. Departure Time Averages by Waterway Access Category Table 18a. Trip Duration by Waterway Access Category for Day Trips Table 18b. Trip Duration by Waterway Access Category for Overnight Trips Table 19a. Boat Trips: Monthly Averages and Trip Count Statistics Table 19b. Boat Trips During Peak Season by Waterway Access Category Table 19c. Yearly Boat Trip Statistics by Waterway Access Category Table 19d. Boat Trip Days: Weekday versus Weekend Trips Table 20. Reasons for Selecting a Favorite Departure/Launch Site Table 21. Reasons for Selecting a Favorite Travel Route Table 22. Boaters Activity Statistics (entire sample) Table 23a. Boaters Activity Statistics: Boat Ramp Group Table 23b. Boaters Activity Statistics: Marina Wet Slip Group Table 23c. Boaters Activity Statistics: Marina Dry Storage Group iv
7 Table23d. Boaters Activity Statistics: Home Dock Group Table 23e. Boater s Activity Statistics: Condo Dock Group Table 24. Analysis of Congestion: Proportion of Survey Respondents that Indicated They Had Avoided or Left Their Favorite Spots/Destinations Due to Congestion Table 25. Boating Detractors by Primary Category Table 26. Lack of Courtesy and/or Seamanship Detractors by Sub-Category Table 27. Congestion Detractors by Sub-Category Table 28. Infrastructure Deficiency Detractors by Sub-Category Table 29. Altered Environment Detractors by Sub-Category Table 30. Excessive Regulation Detractors by Sub-Category Table 31. Lack of Water Access Detractors by Sub-Category Table 32. Lack of Regulation/Enforcement Detractors by Sub-Category Table 33. Top-10 Detractors by Sub-Category Table 34. Boating Needs by Primary Category Table 35. Infrastructure Improvement Needs by Sub-Category Table 36. Increased Access Needs by Sub-Category Table 37. More Regulation/Enforcement Needs by Sub-Category Table 38. Boater Education Needs by Sub-Category Table 39. Environmental Protection Needs by Sub-Category Table 40. Less Regulation Needs by Sub-Category Table 41. Top-10 Needs by Sub-Category v
8 Acknowledgments This project was funded by the West Coast Inland Navigation District and its success relied upon the individual contributions of various team members. Principal Investigators Charles Sidman and Robert Swett (Florida Sea Grant) were responsible for project administration, overall design of the questionnaire and correspondence, sample selection, the GIS database design, and reporting. Amy Meese (Sarasota County), Chuck Listowski (West Coast Inland Navigation District), and Bill Sargent (Florida Fish and Wildlife Conservation Commission) provided valuable input into the design and content of the survey instrument. Timothy Fik (Department of Geography, University of Florida) performed the statistical analyses. Susan Fann and Charles Sidman (Florida Sea Grant) conducted the content analysis. David Fann and Charles Sidman were responsible for the questionnaire map layout and design, and cartography. Dorothy Zimmerman (Florida Sea Grant Communications) provided valuable editorial comments and suggestions. Larry Bearse (Manatee County IFAS Extension) conducted the marina and ramp surveys. Dick Tudor and James Harrison of Smart Mail Inc. (Alachua, Florida) implemented the mailing. Susan Fann, Gabriel Bolden, and Corina Guevara managed and processed attribute and spatial data from the returned questionnaires. We especially thank the many boaters who donated their time to complete and return the questionnaire. It is our intention that this effort will be translated into planning strategies and informational products of benefit to the Sarasota County boating community. vi
9 Abstract This report documents the methods and procedures implemented, during February through December 2005, to survey and characterize boaters who recreate on waterways within and around Sarasota County, on the basis of trip departure category (marina wet slip, marina dry storage, public ramp, and private dock). Vessel and boat trailer registration numbers collected at marinas and boat ramps within Sarasota County were used to obtain names and mailing addresses from the State s Vessel Title Registration System (VTRS) for marina and ramp samples. Names and mailing addresses for waterfront parcel owners obtained from Sarasota County tax records were compared to the VTRS to identify the dock sample (waterfront parcel owners that also own a boat). A map-based questionnaire was mailed to a sample of 4,650 area boaters. Questionnaire recipients marked the start and end point of their last two recreational boating trips, traced their travel routes, identified their favorite boating destinations, and the primary activities that they engaged in while at a particular destination. In addition, much descriptive data about boaters trips including preferences for selecting trip departure sites and travel routes, activities conducted, vessel types, and the timing, duration, and frequency of use was collected and can be linked to the mapped data. Lastly, a content analysis identified important issues and needs from the perspective of the Sarasota County boating community. This information is intended to assist Sarasota County with prioritizing and improving waterway access and maintenance, optimizing boat facility siting, and targeting available resources to those issues of greatest concern to the boating community. vii
10 Chapter 1. Introduction Background Boating is a key element in Florida s coastal lifestyle and growth phenomena. According to the National Marine Manufacturers Association (2005), Florida ranks first in the nation in recreational boat registrations with more than 946,072 registered or titled pleasure boats. This represents approximately one boat for every 17 residents. Of equal note, Florida is the number one U.S. destination for marine recreation including saltwater boating with an estimated 4.3 million participants (Leeworthy and Wiley, 2001). Coastal development, the ever-increasing number of boaters, and the diversity of recreational boating activities that now take place within Florida s coastal bays, estuaries, and waterways have had positive economic impacts, but also have profoundly altered the coastal estuarine environment (Letson, 2002; Antonini, Fann and Roat, 1999). Sarasota County faces a dilemma that is common to Southwest Florida s coastal communities: how to balance growth in recreational boating and associated coastal development with conservation and management of natural resources. As the number of boats that ply coastal waterways increases, so does the need for enhanced public access, maintenance of waterway infrastructure, boater safety and education, and environmental protection. To help meet these needs, Sarasota County requires spatial information that describes the activities, use-patterns, and inclinations of the boating community. To date, however, such information has not been readily available to resource managers and planners. To overcome data limitations Sarasota County requested this study to provide baseline boating information that delineates spatial trends of waterway use (e.g., departure origins, boating destinations, and intervening travel routes) mapped within a geographic information system (GIS). Collection of demographic (e.g., seamanship skills, local knowledge, motivations, and perceptions) and trip information (e.g., starting time, duration, activities, and frequency of trips) to characterize the spatial data was of equal importance to the County s waterway planning and management efforts. The information provided by this study also satisfies a principal element of the Sarasota County Manatee Protection Plan; namely, a profile of recreational waterway use. The information generated by the study can serve to advance objectives pertaining to a variety of County programs, above and beyond those of the Manatee Protection Plan. Examples of ways that boating pattern information can be used to improve public waterway access and aquatic resource management and to address boater s concerns include: Categorization and spatial representation of boater departure sites, routes, and destinations to address community concerns regarding waterway access, maintenance, signage, and facility siting. Comparison of boating information with other spatial (GIS) data layers (e.g., environmental, development patterns) to help guide resource and public safety management. 1
11 Temporal and activity-derived spatial profiles to identify and map boating pressure hotspots on county waterways. Identification of boating-related problems and their solutions as input to management strategies and communications products that target available resources to issues of greatest concern. This study, while focusing on Sarasota County waterways, also contributes to a regional picture of recreational boating patterns within the four counties of the West Coast Inland Navigation District (WCIND): Manatee, Sarasota, Charlotte, and Lee counties. Sarasota County s commitment to a recreational boating study prompted the Florida Fish and Wildlife Conservation Commission s Fish and Wildlife Research Institute to initiate a concurrent study for the greater Charlotte Harbor boating region that consists of Charlotte and Lee counties (Sidman, Swett, Fik, S. Fann, D. Fann and Sargent, 2005). The boating information collected also overlaps with similar data obtained during a previous recreational boating characterization for the Tampa and Sarasota Bay region (Sidman, Fik and Sargent, 2004) and earlier projects in Charlotte Harbor (Gorzelany, 1998; Gorzelany, 1999; Gorzelany, 2000; Sidman and Flamm, 2001). These complementary efforts will serve to complete a baseline recreational boating profile for the WCIND and mesh with a statewide project that aims to evaluate waterway access throughout Florida. During the first phase of the statewide access project, boating facilities will be inventoried, characterized, and mapped. The second phase of the statewide project will consist of an analysis to determine the economic impact of recreational boating. Lastly, information collected as part of this recreational boating characterization complements aerial surveys to determine boat traffic and volume within Sarasota County s coastal areas, to be conducted in a related and concurrent project sponsored by Sarasota County. This report documents the data collection, compilation, and descriptive analysis components of a mail survey to characterize recreational boating within Sarasota County s coastal waterways. 1 The report presents (1) the questionnaire and related correspondence; (2) the sample design and results of the mailing; (3) a GIS density analysis that depicts the spatial distribution and clustering of trip information reported by survey respondents; and (4) a set of descriptive statistics that characterize boating groups, activities, perceived problems, and solutions to problems. Study Goal and Objectives This project s goal was to obtain baseline information that can be used to describe and map the preferences, activities, and water-use patterns of boaters who use Sarasota County waterways, on the basis of waterway access facility type, (i.e., marina wet-slips, dry storage facility, public ramp, or private dock). Specific objectives included (1) implementation of a mail 1 A survey of boaters who use the Myakka River and Upper Charlotte Harbor boating regions was conducted as part of a concurrent recreational boating characterization of the Greater Charlotte Harbor (Sidman, Swett, Fik, S. Fann, D. Fann, and Sargent, 2005). 2
12 survey to acquire spatial and behavioral information from boaters that use marinas, dry storage facilities, public ramps, and docks (2) construction of GIS spatial databases that map trip departure sites, destinations, travel routes, and congested areas; and (3) completion of descriptive analyses of boating patterns and activities consistent with that performed for the Tampa and Sarasota Bay recreational boating characterization (Sidman et al., 2004). Study Region Sarasota County s system of waterways has been described as the most precious jewel of the southwest Florida coast (Antonini et al., 1999). Recreational boaters are attracted to this region by its many barrier islands, beaches, exposed sand spits, and protected waters that provide excellent opportunities for small-craft fishing, cruising, nature viewing, and picnicking/socializing. The Sarasota County boating region identified for this study comprises roughly 700 square miles and includes portions of the Gulf of Mexico, and interior bay waters that include portions of Big Sarasota Bay, Little Sarasota Bay, Roberts Bay, Blackburn Bay, the Gulf Intracoastal Waterway, Venice inlet, and portions of Lemon Bay (Figures 1 and 2). An estimated 22,569 pleasure boats are registered in Sarasota County according to the Florida Department of Highway Safety and Motor Vehicles (DHSMV), Vessel Title Registration System (VTRS) 2005 data sales database. This represents a 71% increase in the number of registered vessels in the County since 1980 (Bureau of Economic and Business Research, 1981). 3


13 Figure 1. The Sarasota County Study Area. 4


14 Figure 2. Popular Sarasota County Boating Locales. 5
15 Chapter 2. Mail Survey Survey Instrument A mail survey is an established method for acquiring spatial and behavioral information from boating communities (West 1982; Falk, Graefe, Drogin, Confer, and Chandler 1992; Antonini, Zobler, Sheftall, Stevely and Sidman, 1994; Antonini, West, Sidman and Swett, 2000). The survey instrument developed for this study was patterned after similar studies (West, 1982; Falk et al., 1992; Sidman and Flamm, 2001; Sidman, et al., 2004) and consisted of a two-sided 22 X 34 inch questionnaire that folded in quarters to 8.5 X 11 inches (see Appendix A for the survey instrument and associated correspondence). The questionnaire contained a 1:79,200 scale map (1 inch equals 1.25 miles) of the Sarasota County coastal boating region on one side; the reverse side consisted of 27 questions divided into the following topical areas: 1. Description of primary vessels owned and operated 2. Description of last two pleasure boating trips 3. Description of favorite boating destinations and activities 4. Description of survey respondent 5. Open questions to identify perceived problems and needs The following items accompanied each mailed questionnaire; 1. A cover letter that explained the study 2. A Sarasota County Boater s Guide developed by the FWRI 3. A postage paid return envelope with postal permit indicium In addition, a 4 X 6 inch card was mailed approximately two weeks after the initial mailing as a reminder to survey recipients to complete and return the questionnaire. The questionnaire asked survey recipients to mark, on the map, the location of the trip departure sites, travel routes, favorite destinations, and congested areas associated with their last two pleasure boating trips. Complementary questions allowed recipients to characterize their last two trips according to vessel types used, the departure date and time, and time spent on the water. In addition, recipients were asked the number of days per month that they take trips and the primary activities that they engaged in while at a favorite destination. They were also asked to identify and rank reasons for selecting departure sites and travel routes. Finally, a series of openended questions addressed problems and needed improvements. 6
16 Sample Design The sample design was developed to acquire information to profile four discrete boater populations that use the Sarasota County coastal boating region: boaters that access waterways via (1) marina wet slips, (2) dry storage facilities, (3) public ramps, and (4) private docks. The sample size required for each of the four boater groups that access Sarasota County waterways is a function of the desired confidence interval and confidence level. Given a total population of finite size, N, a tolerable error amount, e, and a desired confidence level as specified by the normal random variate, z, the required sample size, n, for estimating a population proportion, p, is determined by: n = N z 2 p(1-p) (N-1)e 2 + z 2 p(1-p) Population estimates for marina wet slip, marina dry storage, and dock origin-type categories (Table 1) were determined by reviewing Sarasota County Regional Waterway Management System (RWMS) data, collected by Antonini and Box (1996) and Antonini, Swett, Shulte and Fann (2000) and by visiting Sarasota County marinas and dry storage facilities. The ramp user population (Table 1) was estimated by analyzing information contained in the VTRS according to the following criteria: 1. Sarasota County registration Vessel type equal to open motorboat or cabin motorboat. 3. Vessel length greater than 8 feet and less than 26 feet. Table 1. Estimated Survey Requirements. Data Water Access Boater Population Sample 2003 Existing Needed Estimated Questionnaires Source Type Estimate Required Sample Sample Required RWMS* Marina Wet Slip RWMS Dry Storage 1, ,275 VTRS** Public Ramp 10, ,530 RWMS Private Dock 4, TOTALS 17,250 1, ,650 *Regional Waterway Management System **Vessel Title Registration System 2 The population of boaters that were sampled at ramps extends beyond the population of "boaters registered in Sarasota County; (i.e., it includes boaters from other counties). Unfortunately, the market area for Sarasota County ramps is not known. The true population of Sarasota County ramp users is likely larger than the estimate which was based on the best available information. 7
17 The estimated sample required (Table 1) for each water-access type was determined based on a tolerable error of ± 0.05 and a confidence level of 95 percent (z = 1.96). The estimated questionnaires required (Table 1) is a function of (1) the existing sample obtained from the 2003 survey of Sarasota County boaters, as part of the Tampa and Sarasota Bay recreational boating characterization, (2) the needed sample the difference between the sample required and the existing sample, and (3) a return rate multiplier that assumed a 20 percent return rate based on return rates from previous surveys of southwest Florida boaters (Antonini et al., 1994; Antonini et al., 2000; Sidman and Flamm, 2001; Sidman, et al., 2004). In contrast to the randomly sampled ramp and dock populations all boaters that were associated with vessels identified in marina wet and dry storage facilities and for whom names and addresses could be obtained received a questionnaire. Ownership information was obtained for approximately 92% of vessels observed in marina wet slips and dry storage facilities (937 of 1,021 vessels inventoried). The objective was to survey as many users as possible associated with marina wet slip and dry storage facility types given the relatively small numbers of boaters associated with these waterway access categories. Additional surveys (above and beyond estimated needs) were mailed to ramp and dock populations to better ensure that adequate samples were obtained for these groups. Sample Selection Automobile and boat trailer registration numbers collected at Sarasota County boat ramps (Table 2) and vessel bow numbers collected at marinas (Table 3) were used to obtain names and mailing addresses from the state s Automobile, Trailer and Vessel Title Registration databases. In this way, registration information was used to identify the names and mailing addresses of patrons of public boat ramps, marina wet slips, and marina dry storage facilities. In addition, the name and mailing address of owners of observed documented vessels were obtained from the United States Coast Guard (USCG) documented vessel database. During March through May 2005, Florida Sea Grant personnel visited nine public ramps in Sarasota County (Figure 3) and recorded 3,258 unique license plate numbers of both the boat trailer and the towing vehicle. This information was compared to DHSMV vehicle and trailer registration information to provide 2,273 VTRS matches for names and mailing addresses (Table 2) from which 2000 ramp patrons were randomly selected to receive a questionnaire. During February through March 2005, Florida Sea Grant personnel visited all known marinas and dry storage facilities located in Sarasota County to record bow numbers from vessels stored in wet slips and in dry storage (Table 3; Figure 4) 3. Florida Sea Grant personnel logged bow numbers from 401 vessels moored in wet slips and 620 vessels kept in dry storage facilities. Wet slip and dry storage capacity was also obtained from interviews with facility managers (Table 3). The name and hailing port of documented vessels were also obtained and used to acquire additional names and mailing addresses from the USCG documented vessel database. Due to the comparatively small number of vessels kept in marinas and dry storage facilities, a questionnaire was mailed to all patrons for whom names and addresses could be acquired from the DHSMV or USCG databases. 3 Access was denied at three of the 15 marinas visited. 8
18 Names and mailing addresses for waterfront parcel owners obtained from county tax records were compared to the VTRS to identify the private dock sample. The owner s name, street number, street name, and ZIP code obtained from county tax records were combined and compressed into one concatenated field. A similar compression procedure was undertaken for VTRS owner name, address, and zip code fields. Compressed name and address information for all waterfront parcels was then linked to the corresponding compressed VTRS information to identify matches. Matches ensured that only those waterfront parcel owners who also own boats were included in the sample. An ArcGIS program downloaded from the ESRI website was used to select a random spatial sample of 1,663 dock owners from the 1,942 VTRS/parcel matches (Figure 5). Table 2. Unique Tag Numbers Collected and VTRS Matches by Public Ramp. Sarasota County Ramp Name Number of Unique Tags VTRS Matches Blackburn Point Ridge Park 1 1 Centennial Park 1, Higel Marine Park Indian Mound Park Ken Thompson Manasota Beach Nokomis Beach Turtle Beach Venice Marina Park TOTAL 3,258 2,273 Table 3. Vessel Bow Numbers Collected from Marinas. Sarasota County Marina Name Wet Capacity Dry Capacity Wet Slips Inventoried Dry Storage Inventoried Bahia Mar Apartments Marina Bird Key Yacht Club ** 0 Dock On the Bay Dockside Marine Gulf Harbor Marina Access Denied Access Denied Holiday Inn Airport Marina Longboat Key Moorings Marina At the Landings Marina Jack Marine Max Phillippi Shores Marina Sara Bay Marina Access Denied Access Denied Sarasota Yacht Club Access Denied Access Denied Spindrift Turtle Beach Marina TOTALS 818 1, (379)* 620 (558)* *VTRS name and address matches are shown in parentheses. **An additional 58 members of the Bird Key Yacht Club received a survey. 9


19 Figure 3. Sarasota County Public Ramps Surveyed. 10


20 Figure 4. Sarasota County Marinas Surveyed. 11


21 Figure 5. Spatial Distribution of the Sarasota County Private Dock Sample. 12
22 Survey Return Breakdown Questionnaires were mailed between May 27 and June 6, The quantity of surveys that were ultimately mailed to each user-group, identified in Table 4, was determined by the number of names and mailing addresses identified from the VTRS, USCG, or county tax roles. For example, a total of questionnaires were mailed to marina wet slip users although 985 surveys were estimated as being necessary to meet minimum sample sizes given a return rate of 20 percent. The shortfall is due to the comparatively small number vessels associated with Sarasota County marinas. A similar shortfall occurred for the dry storage facility category. Many of those vessels likely had expired registrations and were, therefore, not included in the active registration VTRS database that was obtained from the DHSMV. Conversely, mailings for the larger public ramp and private dock user categories exceeded the estimated minimum mailings required. A reminder card was sent to individuals who had not yet returned the questionnaire two weeks after a wave of surveys had been mailed. A total of 973 useable surveys were returned (15 returned surveys could not be used) resulting in an overall return rate of 21 percent. When combined with information from the earlier Tampa Bay and Sarasota Bay survey the sample size benchmark (tolerable error of ± 0.05 and a confidence level of 95 percent) was exceeded for public ramps and private docks, but not for marina wet and dry storage facilities. The relatively small number of returns from users of marina wet slips (73) and dry storage facilities (102) was due to (1) the small number of marina facilities in Sarasota County, (2) the comparatively small number of vessels observed at marina facilities, and (3) the response rate. When combined (i.e., 2005 Sarasota survey returns with 2003 Sarasota survey returns), the sample of n=138 marina wet slip and n = 149 dry storage users meet a maximum tolerable error of ± at a confidence level of 95 percent. Summary statistics are presented in Table 4 for survey mailings and returns from the 2003 Tampa Bay and Sarasota Bay survey and the total combined samples by boater group. Return rates for the four boating categories are considered to be appropriately large and are consistent with the results of a random statewide survey of boaters (Swett, Fann, & DeLaney, 2005) which suggests that proportionate samples were obtained for statistical inferences to be made among the surveyed boater groups. Table 4. Survey Return Breakdown. Boater Group Mailed (in 2005) Returned Useable % Return 2003 Sample Total Sample Marina Wet Slip Dry Storage Public Ramp 2, Private Dock 1, Other* TOTALS 4, Average 358 1,321 *Ten respondents listed other for boater group type. 4 The 459 surveys mailed to marina wet slip users included 58 additional surveys that were mailed to members of the Bird Key Yacht Club. 13
23 Chapter 3. GIS Database Development Spatial Database Design Questionnaire recipients were asked to (1) mark the start and end point of their last two pleasure boating excursions on a map (2) draw their entire travel routes, (3) identify their favorite boating destinations along those routes, and (4) annotate the map with abbreviations for the primary activities that they engaged in while at each destination. They were also asked to indicate by the letter C any places on the map they considered to be congested. Spatial data collected from the 973 returned surveys were digitized into the ESRI ArcGIS geographic information system (GIS) 5. This resulted in a sample of 1,832 trip origins, 1,832 travel routes, 2,291favorite boating destinations, and 1,195 locations of perceived congestion. Spatial information was digitized on-screen over United States Geological Survey normal color Digital Orthophoto Quarter Quadrangles (DOQQ) flown in GIS layers depicting the positions of marinas, ramps, navigation aids, and artificial reefs were used as background themes to enhance the accuracy of digitized data. Trip departure sites and congested spots were digitized as point features and each record was coded with the survey control number and trip number (i.e., first or second trip). Favorite destinations were digitized as point features and were coded with the survey control number, trip number, and the activities that a respondent engaged in at each favorite destination. Travel routes were digitized as line features and coded with the following attribute information: Survey control number, trip number, round trip or one way (if round trip, the same route often was depicted for both legs of the trip), and whether or not the trip extended beyond the study area. The database structure allows information from survey questions to be linked to digitized spatial information via the survey control number (ID), which uniquely identified spatial and attribute information provided by each survey respondent. The selection and display of favorite destination point data within the GIS is illustrated in Figure 6 for a portion of the southern Sarasota Bay boating area. Red dots represent departure sites identified by survey respondents; green dots represent favorite destinations; yellow dots represent a sub-set of favorite destinations where survey respondents reported that they like to nature view. The Select by Attributes window - upper left corner of Figure 6 - illustrates a GIS database query that selects and displays favorite destination points that are associated with nature viewing (e.g., NV = Y ). The Selected Attributes of Destinations window - lower left corner of Figure 6 - displays all linked database records in yellow. These records share the same survey control number (ID) that meet the query criterion of nature viewing (NV). Responses by survey respondents indicate that the Bird Keys area in Little Sarasota Bay, the spoil islands in Roberts Bay, and the southern tip of Lido Key near Big Sarasota Pass are popular destinations for nature viewing. Reported travel routes within the southern Sarasota Bay boating region are displayed in Figure 7. Pink lines represent travel routes digitized from returned surveys; red and green dots illustrate departure sites and favorite destinations, respectively. The blue line depicted in the GIS 5 Fifteen survey respondents either did not report any spatial information or the information that they provided could not be interpreted. 14

24 view represents one travel route that has been selected for display. The corresponding database record that is linked to the travel route via the survey control number ID is also highlighted blue in the Attributes of Routes database window at the lower left of Figure 7. Figure 6. Example of GIS Attribute Query and Display: Nature Viewing Spots. 15

25 Figure 7. Example of GIS Attribute Query and Display: Reported Travel Routes. 16
26 Chapter 4. Mapping Boating Patterns General Clustering Patterns This chapter presents the results of a GIS analysis to map the distribution of digitized trip information as density of occurrence. Continuous density surfaces generated by the GIS illustrate the degree of concentration or clustering of digitized trip information. General clustering patterns for travel routes, destinations, and congested areas were identified using 100-meter grid cells and a feature density search radius of 800 meters as mapping resolution parameters. General route densities are depicted in Figure 8. The greatest density of vessel traffic occurs within the Gulf Intracoastal Waterway between New Pass and Venice Inlet: in particular at Venice Inlet, in southern portions of Sarasota Bay, and within Roberts Bay. Vessel traffic is more diffuse in the wider portions of Sarasota Bay and less intense along segments of the Intracoastal Waterway within Lemon Bay. Seaward of the barrier islands the flow of boat traffic is generally dispersed but follows a radial pattern to and from prominent artificial reefs in the Gulf of Mexico. Figure 9 displays favorite destinations identified by respondents as locales they were most likely to visit on a typical recreational boating trip. The density analysis revealed several prime boating destinations: New Pass, Big Sarasota Pass, and the Venice Inlet. Secondary destination areas include the Bird Keys (closed Midnight Pass area) and Blackburn Point. The Longboat Pass (Manatee County) and Stump Pass (Charlotte County) areas also represent important boating destinations for Sarasota County boaters. Areas where boaters experience congestion defined in Question 20 as more boats than you prefer are illustrated in Figure 10. The density analysis revealed that respondents experience the highest degree of congestion at their favorite boating destinations, including Venice Inlet, New Pass, Big Sarasota Pass, among the spoil islands in Roberts Bay, and near the Bird Keys in Little Sarasota Bay. Longboat Pass and Stump Pass also were identified as congested destinations. Among trip origins, a high degree of congestion was reported at the Centennial Park boat ramp. 17


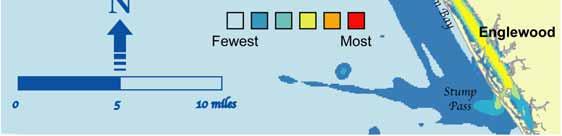
27 Figure 8. Travel Corridors as Summarized with the GIS. 18


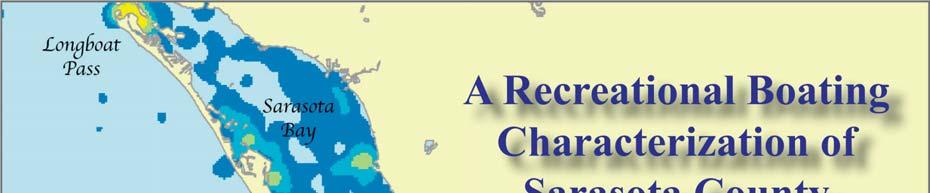
28 Figure 9. Favorite Destinations as Summarized with the GIS. 19


29 Figure 10. Congested Areas as Summarized with the GIS. 20
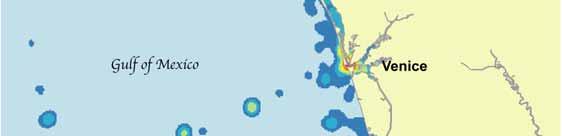
30 Large-Scale Mapping of Selected Locales This section presents higher-resolution maps of use-patterns for a selection of Sarasota County boating locales that include South Sarasota Bay, Roberts Bay, Little Sarasota Bay, Blackburn Bay, Venice Inlet, and portions of Lemon Bay. The maps that illustrate clustering patterns for travel routes, destinations, and congested areas, were generated using 10-meter grid cells and a feature density search radius of 200 meters as mapping resolution parameters. Enhanced accuracy was gained by the on-screen digitizing of trip information using one-meter normal color USGS digital orthophoto quarter quadrangles (DOQQ) and navigation markers for orientation. In addition, information regarding vessel type and draft obtained from survey questions was also used to infer the location of routes with more accuracy than respondents could achieve when drawing on the small-scale survey map. The 10-meter mapping resolution was consistent with the 10-meter masking grid developed for the spatial analysis to (1) preserve small spoil islands and narrow land bridges (e.g., causeways, spits, barrier islands) that are found within the study area and (2) to constrain the density search algorithm to water areas (i.e., to ensure that the density function did not jump narrow land areas to include features that were spatially proximate yet associated with different boating locales). The 200-meter feature density search radius was selected to ensure that the results of the higher resolution mapping accurately portrayed use patterns in the narrow embayments that are prevalent within the Sarasota County coastal boating region. For example, larger search radii produced clustering patterns that jumped sections of narrow barrier islands, falsely implying (at the selected larger scale mapping resolution) that high concentrations of use occurred in some open Gulfside waters. Again, the goal was to select a density search parameter that would highlight areas (such as the Intracoastal Waterway) that experience greater concentrations of boating and congestion, without including spatially proximate areas with significantly less boating activity. Figures 11 and 12 show the density analysis results for the south Sarasota Bay region that includes New Pass and Big Sarasota Pass. Congested areas reported by survey respondents include portions of the Intracoastal Waterway in Roberts Bay, New Pass, Big Sarasota Pass, and the Centennial Park boat ramp locales (Figure 11). Figure 12 displays primary travel corridors and destination hot-spots derived from density analyses of travel routes and favorite destinations. With the exception of the Centennial Park boat ramp locale, areas of congestion coincide with favorite destinations. It should be noted that the Longboat Pass area (Manatee County) also represents a popular boating destination for Sarasota County boaters. Little Sarasota Bay and Blackburn Bay are highlighted in Figures 13 and 14. Congestion was identified within the Intracoastal Waterway between Roberts Bay and Little Sarasota Bay and at the Bird Keys / Midnight Pass locale (Figure 13). The density analysis revealed a spot of reported congestion in Blackburn Bay near the Manasota Beach boat ramp. Primary destinations (Figure 14) in the area include the Bird Keys / Midnight Pass area and Blackburn point, which is consistent with the results of the density analysis of congested spots. Congestion and boating patterns for the Venice Inlet area are depicted in Figures 15 and 16. Snake Island and nearby restaurants represent a focal point for activities and congestion in the area. Secondary nodes of reported congestion are observed at the Manasota Beach boat ramp and 21
31 along a constricted segment of the Intracoastal Waterway just north of Venice Inlet. A secondary destination area was identified at the restaurant associated with Gulf Harbor Marina (Figure 16). Boating in Lemon Bay is primarily restricted to the Intracoastal Waterway. The density analysis revealed a single area of reported congestion associated with the Indian Mound boat ramp (Figure 17) and no significant destination areas within Sarasota County waterways (Figure 18). Stump Pass in Charlotte County, which lies just outside the study area, was identified as a popular destination spot for Sarasota County boaters. 22

32 Figure 11. South Sarasota Bay: Congestion Hot Spots. 23

33 Figure 12. South Sarasota Bay: Travel Corridors and Destination Hot Spots. 24

34 Figure 13. Little Sarasota Bay and Blackburn Bay: Congestion Hot Spots. 25

35 Figure 14. Little Sarasota Bay and Blackburn Bay: Travel Corridors and Destination Hot Spots. 26

36 Figure 15. Venice Inlet: Congestion Hot Spots. 27

37 Figure 16. Venice Inlet: Travel Corridors and Destination Hot Spots. 28

38 Figure 17. Lemon Bay: Congestion Hot Spots. 29

39 Figure 18. Lemon Bay: Travel Corridors and Destination Hot Spots. 30
40 Table 5 shows a breakdown of trip information according to prominent passes and bays utilized by Sarasota County boaters. Seventy three percent of the routes mapped by survey respondents traversed one of five prominent inlets in the study area. An evaluation of routes that were associated with inlets, as reported by survey respondents, indicates that Venice Inlet (32% of routes) and New Pass (30% of routes) experience the greatest relative volume of reported trips. These are followed by Big Sarasota Pass with 22% of routes. Stump Pass in Charlotte County and Longboat Pass in Manatee County (ranked fourth and fifth) are associated with 10% and 7% of trips originating from Sarasota County access facilities, respectively. Table 5. Breakdown of Sarasota County Boaters Trip Features Associated with Inlets and Bays. Pass # of routes % of routes % of total Relative through inlets through inlets routes Rank Longboat New Pass Big Sarasota Pass Venice Inlet Stump Pass Total routes through inlets 1, Total routes 1,832 Bay # of destinations in bays % of destinations in bays % of total destinations Relative Rank Sarasota Bay Robert's Bay Little Sarasota Bay Blackburn Bay Venice Inlet Lemon Bay Total destinations in bays 1, Total destinations 2,291 Bay # of congested spots in bays % of congested spots in bays % of total congested spots Relative Rank Sarasota Bay Robert's Bay Little Sarasota Bay Blackburn Bay Venice Inlet Lemon Bay Total congested spots in bays 1, Total congested spots 1,195 31
41 A ranking of destination and congested locales by bay is also highlighted in Table 5. Baywater destinations account for 68% of the total number of favorite destinations mapped by survey respondents. The results show that Sarasota Bay (53% of destinations) is by far the most popular destination area within Sarasota County, followed distantly by Little Sarasota Bay (15% of destinations) and Lemon Bay (12% of destinations). Venice Inlet and Robert s Bay ranked fourth and fifth, respectively were associated with roughly 9 % of the destinations reported by Sarasota County boaters. Lastly, Blackburn Bay was connected with 4% of baywater destinations. A relative ranking of baywater areas according to perceived congestion (Table 5) shows that Sarasota Bay (40% of baywater congested locales) is overwhelmingly considered to be the most congested area. It should be noted that the majority of congested spots in Sarasota Bay which were reported by boaters are confined to specific locations (e.g., New Pass, Big Sarasota Pass, Centennial Park boat ramp), as identified in Figure 11. Venice Inlet (14% of congested areas) and Robert s Bay (12% of congested areas) are ranked a distant second and third. Congestion in Robert s Bay is shown to be primarily associated with the Intracoastal Waterway (Figure 11). The Venice Inlet locale, by contrast, is characterized by a number of boat accessible restaurants, marinas, and the confluence of the inlet with several interior bays and the Intracoastal Waterway. Little Sarasota Bay and Lemon Bay are ranked fourth and fifth, respectively, with approximately 10% of the congested locales, followed, lastly, by Blackburn Bay with 6%. 32
42 Chapter 5. Boater-Group Characteristics Overview This chapter presents an evaluation and discussion of responses to specific survey questions. Chapter sections are divided according to themes that describe (1) vessel and boater profiles; (2) trips and seasonality; (3) rationale for selecting departure sites, destinations, and travel routes; (4) activities; and (5) perceived congestion. Although questions were arranged to follow a logical progression on the survey instrument the following results and discussion sections are arranged thematically; therefore, questions do not necessarily follow the order in which they appeared on the survey. The descriptive analysis presented in this chapter is based on 1,331 responses that represent a combination of (1) information obtained from the n=973 returned 2005 Sarasota County surveys, and (2) information obtained from the n=358 Sarasota County respondents to the 2003 Tampa and Sarasota Bay recreational boating characterization survey. A copy of the 2005 Sarasota County boater survey instrument is provided in Appendix A. Vessel and Boater Profile This section describes the types of vessels owned and used, and survey respondents boating experience and knowledge of local waterways. The n=1,331 survey respondents accounted for a total of 1,461 vessels, of which 39.70% were Open Fisherman and 27.38% were Power Cruisers. These two vessel types accounted for more than two-thirds of boats owned by respondents (Table 6; Question 6). Table 6. Vessel Type. Frequency Percentage Vessel type count (vessels) of total vessels Jet ski % Kayak/Row/Canoe % Sailboat (no cabin) % Sailboat (with cabin) % Speed Boat % (jet boat, cigarette boat) Open Fisherman % (flats, skiff, johnboat) Power Cruiser % Pontoon/Deck Boat % Other % 1,461 vessels (n = 1,331 respondents) 33
43 Of the n=1,331 survey respondents, 38.47% accessed waterways from public boat ramps (the top-ranked waterway access category) and 37.71% departed from home docks (the second-highest ranked departure category). Together, marina wet slips and dry storage facilities accounted for about 21% of the departure sites identified by respondents (Table 7; Question 11). These ratios are consistent with those obtained from a statewide survey of boaters conducted by Swett et al. ( 2005) in which 43% departed from boat ramps; 35% departed from home docks; 12% from wet slips; and 6% from dry storage facilities. Note that shore/causeway and condominium dock waterway access categories are included (in addition to the four primary waterway access types) in the summary tables as some respondents selected these options when answering Question 11. Table 7. Boater Waterway Access Categories. Frequency Percentage Access Category count of total Rank Boat Ramp % 1 Shore/Causeway % Marina Wet Slip % 4 Dry Storage Facility % 3 Home Dock % 2 Condo Dock % n = 1,331 respondents The average number of months per year that survey respondents reside in the state of Florida is approximately 11.1 months with a 95% confidence interval that ranged from to months (Table 8; Question 21). Table 8. Average Monthly Residence per year in the State of Florida. n = 1,328 respondents out of a total of 1,331 Average number of months living in Florida = months Standard Deviation = 2.37 months 95% confidence interval: {10.96 to months} 34
44 On average, survey respondents had years of recreational boating experience. The 95% confidence interval ranged from to years boating experience. The median number of years of boating experience, based on n=1,328 respondents, was 13 years (Table 9; Question 22). Table 9. Boating Experience (in years). Statistic Years boating Average Standard. Deviation Minimum 0 Maximum Median Mode n = 1,328 The 95% confidence interval for years boating experience: {15.76 years to years}. Survey respondents who accessed waterways from home docks and public boat ramps tended to have the most boating experience in Florida, in each case exceeding the average of years. Respondents departing from marina wet slips reported just over 15 years of boating experience, on average. The experience levels of respondents departing from dry storage facilities (12.4 years) and condo docks (12.8 years) tended to fall well below the average (Table 10; Question 22). Table 10. Years of Boating Experience in Florida by Waterway Access Category. Boating Experience (in years) Access category n Mean Std. dev. Median Min Max Boat Ramp * Shoreline/Causeway 3** 17.0* Marina Wet Slip Dry Storage Facility Home Dock * Condo Dock * Denotes above-average experience-- exceeds the mean (> years). ** Statistic is based on a very small sample size. 35
45 Approximately 70% of n=1,327 respondents indicated that they have had a boater safety or seamanship course. Respondents that launched from boat ramps tended to be the least likely to have had a boater safety or seamanship course while those departing from marina wet slips were the most likely, with well over 90% reporting formal training in boating safety / seamanship. A higher-than-average number of respondents that accessed the water from dry storage facilities, home docks, and condo docks indicated that they had completed some form of boating safety/seamanship course or training (Table 11; Question 23). Table 11. Boaters Having Completed a Boat Safety / Seamanship Course By Waterway Access Category. Access Category n Yes Percentage Boat Ramp Shoreline/Causeway ** Marina Wet Slip * Dry-Storage Facility * Home Dock * Condo Dock * Overall 1, (average) * Denotes above-average value. **Statistic is based on a very small sample. 36
46 Survey respondents were 56 years of age, on average. Respondents who accessed waterways from marina wet slips, dry storage facilities, and home docks were between 2.7 and 4.7 years older than the average respondent. Survey respondents who accessed the water from condo docks tended to be approximately 10 years older than the average survey respondent. Survey respondents launching from boat ramps tended to be about 49 years of age (on average), and roughly seven years younger than the average survey respondent (Table 12; Question 24). Table 12. Age of Boaters by Waterway Access Category. Age (in years) Access Category n Average Std. Dev. Median Min Max Boat Ramp Shoreline/Causeway** * Marina Wet-Slip * Dry Storage Facility * Home Dock * Condo Dock * Overall 1, * Denotes above-average value. ** Statistics are based on a very small sample. 37
47 Willingness to participate in a future Internet survey was highest for respondents that accessed Sarasota County waterways from marina dry storage facilities (76.9%) and marina wet slips (71.6%). The remaining waterway access groups fell at or below the average degree of willingness (67.3%) to participate in a future survey. Respondents that accessed the water from home (63.3%) and condo docks (64%) had the lowest willingness to participate (Table 13a; Question 25a). Table 13a. Boater Willingness to Participate in a Future Internet Survey. Access Category n Yes Percentage Boat Ramp %** Shoreline/Causeway %*** Marina Wet Slip %* Marina Dry Storage %* Home Dock % Condo Dock % Overall n = 1, % (average) * Denotes above-average value. ** Not significantly different from the average at 95% confidence. *** Small sample size bias (not necessarily representative of group). 38
48 Willingness to participate in a future mail survey was highest for boaters that launched from boat ramps (almost 93%), followed by respondents that departed from condo docks (with just over 90%). All other waterway access groups fell at or below the average willingness to participate figure of 88.7%. Respondents that departed from home docks had the lowest willingness to participate percentage with 83.4%. Nonetheless, willingness to participate in a future mail survey was very high across the board, with an average for all waterway access groups of over 88% a figure that is significantly higher than the percentage of respondents willing to participate in the Internet-based survey (Table 13b; Question 25b). Table 13b. Boater Willingness to Participate in a Future Mail Survey. Access Category n Yes Percentage Boat Ramp %* Shoreline/Causeway %*** Marina Wet Slip % Dry Storage Facility %** Home Dock % Condo Dock %* Overall n = % (average) * Denotes above-average value. ** Not significantly different from the average at 95% confidence. *** Small sample size bias (not necessarily representative of group). Trip and Seasonal Use Profiles This section characterizes the trip and seasonal boating profiles of survey respondents. Survey respondents who departed from marinas traveled, on average, 39 minutes from home to their respective departure sites with a median travel time of 15 minutes (Table 14; Question 13). Table 14. Drive Time from Home to Marina. Statistic Drive time (in minutes) Average 39.3 Standard Deviation % confidence interval {24.6 to 53.9 minutes) Median 15.0 n = 265 respondents 39
49 Survey respondents who accessed Sarasota County waterways from boat ramps or causeway/shorelines tended to launch approximately 30 times per year, with a median value of 24 departures per year (Table 15; Question 14). Table 15. Number of Times Per Year that Ramp or Causeway/Shoreline is Used to Launch a Boat. Statistic Number of times/year Average 30.5 Standard Deviation % confidence interval {28.0 to 32.9} Minimum 1.0 Maximum Median 24.0 n = 397 respondents The average drive time for boaters who launched from a boat ramp or shoreline / causeway was approximately 28 minutes; with a median drive time of 20 minutes (Table 16; Question 15). Table 16. Drive Time to Boat Ramp or Shoreline/Causeway (in minutes). Statistic Drive time (in minutes) Average 28.3 Standard Deviation % confidence interval {24.1 to 32.4} Minimum 2.0 Maximum Median 20.0 n = 225 respondents 40
50 Respondents who accessed waterways from home docks tended to have the earliest AM departure (6:20 AM, on average) followed by those who launched from boat ramps (7:37 AM, on average). Boaters who accessed waterways from condo docks tended to depart almost an hour later than those who launched from boat ramps during the AM hours (Table 17; Question 2). Table 17. Departure Time Averages by Waterway Access Category. Average values for group AM PM Access Category n time time Boat Ramp 494 7:37 12:22 Shoreline/Causeway* 3 6:40 12:40 Marina Wet Storage 118 7:53 12:38 Dry Storage Facility 141 7:45 12:28 Home Dock 486 6:20 1:03 Condo Docks 34 8:31 12:21 All groups 1,276 7:11AM 12:41PM * Results based on small sample (not necessarily representative of group). 41
51 Survey respondents reported a total of 1,832 trips with an average trip duration of 5.23 hours (Question 3). For trips of 24 hours or less in duration, respondents who launched from boat ramps tended to log significantly more time on the water than did those who departed from other locations. Marina wet slip users were second in terms of time spent on the water, with an average trip duration of 5.24 hours (note: this value is not significantly different, at the 95% confidence level, from the mean trip duration of 5.23 hours ). Condo dock users tended to spend significantly less time on the water than did those who departed from marina wet slips, dry storage facilities, or boat ramps (Table 18a; Question 3). Table 18a. Trip Duration by Waterway Access Category for Day Trips (Combined Trips: Trip duration < 24 hours day trippers). Day trips (in hours) Access Category Mean 95% C.I. Median Boat Ramp 6.08* {5.9 to 6.2} 6.0 Shoreline/Causeway 3.25 {2.2 to 4.2} 3.5 Marina Wet Slip 5.24 {4.7 to 5.7} 5.0 Dry Storage Facility 5.02 {4.6 to 5.3} 4.3 Home Dock 4.54 {4.3 to 4.7} 4.0 Condo Dock 3.47 {2.9 to 4.5} 3.0 Overall 5.23 {5.1 to 5.3} 5.0 * Denotes above-average trip duration. 42
52 The average duration for trips that exceeded 24 hours in length (yet were less than or equal to 60 days) was approximately 92 hours (or 3.8 days). The median long-term trip duration was 48 hours. Respondents who departed from marina wet slips and home docks tended to spend an above-average number of hours on the water (121.6 and hours, respectively). Respondents who launched from ramps and accessed the waterways from marina dry storage facilities tended to have shorter overnight trip durations (Table 18b; Question 3). Table 18b. Trip Duration by Waterway Access Category for Overnight Trips (Combined Trips: Trip duration > 24 hours < 60 days). Overnighters (in hours) Access Category Mean 95% C.I. Median Boat Ramp 43.5 {37.5 to 49.5} 32 Shoreline/Causeway Marina Wet Slip 121.6* {81.4 to 161.9} 72 Dry Storage Facility 59.1 {38.2 to 80.0} 34 Home Dock 140.7* {94.9 to 186.5} 60 Condo Dock Overall 92.6 {75.0 to 110.3} 48 * Denotes above-average on-water travel time / trip duration. 43
53 Survey responses suggest a year-round boating season in the Sarasota County study region, with a peak-use period running from April through July and an off-peak period from December through February. May is the peak-use month for survey respondents, with an average 4.56 trips per boater reported. January is the month with the lowest average number of reported boating trips, with approximately 2.81 trips per survey respondent (Tables 19a; Question 8). Table 19a. Boat Trips: Monthly Averages (trips / boater / month). Monthly Top-4 % of Month n average rank Trips total January 1, , February 1, , March** 1, , April** 1, * 3 5, May** 1, * 1 6, June** 1, * 2 5, July 1, * 4 5, August 1, * 5, September 1, , October 1, , November 1, , December 1, , Total = 59,773 trips Overall Monthly Average of approx. 3.8 trips / boater / month * Denotes months in which average number of trips exceed the overall monthly average of 3.8 trips / boater / month. ** Denotes peak months (top-4 ranked values, from monthly averages); shown in descending order (from high to low). 44
54 On average, there were boat trips per respondent during the peak-use boating period (which runs from April through July based on average monthly trip estimates from Question 8). Ramp users generated the greatest number of total trips (on average) during the peak-use period followed by home dock users. Boaters who accessed the water from marina wet slips and dry storage facilities generated a less than average number of boat trips during this period. Respondents who departed from condo docks tended to generate the least number of trips (approximately trips on average) during the peak-use period (Table 19b; Question 8). Table 19b. Boat Trips During Peak Season by Waterway Access Category. Trips/boater (April July) Access Category n Total Average Median Rank* Ramp 510 9, ** Shoreline/Causeway*** Marina Wet Slip 135 2, Dry Storage Facility 144 2, Home Dock 502 8, ** Condo Dock Overall n = 1,328 23, *Based on average values. ** Denotes at or above the average value. ***Small sample size. 45
55 Overall, survey respondents averaged about 45 boating trips per year, with a median of 36 trips. Boaters departing from home docks tended to generate the greatest number of boat trips per year (47.3). Dry storage facility, boat ramp, and marina wet slip users accounted for 44.9, 43.9, and 42.7 trips per year (on average), respectively. Condo dock users generated the fewest number of trips per year, with an average of approximately 38 trips (Table 19c; Question 8). Table 19c. Yearly Boat Trip Statistics by Departure Category. Trips/Boater (Year) Access Category n Total Average Median Rank* Boat Ramp , Shoreline/Causeway*** Marina Wet Slip 135 5, Dry Storage Facility 144 6, Home Dock , ** 37 1 Condo Dock 35 1, Overall n = 1,329 59, * Based on average values; ** Denotes an above-average value. *** Small sample size (results not necessarily representative of group). 46
56 Trip-day information obtained from survey respondents was used to compare the number of weekday versus weekend trips by waterway access category. Of the 1,886 total reported trips, 55.30% were taken on a weekend (Saturday/Sunday) and 44.69% on a weekday (Monday through Friday). Two-thirds of boat trips that initiated from ramps tended to occur on the weekend (61.72% of trips on a weekend and 38.27% on a weekday). By contrast, a large majority of trips made by survey respondents who departed from marina wet slips or condo docks tended to fall on weekdays. Trips associated with survey respondents who accessed the water from dry storage facilities or home docks tended to be fairly evenly split between weekdays and weekend (Table 19d; Question 4). Table 19d. Boater Trip Days: Weekday versus Weekend Trips. Weekday Weekend Total Access Category trips % trips % trips Boat Ramp Shoreline/Causeway * * 6 Marina Wet Slip Marina Dry Storage Home Dock Condo Dock * Overall ,886 * Small sample size (not necessarily representative of group). 47
57 Rationale for Selecting Departure Sites and Travel Routes This section characterizes the rationale for selecting departure sites (e.g., marina, ramp, dock), and travel routes. The top five reasons cited by survey respondents for selecting a departure site were if it (1) had adequate parking (top-ranked response); (2) facilitated easy boat launch and retrieval; (3) had safe and secure parking; (4) had a short wait to launch; and (5) was proximate to favorite boating spots/destinations (Table 20; Question 16). Note that lower average numerical score indicates greater importance. Table 20. Reasons for Selecting a Favorite Departure/Launch Site. Response* Reason/Description Count (n) Average Rank** 1 Deep-water access Availability of restrooms No parking / launch fee Well-marked access channels Proximity to favorite boating spots Adequate parking Availability of fishing supplies Short wait to launch Gas, pump-out, maintenance service Nearby amenities (e.g. restaurants) Proximity to home Ease of launching/retrieving boat Safe and secure parking Other reason: mixed/comments Note: Count (n) is out of 1,331 total survey respondents to question 16; * Average response based on Key below; ** Ranking: from most important to least important (reasons 1-13 only) Key: 1 Strongly agree (very important) 2 Agree (important) 3 Neutral 4 Disagree (somewhat unimportant) 5 Strongly disagree (very unimportant) 48
58 The top five reasons for selecting a favorite travel route included (a) to enjoy scenic beauty (top-ranked response); (b) to avoid congested areas; (c) well marked channels; (d) quick access to favorite boating spots; and (e) avoidance of shallow water (Table 21; Question 9). Table 21. Reasons for Selecting a Favorite Travel Route. Response* Reason/Description Count (n) Average Rank** 1 Avoid congested areas 1, Avoid shallow water 1, Good fishing Prefer well-marked channels 1, Prefer calm protected waters 1, Avoid speed 1, None are important just cruise around 1, Easy access to supplies or fuel 1, Quick access to favorite boating spots 1, Enjoy scenic beauty 1, Other reason Note: Count(n) is out of 1,331 total survey respondents. * Average response based on Key below; ** Ranking: from most important to least important (reasons 1-13 only) Key: 1 Strongly agree (very important) 2 Agree (important) 3 Neutral 4 Disagree (somewhat unimportant) 5 Strongly disagree (very unimportant) 49
59 Boater Activity Profile This section presents a summary of recreational boating activities reported by survey respondents. The results are based on answers to Question 18 and reflect a ranking of chosen activities. Respondents were asked to choose, from an activity list, all of the activities in which they engage on a typical pleasure boating trip. Count is, therefore, equal to the total number of times a given activity was chosen. [Note: Since many respondents selected multiple activities from the list, the column of percentages will sum to more than 100%.] The top six activities (by rank) are identified in each table. Fishing and cruising ranked as the leading activities, with approximately two-thirds of survey respondents marking these two categories as their primary activities during a typical boating trip. Visiting restaurants was the third-most popular activity (about 54%) followed by sightseeing and nature viewing (each accounting for about 46% of survey respondents). Socializing ranked sixth, an activity that was identified by roughly 45% of the boaters who responded to the survey (Table 22; Question 18). Table 22. Boaters Activity Statistics (entire sample). Percentage of Activity Count (n) respondents Rank Beach Picnicking % Nature Viewing % 5 Sightseeing % 4 Cruising % 2 Daytime Anchoring % Socializing % 6 Diving % Overnight Anchoring % Visit Restaurants % 3 Fishing % 1 Sailing % Swimming % Skiing/Water-sports % Other % * Note: Count (n) reflects the number of respondents that marked a given activity out of the sample of n=1,331 respondents. 50
60 Fishing ranked as the leading activity among survey respondents who launched from boat ramps, with 80.66% acknowledging that they fished during a typical boating trip. Swimming, cruising, nature viewing, and restaurant visits rounded out the top five responses. Beach picnicking and sightseeing were tied for 6 th place. The top six activities were chosen by at least 41% of all survey respondents as activities in which they engaged during a typical boating trip. Sailing and overnight anchoring ranked lowest on the list, collectively accounting for less than 10% of activities reported by respondents who departed from boat ramps (Table 23a; Question 18). Table 23a. Boaters Activity Statistics: Boat Ramp Group. Percentage of Activity Count (n) respondents Rank Beach Picnicking % 6 (tie) Nature Viewing % 4 Sightseeing % 6 (tie) Cruising % 3 Daytime Anchoring % Socializing % Diving % Overnight Anchoring % Visit Restaurants % 5 Fishing % 1 Sailing % Swimming % 2 Skiing/Water-sports % Other % Results are based on the 512 respondents. 51
61 Cruising was by far the number one activity for boaters who departed from marina wet slips, with over 80% indicating that they engaged in this activity during a typical boating trip. Socializing and restaurant visitation (57.04% and 52.59% of respondents, respectively) also were top responses. Sightseeing and nature viewing came in fourth and fifth place (accounting for 46.67% and 40% of respondents, respectively). Daytime anchoring was sixth on the list with a respectable 33.33%. Only 5.19% of survey respondents engaged in skiing / watersports the least likely activity of boaters accessing the water from marina wet slips (Table 23b; Question 18). Table 23b. Boaters Activity Statistics: Marina Wet Slip Group. Percentage of Activity Count respondents Rank Beach Picnicking % Nature Viewing % 5 Sightseeing % 4 Cruising % 1 Daytime Anchoring % 6 Socializing % 2 Diving % Overnight Anchoring % Visit Restaurants % 3 Fishing % Sailing % Swimming % Skiing/Water-sports % Other % Results are based on n = 135 respondents 52
62 Cruising was the top-ranked activity among survey respondents who departed from dry-storage facilities, with a 70.14% response rate; followed by visiting restaurants (64.58%), fishing (61.11%), sightseeing (47.92%), and socializing (46.53%). Nature viewing deserved an honorable mention, as it was an activity also identified by almost half of the respondents (44.44%). Less than 10% of respondents who departed from dry-storage facilities identified diving, sailing or overnight anchoring as typical activities (Table 23c; Question 18). Table 23c. Boaters Activity Statistics: Marina Dry Storage Group. Percentage of Activity Count respondents Rank Beach Picnicking % Nature Viewing % 6 Sightseeing % 4 Cruising % 1 Daytime Anchoring % Socializing % 5 Diving % Overnight Anchoring % Visit Restaurants % 2 Fishing % 3 Sailing % Swimming % Skiing/Water-sports % Other % Results are based on n = 144 respondents 53
63 Cruising was the top ranked activity for boaters who accessed Sarasota County waterways from home docks; almost 70% of respondents acknowledged that they engaged in this activity while on a typical boating excursion. Other top activities included fishing (64.94%), visiting restaurants (62.75%), nature viewing (51.20%), socializing (50%), and sightseeing (49.60%). Over one-third of home dock users engaged in beach picnicking and swimming activities. The least likely activities of home dock users included overnight anchoring, sailing, and skiing / water-sports (Table 23d; Question 18). Table 23d. Boaters Activity Statistics: Home Dock Group. Percentage of Activity Count respondents Rank Beach Picnicking % Nature Viewing % 4 Sightseeing % 6 Cruising % 1 Daytime Anchoring % Socializing % 5 Diving % Overnight Anchoring % Visit Restaurants % 3 Fishing % 2 Sailing % Swimming % Skiing/Water-sports % Other % Results are based on n = 502 respondents 54
64 Cruising (71.43% of respondents), visiting restaurants (62.86%), and sightseeing (62.86%) were the leading activities cited by respondents who departed from condo docks. Other prominent activities included fishing (57.14%), nature viewing (45.71%), and socializing (37.14%). The least likely activities were diving and skiing / water-sports, each accounting for less than 6% of the activities engaged in by condo dock users (Table 23e; Question 18). Table 23e. Boaters Activity Statistics: Condo Dock Group. Percentage of Activity Count respondents Rank Beach Picnicking % Nature Viewing % 5 Sightseeing % 2 (tie) Cruising % 1 Daytime Anchoring % Socializing % 6 Diving % Overnight Anchoring % Visit Restaurants % 2 (tie) Fishing % 4 Sailing % Swimming % Skiing/Water-sports % Other % Results are based on n = 35 respondents (small sample) 55
65 Perceived Congestion The summary of perceived congestion is based on responses to Questions 19, which defined congestion as the presence of too many other boaters. Approximately 43% of survey respondents answered, yes to Question 19 indicating that they had avoided or left congested areas while boating. The boat ramp user group reported the highest percentage of perceived congestion, with over 51% answering Yes to Question 19. Survey respondents that departed from home docks were a distant second with 42.71% acknowledging the presence of too many boaters (Table 24; Questions 19 = Yes). Table 24. Analysis of Congestion: Proportion of Survey Respondents that Indicated they had avoided or left their Favorite Spots/Destinations Due to Congestion. Answered Access Category n Yes to Q19 Percentage Rank Boat Ramp %* 1 Shoreline/Causeway % Marina Wet Slip % 5 Dry Storage Facility % 4 Home Dock % 2 Condo Dock % 3 Overall 1, % * Denotes above-average value. 56
66 Chapter 6. Perceived Detractors and Needs Overview This chapter summarizes the responses to the following survey questions: Question 26. What detracts most from your boating experience? Question 27. What is needed most to improve your boating experience? A content analysis of the responses to each of the two questions yielded a typology of principal detractors (problems) and principal needs (solutions). Responses with shared general themes were grouped into primary categories, with more focused sub-categories identified where possible. The analysis was based on (1) information from n=973 returned surveys and (2) information obtained from the n=358 Sarasota County respondents to the 2003 Tampa and Sarasota Bay recreational boating characterization survey. Some responses were excluded from this analysis as not being amenable to planning or management intervention (e.g., responses to Question 26 such as work, weather, or cleaning the boat or to Question 27 such as a bigger boat, or new engines ). In this chapter, total responses therefore refers to total analyzed responses. Note that some respondents listed multiple detractors and needs so the number of responses to these questions is greater than the number of surveys received. The results of the content analysis are presented in aggregate (all four access categories were grouped as one) with rankings based on the percentage received for each principal detractor or need. Though some groups were comparatively overrepresented (ramp and dock users) or under-represented (marina wet slip and dry storage users) in terms of the number of surveys received, the response rates for the access groups garnered for this study are close to the ratios obtained in a 2005 statewide survey of boaters (Swett et al., 2005). As such, the results of the content analysis likely reflect the ranking of concerns of all boaters (all access types aggregated) in proportion to each group s "place" in Florida s boating population. Detractors Table 25 lists the primary categories of boating experience detractors. The leading category, with more than twice as many responses as the runner-up category and with more than one-third (37.3%) of the n=1,620 total responses, addressed a perceived lack of courtesy and/or seamanship in other boaters such as failure to observe safe, considerate, or regulated boating practices through disregard or ignorance). Responses citing congestion, either in the water or at ramps, made up the second-leading detractor category, with 15.0% of the total responses. Close behind were infrastructure deficiencies that emphasized quality issues (14.0% of the total). Altered environment detractors (10.9% of the total), especially red tide, and excessive regulation (10.6% of total responses) with a focus on manatee, speed, and no-wake zones ranked fourth and fifth, respectively. Ranking sixth and comprising the final significant detractor group were water access concerns regarding primarily a lack of boat ramps and ramp parking (9.8% of the total). Only a combined 2.4% of the total indicated either that too little regulation was a principal detractor or that no detractors figured in their boating experience. (Note: No detractors was specifically stated, not inferred from a lack of response.) 57
67 Table 25. Boating Detractors by Primary Category. Primary Detractor Category Total Number of Percent of Rank Responses* Total Lack of Courtesy and/or Seamanship Congestion Infrastructure Deficiencies Altered Environment Excessive Regulation Lack of Water Access No Detractors Lack of Regulation / Enforcement TOTALS 1, *The summed Total Number of Responses does not equal the number of surveys returned because many survey respondents chose not to answer this question, and even more identified multiple detractors in response to this question. Lack of Courtesy and/or Seamanship in other boaters, the leading detractor category, encompassed all perceptions of bad boating behavior, whether applied to bad boaters in general or to specific user groups. These sub-categories are listed in Table 26. Perceptions ranged from reckless or inconsiderate practices (e.g., speeding too near other vessels or slowness in boat launching and retrieval), to inexperience (e.g., weekend rentals), to noncompliance with established laws and precedents (e.g., ignoring no wake zones on the ICW). Bad boaters in general made up 38.7% of the responses in this category and comprise the leading sub-category when all detractor types are considered, with 14.4% of the total response number. Unsafe operators of PWCs (20.6% of category), large boats generating large wakes in proximity to smaller craft (15.8% of category), and speeding powerboats (11.6% of category) were cited independently in significant numbers. A lack of courtesy and/or launching/retrieval ability on the part of ramp users comprised 4.6% of this category and 1.7% of all detractors cited. Additional sub-categories with less than 2% each of the total response number included aspects of boat noise, operator alcohol use, and inexperienced rental users. Table 26. Lack of Courtesy and/or Seamanship Detractors by Sub-Category. Primary Detractor/Sub-Category Response Percent of Overall Number Category Percentage* Lack of Courtesy and/or Seamanship Bad Boaters in General PWCs Large Boat Wakes Speeding Power Boats Ramp Users Noisy Power Boats Drinking Boaters Rentals *Overall percentage refers to the percentage of all tallied responses to Question
68 Too many boaters was the sentiment expressed in 15.0% of all responses to Question 26, making congestion the second leading category. Site-specific and time-specific aspects of congestion were noted and make up the sub-categories in Table 27. Approximately 75% of category responses were fairly evenly divided between congestion on the waterways and at ramps, with the resulting safety and access concerns. Ramp congestion was tied by many to the above-mentioned delays in launching and retrieving, and, in turn, to the display of impatient, angry behaviors. Weekend and holiday boat traffic was considered a principal detractor in 33 responses (13.6% of category), with a consequent avoidance of these times on the part of some. A much lesser number targeted specific water areas (9.1% of category), such as overcrowded fishing spots or water sport areas. Table 27. Congestion Detractors by Sub-Category. Primary Detractor / Sub-Category Response Percent of Overall Number Category Percentage* Congestion On Waterways At Ramps Congestion (at specific areas) On Weekends and Holidays *Overall percentage refers to the percentage of all tallied responses to Question 26. The third-leading detractor category dealt with infrastructure deficiencies, as itemized in Table 28. A disproportionate number of responses, accounting for about two-thirds (65.6%) of this category, addressed the failure to provide and maintain dredging, also stated as the failure to alleviate shoaling. Difficulty accessing the Gulf due to the lack of dredging of passes (specifically Big Sarasota Pass, New Pass, and Midnight Pass) accounted for 45 responses, or 30.2% of this sub-category. Shoaling in creeks (e.g., Phillippi), canals (e.g., Siesta Key), and bays was also cited. Smaller numbers (together, just 1.5% of total responses) addressed channel mark and waterway sign deficiencies, as being confusing, inadequate, or not current. Inadequate public ramp and marina facilities were deemed a leading detractor in 14 and 6 responses respectively. Ramp quality issues ranged from their being too steep or too shallow to their not providing amenities such as bathrooms, fresh water, or fish-cleaning stations. Similarly, though in smaller numbers, responses targeted marina facilities lack of full service, such as fuel dock or pump-out station availability. Sub-categories involving deficient destination infrastructure were dominated by the lack of waterfront restaurants (9.3% of category and 1.3% of total), followed by the lack of designated water sport areas (4.0% of category). 59
69 Table 28. Infrastructure Deficiency Detractors by Sub-Category. Primary Detractor / Sub-Category Response Percent of Overall Number Category Percentage* Infrastructure Deficiencies Dredging Waterfront Restaurants Channel Marks Ramp Facilities Designated Water Sport Areas Waterway Signs Marina Facilities Beaches, Artificial Reefs *Overall percentage refers to the percentage of all tallied responses to Question 26. Detractors focusing on altered natural environment constituted the fourth largest category, with 10.9% of all responses (Table 29). Perhaps because of outbreaks occurring during the study period, red tide was named the principal detractor in 6.4% of all responses, making it tied for the fourth highest sub-category overall. Other sources of water pollution including the presence of trash in the water subsumed the second highest number of responses in this category (26.5% of category and 2.9% of total). Loss of natural areas to shore development and a perceived shortage of fish populations together accounted for 26 responses, or 1.6% of the total overall. Table 29. Altered Environment Detractors by Sub-Category. Primary Detractor/Sub-Category Response Percent of Category Overall Number Percentage* Altered Environment Red Tide Water Trash/Pollution Shore Development/Lack of Natural Areas Lack of Fish *Overall percentage refers to the percentage of all tallied responses to Question 26. The fifth category of boating experience detractors dealt with perceptions of excessive boating regulation (Table 30). Of these, restraints imposed by manatee zones generated the largest response number (36.7% of category and 3.9% of total). Of similar nature were responses indicating excessive no wake zones (29.1% of category) and speed zones (27.3% of category) with cited concerns including excessive length, secondary congestion, and unreasonable time for Gulf access. These three boat speed regulatory concerns accounted for 93.1% of category responses and 10% of the total responses. 60
70 Table 30. Excessive Regulation Detractors by Sub-Category. Primary Detractor/Sub-Category Response Percent of Overall Number Category Percentage* Excessive Regulation Manatee Zones No Wake Zones Speed Zones Patrol Harassment Fishing Regulations Boating Regulations * Overall percentage refers to the percentage of all tallied responses to Question 26. The sixth-leading detractor category dealt with aspects of compromised water access (Table 31). Paramount was the reported lack of ramp parking, accounting for 57.9% of all responses in this category and comprising the seventh highest sub-category overall (5.7% of total responses). Within this group, a significant number further defined the detraction as a lack of parking space for trucks with trailers. Full parking lots by a very early hour, tickets incurred for parking outside designated areas, and other limited access repercussions such as sometimes the ramp parking lot is full after I put my boat in the water were reiterated. Independent of parking, insufficient ramp numbers was the second leading access detraction (28.3% of category). By comparison, a shortage of marinas/slips was principal detractor in only 10 responses (6.3% of category), half of which specifically cited the loss of marinas to condominiums. Shortage of public dock space at marinas and popular waterfront restaurants and dry storage facilities completed the lack of access considerations. The lack of marinas and dry storage however is less likely to be a concern to those boaters who already have access to these facilities. As such, this category may represent a more important detractor especially to the large segment of the boating population in Florida not specifically targeted by the survey and who do not already keep their vessels in these limited and costly facilities. Table 31. Lack of Water Access Detractors by Sub-Category. Primary Detractor/Sub-Category Response Percent of Overall Number Category Percentage* Lack of Water Access Ramp Parking Ramps Marinas/Slips Dockage Dry Storage *Overall percentage refers to the percentage of all tallied responses to Question 26. Responses addressing a perceived lack of regulation or enforcement as a detractor were few in number (13 responses, or 0.8% of total) and fragmented into the several minor subcategories given in Table 32. The six responses weighing in for too little boat speed management 61
71 (i.e., via speed zones or manatee zones) comprised only 0.4% of the total responses. Given the substantial detractor subcategories of speeding powerboats and large boat wakes (see Table 33) it would appear that this aspect of boating was more readily seen in terms of a need for more patrols and regulation/enforcement of existing zones and regulations (as articulated in Question 27). Table 32. Lack of Regulation/Enforcement Detractors by Sub-Category. Primary Detractor/Sub-Category Response Percent of Overall Number Category Percentage* Lack of Regulation / Enforcement Speed Zones (no wake) Crab Trap Proliferation Manatee Protection Ramp Parking for Trailers Only Fishing Regulations / Catch Limits * Overall percentage refers to the percentage of all tallied responses to Question 26. The leading 10 detractor sub-categories accounted for 1,119 (or 70%) of the n = 1,620 total analyzed responses to question 26 (Table 33). A significant majority (14.4% of total responses) cited a lack of courtesy and/or seamanship on the part of other boaters in general as the greatest detraction from their boating experience. When unsafe operators of PWCs (ranked third), large wake generators (ranked sixth), and speeding powerboats (ranked ninth) are included in the other boater behavior consideration, the group expands to almost one-third (32.3%) of total responses. The perceived infrastructure failure of maintenance dredging particularly of Big Sarasota Pass, Midnight Pass, and New Pass ranked second with 9.2% of total responses. Tying with waterway congestion for fourth place was the environmental effect of red tide. The lack of ramp parking, negatively impacting water access, ranked seventh. The imposition of too many and ill-conceived manatee zones completes the 10 leading detractor sub-categories. Table 33. Top-10 Detractors by Sub-Category. Detractor Sub-Category Response Overall Rank Number Percentage General lack of courtesy/seamanship Lack of Dredging (particularly the passes) PWCs Red Tide (tie) Waterway Congestion (tie) Large Boat Wakes Lack of Ramp Parking Ramp Congestion Speeding Powerboats Manatee Zones
72 Needs Analysis of responses to Question 27 suggested seven primary categories, as listed in Table 34. Some responses addressing solutions to problems (needs) had themes mirroring those of the problems themselves (detractors). There were 112 fewer responses to Question 27 than to Question 26, and the areas of emphasis shifted in hierarchy somewhat. Many responders took advantage of Question 27 to address boating concerns other than those stated in their previously given detractors. It also appeared that certain detractors (e.g., boater lack of courtesy and/or seamanship) did not suggest corrective measures as readily as others (e.g., shoaling). For example, even if more regulation enforcement and boater education/information categories are combined, the total response number does not make up a needs preponderance comparable to the bad boater behavior detractor category. The leading response category to Question 27, with 34.5% of the total responses (n = 1,508), was the need for infrastructure improvement. Many facets were addressed, from those ensuring safe passage to those providing for destination entertainment. Needs categorized under increased access ranked second (21.5% of total), followed by more regulation/enforcement (17.2% of total) of boat operation on the water and at ramps. In descending order, the next three categories, each garnering similar numbers of responses, were aspects of boater education, environmental protection, and the desire for less regulation (e.g., speed constraints). Finally, those responses indicating no needs comprised the seventh and smallest category, with 3.6% of the total. Table 34. Boating Needs by Primary Category. Primary Needs Category Total Number Percent of Responses Total Rank Infrastructure Improvement Increased Access More Regulation / Enforcement Boater Education / Information Environmental Protection Less Regulation No Needs TOTALS 1, The Infrastructure Improvement category (Table 35) was dominated by expressions of the need for dredging (43.6% of category and 15.1% of the total responses); this sub-category was dominated in turn by 90 responses (39.0% of dredging needs) of open Midnight Pass. Desired dredging of New Pass and Big Sarasota Pass accounted for additional 19 and 39 responses respectively, and 39 responses simply stated open the passes to the Gulf, such that 81.9% of dredging needs related to the Gulf passes. Improved channel marks constituted the second highest sub-category (17.9% of category). The need for improved ramp facilities (10.2% of category) encompassed many aspects, ranging from larger size and greater dock space to amenities such as freshwater rinse areas and bathrooms. The need for infrastructure to 63
73 accommodate boating activities collectively subsumed 23.6% of the category. In descending order, waterside restaurants garnered 9.4% of category, artificial reefs accounted for 6.3%, beaches and picnic areas and parks 4.6% of category, and water sport areas 3.3%. Finally, needs for improved signage, particularly as to hazard alerts, and for full service marinas (e.g., to accommodate haul-outs and heavy maintenance) completed the category, with less than 2.5% each of the total response number. Table 35. Infrastructure Improvement Needs by Sub-Category. Primary Need/Sub-Category Response Percent of Overall Number Category Percentage* Infrastructure Improvement Channel and Pass Dredging Channel Marks Ramp Facilities Waterside Restaurants Artificial Reefs Beaches, Picnic Areas, Parks Designated Water Sport Areas Full Service Marinas Waterway Signs * Overall percentage refers to the percentage of all responses tallied from Question 27. The second highest category, addressing water access needs, was primarily about the need for ramps and ramp parking (Table 36). With 75.6% of the category responses and 21.5% of the total responses, this was the leading sub-category overall. Whereas ramps and ramp parking were considered separately in the detractor analysis, they were more often linked in responses to Question 27 and so were made a single sub-category. Specific places cited as needing greater ramp access included the east-side of Sarasota Bay, in town Sarasota, and City Island (Bayfront Park). The need for more marinas and slips was a distant second with 11.1% of category, followed by more public dockage access with 8.0%. Water access via anchorages and public moorings was cited as a principal need in nine responses and dry storage facilities in eight, together comprising 5.3% of this category. Again, the need for more slips and dry storage is likely less of an issue to those boaters targeted by the survey that already have access to these facilities. Table 36. Increased Access Needs by Sub-Category. Primary Need/Sub-Category Response Percent of Overall Number Category Percentage* Increased Access Ramps and Ramp Parking Marinas/Slips Public and Transient Dockage Anchorages and Public Moorings Dry Storage Facilities * Overall percentage refers to the percentage of all responses tallied from Question 27 64
74 Expressions of need for more boating regulation or better enforcement of existing regulations comprised the third highest category, with multiple fairly equally weighted subcategories (Table 37). A greater patrol presence was desired both on the water (18.1% of category) and as a newly instituted service at ramps (9.7% of category). The latter 25 responses, with several targeting 10 th Street ramp, called for an official (patrol or dock master) to direct the launch and retrieval traffic in order to maintain order and stop disputes. Specific suggestions were made for numbering systems or delay fines to regulate traffic flow particularly during peak periods. The need for mandatory boat operator licensure accounted for 12.0% of category responses. Speed control effected through better enforcement of speed zones or no wake zones was a principal need in 56 responses, or just over 21% of the category. More regulations governing PWC operation accounted for 15.1% of the category and better enforcement of boating regulations in general comprised 13.9% of category (2.4% of total responses). Finally, greater management directed at waterway congestion, boating under the influence, and the proliferation of crab traps near channels made up the remaining 25 responses in this category. Table 37. More Regulation/Enforcement Needs by Sub-Category. Primary Need/Sub-Category Response Percent of Overall Number Category Percentage* More Regulation/Enforcement Water Patrols PWC Regulations Boating Regulation Enforcement in General Speed Zones Operator Licensure Ramp Patrols No Wake Zones Waterway Congestion Drinking and Boating Crap Traps/Commercial Fishing * Overall percentage refers to the percentage of all responses tallied from Question 27. Improved water quality (i.e., less pollution, run-off, or trash) accounted for more than one third of all responses (39.4% of category 3.0% of total responses) directed at environmental protection needs (Table 38). The need to better control red tide outbreaks was tallied separately and characterized 21 responses, or 21% of the category. A total of 25 responses encompassed the less shore development sub-category, with seven responses in this group specifically calling for more natural areas. More fish was deemed most necessary to improve the boating experience in 20.2% of the category responses (1.5% of total). 65
75 Table 38. Environmental Protection Needs by Sub-Category. Primary Need/Sub-Category Response Percent of Overall Number Category Percentage* Environmental Protection Improved Water Quality No Red Tide Less Shore Development More Fish * Overall percentage refers to the percentage of all responses tallied from Question 27 The need for boater education (Table 39) was cited by 129 respondents and encompassed 8.6% of total responses. The need for training in etiquette and seamanship ranked as the 3 rd highest sub-category. While frequently calling for required boating courses, such as offered by the USCG, this category also encompassed all expressions of need for more courtesy, safety, skill, or law abidance on the part of other boaters. The need for information primarily focused on more frequent weather reports and better detailed and current charts (11.6% of category). Environmental stewardship and awareness was one of the least reported needs and seems out of place given the relative importance placed on detractors pertaining to the altered environment category. It may be that respondents attribute environmental negatives including poor water quality, red tide, pollution, and trash as being more related to land-oriented factors. Table 39. Boater Education Needs. Primary Need/Sub-Category Response Percent of Overall Number Category Percentage* Boater Education Etiquette/Safety/Skills/Regulations Information (e.g., weather; charts) Environmental Stewardship * Overall percentage refers to the percentage of all responses tallied from Question 27 Another 7.0% of total responses conveyed the need for less regulation in order to improve their boating experience (Table 40). Over 90% of these dealt with removing or limiting speed restrictions conferred by manatee zones (33.0% of category), no wake zones (28.3%), or speed zones (28.3% of category). Fewer, shorter, and more appropriate (e.g., as to location, time of year enforcement) zones were advocated by some, as well as an increased speed limit on the ICW. 66
76 Table 40. Less Regulation Needs by Sub-Category. Primary Need/Sub-Category Response Percent of Overall Number Category Percentage* Less Regulation Manatee Zones No Wake Zones Speed Zones Boating Regulation in General Fishing Regulations * Overall percentage refers to the percentage of all responses tallied from Question 27. The top 10 needs by subcategory accounted for 946 (or 62.7%) of the n = 1,508 total responses to Question 27 (Table 41). The dominant expressions of need were identified with access, specifically more ramps and ramp parking, and with infrastructure in the form of dredging, especially of the passes to the Gulf. Together, these top two sub-categories accounted for almost one-third of total responses. Following the need for boater education/courtesy or seamanship skills (ranked 3 rd ), three other aspects of infrastructure need ranked 4 th through 6 th. These included improved channel marks (e.g., being lit at night), better constructed ramp facilities with more amenities, and more waterside restaurants. More water police characterized the 7 th highest need for an enhanced boating experience, followed closely by improved water quality and more regulations aimed at personal watercraft use. More boating regulation or enforcement in general (and with particular respect to speed zones) completed the top ten need sub-categories. Table 41. Top-10 Needs by Sub-Category. Need Sub-Category Response Overall Rank Number Percentage More Ramps and Ramp Parking Dredging of Passes and Channels Etiquette/Safety/Seamanship Skills Channel Marks Improvement Ramp Facility Improvements Waterside Restaurants More Water Patrols Improved Water Quality More PWC Regulations Boating Regulation Enforcement in General Note: 26 responses indicated No needs. 67
77 Chapter 7. Conclusions and Recommendations Study Findings The goal of this study, as expressed by the Sarasota County Department of Natural Resources, was to characterize waterway use patterns and profile boaters that actively use coastal waterways within and around Sarasota County. Important study objectives were (1) to develop spatial databases of waterway use to map boating patterns within a geographic information system (GIS), and (2) to characterize the vessels, activities, and inclinations of boaters that use Sarasota County coastal waterways on the basis of waterway access categories that included marina wet slips, dry storage facilities, public ramps, and private docks. In support of the goal and primary objectives, a map-based questionnaire was mailed to 4,650 boaters that represented each of the four target waterway access groups. A total of 973 boaters completed and returned the questionnaire, which represents an average return rate of approximately 21 percent. A compilation of the responses to a subset of survey questions reveals that the typical survey respondent: Is a Florida resident for at least 11 months of the year and is approximately 56 years of age; Has, on average, 16 years of boating experience on Florida waterways and has taken a boating safety or seamanship course; Owns one boat that is either an open fishing vessel or a power boat with cabin accommodations; Takes an average of three to four boating trips per month, with more trips taken during the late spring and summer months (April through July) and fewer trips during winter months (December through February); Begins their trip at approximately 7AM and spends about 5 hours on the water; Shows a preference for the following water-based activities in order of importance: visiting restaurants, fishing, cruising, sight-seeing, and nature viewing (this finding affirms the importance of accessible waterfront restaurants to the Sarasota County boating community); Perceives that a lack of seamanship and/or courtesy by other boaters detracts most from their recreational boating enjoyment, and lastly; Believes that infrastructure improvements and better access (e.g., improved channel dredging and marking, and more ramps with better facilities) and greater enforcement of existing boating regulations would do most to improve their recreational boating enjoyment. A GIS density analysis of spatial trip information reported by survey respondents was used to map travel corridors and identify favorite destination locales, as well as congestion hot spots. Digitized and mapped trip information, highlighting density of occurrence, revealed that 68
78 boating is more prevalent in southern portions of Sarasota Bay (e.g., New Pass and Big Sarasota Pass), in and around the Venice Inlet area, and within Roberts Bay (e.g., Intracoastal Waterway and spoil islands). In contrast, the findings indicate that boating is less prevalent, on the whole, in Little Sarasota Bay, Blackburn Bay, and in Sarasota County portions of Lemon Bay. Notwithstanding, the use-density analysis revealed pockets where boating activities cluster, mostly related to the presence of boat ramps and/or restaurants within these less utilized waterways. Sampling Results The sampling method was designed to provide samples of sufficient size to calculate descriptive statistics for each waterway access group, based on a tolerable error of ± 0.05 and a confidence level of 95 percent. A census of vessels in marinas (were access was permitted) was used to reach boaters whose vessels were observed in marina wet slips and at dry storage facilities. Each boater associated with a vessel observed in a marina wet slip or at a dry storage facility received a survey due to the comparatively small number of vessels associated with these two waterway access categories. In contrast, a random sample was taken of boaters observed using public ramps and associated with private docks, since the available sample frame for these two access categories exceeded minimum sample size requirements. Mail survey returns indicate that samples associated with public ramp and private dock users exceeded a tolerable error of ± 0.05 and a confidence level of 95 percent. While marina wet slip and dry storage facility categories did not meet this benchmark, and are comparatively underrepresented, the sample sizes obtained for these groups (n=138 marina wet slip and n = 149 dry storage users) were sufficiently large to allow for the computation of descriptive statistics with acceptable confidence intervals. For future comparative analyses, it is recommended that marina wet slip and dry storage facility groups be combined into a single marina category to circumvent statistical problems associated with sample size limitations and lower survey response rates. This would allow for the collection of a larger overall sample size that would approach a maximum tolerable error of ± 0.05 at the 95 percent confidence level. Nonetheless, it was determined that a sufficiently large sample for each of the four primary waterway access groups was obtained for the purposes of the descriptive analyses conducted for this study. Notwithstanding, it should be noted that unequal survey return rates percentages (while being less of an issue with summary statistics that were applied to specific waterway access groups), may result in a ranking bias of detractors and needs issues towards those groups that responded to the survey in greater numbers (i.e., dock and ramp users) versus lower relative numbers (i.e., marina wet slip and dry storage users). That being said, a content analysis can be applied to specific user categories to alleviate the potential for unequal weighting of aggregated responses. Survey Non-Response Low survey response rates increase the possibility of non-response bias. Non-response bias occurs when a reported value (e.g., number of boating trips per month) deviates from the actual population value due to differences between those individuals who responded to the survey and those who did not. The usual method to increase response rates, and thus minimize non- 69
79 response bias, is to revisit cases that were unproductive (e.g., non-contacts or refusals) after initial survey rounds, with the expectation that some can be converted to respondents (Fillion, 1976, Lynn, Clarke, Martin, & Sturgis, 2001). An alternative yet less robust method involves evaluating waves of survey returns with the assumption that non-responders are more similar to reluctant responders (Green, 1991). The possibility exists that boaters who completed and returned the Sarasota County survey (21 percent of the surveys mailed) may have provided significantly different responses to questions than would have been provided by boaters who did not respond (79 percent). Based on the summary analysis, it is hypothesized that individuals who completed and returned surveys represent the more motivated and active users of Sarasota County s coastal waterways. As such, the number of boating trips per month reported by respondents is likely more than the number taken by the average boater. In spite of this potential bias, an argument can be made that survey results that reflect active boaters who frequently use the resource make for better planning. Nevertheless, an increase in the response rate, by reaching hard to get respondents, would reduce the potential for non-response bias. Therefore, it is recommended that non-response bias be evaluated by implementing a follow-up telephone survey that targets boaters (within each user group) who did not respond to the initial mail survey. Information obtained from a telephone survey of non-responders can be used to determine if the number, timing, frequency, and duration of trips reported by respondents reflect average boater trip profiles. In addition to an examination of non-response bias, a comparative spatial analysis is recommended to examine information collected from the contemporaneous aerial and mail surveys implemented for Sarasota County as part of this recreational boating characterization study. The analysis would evaluate the extent to which spatial information obtained from the two survey methods are complementary and the degree to which they capture similar (or different) boating patterns. Rasters (i.e., grids or cells) can be used to map and evaluate (1) spatial distributions and patterns of stationary and moving vessels captured by aerial surveys, and (2) destinations and routes identified by mail survey respondents. Grid cells with statistically similar aerial and mail survey information profiles can be considered to be congruent and those with statistically different use profiles can be considered to be incongruent. Boating patterns can be mapped and compared at different geographic scales of resolution to highlight the degree to which spatial information obtained from the two methods are conformant or non-conformant. A comparative spatial analysis can also be used to validate mail and aerial survey information, and offers a means to determine whether or not the information provided by mail survey respondents is representative (spatially) of the average or typical boater in the region. As such, a comparative spatial analysis of aerial and mail survey information would be an important follow-up test for evaluating the possible existence of a spatial bias related to survey non-response. Boat Ramp Service Area Analysis The spatial and temporal trip-departure data collected in this study provides valuable information on boater use-patterns (e.g., where boaters typically begin their voyages and their onwater destinations). This information may be of importance to county resource managers, as a means for estimating demand and generating waterway use profiles by boating group and selected facilities. For example, market areas for individual boat ramps can be identified and mapped through a GIS primary service area optimization method developed for Tampa Bay boat ramps 70
80 (Sidman et al., 2005). The marine facility service area analysis would use trip-origin specific survey data to determine the geographic extent of the influence (distance thresholds) of a particular facility to attract boaters. This data could be used to project facility demand and the location of potential users. A complementary analysis would evaluate destinations reported by survey respondents to estimate resource pressure indices for specific ramps, marinas, and possibly residential canal neighborhoods. This analysis could quantify the pressure placed on existing waterways, facilities, and routes from boaters originating from various types of access points (individually or by category) and the extent to which overall demand exerts pressure on existing bay resources. Geographic overlap in attraction and/or resource pressure placed on existing routes, destinations, facilities, and waterways, could be useful in determining whether use thresholds have been exceeded. In addition, this information could be useful in helping to identify appropriate and inappropriate locations for expanding existing or siting future boat launching facilities (e.g., marinas and public boat ramps). Analysis of Seasonal Boating Trends Survey findings suggest that Sarasota County waterways experience a year-round boating season, with a peak-use period between April and July and an off-peak period from December through February. The survey implemented for this study was timed (in the late spring) to capture peak-use boating trends. As such, the majority of trips reported by survey respondents were taken during the spring and summer months. Accordingly, the information obtained from this study may not necessarily represent the trip profiles of seasonal users (i.e., snowbirds) or corresponding use patterns during the fall and winter months. An analysis of fall and winter boating trends may be undertaken to augment spatial trip information collected during the spring and summer months. An abridged version of the survey instrument and the accompanying correspondence could be mailed to marina wet slip, marina dry storage, ramp, and private dock users who completed the initial survey and indicated that they would participate in a follow-up mail survey. This could be supplemented with additional surveys of boat ramp users associated with fall and winter periods. This strategy assumes that the vessel populations launching from marina wet slips, dry storage facilities, and private docks would remain relatively consistent. An added benefit of continuing the ramp surveys would be to acquire year-round ramp patron information that would support a boat ramp service area analysis described above. A spatial analysis would map and evaluate waterway use patterns for each season captured by the supplemental mail surveys. A raster (e.g., grid or cell-based) analysis can be used to determine the relative proportions and distribution of destinations, and routes over the seasons. Grid cell weighting can account for seasonal differences between sample sizes and an analysis of proportions can be used to compare relative use intensities. Those cells with statistically similar weighted use proportions would be considered to have similar seasonal profiles; those with statistically different weighted use proportions would be viewed as having different seasonal profiles. In addition, the timing, frequency, and duration, of seasonal trips, and the types of activities associated with those trips can be statistically evaluated and mapped. 71
81 Literature Cited Antonini, G., and Box, P A Regional Waterway Systems Management Strategy for Southwest Florida. Sea Grant Extension Bulletin 33. Florida Sea Grant. University of Florida, Gainesville, Florida. Antonini, G., Fann, D., and Roat, P A Historical Geography of Southwest Florida Waterways Volume One: Anna Maria Sound to Lemon Bay. Florida Sea Grant Publication SGEB-47. University of Florida, Gainesville, Florida. Antonini, G., Swett, R., Schulte, S., and Fann, D Regional Waterway Management System for South Sarasota County. Technical Document 1. Florida Sea Grant. University of Florida, Gainesville, Florida. Antonini, G., West, N., Sidman, C., Swett, R A Recreational Boater-Based Method for Redesigning the NOS Small Craft Chart. Florida Sea Grant Publication TP-107. University of Florida, Gainesville, Florida. Antonini, G., Zobler, L., Sheftall, W., Stevely, J., Sidman, C Feasibility of a Non- Regulatory Approach to Bay Water Anchorage Management for Sustainable Recreational Use. Florida Sea Grant Publication TP-74. University of Florida, Gainesville, Florida. Bureau of Economic and Business Research Florida Statistical Abstracts. University of Florida, Gainesville, Florida. Falk, J., Graefe, A., Drogin, E., Confer, J., Chandler, L Recreational Boating on Delaware s Inland Bays: Implications for Social and Environmental Carrying Capacity. Delaware Sea Grant Publication DEL-SG University of Delaware, Newark, Delaware. Fillion, F.L., Estimating Bias Due to Nonresponse in Mail Surveys. Public Opinion Quarterly, v39, Gorzelany, J.F, Evaluation of Boat Traffic Patterns and Boater Compliance in Lee County, Florida. Final report submitted to the Florida Dept. of Environmental Protection. Gorzelany, J.F, Quantitative Analysis of Recreational Vessel Speeds Prior to Establishment of Speed-restricted Zones in Lee County, Florida. Final report submitted to the Florida Fish and Wildlife Conservation Commission, Office of Environmental Services, Protected Species Management. Gorzelany, J.F, Evaluation of Vessel Traffic and Boater Compliance in Association with New Boat Speed Regulations in the Lower Caloosahatchee River. Final report submitted to the Florida Fish and Wildlife Conservation Commission, Office of Environmental Services, Protected Species Management. 72
82 Green, K. E Reluctant Respondents: Differences Between Early, Late, and Nonresponders to a Mail Survey. Journal of Experimental Education, v 59, Leeworthy, V., and Wiley, P National Survey on Marine Recreation and the Environment 2000: Current Participation Patterns in Marine Recreation. A Report to the U.S. Department of Congress National Oceanographic Atmospheric Administration. Silver Springs, Maryland. Letson, D Economic Value and Environmental Quality: Florida s Coastal Resources, in Marine Recreational Fishing in Florida Coastal Environmental Resources: A Guide to Economic Valuation and Impact Analysis. Letson D. & Milon, J.W., eds. Florida Sea Grant Report, SGR 124. University of Florida, Gainesville, Florida. Lynn, P., Clarke, P., Martin, J., and Sturgis, P., The effects of repeated call-backs and reallocation on non-response bias in, Survey Non-Response. eds. Robert M. Groves, R. Dillman, D., Eltinge, J., Roderick J and Little, A. New York. Wiley. National Marine Manufacturers Association U.S. Recreational Boat Registration Statistics. Available on-line at Sidman, C., Fik, T., and Sargent, B A Recreational Boating Characterization for Tampa and Sarasota Bays. Florida Sea Grant Publication TP-130. University of Florida, Gainesville, Florida. Sidman, C., Fik, T., Swett, R., Sargent, B., and Fann, S Estimating Land and Water-Side Service Areas and Use Potential for Boat Ramps: A Case Study of Tampa and Sarasota Bays. Florida Sea Grant Publication TP-142. University of Florida, Gainesville, Florida. Sidman, C., and Flamm, R A Survey of Methods for Characterizing Recreational Boating in Charlotte Harbor, Florida. Florida Sea Grant Publication TP-109. University of Florida, Gainesville, Florida. Sidman, C., Swett, R., Fik, T., Fann, S., Fann, D., and Sargent, B A Recreational Boating Characterization for the Greater Charlotte Harbor. Florida Sea Grant Publication TP-150. University of Florida, Gainesville, Florida. Swett, R., Fann, S., and DeLaney, J An Assessment of Florida Boaters and their Awareness of the Clean Vessel Act and Clean Marina Program. Florida Sea Grant Publication TP-151. University of Florida, Gainesville, Florida. West, N Recreational Boating and Energy-Related Shipping on Narragansett Bay: A Study of Environmental Attitude and Behavior. Report submitted to the Rhode Island CEIP, Governor s Energy Office. Providence, Rhode Island. 73
83 Appendices Appendix A. Questionnaire and Correspondence Cover Letter Recreational Boating In Sarasota County A survey conducted by the University of Florida Sea Grant Program Dear Boat Owner / Operator, We are asking you to participate in a boating study being carried out in southwest Florida by the University of Florida Sea Grant Program. The study seeks to characterize boating in the area. Your responses will be very important to our efforts to help Sarasota County prioritize and improve waterway access and maintenance, and to develop map-based boating products that enhance your recreational boating experience. There are no direct risks to you for participating in this study and we are enclosing a copy of A Sarasota County Boater s Guide to thank you for completing and returning this questionnaire. The questionnaire should take about 20 minutes to complete. We would appreciate it if you could complete and return it as soon as possible. We have provided a self-addressed, postage-paid return envelope. Please be assured that the information you provide will be held in the strictest confidence. Answers will NOT be traced to individuals and your name or address will NOT be made available to anyone else. Your participation is completely voluntary and you may withdraw your participation at any time without penalty. The questionnaire control number is used only to track survey returns so that we don t inconvenience you with reminder cards. Only a small sample of boaters in Sarasota County have received this survey, so your input is very important. We recently completed a similar boating survey in the Tampa Bay area and it was a great success! For questions about your rights as a research participant, you may contact the University of Florida Institutional Review Board at PO Box , Gainesville, FL or If you have any questions about this survey or our products for boaters, you may contact Charles Sidman at the University of Florida (352) , or by at boatsurvey@ifas.ufl.edu We are most grateful for your assistance in this important project. 74

84 Questionnaire Map 75
This publication was supported by the National Sea Grant College Program of the U.S. Department of Commerce s National Oceanic and Atmospheric
 This publication was supported by the National Sea Grant College Program of the U.S. Department of Commerce s National Oceanic and Atmospheric Administration (NOAA), Grant No. NA16RG-2195; the Florida
A publication of the University of Florida Sea Grant Program (project numbers and ). The project was funded by Bay County through
. The project was funded by Bay County through") A publication of the University of Florida Sea Grant Program (project numbers 00067209 and 00069999). The project was funded by Bay County through the University of Florida Bay County Extension Program;
A publication of the University of Florida Sea Grant Program (project numbers 00067209 and 00069999). The project was funded by Bay County through the University of Florida Bay County Extension Program;
RESEARCH Massachusetts Recreational Boater Survey. Project Summary
 Coastal and Marine Spatial Planning RESEARCH Project Summary 2010 Massachusetts Recreational Boater Survey The 2010 Massachusetts Recreational Boater Survey gathered spatial and economic data relating
SOUTH CAROLINA ELECTRIC & GAS COMPANY COLUMBIA, SOUTH CAROLINA
 SOUTH CAROLINA ELECTRIC & GAS COMPANY COLUMBIA, SOUTH CAROLINA SALUDA HYDROELECTRIC PROJECT (FERC NO. 516) BOATING DENSITY STUDY PLAN FINAL SEPTEMBER 2006 Prepared by: SOUTH CAROLINA ELECTRIC & GAS COMPANY
MEMORANDUM. Existing Operations. City of Clearwater. Michael Herrman. Date: January 26, Seminole Boat Launch Overview. M&N Job No.
 1509 W. Swann Avenue, Suite 225 Tampa, FL 33606 (813) 258-8818 Fax (813) 258-8525 www.moffattnichol.com MEMORANDUM To: From: City of Clearwater Michael Herrman Date: Subject: Seminole Boat Launch Overview
Coastal and marine recreation in New England is ingrained in the region s economic and
 RECREATION Coastal and marine recreation in New England is ingrained in the region s economic and social fabric. Recreation on the ocean and coast includes many of New Englanders most time-honored and
ADOT Statewide Bicycle and Pedestrian Program Summary of Phase IV Activities APPENDIX B PEDESTRIAN DEMAND INDEX
 ADOT Statewide Bicycle and Pedestrian Program Summary of Activities APPENDIX B PEDESTRIAN DEMAND INDEX May 24, 2009 Pedestrian Demand Index for State Highway Facilities Revised: May 29, 2007 Introduction
Marine Recreational and Commercial Industries and Activities in Lee and Charlotte Counties: Economic Consequences and Impacts
 Marine Recreational and Commercial Industries and Activities in Lee and Charlotte Counties: Economic Consequences and Impacts Betty Staugler Florida Sea Grant Extension Marine Agent & Chuck Adams Florida
RESIDENTS AND USERS SPEAK
 Planning for Waterway Access in Taylor County, Florida: RESIDENTS AND USERS SPEAK TP - 177 Science Serving Florida s Coast Florida Sea Grant College Program PO Box 110409 University of Florida Gainseville,
Susitna-Watana Hydroelectric Project Document ARLIS Uniform Cover Page
 Alaska Resources Library & Information Services Document ARLIS Uniform Cover Page Title: Wildlife harvest analysis study, Study plan Section 10.20 : Final study plan SuWa 200 Author(s) Personal: Author(s)
Charter Boat Fishing in Lake Michigan: 2017 Illinois Reported Harvest
 Illinois Department of Natural Resources Division of Fisheries Charter Boat Fishing in Lake Michigan: 2017 Illinois Reported Harvest Steven R. Robillard Illinois Department of Natural Resources Lake Michigan
Nancy Montes Robert Swett Charles Sidman Tim Fik
 Nancy Montes Robert Swett Charles Sidman Tim Fik A publication of the University of Florida Sea Grant Program. The project was funded by the Southeast Regional Office NOAA Fisheries Services pursuant to
Final Report, October 19, Socioeconomic characteristics of reef users
 Socioeconomic Study of Reefs in Southeast Florida - Executive Summary By Hazen and Sawyer in association with Florida State University and National Oceanic and Atmospheric Administration, October 19, 2001
The Mid-Atlantic Recreational Boater Survey
 The Mid-Atlantic Recreational Boater Survey April 2016 Mid-Atlantic Recreational Boater Survey 1 CONTENTS 30TABOUT THE SPONSORS30T... 2 30TEXECUTIVE SUMMARY30T... 3 30TSURVEY OVERVIEW30T... 5 30TECONOMIC
1999 On-Board Sacramento Regional Transit District Survey
 SACOG-00-009 1999 On-Board Sacramento Regional Transit District Survey June 2000 Sacramento Area Council of Governments 1999 On-Board Sacramento Regional Transit District Survey June 2000 Table of Contents
MARKET STUDY FOR BOATING ON THE MINNESOTA WATERS OF LAKE SUPERIOR
 MARKET STUDY FOR BOATING ON THE MINNESOTA WATERS OF LAKE SUPERIOR MARKET STUDY FOR BOATING ON THE MINNESOTA WATERS OF LAKE SUPERIOR CANADA Minnesota Apostle Islands Isle Royale Lake Superior Michigan Wisconsin
Redondo Beach Boat Launch Ramp Facility
 Redondo Beach Boat Launch Ramp Facility Feasibility Report for the California Department of Boating and Waterways 2015 Grant Cycle For the City of Redondo Beach Submitted by March 13, 2014 Table of Contents
CITY OF ALPHARETTA DOWNTOWN MASTER PLAN TRAFFIC EVALUATION
 CITY OF ALPHARETTA DOWNTOWN MASTER PLAN TRAFFIC EVALUATION June 2015 CITY OF ALPHARETTA DOWNTOWN MASTER PLAN TRAFFIC EVALUATION Introduction The Alpharetta Downtown Master Plan was developed in the fall
City of Elizabeth City Neighborhood Traffic Calming Policy and Guidelines
 City of Elizabeth City Neighborhood Traffic Calming Policy and Guidelines I. Purpose: The City of Elizabeth City is committed to ensure the overall safety and livability of residential neighborhoods. One
Inlet Specific and Seasonal Variation in Vessel Use Patterns: The case of the Northeast Florida Region
 Inlet Specific and Seasonal Variation in Vessel Use Patterns: The case of the Northeast Florida Region Nancy Montes Robert Swett University of Florida Automatic Identification System (AIS) Ships 300 or
METHODOLOGY. Signalized Intersection Average Control Delay (sec/veh)
") Chapter 5 Traffic Analysis 5.1 SUMMARY US /West 6 th Street assumes a unique role in the Lawrence Douglas County transportation system. This principal arterial street currently conveys commuter traffic
Chapter 5 Traffic Analysis 5.1 SUMMARY US /West 6 th Street assumes a unique role in the Lawrence Douglas County transportation system. This principal arterial street currently conveys commuter traffic
Cabrillo College Transportation Study
 Cabrillo College Transportation Study Planning and Research Office Terrence Willett, Research Analyst, Principle Author Jing Luan, Director of Planning and Research Judy Cassada, Research Specialist Shirley
For-hire Data Collection. Gulf of Mexico Fishery Management Council Red Snapper For-hire Advisory Panel December 2-3, 2014 Tampa, FL
 For-hire Data Collection Gulf of Mexico Fishery Management Council Red Snapper For-hire Advisory Panel December 2-3, 2014 Tampa, FL Southeast Region Recreational Surveys MRIP For-hire Survey APAIS/CHTS
Charter Boat Fishing in Lake Michigan: 2015 Illinois Reported Harvest
 Illinois Department of Natural Resources Division of Fisheries Charter Boat Fishing in Lake Michigan: 2015 Illinois Reported Harvest Steven R. Robillard Illinois Department of Natural Resources Lake Michigan
Overview. Existing Conditions. Corridor Description. Assessment
 Overview A study of the 23 rd Street corridor was undertaken to document the existing conditions, analyze traffic operations, and recommend remedies for deficient situations Although 23 rd Street is frequently
Guidelines for Providing Access to Public Transportation Stations APPENDIX C TRANSIT STATION ACCESS PLANNING TOOL INSTRUCTIONS
 APPENDIX C TRANSIT STATION ACCESS PLANNING TOOL INSTRUCTIONS Transit Station Access Planning Tool Instructions Page C-1 Revised Final Report September 2011 TRANSIT STATION ACCESS PLANNING TOOL INSTRUCTIONS
Regional Waterway Management System For North Manatee County
 July, 999/Revised Jan Regional Waterway Management System For North Manatee County TD- Robert A. Swett Gustavo A. Antonini Sharon Schulte Table of Contents Table of Contents... ii Tables... iv Figures...
The Route 29 Corridor Study was initiated at the request of Virginia s Commonwealth
 CHAPTER 2: Study Background and approach The Route 29 Corridor Study was initiated at the request of Virginia s Commonwealth Transportation Board in response to requests from members of the General Assembly
EXPLORING MOTIVATION AND TOURIST TYPOLOGY: THE CASE OF KOREAN GOLF TOURISTS TRAVELLING IN THE ASIA PACIFIC. Jae Hak Kim
 EXPLORING MOTIVATION AND TOURIST TYPOLOGY: THE CASE OF KOREAN GOLF TOURISTS TRAVELLING IN THE ASIA PACIFIC Jae Hak Kim Thesis submitted for the degree of Doctor of Philosophy at the University of Canberra
Tennessee Black Bear Public Opinion Survey
 Tennessee Black Bear Public Opinion Survey Executive Summary 2012 Survey TWRA Technical Report 12 02 This electronic publication was developed by the Tennessee Wildlife Resources Agency s Division of Wildlife
Authors: Luiz Barbieri and Martha Bademan
 This is a review and discussion of a proposal to develop and implement a Gulf Offshore Recreational Fishing Permit in support of more accurate, precise, and timely catch and effort estimates for offshore
MONROE COUNTY NEW YORK
 MONROE COUNTY NEW YORK Intersection Accident Database Enhancement Project (UPWP 4380) FINAL January 2008 Prepared By: Prepared For: Bergmann Associates 200 First Federal Plaza 28 East Main Street Rochester,
METROPOLITAN TRANSPORTATION PLAN OUTREACH: INTERACTIVE MAP SUMMARY REPORT- 10/03/14
 METROPOLITAN TRANSPORTATION PLAN OUTREACH: INTERACTIVE MAP SUMMARY REPORT- 10/03/14 INTRODUCTION This document summarizes the results of the online interactive mapping exercise implemented by MIG for the
Fishery Dependent Data Collection Office of Science and Technology
 Fishery Dependent Data Collection Office of Science and Technology MREP Southeast St. Petersburg, Florida April 22, 2014 Gordon Colvin Summary Overview of Fishery-Dependent Sampling Methods: four basic
A Characterization of Recreational Boating Activity And Boater Compliance with Posted Speed Zones in Palm Beach County
 A Characterization of Recreational Boating Activity And Boater Compliance with Posted Speed Zones in Palm Beach County Final Report Submitted To: Paul Davis Palm Beach County Department of Environmental
The 2001 Economic Benefits of Hunting, Fishing and Wildlife Watching in MISSOURI. Prepared by:
 The 2001 Economic Benefits of Hunting, Fishing and Wildlife Watching in MISSOURI Prepared by: Southwick Associates, Inc. PO Box 6435 Fernandina Beach, FL 32035 Ph (904) 277-9765 Fax (904) 261-1145 Email:
Modal Shift in the Boulder Valley 1990 to 2009
 Modal Shift in the Boulder Valley 1990 to 2009 May 2010 Prepared for the City of Boulder by National Research Center, Inc. 3005 30th Street Boulder, CO 80301 (303) 444-7863 www.n-r-c.com Table of Contents
How Policy Drives Mode Choice in Children s Transportation to School
 How Policy Drives Mode Choice in Children s Transportation to School Physical Activity through Active Transportation Ruth L. Steiner 2011 Technical Conference and Exhibit Lake Buena Vista, FL April 3-6,
Socioeconomic Profile and Spatial Analysis of Fisheries in the three central California National Marine Sanctuaries
 Socioeconomic Profile and Spatial Analysis of Fisheries in the three central California National Marine Sanctuaries Overview and Assessment of CDFG Fisheries Data for use in the Joint Management Plan Review
Evaluating the Influence of R3 Treatments on Fishing License Sales in Pennsylvania
 Evaluating the Influence of R3 Treatments on Fishing License Sales in Pennsylvania Prepared for the: Pennsylvania Fish and Boat Commission Produced by: PO Box 6435 Fernandina Beach, FL 32035 Tel (904)
Compression Study: City, State. City Convention & Visitors Bureau. Prepared for
 : City, State Prepared for City Convention & Visitors Bureau Table of Contents City Convention & Visitors Bureau... 1 Executive Summary... 3 Introduction... 4 Approach and Methodology... 4 General Characteristics
Survey of Recreational Boater Safety in Ohio During 1999
 Survey of Recreational Boater Safety in Ohio During 1999 Leroy J. Hushak The Ohio State University Ohio Sea Grant College Program Technical Summary Series Publication OSHU-TS-030 2000 Ohio Sea Grant College
JUNEAU SECOND CHANNEL CROSSING WATERWAY USER SURVEY RESULTS
 JUNEAU SECOND CHANNEL CROSSING WATERWAY USER SURVEY RESULTS PREPARED FOR: HDR Alaska, Inc. PREPARED BY: Juneau Anchorage December 2003 TABLE OF CONTENTS Executive Summary...1 Introduction and Methodology...2
Issues facing this region include the status of the Sluice Creek tide gates, various tidal wetlands, and locations of public access:
 5.6 Guilford Point to Madison Town Line Existing Resources This region extends from Guilford Point to the Madison town line. Named places include Grass Island and the East River. Residential, commercial,
Downtown Tampa Parking User Survey
 Downtown Tampa Parking User Survey 2017 Introduction This Downtown Tampa Parking User Survey was commissioned by the Tampa Downtown Partnership and carried out by Plan Hillsborough. The survey was overseen
HARBOR INFRASTRUCTURE INVENTORIES Kenosha Harbor, Wisconsin
 HARBOR INFRASTRUCTURE INVENTORIES Kenosha Harbor, Wisconsin Harbor Location: Kenosha Harbor is on the west shore of Lake Michigan about 54 miles north of Chicago, Illinois. Authority: River & Harbor Acts
Appendix 13 Rowing and sculling in the sea
 Appendix 13 Rowing and sculling in the sea Steve Thompson SMRTS2015 Final Report 251 March 2016 Appendix 13 Rowing and sculling in the sea Table A13.1: Summary of sample confidence levels Responses Spatial
Cycle journeys on the Anderston-Argyle Street footbridge: a descriptive analysis. Karen McPherson. Glasgow Centre for Population Health
 Cycle journeys on the Anderston-Argyle Street footbridge: a descriptive analysis Karen McPherson Glasgow Centre for Population Health March 2017 Key points: There were 116,334 cycle journeys made using
The 2006 Economic Benefits of Hunting, Fishing and Wildlife Watching in NORTH CAROLINA. Prepared by:
 The 2006 Economic Benefits of Hunting, Fishing and Wildlife Watching in NORTH CAROLINA Prepared by: Southwick Associates, Inc. P.O. Box 6435 Fernandina Beach, FL 32035 Ph (904) 277-9765 Fax (904) 261-1145
Operational Ranking of Intersections: A Novel Prioritization Methodology
 Operational Ranking of Intersections: A Novel Prioritization Methodology Reza Omrani, Ph.D. Transportation Engineer CIMA+ 3027 Harvester Road, Suite 400 Burlington, ON L7N 3G7 Reza.Omrani@cima.ca Pedram
2010 Pedestrian and Bicyclist Special Districts Study Update
 2010 Pedestrian and Bicyclist Special Districts Study Update Pedestrian and Bicyclist Special Districts Program Overview H-GAC s Special Districts Program aims to provide strategic investments in pedestrian
TRAFFIC STUDY GUIDELINES Clarksville Street Department
 TRAFFIC STUDY GUIDELINES Clarksville Street Department 9/1/2009 Introduction Traffic studies are used to help the city determine potential impacts to the operation of the surrounding roadway network. Two
Aerial Surveys Of Recreational Boating Activity In Collier County
 Aerial Surveys Of Recreational Boating Activity In Collier County Final Report Submitted To: Collier County Environmental Services Department 2800 North Horseshoe Drive Naples, FL 34104 Submitted By: Jay
Orange County MPA Watch A n n u a l R e p o r t
 Orange County MPA Watch 2 0 1 4 A n n u a l R e p o r t WHAT IS AN MPA? Marine Protected Areas (MPAs) are discrete geographic marine or estuarine areas designed to protect or conserve marine life and habitat.
Lake Lure and the Town of Lake
 Lake Safety Boating Safety at Lake Lure Barbara Wiggins, Ken Wagner and Clint Calhoun Lake Lure Lake Management and Boating Regulations to Protect Community Enjoyment of the Lake Safety Issues at Lake
CITY OF COCOA BEACH 2025 COMPREHENSIVE PLAN. Section VIII Mobility Element Goals, Objectives, and Policies
 CITY OF COCOA BEACH 2025 COMPREHENSIVE PLAN Section VIII Mobility Element Goals, Objectives, and Policies Adopted August 6, 2015 by Ordinance No. 1591 VIII MOBILITY ELEMENT Table of Contents Page Number
Safety Assessment of Installing Traffic Signals at High-Speed Expressway Intersections
 Safety Assessment of Installing Traffic Signals at High-Speed Expressway Intersections Todd Knox Center for Transportation Research and Education Iowa State University 2901 South Loop Drive, Suite 3100
Chapter 14: Conducting Roving and Access Site Angler Surveys
 Manual of Fisheries Survey Methods II: with periodic updates : Conducting Roving and Access Site Angler Surveys Roger N. Lockwood Suggested citation: Lockwood, Roger N. 2000. Conducting roving and access
Appendix 21 Sea angling from the shore
 Appendix 21 Sea angling from the shore LUC SMRTS2015 Final Report 342 March 2016 Appendix 21 Sea angling from the shore Table A21.1: Summary of sample confidence levels Responses Spatial data Questionnaire
Specialized Survey Methods for Recreational Reef Fish Fisheries in Florida
 Specialized Survey Methods for Recreational Reef Fish Fisheries in Florida Beverly Sauls, Research Scientist Fish and Wildlife Research Institute Marine Fisheries Research Saint Petersburg, FL Reef Fish
FINAL DESIGN TRAFFIC TECHNICAL MEMORANDUM
 FINAL DESIGN TRAFFIC TECHNICAL MEMORANDUM July 2014 FINAL (SR 43) Project Development and Environment Study From State Road 60 (Adamo Drive) to I-4 (SR 400) Hillsborough County, Florida Work Program Item
Appendix 9 SCUBA diving in the sea
 Appendix 9 SCUBA diving in the sea Firth of Clyde Forum SMRTS2015 Final Report 195 March 2016 Appendix 9 SCUBA diving in the sea Table A9.1: Summary of sample confidence levels Responses Spatial data Questionnaire
Appendix 22 Sea angling from a private or chartered boat
 Appendix 22 Sea angling from a private or chartered boat LUC SMRTS2015 Final Report 359 March 2016 Appendix 22 Sea angling from a private or chartered boat Table A22.1: Summary of sample confidence levels
3 ROADWAYS 3.1 CMS ROADWAY NETWORK 3.2 TRAVEL-TIME-BASED PERFORMANCE MEASURES Roadway Travel Time Measures
 ROADWAYS Approximately 6 million trips are made in the Boston metropolitan region every day. The vast majority of these trips (80 to percent, depending on trip type) involve the use of the roadway network
Chapter 4 Traffic Analysis
 Chapter 4 Traffic Analysis PURPOSE The traffic analysis component of the K-68 Corridor Management Plan incorporates information on the existing transportation network, such as traffic volumes and intersection
The 2006 Economic Benefits of Hunting, Fishing and Wildlife Watching in TEXAS. Prepared by:
 The 2006 Economic Benefits of Hunting, Fishing and Wildlife Watching in TEXAS Prepared by: Southwick Associates, Inc. P.O. Box 6435 Fernandina Beach, FL 32035 Ph (904) 277-9765 Fax (904) 261-1145 Email:
EXECUTIVE SUMMARY... vii 1 STUDY OVERVIEW Study Scope Study Area Study Objectives
 Contents EXECUTIVE SUMMARY... vii 1 STUDY OVERVIEW... 1-1 1.1 Study Scope... 1-1 1.2 Study Area... 1-1 1.3 Study Objectives... 1-3 2 EXISTING CONDITIONS... 2-1 2.1 Existing Freeway Conditions... 2-4 2.1.1
CHAPTER 10 TOTAL RECREATIONAL FISHING DAMAGES AND CONCLUSIONS
 CHAPTER 10 TOTAL RECREATIONAL FISHING DAMAGES AND CONCLUSIONS 10.1 INTRODUCTION This chapter provides the computation of the total value of recreational fishing service flow losses (damages) through time
CLEARWATER COMPREHENSIVE BOATING PLAN PUBLIC OUTREACH MEETING 2. December 16, 2015
 CLEARWATER COMPREHENSIVE BOATING PLAN PUBLIC OUTREACH MEETING 2 December 16, 2015 Introduction Project Team City of Clearwater Bill Morris Director of Marine and Aviation Kyle Brotherton Planning and Development
April 7, Prepared for: The Caribbean Disaster Emergency Response Agency Prepared by: CEAC Solutions Co. Ltd.
 April 7, 2006 Prepared for: The Caribbean Disaster Emergency Response Agency Prepared by: Introduction CEAC Solutions Co. Ltd was commissioned in May 2005 to prepare coastal beach erosion hazard maps for
Waterfront User Needs Assessment & Detailed Design RESPONSE TO COMMENTS
 Waterfront User Needs Assessment & Detailed Design RESPONSE TO COMMENTS Town of Cobourg Presentation to Council Monday July 3, 2018 4 PM 1 Response topics Opportunity to clarify and correct misinterpretations
PEDESTRIAN ACTION PLAN
 ATTACHMENT 2 CITY OF SANTA MONICA PEDESTRIAN ACTION PLAN CITY OF SANTA MONICA PEDESTRIAN ACTION PLAN This page intentionally left blank EXECUTIVE SUMMARY CHAPTER 1 EXECUTIVE SUMMARY Setting the Stage
Pocatello Regional Transit Master Transit Plan Draft Recommendations
 Pocatello Regional Transit Master Transit Plan Draft Recommendations Presentation Outline 1. 2. 3. 4. What is the Master Transit Plan? An overview of the study Where Are We Today? Key take-aways from existing
Exhibit 1 PLANNING COMMISSION AGENDA ITEM
 Exhibit 1 PLANNING COMMISSION AGENDA ITEM Project Name: Grand Junction Circulation Plan Grand Junction Complete Streets Policy Applicant: City of Grand Junction Representative: David Thornton Address:
DOT HS September Crash Factors in Intersection-Related Crashes: An On-Scene Perspective
 DOT HS 811 366 September 2010 Crash Factors in Intersection-Related Crashes: An On-Scene Perspective DISCLAIMER This publication is distributed by the U.S. Department of Transportation, National Highway
LAKE ONTARIO FISHING AND FISH CONSUMPTION
 LAKE ONTARIO FISHING AND FISH CONSUMPTION by Nancy A. Connelly, Research Specialist, Cornell University Department of Natural Resources and Diane Kuehn, Extension Specialist, New York Sea Grant INTRODUCTION
Recreational Saltwater Fishing Industry Trends and Economic Impact January 2007
 Document was created exclusively for RISAA and the information contained herein is not to be disclosed without their expressed permission Recreational Saltwater Fishing Industry Trends and Economic Impact
Traffic Impact Study. Westlake Elementary School Westlake, Ohio. TMS Engineers, Inc. June 5, 2017
 TMS Engineers, Inc. Traffic Impact Study Westlake Elementary School Westlake, Ohio June 5, 2017 Prepared for: Westlake City Schools - Board of Education 27200 Hilliard Boulevard Westlake, OH 44145 TRAFFIC
An Application of Signal Detection Theory for Understanding Driver Behavior at Highway-Rail Grade Crossings
 An Application of Signal Detection Theory for Understanding Driver Behavior at Highway-Rail Grade Crossings Michelle Yeh and Jordan Multer United States Department of Transportation Volpe National Transportation
Orange County MPA Watch A n n u a l R e p o r t
 Orange County MPA Watch 2 0 1 5 A n n u a l R e p o r t WHAT IS AN MPA? Marine Protected Areas (MPAs) are discrete geographic marine or estuarine areas designed to protect or conserve marine life and habitat.
PHASE 1 WIND STUDIES REPORT
 PHASE 1 WIND STUDIES REPORT ENVIRONMENTAL STUDIES AND PRELIMINARY DESIGN FOR A SUICIDE DETERRENT SYSTEM Contract 2006-B-17 24 MAY 2007 Golden Gate Bridge Highway and Transportation District Introduction
SANTA CLARA COUNTYWIDE BICYCLE PLAN August 2008
 SANTA CLARA COUNTYWIDE BICYCLE PLAN August 2008 To assist VTA and Member Agencies in the planning, development and programming of bicycle improvements in Santa Clara County. Vision Statement To establish,
WYDOT Customer Satisfaction Survey 2016
 February 16 th, 2017 WYDOT Customer Satisfaction Survey 2016 Presenting results of the WYDOT Customer Satisfaction Survey, 2016 Presented By Brian Harnisch Senior Research Scientist Wyoming Survey & Analysis
HARBOR INFRASTRUCTURE INVENTORIES Marquette Harbor, Michigan
 HARBOR INFRASTRUCTURE INVENTORIES Marquette Harbor, Michigan Harbor Location: Marquette Harbor is located in Marquette Bay on the south shore of Lake Superior, 160 miles west of Sault Ste. Marie, MI and
Recreational Fishing License Sales in Florida:
 Recreational Fishing License Sales in Florida: 1990-2000 1 Kristina Stephan and Chuck Adams 2 Introduction The recreational fishing industry is an important natural resource-based industry in Florida.
Calculation of Trail Usage from Counter Data
 1. Introduction 1 Calculation of Trail Usage from Counter Data 1/17/17 Stephen Martin, Ph.D. Automatic counters are used on trails to measure how many people are using the trail. A fundamental question
Chapter 5 FUNCTIONAL CLASSIFICATION
 Chapter 5 FUNCTIONAL CLASSIFICATION Functional classification is a system by which streets and roadways may be distinguished by types according to their function within the entire transportation network.
Big Blue Adventure Event Analysis UTC Tourism Center October 2016
 A report summarizing Big Blue Adventure events economic impact on the Lake Tahoe region as well as participants assessments of their event experience Big Blue Adventure Event Analysis UTC Tourism Center
o n - m o t o r i z e d transportation is an overlooked element that can greatly enhance the overall quality of life for the community s residents.
 N o n - m o t o r i z e d transportation is an overlooked element that can greatly enhance the overall quality of life for the community s residents. 84 Transportation CHAPTER 11 INTRODUCTION Transportation
Determining coral reef impacts associated with boat anchoring and user activity
 Determining coral reef impacts associated with boat anchoring and user activity Protect Our Reefs Grant Interim Report October 1, 2008 March 31, 2009 Donald C. Behringer 1, Thomas K. Frazer 1, Robert A.
A SURVEY OF 1997 COLORADO ANGLERS AND THEIR WILLINGNESS TO PAY INCREASED LICENSE FEES
 Executive Summary of research titled A SURVEY OF 1997 COLORADO ANGLERS AND THEIR WILLINGNESS TO PAY INCREASED LICENSE FEES Conducted by USDA Forest Service Rocky Mountain Research Station Fort Collins,
ADA Transition Plan. City of Gainesville FY19-FY28. Date: November 5, Prepared by: City Of Gainesville Department of Mobility
 ADA Transition Plan FY19-FY28 Date: November 5, 2018 Prepared by: City Of Gainesville Department of Mobility 1.0 INTRODUCTION 1.1 BACKGROUND The federal statute known as the Americans with Disabilities
Resident Outdoor Recreation for Fremont County, WY July 1999
 UNIVERSITY OF WYOMING 'P.O. Box 3354 Cooperative Extension Service Laramie, WY 82071-3354 College of Agriculture Phone: 307-766-2386 Department of Agricultural and Applied Economics Fax: 307-766-5544 Resident
Tulsa Metropolitan Area LONG RANGE TRANSPORTATION PLAN
 Tulsa Metropolitan Area LONG RANGE TRANSPORTATION PLAN Indian Nations Council of Governments August 2005 CONTACTING INCOG In developing the Destination 2030 Long Range Transportation Plan, INCOG s Transportation
Baseline Survey of New Zealanders' Attitudes and Behaviours towards Cycling in Urban Settings
 Baseline Survey of New Zealanders' Attitudes and Behaviours towards Cycling in Urban Settings Highlights 67% of urban New Zealanders, 18 years of age or more own or have access to a bicycle that is in
RECRUITMENT HUNTERS A case-study approach to learning more about hunting among Hispanics and improving recruitment and retention of other hunters
 RECRUITMENT OF HISPANIC HUNTERS A case-study approach to learning more about hunting among Hispanics and improving recruitment and retention of other hunters A joint project of the McGraw Center for Conservation
Assessing the Accuracy of High Spatial Resolution Effort Data
 Assessing the Accuracy of High Spatial Resolution Effort Data Southwest Fisheries Science Center, Ecology Division Comparing VMS and Logbook Data in the California Groundfish Trawl Fishery Alice Thomas-Smyth,
Roadway Conditions as Contributing Factors in Florida Traffic Crashes
 Roadway Conditions as Contributing Factors in Florida Traffic Crashes Michael R. Baltes and Xuehao Chu Center for Urban Transportation Research University of South Florida 4202 East Fowler Avenue, CUT
California Boater Card FAQ
 California Boater Card FAQ California BOATER CARD Q: What is a California Boater Card? A: The California Boater Card shows that its holder has successfully taken an approved boating safety course and passed
Sport Fishing Expenditures and Economic Impacts on Public Lands in Washington
 Sport Fishing Expenditures and Economic Impacts on Public Lands in Washington For: Northwest Sportfishing Industry Association By: Southwick Associates Released June 2015 PO Box 6435 Fernandina Beach,