Nancy Montes Robert Swett Charles Sidman Tim Fik
|
|
|
- Sara Barrett
- 6 years ago
- Views:
Transcription


1 Nancy Montes Robert Swett Charles Sidman Tim Fik

2 A publication of the University of Florida Sea Grant Program. The project was funded by the Southeast Regional Office NOAA Fisheries Services pursuant to National Oceanic and Atmospheric Administration Award number NAI00R ; by the University of Florida; by the Florida Sea Grant Program. The views expressed herein are those of the authors and do not necessarily reflect the views of the State of Florida, NOAA, or any of their sub agencies. TP-226 December 2016
3 Offshore Recreational Boating Characterization in the Southeast US by Nancy Montes Research Associate Florida Sea Grant College Program University of Florida Robert Swett Associate Professor Fisheries and Aquatic Sciences Program University of Florida Charles Sidman Associate Director for Research Florida Sea Grant University of Florida Tim Fik Associate Professor Department of Geography University of Florida i
4 Table of Content Tables... iii Figures... v Acknowledgments... vii Abstract... viii Part 1-Study Design Introduction... 1 Background... 1 Study Goals and Objectives... 2 Study Region Mail Survey... 5 Survey Instrument... 5 Sample Design... 6 Survey Return GIS Database Development... 8 Spatial Database Design: Trip Origins, Travel Routes, and Boater Profile... 8 Part 2-Study Analysis Boater-Group Characteristics Overview Season Vessel Characteristics Trip Characteristics Boaters Profile Addressing Needs and Barriers of Survey Respondents Part 3-Spatial Analysis of Boating Patterns Mapping Boating Patterns General Density Patterns Offshore Recreational Vessel Abundance Background Methods Results Part 4 - Mapping Offshore Recreational Vessels and Right Whales Co-Occurrences Background Method Results Part 5 Summary and Conclusions Literature Cited Appendices Appendix A. Questionnaire and Correspondence Cover letter Questionnaire Questionnaire Map Appendix B. Land-based Survey Sampling Schedule Data Collection Sheets ii
5 Tables Table 1. Population estimates by county (2012) and number of recreational vessels registered (2012) in the study area... 3 Table 2. Trip features digitized from returned surveys Table 3. Summary statistics for the number of reported offshore boating trips per season Table 4. Type of boat/vessel associated with reported trips based on reported trips of N=511 responses to question Table 5. Boat length summary statistics for reported trips (in feet) Table 6. Boat length summary statistics for reported trips (in feet) when more than one boat was reported Table 7. Survey response by waterway access category and season based on reported trips of N=507 respondents (question 4) Table 8. Frequency counts of departure sites identified by survey respondents for reported trips (N=507 respondents; 2,522 boating trips) Table 9. Departure sites shown on the survey map that were not reported by survey respondents Table 10. Reported importance of factors (ranked 1-5 Likert Scale: (1) Important; (2) Somewhat important; (3) Neutral; (4) Somewhat unimportant; and (5) Unimportant *Top Factors (with an average rank < 20) Table 11. Descriptive statistics for responses to maximum on-the-water distance willingness to travel from a new facility/launch location (ramp, marina, dry stack) to a nearby inlet with offshore water access Table 12. Average time when boating trips began and ended. Number of survey responses to question 1 is shown in parenthesis Table 13. Length of overnight boating trips: Number of days (where trip length >24 hours) Table 14. Length of time spent at boating destinations Table 15. Frequency of boating trips by day of the week based on N=515 reported trips (question 3) Table 16. Trip duration ( 48 hours) by day of the week and by season Table 17. Descriptive statistics for age of survey respondents (all survey respondents) Table 18. Age of survey participants (years) by vessel type based on N=498 responses to questions 5 and Table 19. Descriptive statistics of years of offshore boating experience in study area (all survey respondents) based on N=496 responses to question Table 20. Offshore boating experience of survey participants (years) by frequency of offshore boating trips based on N=475 responses to questions 7 and Table 21. Boating experience of survey participants (years) by vessel type Table 22. Offshore boating experience of survey respondents (years) by departure site based on N=489 responses to questions 7 and Table 23. Respondents having completed a boating safety or seamanship course, by offshore boating frequency Table 24. Respondents having completed a boating safety or seamanship course, by vessel type Table 25. Frequency counts of respondents primary residence ZIP code (N=500) iii
6 Table 26. Frequency and percentage of survey respondents who provided comments and/or suggestions that would improve their boating enjoyment Table 27. Frequency and percentage of survey respondents who provided comments and/or suggestions that would improve their boating enjoyment Table 28. Number of events recorded at each inlet, by vessel category Table 29. Summary of the number of sightings per sampling day and season Table 30. Summary of observed seasonal capture and recapture histories of observed recreational vessels (2011) in the study area Table 31. Summary of recreational vessel captures and recaptures histories based on the days of the week: Weekend (Friday to Sunday), Mon-Thu (Monday to Thursday), and Holiday (varies) Table 32. Descriptive statistics of the number of offshore recreational vessels observed by day of the week treatments. Weekend (Friday to Sunday), Mon-Thu (Monday to Thursday), and Holiday (varies) Table 33. CloseTest results for the capture-recapture dataset of offshore recreational vessels by season. Low p-values suggest population not closed Table 34. Model selection results from capture-recapture for the seasonal open-population of offshore recreational vessels using POPAN parametrization in Program MARK. Apparent survival (ϕ i ), probability of recapture (p i ), probability of entrance (b i ), variance inflation factor (c-hat), QAIC, super-population size estimate (N-hat), standard error (SE), 95% confidence intervals (CI), and coefficient of variation (CV) Table 35. Summary of right whale (RW) and recreational vessel sightings obtained by the EWS during the right whale seasons iv
7 Figures Figure 1. The offshore waters of northeast Florida and southeast Georgia comprise the study area Figure 2. Land-based inlet observation sampling frame Figure 3. Vessel type classification use in this study Figure 4. Example of GIS attribute query and display: Reported travel routes with their origins and destinations Figure 5. Box plots showing the length of the vessels used by participants who reported having more than one boat Figure 6. Boat ramps and marinas identified by survey respondents for reported trips (N=507; 2,522 trips) Figure 7. Box plot of the maximum on-the-water distance willingness to travel from a new facility/launch location to a nearby inlet with off-shore water access. Mean (+), Outlier ( ) (N=415) Figure 8. Histogram showing the age of survey participants Figure 9. Box plot of years of offshore boating experience of survey participants. Mean (+) Figure 10. Box plot of years of offshore boating experience by frequency of boating trips Figure 11. Box plot of years of offshore boating experience by vessel type Figure 12. Box plot of years of offshore boating experience by departure sites. Shoreline and causeway departure sites were omitted because of small sample size (N=5) Figure 13. ZIP codes of respondents primary residence (N=500) Figure 14. GIS summary of trip routes (all seasons) identified by survey respondents (N=2,522 trips) Figure 15. Recreational boating destinations identified by survey respondents (N=1,881) Figure 16. Getis-Ord (Gi*) statistic showing grid cells with statistically significant Z-scores for boating trip routes by season Figure 17. Getis-Ord (Gi*) statistic showing grid cells with statistically significant Z-scores based on season Figure 18. Getis-Ord (Gi*) statistic showing grid cells with statistically significant Z-scores for destination points for all seasons Figure 19. Number of recreational vessel sightings by inlet (bar chart) and the average air temperature observed during sampling days Figure 20. Unique vessels sightings by sampling day. A large number of vessels were sighted on sampling day 17 (May 7, 2011) and day 61 (April 28, 2012) as compared with other sampling days Figure 21. Summary of recreational vessel captures (on left) and recaptures (on right) by season Figure 22. Box plot of the number of offshore recreational vessels observed by day of the week treatment. Weekend (Friday to Sunday), Mon-Thu (Monday to Thursday), and Holiday (varies) Figure 26. Super-population size estimates with error bars (gray lines) by day of the week treatment for each of the studied seasons. Winter 2011 (Wi1), Winter 2012 (Wi2), Spring 2011 (Sp1), Spring 2012 (Sp2), Summer 2011 (Sum), and Fall 2011 (Fal) Figure 24. Percentage of recreational vessels recapture during the weekend and holiday treatment v
8 Figure 25. Area covered by aerial surveys conducted by the Early Warning System (EWS). For reference, the map also shows the area covered by the map-based survey (in red) Figure 26. Monthly relative probability of right whales (on left), recreational vessels (middle), and right whale/ recreational vessel co-occurrence (on right). Analyses were performed based on data from right whale seasons Figure 27. Monthly relative probability of right whale/recreational vessel co-occurrence. Analyses were performed based on data from right whale seasons. Black stars represent direct observations of right whale/recreational vessel co-occurrences reported by the Early Warning System (EWS) Figure 28. Cumulative relative probability of right whale/recreational vessel co-occurrence. Analyses were performed based on data from right whale seasons. Black stars represent direct observations of right whale/recreational vessel co-occurrences reported by the Early Warning System (EWS) vi
9 Acknowledgments This initiative was implemented through a coordinated effort of local, state and federal agencies to help provide for enhanced recreational boating access to the coastal waters of northeast Florida and southeast Georgia. This multi-year project was funded by Southeast Regional Office NOAA Fisheries Services pursuant to National Oceanic and Atmospheric Administration Award number NAI00R ; by the University of Florida; and by the Florida Sea Grant Program. The success of this project relied upon the individual contributions of various team members. Principal Investigator Robert Swett and Charles Sidman (Florida Sea Grant) were responsible for project administration, overall design of the questionnaire and correspondence, sample selection, the GIS database design, and reporting. Timothy Fik (Department of Geography, University of Florida) performed the statistical analyses. Nancy Montes conducted the spatial and abundance analysis of seasonal use. David Fann provided suggestions to improve the map layout and design. Maia Maguire (Florida Sea Grant agent), Captain Mike Getchell (harbor safety chair of Jacksonville Marine Transportation Exchange, Inc.), and Captain Jim Suber (Waterways coordinator and dock Master of the city of Jacksonville) provided suggestions for the mail survey questionnaire. Len Kreger, David Thrall, Jenna Manis, Scott Runnion, John Milio, Mason Smith, Rick Edwards, Howard Lawson, and Gordy Schleissing, Chris Swett, Katherine Malachowski, Althea Hotaling, Namyun Kil, and Daniel Soto spent long hours under rough conditions to record recreational vessels transiting the three main inlet of the study area. Chris Swett and Nancy Montes managed and processed spatial and attribute data from the returned surveys. Barb Zoodsma (NOAA), Timothy Gowan (FWC), Joel Ortega-Ortiz (FWC) and all people involved in the Early Warning System collected the spatial and temporal right whales and recreational vessel sightings that were used in the last part of this report. We especially thank the many boaters who donated their time to complete and return the questionnaires. It is our intention that this work will provide information products and outreach support of benefit to boaters who use the offshore waters of the northeast Florida and southeast Georgia region. vii
10 Abstract The recreational boating study described by this report resulted from a collaborative partnership between the NOAA Fisheries Southeast Regional Office, Florida Fish and Wildlife Conservation Commission (FWC), and the University of Florida Sea Grant College Program. This report documents the methods, procedures, and findings of a map-based mail survey that was distributed (October 2012) to 5,034 boaters using the offshore waters of northeast Florida and southeast Georgia region. The study seeks to obtain seasonal and spatial information about boating preferences, use profiles, travel patterns, relative seasonal abundance. Additionally, we analyzed the relative probability of co-occurrence between the North Atlantic right whales and offshore recreational vessels in the study area using information provided by the Early Warning System (EWS). Questionnaire recipients were asked to mark the start and end points of their two most recent recreational boating trips, draw the associated travel routes, and identify boating destinations and activities along these routes. They were also asked to mark destination points along with the described routes. Data collected from 958 returned surveys (19.03% overall return rate) were digitized into the ESRI ArcGIS geographic information system (GIS). This translated to a sample of 2,522 trip departure sites and travel routes and 1,881 boating destinations. It is this spatial representation that serves to distinguish this study from previous efforts to characterize (i.e., profile and describe) boating patterns. Boaters drew hundreds of individual seasonal boating trips on provided maps. This spatial information and linked attributes were then entered into a GIS. Further descriptive data about the mapped trips, such as timing and vessel type, and independent data about the respondent s typical boating trips, including preferences determining departure sites and travel routes, and frequency, can be linked to the data within the GIS, for further analysis. Information products generated from this study include: 1. A profile of boaters who access offshore and inlet areas in the northeast Florida and southeast Georgia region for recreation 2. A profile of the types of recreational vessels operated on offshore and at inlet areas in the study area 3. A description of boater preferences as to waterway access facility amenities 4. A summary of principal problems and needs perceived by offshore recreational boaters in the study area 5. An estimation of the relative seasonal abundance of offshore recreational vessels 6. Spatial data formatted within a GIS that can be used to map: a. service areas for boating facilities b. departure or launch sites c. water-based boating destinations d. distribution and overlap of recreational vessel with other maritime activities and\or wildlife 7. An evaluation of seasonal aspects for many of the information products listed above. viii
11 This report is divided into four parts. Part 1 discusses the survey design, mailing implementation, and data collection. Part 2 presents the results of a statistical analysis of survey questions and compares seasonal differences in use among survey respondents. Part 3 presents the results of spatial analyses of offshore and inlet use patterns. A GIS density function identifies travel corridors and boating destinations. Statistically significant hot spots and autocorrelations on the recreational boating trips are identified. A capture-recapture analysis is presented at the end of Part 2, which allows the estimation of the seasonal relative abundance estimate of offshore recreational vessel. Par 4 presents the result of the relative probability of co-occurrence between recreational vessels and the North Atlantic right whales using the sightings per unit effort (SPUE) method. ix
12 1.1 Introduction Background Part 1-Study Design Boating is a key element in Florida s coastal lifestyle and growth phenomena. Florida ranks first in the nation in recreational boat registrations, with 901,969 registered in 2012 (FDHSMV, 2013). On average, this represents approximately one boat for every 21 residents. Coastal development, the ever-increasing number of boaters, and the diversity of recreational boating activities that now take place within Florida s coastal bays, estuaries, and waterways have had positive economic impacts, but have also profoundly altered the coastal estuarine environment (Letson, 2002; Antonini, Fann & Roat, 1999). As demand for the use of Florida s waterways increases, so does the need for enhanced public access, maintenance of waterway infrastructure, public safety, and environmental protection. There is, however, little information available to resource managers and planners that describes the actual use patterns and preferences of the offshore boating community. The study area comprises the offshore waters of Nassau, Duval, St. Johns, Flagler, and Volusia counties in Florida and Camden and Glynn counties in Georgia. This area is noteworthy for its many water-based anthropogenic activities, including three major ports (Brunswick, Fernandina, and Jacksonville), two major naval stations (Mayport in Jacksonville and Kings Bay in St. Marys), and an unknown number of commercial and recreational vessels that use offshore waters. In addition to the 19,890 boats registered in the county 1, an unknown number of boaters travel to the area from other Florida counties, neighboring states, and from other countries (e.g., Canada). The study area faces the difficult yet critical management challenge of sustaining economic viability while maintaining the integrity of coastal environmental resources. Over a million people 2 inhabit the five coastal counties of the study area (Census, 2012) and there were over 55,000 3 recreational boats registered in these counties in 2012 (FLHSSMV, 2013; GA Wildlife Resource Division, 2013). The study area has over one boat for every 23 residents. The offshore waters of the southeastern United States (U.S.) provide the only known calving and nursing ground for the highly endangered North Atlantic right whale (Eubalaena glacialis), with an estimated population of 450 individuals (Kraus et al., 2005). Great efforts have been conducted to mitigate adverse effect of encounters between right whales and humans, especially ship collisions with whales, which have been identified as the whales main cause of death (Kraus et al., 2005). Some studies have documented the probability of encounter between right whales and commercial ships (65 ft or greater) in the study area (Ward-Geiger et al., 2005; Fonnesbeck et al., 2008; Vanderlaan et al., 2008; Lagueux et al., 2011). However, information about the spatial distribution and overlap of recreational vessels (less than 65 ft in length) with right whales is limited (Hain et al., 1994). Nevertheless, quantitative estimates of 1 Florida Fish and Wildlife Conservation Commission (myfwc.com/law/boating/), According to the Census Bureau the population estimate for 2012 for the 5 counties in the study area was 1,288, According to the Florida Department of Highway Safety and Motor Vehicles in 2012 there were 47,646 vessels registered in Nassau, Duval, and St Johns counties. According to the Georgia Department of Natural Resources in 2012 there were 132,424 vessels registered in Camden and Glynn counties. 1
13 whale/recreational vessel co-occurrence are scarce and little is known about their spatial distribution. For optimum utility, science-based data pertaining to recreational boating patterns should include spatially referenced detail. For example, an analysis of boat trip origins that includes the type of access facility, facility location, and number of users is necessary for informed policy decisions as to siting infrastructure (e.g., public ramps). Spatial and temporal analyses of boat traffic as it relates to the distribution of other species (such as right whales) that identifies areas of overlap between whales and recreational vessel. A scientific approach provides information for rational and objective planning to assure that future economic viability and environmental protection needs are balanced. Study Goals and Objectives The goals of the study were to characterize the temporal and spatial patterns of recreational boating offshore and at inlets. Specific objectives included (1) the development of spatial data sets within a geographic information system (GIS) to map boating patterns, (2) the analysis of trip information provided by boaters to describe the preferences and behaviors of boaters who use the offshore waters of the study area, (3) to estimate relative seasonal abundance of offshore and at inlets recreational boaters, and (4) to map right whales and recreational vessel co-occurrence. Examples of the information products derived from the study are as follows: 1. A profile of boaters who use the offshore waters of the study area for recreation, and characteristics of their trips (e.g. timing, frequency, and duration); 2. A profile of the types of recreational vessels operated on offshore waters of the study area; 3. A compilation of spatial boating trip data within a GIS that can be used to map: a. departure or launch sites, b. offshore destinations, c. trip routes as reported by boaters; 4. A description of the main comments from respondents about their boating trips, boating facilities, waterway improvements, or information/actions that would increase boating enjoyment or help care for the boating environment; 5. An evaluation of seasonal aspects for many of the information products listed above; 6. An estimate of relative seasonal abundance of offshore recreational vessels; 7. Maps showing areas with high/low relative probability of right whale/human cooccurrence based on aerial sightings. The study process involved (1) inlet observations to identify the characteristics and owners (name and mailing addresses) of vessels observed transiting the main study area inlets; (2) the development of a survey instrument and accompanying correspondence; (3) the identification of boater groups seasonally (winter, spring, summer, and fall); (4) the construction of spatial databases from returned mail surveys identifying trip departure sites, offshore destinations, and travel routes. The process was consistent with previous boating pattern studies conducted by 2
14 Florida Sea Grant and the Florida Fish and Wildlife Conservation Commission s Fish and Wildlife Research Institute for Tampa and Sarasota Bays (Sidman & Flamm, 2001; Sidman, Fik & Sargent, 2004); the Greater Charlotte Harbor (Sidman et al., 2005); Sarasota County (Sidman et al., 2006); Brevard County (Sidman et al., 2007); Bay County (Sidman et al., 2008); and Collier County (Sidman et al., 2009). Study Region The waters off the northeast coast of Florida (Nassau, Duval, St Johns, Flagler, and Volusia counties) and southeast coast of Georgia (Glynn and Camden counties) comprise the study area (Figure 1). The area corresponds with the southeastern portion of the calving and nursing ground of the North Atlantic right whale. Recreational boaters are attracted to this region s offshore waters, which provide excellent opportunities for fishing, diving, and nature viewing. Its proximity with the Caribbean Sea offers a route and destination for transit visitors to/from North and South America. There are six inlets in the study area with different transiting capacities. St. Marys, St. Johns, St. Augustine, and Matanzas inlet are those most transited to access offshore waters. This area also has three major ports (Brunswick, Fernandina, and Jacksonville), and two major naval stations (Mayport in Jacksonville and Kings Bay in St. Marys). Almost two million people inhabit the seven coastal counties of the study area (Nassau, Duval, St. Johns, Flagler, and Volusia in Florida and Camden and Glynn in Georgia (Census, 2012) and in 2012 there were almost 87,500 recreational boats registered in these counties (Table 1). However, no information exists about how many recreational boats access offshore waters in the study area (FLHSMV, 2012; Wildlife Resource Division, 2012). Table 1. Population estimates by county (2012) and number of recreational vessels registered (2012) in the study area. County People 2012 Vessels 2012 Nassau 76,619 5,969 Duval 897,698 28,519 St Johns 217,919 13,158 Flagler 102,408 5,171 Volusia 507,531 27,125 Camden 52,027 2,846 Glynn 82,175 4,665 Total 1,936,377 87,453 3


15 4 Figure 1. The offshore waters of northeast Florida and southeast Georgia comprise the study area.
16 1.2 Mail Survey Survey Instrument The survey questionnaire for this study was patterned after that of similar, previous studies (Falk, Graefe, Drogin; Sidman & Flamm, 2001; Sidman, et al. 2004; West, 1982; Sidman, et al. 2007) and was designed (1) to capture spatial information regarding trip departure sites and intervening travel routes and (2) to characterize boaters with respect to the types of vessels owned and used, activity preferences, and the timing, frequency and duration of their recreational outings (see Appendix A for the survey instrument and associated correspondence). The primary survey instrument was a two-sided 8.5 X 11 inch questionnaire and a 24 X 36 inch map (~1:254,000 scale) that folded to 8.5 X 11 inches. The questionnaire consisted of 16 questions divided into the following topical areas: 1. Description of the typical offshore boating trips by season (winter, spring, summer, and fall) 2. Description of typical departure sites 3. Description of survey respondent The following additional items were included with each mailed questionnaire: 1. A cover letter that explained the study 2. A postage paid return envelope with postal permit indicium 3. A mailing envelope that included return address and postage permit indicium In addition, a 4 X 6 card was mailed approximately two weeks after each mailing to remind survey recipients to complete and return the questionnaire. A copy of the survey map, with a thank you note, was delivered to over fifty percent of respondents (i.e., those who had requested one). The questionnaire asked survey recipients to mark, on the map, the location of departure sites, travel routes, and offshore destination sites associated with their typical pleasure boating trips that they took during the most recent winter (Dec, Jan, Feb), spring (Mar, Apr, May), summer (Jun, Jul, Aug), and fall (Sep, Oct, Nov). In addition, survey recipients were to mark their offshore destinations along the routes. Complementary questions allowed recipients to characterize the trips that they drew on the map according to vessel type, the departure weekday, month and time, and the amount of time spent on the water. In addition, recipients were asked to characterize and name the departure sites for their last two trips and to rank reasons for departure site selection, where this differed from a home dock. A hypothetical scenario question asked participants how far upstream from the inlet they would be willing to go if an ideal departure facility was available for offshore trips. Respondents were asked to give the number of boating days per season. Finally, a series of questions sought to characterize the respondent in terms of age and boating experience. This section also included an open-ended question giving the boaters the opportunity to provide any comment about their boating trips, boating facilities, waterway improvements, or information/actions that would improve their boating experience. 5

17 Sample Design The sample design was developed to include a diverse representation of offshore recreational boaters by targeting vessels transiting the three main inlets of the study area. The design was also intended to provide temporal and seasonal information that could be used to compare and contrast use patterns among days of the week and seasons. Land-based inlet observations This method provided information for 2 components of the study: a) the sampling frame for the survey and b) estimation of the relative abundance of recreational vessels offshore. Based on exploratory visits to the six inlets within the study area and supporting information (i.e., population density and topographic maps, conversations with locals, and a literature review) land-based inlet observations were only conducted at the three main navigable inlets of the study area: St. Marys, St. Johns, and St. Augustine (Figure 1). Field observers recorded information about boats transiting the St. Marys, St. Johns, and St. Augustine inlets (both incoming and outgoing boats) on 64 sampling days (at each inlet) over a 15-month period (from January 2011 to May 2012). Data was collected from sunrise to sunset on each sampling day. Previous studies on vessel traffic in Florida demonstrated that vessel abundance varies depending on the day of the week (Monday-Thursday, Friday and Sunday, Saturday, Holiday) and seasonally (Hain et al., 1994; Sidman et al., 2004, 2005, 2006, 2007). Therefore, each month, four days were randomly selected based on four pre-determined groups: a) Monday to Thursday, b) Friday or Sunday, c) Saturday, and d) Holidays (Figure 2). In some cases, previously selected random days changed due to hazardous weather conditions and small craft advisories that, generally, were broadcast 1 or 2 days in advance of a survey day. In those cases, another randomly available day was selected within the same pre-determined group for that particular month. Figure 2. Land-based inlet observation sampling frame. Data collection was conducted using 3 Nikon D3100 body cameras and 2 Nikon AS Zoom-Nikkor mm f/ g lenses and 1 Sigma APO mm F5-6.3 lens. Each vessel observed transiting a study inlet was photographed independently of its travel direction (outbound or inbound). Vessel registration numbers and/or vessel names and hailing ports, vessel type, vessel length, transit direction (out or in), and the date and time of transit was recorded 6


, length of vessel (small")


.")


18 directly was supported by a photographic record (at least 2 pictures per boat were taken). Field observers were trained to follow standardized guidelines. Appendix 2 shows the sampling schedule and the field sheet used for data collection during the inlet observations. Previous research on recreational boating has used vessel type categories based on the propulsion method (motorized vs. non-motorized), length of vessel (small vs. large vessels), personal watercrafts, and other characteristics (Widmer and Underwood, 2004; Sidman et al., 2004, 2005, 2006, 2007; Gorzelany, 2008; Gray et al., 2011; Smallwood et al., 2011). The vessel type categories used in this study are illustrated in Figure 3. Open fisherman (center console) Runabouts (speed boats, cigarette, scarab) Offshore boat Sailboat Yachts Commercial: Head boat Commercial: Shrimp boat Commercial: Crab boat Other: Cargo Ship Other: Pilot boat Other: Tug boat Other: Governmental Other: Military Figure 3. Vessel type classification use in this study. 7
19 A total of 7,645 unique vessel registration numbers (VRN) were identified, which were then linked with the Vessel Title Registration Systems (VTRS) of Florida and Georgia and the United States Coast Guard s (USCG) vessel database. Owner and address information for 5,034 VRN were identified. Identified addresses were certified and verified for mailing purposes. The survey was distributed to the identified boaters in October, Survey Return Surveys were distributed to 5,034 recreational boaters and 958 surveys were returned, which represents a 19.03% overall return rate. The identification of vessel owners using photo identification is not a perfect method. Fifteen percent of those who returned a survey were inshore boaters, 9% did not boat in the study area, and 9% returned a blank survey. The remaining 517 completed surveys were used in the analysis. In 2012, there were 87,453 registered vessels in the seven counties of the study area. However, it is unknown how many of these boaters identify themselves as offshore recreational boaters. Furthermore, it is unknown how many non-residents vessels are visiting the study area. Therefore, there are no records about the size of our target population (offshore recreational boaters). If we assumed that our target population is no bigger than 87,500 boaters, we could roughly estimate the desired sample size based on the Dillman sample size equation (Vaske, 2008): (87,500)(0.5)(1 0.5) Completed sample size needed = (87,500 1) ( ) 2 + (0.5)(1 0.5) = 382 For our estimate we assumed a 50/50 split in population (most conservative) that consisted of 87,500 boaters, a sample size of at least 382 is needed to be 95% confident that the sample estimate is within ±5% of the true population value (Vaske, 2008) GIS Database Development Spatial Database Design: Trip Origins, Travel Routes, and Boater Profile Questionnaire recipients were asked to (1) mark the starting point of one boating trip for each season (winter, spring, summer, and fall) on a map, (2) draw their entire travel routes, and (3) identify destinations along those routes. Not all the returned surveys included spatial information or were of sufficient quality to be digitized. Data collected from 507 surveys were digitized into the ESRI ArcGIS geographic information system (GIS). This yielded a sample of 2,522 trip departure sites and travel routes (some respondents reported more than one trip per season), and 1,881 boating destinations (Table 2). 8

20 Trip Features Table 2. Trip features digitized from returned surveys. Winter trips Spring trips Summer trips Fall trips Season not specified by respondents Totals Origins ,522 Travel Routes ,522 Destinations ,881 Spatial information was digitized using a Calcomp Drawing Board III digitizer tablet using the survey maps and ancillary data such as natural color Digital Orthophotograph Quarter Quadrangle (DOQQ) imagery, and the positions of marinas, ramps, navigation aids, and artificial reefs as background themes to enhance the accuracy of digitized data. Trip departure sites and destinations were digitized as point features, with each record coded with the survey control number, the trip number (i.e., first or second trip), and season. A marina or ramp origin was also coded as such, and identified with the map legend number for a given facility name. Travel routes were digitized as line features and coded with the following attribute information: survey control number, trip number, season, individual root-mean-square error (RMSE) for each route, and trip features such as one-way vs. round trip, and whether or not the trip was confined to the study region. Off-map trip attributes included ultimate destinations and associated activities. In 98% of the cases the RMSE was between 0.04 and 0.09 (Mean=0.007; SD=0.001). Reported summer travel routes within the St. Marys inlet boating region are displayed in Figure 5. Red lines represent travel routes digitized from returned surveys and green triangles represent digitized destination sites. The blue lines depicted in the GIS view represent 4 travel routes, origin, and destinations that were selected for display. The corresponding database records (origin and destinations) that are linked to the travel routes via the survey control number ID are shown in blue. Figure 4. Example of GIS attribute query and display: Reported travel routes with their origins and destinations. 9
21 2.1. Boater-Group Characteristics Overview Part 2-Study Analysis This chapter presents an evaluation and summary of responses to specific survey questions by boaters in the northeast Florida and southeast Georgia region. The sections of this chapter are divided according to themes that describe (1) seasonal offshore boating trips; (2) vessel characteristics; (2) offshore access characteristics; (3) trip characteristics; (4) boater profile; and (5) needs and barriers of survey respondents. It should be noted that while questions were arranged to follow a logical progression on the survey instrument, the following results and corresponding discussion sections are arranged thematically and, therefore, questions do not necessarily follow the order in which they appeared on the survey instrument. The descriptive analysis presented in this chapter is based on information obtained from N=515 surveys. Each survey typically describes one boating trip for each season, and, therefore, several questions embody more than one response, one for each trip. The number of survey responses to specific survey questions or combinations of questions varies from question to question, as does the sample size associated with the various user groups responding to those questions. For convenience, the sample sizes are listed within each summary table. A copy of the survey instrument is provided in Appendix A. Season The average number of trips during each offshore boating season varied significantly, ranging from a low of 3.3 trips during the off-peak season (winter) to a high of 8.2 trips during the peak season (summer). In addition, the number of reported off-shore trips was significantly higher during the spring and summer seasons than the fall or winter season (Table 3). Table 3. Summary statistics for the number of reported offshore boating trips per season. Trip/season Average Number of Offshore trips Standard Deviation Min. Max. Median 95% confidence interval Winter to Spring to Summer to Fall to N* = the number of responses to question 7. N* Vessel Characteristics A summary of the vessels used by respondents in the offshore waters of the study area is given in Table 4. Reported trips of survey respondents were most associated with vessels that fell in the open fisherman category (a group that represented approximately 59% of reported trips by survey respondents in the study region). The off-shore fisherman category was associated with approximately 16% of reported trips, whereas the sailboat category accounted for 15% of 10
22 reported trips. All in all, these three vessel categories account for approximately 88% of the trips reported by survey respondents in the study region. Table 4. Type of boat/vessel associated with reported trips based on reported trips of N=511 responses to question 5. Type of Boat/Vessel Season Open Offshore Sports Power Sailboat Speedboat Fisherman Fisherman Cruiser Other Total Winter Spring Summer Fall Total Percentage 59.1% 15.9% 13.1% 4.3% 4.2% 3.3% Open Fisherman category includes flats, skiffs, and center console boats Average length statistics for vessels used in reported trips by survey respondents (question 6) are shown in Table 5. Survey results suggest that the average vessel length is approximately 27 feet, based on reported vessel types by survey respondents in the study area. The average vessel length was slightly lower for trips conducted during summer when compared with the other seasons. Table 5. Boat length summary statistics for reported trips (in feet). Trip/season Average Boat Standard 95% confidence Min. Max. Median Length (feet) Deviation interval (mean) N* Winter to Spring to Summer to Fall to Overall 26.8 *N = the number of responses to question 6. Thirty-six respondents (7%) reported using more than one boat (N=507). A repeated measure ANOVA determined that the length of vessels used to access offshore water differed statistically significantly between seasons (F=5.43, p < 0.05). The size of the boat was significantly different among seasons with boaters using their smaller boats during spring (Table 6, Fig. 5). 11
23 Table 6. Boat length summary statistics for reported trips (in feet) when more than one boat was reported. Trip/season Average Boat Standard 95% confidence Min. Max. Median Length (feet) Deviation interval (mean) N Winter Spring Summer Fall There were 36 participants who reported using more than one boat; however, N varied because of the respondents frequency of use. Figure 5. Box plots showing the length of the vessels used by participants who reported having more than one boat. Offshore Access Characteristics Frequency counts and percentage breakdown of survey responses by waterway access category are shown in Table 7. Survey results for question 4 suggest that the majority of trips reported by survey respondents originated from boat ramps (approx. 59%), followed by marina wet slips (approx. 22%). These two launch sites accounted for approximately 81% of all boating trip departure sites for reported trips in the study area. 12
24 Table 7. Survey response by waterway access category and season based on reported trips of N=507 respondents (question 4). Season Boat Marina Marina Home/Condo Shoreline Row Row Ramp Wet Dry Dock Causeway Total (%) Winter % Spring % Summer % Fall % Column Total Column (%) 58.7% 21.6% 7.0% 11.5% 1.1% 1,585 Total trips A lower number of survey participants (33) used more than one type of waterway access throughout the year (6.5%). The most common combination of waterway access categories was Boat Ramp and Marina Wet. The marinas and boat ramps listed in Table 8 are those departure sites that were used on the survey map. It also includes departure sites identified by respondents (question 8). The estimate for the on-the-water distance from a facility to the nearest inlet was obtained using the routes drawn for most of the departure sites. However, for those cases where the departure site was not cited by survey respondents, the distance estimate calculated based on the closest route to offshore waters. Survey respondents identified 67 boat ramps and marinas that were used to access offshore water in the study area (Table 8). Survey results suggest that there are seven prominent launch/departure sites for recreational boating trips in the study region, based on information obtained from survey respondents on the launch locations associated with reported boating trips. The most popular boat ramps were Mayport, Vilano Boat Basin, and Dee Dee Bartels, Joe Calucci, Lighthouse Park, and Jim King Park (Table 8, Fig. 6). The most popular marinas were Camache Cove, Conch House Marina, Fernandina Harbour, and Amelia Island Yacht Basin (Table 8, Fig. 6). Table 8. Frequency counts of departure sites identified by survey respondents for reported trips (N=507 respondents; 2,522 boating trips). Facility Winter Spring Summer Fall 13 No seasonal info All Seasons Distance from the departure site to the used inlet (nm) Mayport Boat Ramp Vilano Boat Basin Dee Dee Bartels Joe Calucci Boat Ramp Lighthouse Park Boat Ramp Camache Cove Jim King Park Boat Ramp Conch House Marina
25 Facility Winter Spring Summer Fall No seasonal info All Seasons Distance from the departure site to the used inlet (nm) Fernandina Harbour Amelia Island Yacht Basin Morningstar at Mayport Palm Cove Cat's Paw Marina * North River Boat Ramp St Augustine Municipal Marina Devil s Elbow City of St Marys Boat Ramp Mira Vista & Watersedge * Beach Marine Arlington Marina * Brunswick Landing Usinas Egan's Creek Marina * Tiger Point Browns Creek Lang's Marina Cabana Club Boat Ramp Oak Harbor Boat Ramp Morningstar Marina at Golden Isles Big Talbot Island State Park Green Street Launch Mandarin Holiday Marina * NAS * F&A Marine Const. Inc. * Seafarers * Fort George Island Marina Oasis Boat Yard & Marina Fish Island Marina Jekyll Island Boat Ramp Cedar Point Boat Ramp Hershel King Park * Boating Club Road * Osprey Cove (Birdsong Trail) * Blythe Island Regional Park Intracoastal Waterway Ocean Hwy (US HWY 17) * Villages of Vilano Intercoastal Marina Queen's Harbour Yacht *
26 Facility Winter Spring Summer Fall No seasonal info All Seasons Distance from the departure site to the used inlet (nm) Ortega Yacht Club * Anchorage Inn & Marina * Crooked River Boat Ramp Douglas C. Crane Frank Butler Park New Berlin Boat Ramp * Clapboard Creek Marina Ortega Landing * Alimacani Boat Ramp Palm Fish Camp Boat Ramp West Palm Valley Fellas Sport Boat Ramp * St Simons Boating & Fishing Club Jekyll Harbor Marina Ocean Outboard St Augustine Marine Center * Gibson Dry Docks * Lamb's Yacht Center Inc Home/Condo Dock or the departure site was outside study area *Departure site identified by respondents

27 Figure 6. Boat ramps and marinas identified by survey respondents for reported trips (N=507; 2,522 trips). 16
28 There were 13 departure sites shown on the survey map that were not reported by survey respondents (Table 9, Fig. 6). Table 9. Departure sites shown on the survey map that were not reported by survey respondents. Distance from the Facility departure site to the used inlet (nm) * Troupe Creek Marina 5 Village Creek Boat Ramp 12 Blythe Island Beach Drive 19 Credle's Complete Marina 6 Harriet's Bluff Boat Ramp 5 Goffinsville Road Boat Ramp 6 Holly Point Boat Ramp 8 Dames Point Marina 10 Mariner Point Yacht Club 11 Hidden Harbor Boat Ramp 7 Shore Drive Boat Ramp 27 Coastal Outdoor Center 5 Tradewinds Marina 3 *Distance estimation based on nearest route from the departure site to the nearest inlet. Survey results for question 9 suggest that the most-important factors in the recreational boating experience, as indicated by survey respondents, are as follows (in descending order of importance, based on average ranking of responses): (a) (b) (c) (d) (e) Proximity to inlet or nearness to off-shore waters; Adequate parking; Safe and secure parking areas; Convenient hours of operation; and Proximity to favorite boating destinations. In addition, approximately 8% of survey respondents identified ramp/dock quality as an other factor of importance to them (Table 10). 17
29 Table 10. Reported importance of factors (ranked 1-5 Likert Scale: (1) Important; (2) Somewhat important; (3) Neutral; (4) Somewhat unimportant; and (5) Unimportant *Top Factors (with an average rank < 2.0). Factor N Average Rank Standard Deviation 95% Confidence Interval Lower Upper Bound Bound Close to an Inlet* (near offshore waters) No Launching or Parking Fees Restroom Availability Adequate Parking* Close to my Home (shorter drive time) Nearby Amenities (store, restaurant, hotel, etc.) Safe and Secure Parking Area* Close to my Favorite Boating Spots* Availability of Fishing Supplies Hours of Operation* Gas, Pump Out, Maintenance Service Other Most Frequent Other* Good Ramps/Docks; Ramp/Dock Quality Survey Results for question 10 suggest that the average on-water willingness-to-travel distance of survey respondents from a new launch facility to a nearby inlet with off-shore water access is approximately 7.6 nautical miles (or an average travel time of approximately 23 minutes). Based on the estimated 95% confidence interval for the mean, the average distance was somewhere between 7.2nm and 7.98nm (Table 11, Fig. 7). Table 11. Descriptive statistics for responses to maximum on-the-water distance willingness to travel from a new facility/launch location (ramp, marina, dry stack) to a nearby inlet with offshore water access. Statistic Distance (nm) Distance (Minutes) Average Median Std. Deviation Minimum 2 6 Maximum % Confidence Interval N 415 Note: Travel distance in nm/minutes conversion assumes 20MPH speed; and hence, the number of minutes is equal to (3 x nm). 18
30 Figure 7. Box plot of the maximum on-the-water distance willingness to travel from a new facility/launch location to a nearby inlet with off-shore water access. Mean (+), Outlier ( ) (N=415). Trip Characteristics Survey results for question 1 suggest that recreational boating trips in the study region typically begin between 7:18AM and 7:42AM (depending on the season), and end somewhere in the vicinity of 4:00PM. The results also suggest that the typical boating trip is well over 8 hours in duration based on the reported start and end times of boaters who responded to the survey. The average boating trip duration for the Summer Boating Season was significantly greater than the average trip durations of other seasons at the 95% confidence level (Table 12). Table 12. Average time when boating trips began and ended. Number of survey responses to question 1 is shown in parenthesis. Trip Season Average Time When Boating Trip Began Ended 7:42AM 3.57PM (283) (283) Average Trip Duration Standard Deviation 95% Confidence Interval Winter 8hrs and 50min 3hrs and 11min 8hrs_28min to 9hrs_13min (281) Spring 7.36AM 4:02PM 8hrs and 51min 3hrs and 12min 8hrs_32min to 9hrs_11min (396) (394) (392) Summer 7.18AM 4:09PM 9hrs and 17min 3hrs and 06min 8hrs_58min to 9hrs_35min (396) (395) (393) Fall 7:40AM 3:57PM 8hrs and 48min 3hrs and 16min 8hrs_26min to 9hrs_09min (327) (328) (326) Significantly greater than the average trip durations of the other seasons at the 95% confidence level. Survey results for Question 1 suggest that the average trip duration (for day trips boating trips that are less than or equal to 24 hours in length) is approximately 9 hours, based on reported durations of individual trips taken and reported by survey respondents. Seasonal estimates range 19
31 from approximately 8.5 to 9 hours, with trip duration being slightly longer during the summer boating season. Survey results for Question 1 also suggest that for recreational boating trips exceeding 24 hours in length (i.e., over-night trips), the average trip duration ranges between 4.6 days during the summer to approximately 12 days during the winter boating season based on reported trips of survey respondents in the study area (Table 13). The mean boating trip duration for the summer and fall Boating Seasons, for trips that exceeded 24 hours in length, was significantly less than the average trip durations of the other seasons (i.e., the winter and spring) for trips exceeding 24 hours in length at the 95% confidence level. Note that far fewer overnight trips were reported by respondents; as overnight trips represented about 1 out of 8 trips reported. Table 13. Length of overnight boating trips: Number of days (where trip length >24 hours). Trip Season Average Overnight Trip Duration N* Standard Deviation 95% Confidence Interval Maximum Winter days days 4.06 days to days 90 days Spring days days 6.49 days to days 65 days Summer 4.60 days days 1.58 days to 7.68 days 60 days Fall 6.37 days days 2.62 days to days 90 days N* = Number of survey responses to question 1, part C. Significantly less than the average trip durations of the other seasons (i.e., the Winter and Spring) for trips exceeding 24 hours in length at the 95% confidence level. Survey results for question 2 suggest that the average time spent at boating destinations is approximately 4 hours for reported boating trips taken by survey respondent in the study area. This is a statistic that is relatively consistent (i.e., does not vary significantly) across the boating seasons. Note that overall the reported mean time spent at boating destinations is approximately 3 hours and 54 minutes; an estimated value that is not significantly different from a value of 4.0 hours at the 95% confidence level (Table 14). Trip Season Table 14. Length of time spent at boating destinations. Average Time Spent at Destinations N* Standard Deviation 95% Confidence Interval Maximum Winter 3 hrs and 43 min hrs &10 min 3hrs_27min to 4hrs_00min 8hrs Spring 3 hrs and 50 min hrs &10 min 3hrs_36min to 4hrs_02min 8hrs Summer 4 hrs and 03 min hrs &13 min 3hrs_47min to 4hrs_18min 8hrs Fall 4 hrs and 00 min hrs & 00 min 3hrs_45min to 4hrs_26min 8hrs N* = Number of responses to question 2. 20
32 Survey results for 1uestion 3 suggest that approximately 55% of reported trips took place during the weekend (Saturday or Sunday), whereas 45% took place on weekdays (Monday through Friday). Summer and Spring boating trips accounted for 30% and 28% of all reported trips, respectively; and 58% of all trips overall (Table 15). Table 15. Frequency of boating trips by day of the week based on N=515 reported trips (question 3). Trip Day of the Week Reported Trip(s) Began Row Row Season M T W Th F Sat Sun Total (%) Winter (19.2%) Spring (28.1%) Summer (29.9%) Fall (22.7%) Column Total Column % 5.5% 6.7% 7.3% 9.1% 16.2% 38.4% 16.7% 2352 total trips There were no statistically significant differences in trip durations by seasons (F=0.638, p=0.59 for Mon-Thu group and F =2.5, p=0.06 for Fri-Sun group) or by day (Mon-Thu vs. Fri- Sun). Table 16. Trip duration ( 48 hours) by day of the week and by season. Season Trips reported only between Monday-Thursday Trips reported only between Friday-Sunday Mean (SD) N 95% CI Mean (SD) N 95% CI Winter (7.2) (4.8) Spring (9.9) (8.8) Summer (10.5) (8.7) Fall (13.1) (9.7) SD= standard deviation. CI= confidence interval Boaters Profile Survey results for question 13 suggest that the average age of survey respondents was approximately 55 years (Table 17, Fig. 8). There were no significant differences between respondents age by departure site (F=1.26, p>0.05). 21
33 Table 17. Descriptive statistics for age of survey respondents (all survey respondents). Statistic (N=499) Boaters Age (years) Average (overall) years Standard Deviation years Minimum 16 years Maximum 88 years Median (overall) 55 years 95% Confidence Interval years Figure 8. Histogram showing the age of survey participants. A breakdown of respondents age by vessel type is given in Table 8. Boaters who used Power Cruisers, Sailing Boats, and/or Other Category of vessel tend to be significantly older (F=5.9, p < 0.05) than respondents who used Open and Offshore Fishing Boats and/or respondents who have more than one type of vessel to access offshore waters (Table 18). 22
34 Table 18. Age of survey participants (years) by vessel type based on N=498 responses to questions 5 and % Confidence Vessel Type Frequency Mean of Standard Interval Min Max Count Age (years) Deviation Lower Upper Bound Bound Power Cruiser Sailing Offshore Fisherman Open Fisherman Other More than one type Survey respondents had, on average, approximately 20 years of recreational offshore boating experience, with a median of 20 years of boating experience (Table 9; Fig. 9). It was estimated that the mean number of years of boating experience among survey respondents was somewhere between 18.9 and 21.5 years overall, based on the estimated 95% confidence interval for the mean. The maximum reported number of years of boating experience was 63 years, and the minimum number was 0.25 year (roughly 3 months) (Table 19; Fig. 9). Table 19. Descriptive statistics of years of offshore boating experience in study area (all survey respondents) based on N=496 responses to question 11. Statistic Boating experience (years) Average (overall) 20.2 years Standard Deviation 14.3 years Minimum 0.25 years (or approx. 3 months) Maximum 63 years Median (overall) 20 years 95% Confidence Interval Figure 9. Box plot of years of offshore boating experience of survey participants. Mean (+). The breakdown of boating experience of survey responses by frequency of offshore boating trips are shown in Table 20. Of the N=475 survey responses to both question 7 (number 23
35 of trips by season) and question 11 (offshore boating experience), approximately 50% reported offshore boating trips for all seasons (year-round). In general, as offshore boating experience decreases, so does the frequency of offshore boating trips (Table 20; Fig. 10). Table 20. Offshore boating experience of survey participants (years) by frequency of offshore boating trips based on N=475 responses to questions 7 and 11. Offshore boating trip reported for: Frequency Count Mean of Boating Experience Standard Deviation Min Max 95% Confidence Interval Lower Bound Upper Bound Overall One Season Two Seasons Three Seasons Year-Round Results suggest that offshore boating experience varies significantly across boating frequency groups (Fig. 10). Respondents who boated year-round were significantly more experienced than were respondents who only boated during one season (p=0.010) or two seasons (p=0.008). However, there were no significant differences between respondents who use their boat during three quarter of the year (3 seasons) and those who used it year-round (p=0.536). Figure 10. Box plot of years of offshore boating experience by frequency of boating trips. 24
36 Based on n=495 responses to survey question 11 and question 5 (Vessel Type Category), there is a significant difference with respect to boating experience and the vessel type used to access offshore waters (F=6.97, p>0.05). Sailors tend to have fewer years of boating experience (mean = 12 years) than do recreational boaters using Open and Offshore Fishing Boats (mean = 22 and 24 years respectively) (Table 21, Fig. 11). Table 21. Boating experience of survey participants (years) by vessel type. Mean of 95% Confidence Vessel Type Frequency Boating Standard Interval Min Max Count Experience Deviation Lower Upper (years) Bound Bound Power Cruiser Sailing Offshore Fisherman Open Fisherman Other More than one type Overall Figure 11. Box plot of years of offshore boating experience by vessel type. There was no statistically significant difference between the departure sites with respect to boating experience (F=0.435; p>0.01). The differences between the means of boating experience are likely due to chance and not due to the departure site used by participants (Table 22, Fig. 12). 25
37 Table 22. Offshore boating experience of survey respondents (years) by departure site based on N=489 responses to questions 7 and 11. Departure Site 95% Confidence Freque Mean of Standard Interval ncy Boating Min Max Deviation Lower Upper Count Experience Bound Bound Boat Ramp Marina Wet Marina Dry Home or Condo Dock Shoreline or Causeway 5* More than 1 departure site year-round *Small sample Figure 12. Box plot of years of offshore boating experience by departure sites. Shoreline and causeway departure sites were omitted because of small sample size (N=5). Survey results for question 12 suggest that approximately 69% of survey respondents completed a boating safety or seamanship course (Table 23). Even though there is a 11% difference between boaters who took a safety or seamanship course and use their boat year-round and those that only used their boat during one season, there is no statistical significance between these two variables (Chi-Square = 0.225, p > 0.05). 26
38 Table 23. Respondents having completed a boating safety or seamanship course, by offshore boating frequency. Safety or Offshore Boating Frequency Two Three Seamanship Course One Season Year-Round Total Seasons Seasons Yes Count Percentage 61.8% 67.7% 64.7% 73.4% 69% No Count Percentage 38.2% 32.3% 35.3% 26.6% 30.6% Total Count Survey respondents who reported using a Sailing boat and/or Power Cruiser vessel tended to be more likely to have had a boating safety or seamanship course than those in the other vessel categories (Chi-Square =34.4, p < 0.05). Open Fisherman users were the less likely to have had a boating safety or seamanship course (Table 24). Table 24. Respondents having completed a boating safety or seamanship course, by vessel type. Safety or Seamanship Course Sailing Power Cruiser Other Vessel Type Offshore Fisherman More than one vessel type Open Fisherman Total Yes Count Percentage 89.3% 89.3% 85.7% 74.2% 63.3% 60.1% 69.3% No Count Percentage 10.7% 10.7% 14.3% 25.8% 36.7% 39.9% 30.7% Total Count A summary of the reported primary residence ZIP codes of survey respondents is given in Table 25 and Fig. 13. Most of the survey respondents are Florida residents (86%), although respondents identified any of 24 U.S. states. 27
39 Table 25. Frequency counts of respondents primary residence ZIP code (N=500). State Frequency Percentage Counts of Total Florida Georgia Virginia Massachusetts Maryland Texas California Colorado North Carolina Pennsylvania South Carolina Connecticut Columbia Delaware Illinois Kansas Kentucky Michigan Minnesota New Hampshire New Jersey New York Ohio Vermont

40 Figure 13. ZIP codes of respondents primary residence (N=500). Addressing Needs and Barriers of Survey Respondents A typology of main comments was developed through a content analysis of the responses to question 16. Respondents with shared general themes were grouped into categories. Every effort was made to capture the intended meaning of a given response and to maintain consistency in its assignment to a particular category. Many survey respondents provided multiple comments or suggestions, so that the total response number does not equal the returned survey count. More than half of the respondents (59%, N=302) provided comments about their boating trips, boating facilities, waterway improvements, or information/actions that would increase their boating enjoyment. Certain responses were excluded from this analysis because they were not amenable to intervention, such as descriptions of boating trips. In 180 cases (35%), respondents provided comments related to waterway improvements, and information/actions that would increase boating enjoyment (Table 26). 29
41 Table 26. Frequency and percentage of survey respondents who provided comments and/or suggestions that would improve their boating enjoyment. Group N Percentage Did not provide any comment % Description of boating trips % Comments on waterway improvements, and information / actions that would increase your boating enjoyment % Recreational boaters suggestions and comments were grouped in 10 categories (Table 27). The leading category, accounting for one-third (31.6%) of all analyzed responses (N=234), addressed the excess of regulations, particularly as to fishing. Some of the comments related with the excess of fishing regulations are: Please relax fishing regulation, number of trips significantly reduce due to strict regulations in place Fishing regulations and catch limits are making it very difficult to fish offshore Less rules and regulations for fish species Fisherman are being crushed by federal regulations The offshore fishing regulations are horrible Federal regulations on recreational fishing should be modified/relaxed based on sound scientific data Responses citing the need for maintenance and improvement of current departure facilities made up the second highest category, with 26.1% of total responses. In this category we included comments about the need for maintenance of departure sites (e.g., clean restrooms, more trash cans, signage), as well as the need for improvements. Some of the suggestions for improvements were the expansion of parking spots, the addition of fishing cleaning stations and boat washing capacity (Table 27). The third largest category overall was Waterway Infrastructure Maintenance and Improvements (20.5%). Within this category, respondents argued that keeping the inlets and channels dredged is very important to improve their boating enjoyment. The second largest subcategory was inadequate channel and inlet marks, and confusing, poorly maintained, or hazardous waterway signs, particularly unlighted ones. Some comments related with marks and sign improvements are: Put lights on all inlet channel markers, improve markers at St Augustine Inlet, buoys should have lights or large reflectors, some inlet signs are difficult to see at night. More Water Access concerns were the focus of 7.7% of all responses. This category includes comments on the need for more boat ramps (e.g., Marys River, Amelia River), anchorages and mooring fields, marinas and dry stack facilities near inlets (Table 27). 30
42 Table 27. Frequency and percentage of survey respondents who provided comments and/or suggestions that would improve their boating enjoyment. Category/Sub-Category N Percentage Excessive Regulations Fishing Regulations Speed, No Wake, and Manatee Zones Departure Facilities Maintenance and Improvement Ramp maintenance in General More Parking Add Cleaning Stations and Washing Capacity Improved boat ramps in general Storm Protection More Docks More Amenities (i.e., soda, snacks, ice machine) Pumpout Stations with ethanol Waterway Infrastructure Maintenance and Improvements Dredging Waterway Marks, Signs, and Buoys Improve Jetties Add a Cellphone Towers More water access Boat Ramps Anchorages and Mooring Fields Kayak access Ramps and Marinas with Sailboat Capacity Marinas Boater Education Altered Environment More Destinations/Activity Provisions More destinations More artificial reefs Designated Watersport Areas Better Enforcement More information (fishing closing schedule, weather, location of anchorages and mooring fields) General Category Development of Matanzas Gas Prices Inshore Study Visitors Tax The need for Boater Education comprises a category with 4.3% of total responses. Some of the comments in this category were: The problem today most boaters do not know the rules of the waterway. More education for new boaters, boating safety classes should be a requirement to operate a vessel, I think a mandatory boating course would be a good thing. 31
43 3.1. Mapping Boating Patterns General Density Patterns Part 3-Spatial Analysis of Boating Patterns This chapter presents the results of a GIS analysis that mapped the distribution or spread of the digitized trip information as density of occurrence. Continuous density surfaces generated by the GIS illustrate the degree of concentration or clustering of digitized trip information. General clustering patterns for travel routes and destinations were mapped and described using 100-meter grid cells and a search radius of 1,000 meters (Figs. 14 and 15). Furthermore, the Getis-Ord G statistic (Getis & Ord, 1996) was calculated and the Z-scores of the statistic (Gi*) were rendered using ArcMap to reveal statistically significant hot-spots of boating routes (Figs. 16 and 17) and destinations (Fig. 18). The Getis-Ord G-statistic gives a measure of clustering relative to a neighborhood of values. So, if features that have high values are clustered in one area, the G-statistic will be larger than would be expected if the values were the result of random chance, and that feature is part of a hotspot. For this analysis, the G statistic was calculated using a 1 km sampling grid cell and the neighborhood was restricted using a queen s matrix. This means that only the cells immediately adjacent (not diagonal) to the sides of any given cell were considered in the neighborhood calculation. From these values, Z scores by season were calculated and those with statistically significant scores were mapped. For the analysis, any Z scores greater than 1.96 (α = 0.5), were shown. To render the results, we used the significant level values based on the standard normal critical values (i.e., 1.645, 1.960, 2.576) to summarize the results into 5 classes, which range nominally from non-significant levels of clustering to highly significant levels. The greatest mapped density (Fig. 14) is restricted to the areas near and west of the main river entrances (St. Marys, St. Johns, and St. Augustine inlets). From each river entrance, recreational boating routes spread out moving mainly west (towards offshore waters), but also there are some routes traveling north and south, and between inlets. Recreational vessel traffic using the St. Marys river entrance showed the least spread pattern when compared with the other two main navigable inlets in the study area. Recreational vessels using the St. Augustine inlet traveled the furthest to reach the fishing ground at the ledge zone. The Getis-Ord G-statistic reveals that areas near the three main inlets, and up to 5nm at St. Marys inlet, 20 nm at St. Johns inlet, and 15nm at St. Augustine inlet, have consistent heavy clustering of recreational boating routes throughout the 4 seasons (Fig. 17 and 18). Popular destinations seem to be located between 8-10 nautical miles from the nearest inlet and extend to an area that is about 15 nm for boaters using the St. Marys inlet, nm for boaters using the St. Johns and St. Augustine inlets (Fig. 15). The Getis-Ord G-statistic supported the presence of heavy clustering of boating destinations at the locations described previously (Fig. 18). Three main features may be influencing the spatial distribution of recreational boating destinations: presence of artificial reefs and fish havens and deep-water areas at the ledge of the Florida continental shelf. 32
 identified")
44 Figure 14. GIS summary of trip routes (all seasons) identified by survey respondents (N=2,522 trips). 33

45 Figure 15. Recreational boating destinations identified by survey respondents (N=1,881). 34
 statistic showing grid cells with statistically")
46 Figure 16. Getis-Ord (Gi*) statistic showing grid cells with statistically significant Z-scores for boating trip routes by season. 35
 statistic showing grid cells with")
47 Figure 17. Getis-Ord (Gi*) statistic showing grid cells with statistically significant Z-scores based on season. 36
 statistic showing grid cells with statistically")
48 Figure 18. Getis-Ord (Gi*) statistic showing grid cells with statistically significant Z-scores for destination points for all seasons. 37
49 3.1 Offshore Recreational Vessel Abundance Background Estimates of abundance are important to understand the population dynamics of the species of interest, as well as to develop management strategies. We used open-population capture-recapture models to estimate the abundance of offshore recreational vessels in the northeast Florida and southeast Georgia Region. Capture-recapture models have been used traditionally to estimate population of animals (Williams et. al., 2011; Madon et. al., 2013; Goswani et.al, 2007). However, to our knowledge, this is the first attempt to use this approach to estimate abundance of recreational vessels. We counted already marked vessels (i.e., vessel ID, name, characteristics) over a number of occasions in order to obtain an estimate of population size. The population estimate was obtained using the superpopulation approach which can be thought of as either the total number of offshore vessels available for sighting at any time during the study, or, alternatively, as the total number of offshore vessels ever in the sampled area between the first and last sampling occasion (Williams et.al., 2011). The superpopulation approach embodies the Cormack-Jolly-Seber (CJS) model assumptions (Williams et. al., 2001): a) Every marked animal (recreational vessel) present in the population at sampling period i has the same probability of being recaptured or resighted. b) Every marked animal (recreational vessel) present in the population immediately following the sampling in period i has the same probability of survival until sampling period i+1. c) Marks are neither lost nor overlooked, and are recorded correctly. d) Sampling periods are instantaneous and recaptured animals are released immediately. e) All emigration from the samples area is permanent. f) The fate of each animal (recreational vessel) with respect to capture and survival probability is independent of the fate of any other animal (recreational vessel). Based on these assumptions of the CJS model, we think that capture-recapture histories of offshore recreational vessels can be used to estimate offshore recreational abundance in the study area. Methods Capture histories were conducted for each offshore recreational vessel photographed. The methodology to obtain the recreational vessel capture histories is described in the sampling design section of this report. Sampling days within each season were analyzed in program CloseTest (Stanley and Richards, 2005) to test whether or not offshore recreational vessels population is closed to additions and deletions (no emigration, immigration, births, or deaths) (Armstrup, et.al., 2005). 38
50 We ran a number of Cormack-Jolly-Seber (CJS) models. We followed the model notation used by Cooch and White (2015), where (t) denote models that allow for the parameters to vary over time and (.) denote models that assume that any of the parameters are constant. The parameters used for estimating superpopulation (N-hat) were apparent survival (ϕ i ), probability of recapture (p i ), probability of entry (b i ). For each treatment within each season the following models were tested: - All variables time dependent: ϕ(t) p(t) b(t) - Apparent survival probability constant and the other variables time dependent: ϕ(.) p(t) b(t) - Probability of capture constant and the other variables time dependent: ϕ(t) p(.) b(t) - Only probability of entry is time dependent: ϕ(.) p(.) b(t) Not all parameters in the model are identifiable (Schwarz and Arnason, 1996). To mitigate this issue, when models in which survival probability (ϕ) and/or probability of recapture (p) are allowed to vary in time, we followed the approach suggested by Williams and others (2011), where the probability of recapture was set p 1 =p 2 and p k =p k-1 (where k is the final sample occasion). The time intervals were adjusted for time elapsed between surveys. We estimated the apparent survival and encounter probability parameters using a logit link function, a mlogit(1) function was used to estimate the probability of entry parameters, and the superpopulation size was estimated using a log link function (Cooch and White, 2015). The gross superpopulation size (N-hat) is a derived parameter of the POPAN model. It includes all the vessels that are available to be detected during at least one survey because they enter the population (net superpopulation size N) and recreational vessels that are never available to be detected because they enter and leave the population between consecutive surveys (Williams, et.al. 2011). Goodness-of-fit (GOF) test for the CJS model was performed in program RELEASE (implemented in program MARK). When overdispersion was detected the variance inflation factor (ĉ or c-hat) was estimated using the bootstrapping GOF, resulting in a quasi-akaike Information Criterion (QAIC). Models were ranked and compared using AIC or QAIC. Models with the lowest AIC (or QAIC) values were most supported by the data. When appropriate the abundance estimate was calculated using model average (Williams et al., 2011). Results Over the course of the 17 months of data collection, 39,317 events were recorded which involved different vessel categories (e.g., commercial, recreational, and military). The majority of vessels sightings correspond to recreational vessels (Table 28). The greatest number of events (45%) were recorded at St. Johns inlet, followed by St. Augustine inlet (31%), and St. Marys inlet (23%). 39
51 Table 28. Number of events recorded at each inlet, by vessel category Code Vessel Type St. Augustine St. Johns St. Marys Inlet Inlet Inlet Total CA Cargo ships T Tug boats SH Shrimp boats CF Commercial fishing CR Crab boats H Head boat (big) H(S) Head boat (small) O Other (law enforcement, gov, mil) ,407 F Open fisherman ,517 CC Cabin cruisers ,668 R Runabouts ,476 W Walk-around boats ,002 S Sailing ,191 OF Offshore boats ,437 P Pontoon boats J Jet Skies K Kayaks WR Wind riders UN Unknown Total 12,324 (31%) 17,875 (45%) 9,118 (23%) 39,317 Recreational vessels (86%) comprised most of the maritime traffic in the study area and further analysis was conducted only on this category, which, for the purpose of this study, includes: open fisherman, offshore, cabin cruisers, runabouts, walkarounds, pontoon, and sailing vessels. Figure 19 shows the number of recreational vessel sightings by inlet (using bar chart) and the average air temperature (degrees celcius) observed for each of the 64 sampling days (line chart). As expected, as temperature increased so did the number of sightings. We accounted for this variation by analysing the data by seasons: Winter (December, January, February), Spring (March, April, May), Summer (June, July, August), and Fall (September, October, and November). 40
.")
52 Figure 19. Number of recreational vessel sightings by inlet (bar chart) and the average air temperature observed during sampling days. In total, 33,497 sightings of recreational vessels were recorded. After accounting for multiple sightings of the same vessel, either by sampling day or on different seasons, we calculated the capture-recapture history for 10,464 unique vessels IDs (Table 29). Based on the number of sightings per vessel throughout the different seasons, there were more sightings of offshore recreational vessels during the spring and summer seasons. Table 29. Summary of the number of sightings per sampling day and season. With multiple sightings by With multiple sightings within # Identified sampling day and season season Sampling Season Vessels Mean Mean days by # Min Max # Min Max (std. dev) (std. dev) season Winter ,425 2, , (1.12) (0.43) Spring ,293 6, , (1.64) (0.66) Summer ,690 8, , (1.93) (0.85) Fall ,444 4, , (1.55) (0.65) Winter ,112 2, , (1.14) (0.41) Spring ,528 4, , (1.31) (0.55) Total 14,492 30,021 18,
.")
53 There were two sampling dates with large numbers of recreational vessel sightings (May 7, 2011 and April 28, 2012). Both dates coincide with a number of activities in the area (e.g., the reenactment of Ribault s arrival to Mayport in 1562). We decided to excluded the information from these two days because they correspond to special occasions and depart from the regular recreational boating traffic in the study area (Fig. 20). May 7, 2011 April 28, 2012 Figure 20. Unique vessels sightings by sampling day. A large number of vessels were sighted on sampling day 17 (May 7, 2011) and day 61 (April 28, 2012) as compared with other sampling days. Table 30 provides a description of the number of unique vessel sightings by season. About 80% of offshore recreational vessels were observed over one season, 15% were observed over two seasons, and 4% were observed over 3 seasons, and only 1% of vessels were observed year around. In most cases (except for summer 2011) the number of recaptured vessels was relatively low when compared with the number of vessels caught (Fig. 21). 42
54 Table 30. Summary of observed seasonal capture and recapture histories of observed recreational vessels (2011) in the study area. Seasonal History Count Description ,746 Observed only in SUMMER ,301 Observed only in SPRING ,729 Observed only in FALL Observed only in WINTER Observed in SPRING and SUMMER Observed in SUMMER and FALL Observed in SPRING and FALL Observed in WINTER and SPRING Observed in WINTER and SUMMER Observed in WINTER and FALL SPRING-SUMMER-FALL WINTER-SPRING-SUMMER WINTER-SUMMER-FALL WINTER-SPRING-FALL Year around Total 9,643 Figure 21. Summary of recreational vessel captures (on left) and recaptures (on right) by season. In the case of offshore recreational vessels, since we did not mark the vessels but used already established marks (e.g., the vessel name, vessel number, or vessel characteristics), we reasoned that the probability of capture does not depend on previous capture history (no behavioral response). However, it is possible that individual capture probability may be heterogeneous across boaters, especially between the days of the week that the recreational vessel was observed. We accounted for this variation by stratifying our sampling day based on temporal boating reports for other areas in Florida (Sidman et al., 2005). 43
55 The majority of recreational boaters were recorded only within a specific day of the week treatment (80.8%). Over 12% of vessels were observed over the Weekend and Holiday treatments. Less than 1% of vessels were sighted between all our days of the week treatments (Table 31). Table 31. Summary of recreational vessel captures and recaptures histories based on the days of the week: Weekend (Friday to Sunday), Mon-Thu (Monday to Thursday), and Holiday (varies). History Day of the week # of sightings Percentage 100 Observed on WEEKEND only 4, % 001 Observed on HOLIDAY only 1, % 010 Observed on MON-THU only 1, % 101 Observed on WEEKEND and HOLIDAY 1, % 110 Observed on WEEKEND and MON-THU % 011 Observed on MON-THU and HOLIDAY % 111 Observed on all % Overall there were more sightings of recreational vessels over the weekend treatment (N=2,091; min=185; max=471). The highest number of sightings for the weekend treatment was recorded over the summer (2011). Over the holiday treatment we also observed a great number of vessel sightings (N=2,069; min=111; max=646), especially for spring and summer The lowest number of vessel sightings was observed for the Mon-Thu treatment (Table 32, Fig. 22). Analysis of variance (ANOVA) revealed a significant difference between the number of observed vessels for the three day of week treatments (F=12.3, p<0.05). The Tukey post-hoc test showed no significant difference in the number of observed vessels between the weekend and holiday groups (p = 0.925). However, there were significant differences between the weekend days and Mon-Thu groups (p <0.05), as well as between holidays and Mon-Thu groups (p<0.05). Since there were no statistical significant differences between the weekend and holiday treatment, further analysis was performed by combining these two previous categories into one named Weekend-Holiday. Table 32. Descriptive statistics of the number of offshore recreational vessels observed by day of the week treatments. Weekend (Friday to Sunday), Mon-Thu (Monday to Thursday), and Holiday (varies). Treatment Occasions Mean Std. Deviation Min Max 95% CI Weekend Mon-Thu Holiday Total
56 Figure 22. Box plot of the number of offshore recreational vessels observed by day of the week treatment. Weekend (Friday to Sunday), Mon-Thu (Monday to Thursday), and Holiday (varies). Abundance estimates We used a capture-recapture approach to estimate seasonal abundance of offshore recreational vessels in the study area. The population of offshore recreational vessels cannot be considered as closed because the total number of individuals is changing through additions (immigration and new vessels) or deletions (emigration and vessels out of circulation) over time (Armstrup, et. al. 2005). This assumption was confirmed using the program CloseTest (Stanley and Richards, 2005). We found that for all the study seasons the offshore recreational vessel population is open to gains by immigration and new recreational vessels and also to losses by emigration and retiring vessels (Table 33). Table 33. CloseTest results for the capture-recapture dataset of offshore recreational vessels by season. Low p-values suggest population not closed. Season Vessel captures Occasions Chi-square Degrees of freedom p-value Winter , Spring , Summer , Fall , Winter , Spring , As expected, the estimated population size varied seasonally (Table 34). The lowest abundance estimate was for winter followed by fall. The population estimate for spring and summer seasons were the highest. The seasonal abundance estimates fluctuated, with higher abundance estimated for the spring 2011 and summer 2011 seasons. The coefficient of variation (CV), which is a measure of precision, varied by treatment and season. Weekends and holidays CV ranged from 3.8% 32.2%. The CV for the Monday-Thursdays treatment was smaller than the one observed for the previous treatment, ranging from 2.6 % 10.2%. In general, there were more sampling occasions over the weekend and holiday treatment than over the Mon-Thu treatment (Table 34 and Fig. 29). 45
57 Season Winter 2011 Winter 2012 Spring 2011 Spring 2012 Summer 2011 Fall 2012 Table 34. Model selection results from capture-recapture for the seasonal open-population of offshore recreational vessels using POPAN parametrization in Program MARK. Apparent survival (ϕ i ), probability of recapture (p i ), probability of entrance (b i ), variance inflation factor (chat), QAIC, super-population size estimate (N-hat), standard error (SE), 95% confidence intervals (CI), and coefficient of variation (CV). Treatment Weekends & Holidays Occasions (Caught) Supported model 5 (1318) ϕ(.) p(t) b(t) ϕ(t) p(t) b(t) ϕ(.) p(.) b(t) Mon-Thu 3 (131) ϕ(.) p(.) b(t) ϕ(t) p(t) b(t) ϕ(t) p(.) b(t) Weekends & Holidays 7(950) ϕ(.) p(t) b(t) ϕ(t) p(t) b(t) Mon-Thu 3 (186) ϕ(.) p(.) b(t) ϕ(t) p(.) b(t) Weekends & 7(2205) ϕ(t) p(t) b(t) Holidays ϕ(.) p(t) b(t) Mon-Thu 4 (478) ϕ(.) p(.) b(t) ϕ(t) p(.) b(t) ϕ(.) p(t) b(t) ϕ(t) p(t) b(t) c-hat QAICc QAICc Weight N-hat SE 95% CI Lower Upper CV 5, ,236 7, % , % 4,914 1, , % % 10, , % 3,887 14, , % Weekends & 6(1506) ϕ(t) p(t) b(t) , ,943 9, % Holidays ϕ(.) p(t) b(t) Mon-Thu 2(324) ϕ(t) p(.) b(t) ϕ(t) p(t) b(t) % Weekends & 9(3430) ϕ(t) p(t) b(t) , ,302 9, % Holidays Mon-Thu 3 (436) ϕ(t) p(.) b(t) , ,248 3, % ϕ(.) p(t) b(t) ϕ(.) p(.) b(t) Weekends & Holidays 10(2170) ϕ(.) p(t) b(t) ϕ(t) p(t) b(t) ϕ(t) p(.) b(t) , ,006 9, % Mon-Thu 3(349) ϕ(t) p(t) b(t) , % 46
, Winter 2012 (Wi2), Spring 2011 (Sp1), Spring 2012 (Sp2), Summer 2011 (Sum), and Fall 2011 (Fal).")
58 Figure 23. Super-population size estimates with error bars (gray lines) by day of the week treatment for each of the studied seasons. Winter 2011 (Wi1), Winter 2012 (Wi2), Spring 2011 (Sp1), Spring 2012 (Sp2), Summer 2011 (Sum), and Fall 2011 (Fal). Even though we observed the highest number of vessels in the study area during summer 2011, population estimates for spring 2011 are higher than the ones calculated for the summer This may be explained by the fact that over the summer 2011 we recorded the highest percentage of recaptures (34%). Capture-recapture analysis takes this information into account while performing the estimation of population size (Fig. 24) Figure 24. Percentage of recreational vessels recapture during the weekend and holiday treatment. Offshore recreational population size estimates varied by year. Based on the analysis there was a greater abundance of offshore recreational vessels during the winter and spring seasons in 2011 than during winter and spring
59 Part 4 - Mapping Offshore Recreational Vessels and Right Whales Co-Occurrences Background The Southeast United States (SEUS) is a very important area for human activities. It involves a great amount of vessel traffic involving military, commercial, and recreational vessels. The area also corresponds with the wintering habitat of the North Atlantic right whales (Eubalaena glacialis), which use it as nursing and calving ground from December to March. Waring and others (2013) estimated that the current population or E. glacialis comprises about 450 individuals. Due to the precarious situation of E. glacialis, which was almost brought to extinction due to whaling, several management actions to protect the species have been developed. However, Kraus and other (2005) suggested that the recovery of this species has been prevented by low reproductive rates and declining survival probabilities, and by right whale mortalities due to collisions with ships and entanglements in fishing gear. Some studies have documented the probability of co-occurrence between right whales and commercial ships (65 ft. or greater) in the main habitats of E. glacialis (Ward-Geiger et al., 2005; Fonnesbeck et al., 2008; Vanderlaan et al., 2008; Lagueux et al., 2011). However, information about the spatial distribution and overlap of recreational vessels (less than 65 ft. in length) with right whales is limited (Hain et al., 1994). By law, all vessel traffic cannot approach or remain within 500 yards of E. glacialis. However, in the previous section of this report, we estimated that approximately 5,000 recreational vessels use the study area during the winter months and that most of the vessel traffic in the study area is composed of recreational vessels. The Early Warning System (EWS) reported 78 whale\vessel interactions 4 in this area from Therefore, in this section we analyzed the spatial and monthly relative probability of right whales and recreational vessels co-occurrence based on sighting per unit effort (SPUE) reported by the EWS. This information may be used by managers and educators to improve current management, education, and communication strategies to promote compliance with right whale regulations. Method Aerial surveys conducted by the Early Warning System (EWS) provided spatial and temporal information about right whales and recreational vessel sightings from the right whale seasons in the northeast Florida and southeast Georgia Region. The EWS is an extensive aerial survey network in right whale calving and nursing grounds to locate whales and alert mariners of their presence of whales. From December to March, the EWS flew established track lines every day (weather permitting) during the right whale calving and nursing season, from December to March. Details about the protocol followed by the EWS are described by Jackson and Pitchford (2009). Monthly relative probabilities of co-occurrence were produced following the method used by Fonnesbeck et al. (2008), Vanderlaan et al. (2008), and Williams and O Hara (2010). This 4 The EWS defines a right whale\recreational vessel interaction as an event when the survey team visually determined that a vessel was on a course that could result in the vessel and whale(s) being less than one nautical mile (1.8 km) apart. 48
60 method estimates the relative probability of whale and vessel co-occurrences using density estimates of right whales (Equation 1) and vessel sightings (Equation 2). Where the relative probability (P rel ) that a whale or a vessel occupies a grid cell, i, is relative to other cells in a domain of n cells. Then, a multiplicative approach is used to calculate the relative probability of co-occurrence (Equation 3). Equation 1. Relative probability that a whale occupies grid cell i: Equation 2. Relative probability that a vessel occupies grid cell i: P rel (Whale) i = Whale sighthings per unit effort i n Whale sightings per unit effort i i=1 P rel (Vessel) i = Vessel sightings i n Vessel sightings i i=1 Equation 3. Probability of encounter: P rel (Encounter) i = P rel (Whale) i x P rel (Vessel) i n P rel (Whale) i x P rel (Vessel) i i=1 To accommodate for disparities in our study area (e.g., coastline) a sampling grid cell (5.56 x 5.56 km) was overlaid in the study area. Figure 25 shows the area covered by the EWS aerial surveys in relationship with the study area of the survey map used in this report for previous sections. Maps showing the relative probability for whales, recreational vessels, and cooccurrence were produced in ArcGIS 10.3 using an equidistant Universal Transverse Mercator (UTM) projection. Results From December 2009 to March 2013 the EWS documented 1,038 sightings of right whales, which involved 2,325 individual whales. At the same time, they reported 5,467 sightings of recreational vessels involving 10,850 individual vessels (Table 35). Right whales and recreational vessel sightings varied seasonally. Table 35 shows that the greatest number of right whale sightings occurred during the right whale season. In the case of recreational vessels, the greatest number of sightings was reported for the right whale season. Over the 5 right whale seasons, the survey effort also varied. The season reported the greatest number of right whale sightings per unit of effort (an average of 6 sightings per effort). The number of recreational vessel sightings for the was the lowest (average of 110 sightings per aerial flight) when compared with the other seasons. The EWS started documenting vessel sighting over the season, therefore the lower number of recreational vessels for this season could be an artifact of data collection. The right whale season reported an estimated 4 right whales per aerial flight. During the season the number of recreational vessel sightings almost tripled despite a lower number of aerial surveys. For the remaining right whale seasons ( ) the EWS reported between 2-3 right 49

61 whale sightings per aerial survey. The number of recreational vessel sightings has not been constant, with reports as low as 377 vessel sightings/aerial survey during the season, up to 981 vessel sightings/aerial survey in the right whale season. Figure 25. Area covered by aerial surveys conducted by the Early Warning System (EWS). For reference, the map also shows the area covered by the map-based survey (in red). 50
62 Table 35. Summary of right whale (RW) and recreational vessel sightings obtained by the EWS during the right whale seasons. Season RW sightings RW total number Vessel sightings Vessel total number Effort days Interactions Dec Jan Feb Mar Apr Dec Jan Feb Mar Dec Jan Feb Mar Dec Jan Feb Mar Dec Jan Feb Mar The North Atlantic right whale feeds and mates in Canada and the northeast United States. The relative probability of E. glacialis calculated using the SPUE method shows the migratory pattern of these whales. At the beginning of each season (December), right whale sightings were mainly distributed in the study area, especially in the center (latitudes of 30 o 30 N, near St. Johns inlet) and in the northern portions. As the season progressed (January and February), the greater numbers of sightings were located in the southwest portion of the study area (near St. Augustine inlet). By the end of the right whale calving season whales moved back to the central and northern portions of the study area (Fig. 26). From December to February most whale sightings were from longitudes between 81 o 30 W and 81 o 0 W, which corresponds to areas closer to shore (up to km offshore). In March, the longitude of right whale sightings shifted to areas farther away from shore, between 81 o 0 W and 80 o 45 W longitudes. The relative probability of recreational vessel occurrence was concentrated near the three main inlets and remained similar between seasons. The longitudinal distribution of recreational vessels was wider in December and January with a high probability of recreational vessels occurring up to 35km offshore (about 81 o 0 W) for vessels departing from St. Johns inlet, and up to 30 km offshore for vessel using the St. Augustine inlet (Fig. 26). Over February and March, vessel tended to remain closer to shore and up to km offshore. 51
63 The highest probability of right whales and recreational vessel co-occurrence was located in areas associated with the main inlets. Seasonally, the greatest probability of co-occurrence varied depending on the movements of right whales. In December, areas near the St. Johns river entrance up to 25 km west and St. Augustine entrance up to 20 km west showed the highest probabilities. In February, areas closest to St. Johns and St. Augustine (up to 15 km west) showed the greatest probabilities of co-occurrences. In March, as whales moved back to the northeast habitats, the highest probabilities of right whale and recreational vessel co-occurrence was observed at St. Johns and St. Marys inlets (Fig. 27). These results were validated using direct reports of right whale/vessel interactions documented by the aerial survey crew. There is a good level of agreement between our estimates of relative probability of right whale\recreational vessel co-occurrence and the direct observations. Figure 28 shows the cumulative ( ) relative probability of right whales and recreational vessel co-occurrence. Generally, the highest probabilities are located near the St. Johns river entrance up to 25 km offshore, followed by areas near St. Augustine inlet and up to 20 km offshore. Areas near the St. Marys river entrance showed a high probability of co-occurrence, but it remained nearest to shore (about 5 km west). Direct observations of right whale\recreational vessel interactions reported by the EWS seem to validate the relative probability of co-occurrence obtained using the SPUE method. The analysis involved in the calculation of the SPUE method are relatively straightforward and easy to calculate. Additionally, the results of this analysis can be accessed by managers in a timely manner (as soon as the aerial records are available). This kind of analysis does not require external information that may influence the distribution of right whales, recreational vessels, and its co-occurrence. However, this method has its limitations; for instance it does not account for imperfect detectability and limited coverage area (Guisan et al., 2002; O Connor, 2002). Therefore, future studies should explore the use of other approaches such as modeling techniques that allow for testing the effects of external variables and that can be used to make predictions in space or time. Furthermore, Tixerant and others (2010) suggested that because the marine environment is very complex with a large number of temporal and spatial variables interacting at different scales, a modeling approach is more suitable to study man/environment interactions. 52
, recreational vessels (middle), and right whale/ recreational")
64 Figure 26. Monthly relative probability of right whales (on left), recreational vessels (middle), and right whale/ recreational vessel co-occurrence (on right). Analyses were performed based on data from right whale seasons. 53

65 Figure 27. Monthly relative probability of right whale/recreational vessel co-occurrence. Analyses were performed based on data from right whale seasons. Black stars represent direct observations of right whale/recreational vessel co-occurrences reported by the Early Warning System (EWS). 54

66 Figure 28. Cumulative relative probability of right whale/recreational vessel co-occurrence. Analyses were performed based on data from right whale seasons. Black stars represent direct observations of right whale/recreational vessel co-occurrences reported by the Early Warning System (EWS). 55
67 Part 5 Summary and Conclusions The purpose of this study was (1) the development of spatial data sets within a geographic information system (GIS) for the offshore waters of the northeast Florida and southeast Georgia region to map boating patterns in the study area, (2) the analysis of trip information provided by boaters to describe the preferences and behaviors of boaters who use the offshore waters of the study area, (3) to estimate relative seasonal abundance of offshore recreational boaters, and (4) to map right whales and recreational vessel co-occurrence. We used a map-based survey distributed to recreational boaters observed transiting the main navigable inlets in the study area (St. Marys, St. Johns, and St. Augustine). A compilation of the responses to a subset of survey questions reveals that the characteristics and preferences of typical respondents to the survey can be described as follows: Is a year-round resident in the study area (86% Florida and 33% Georgia) and is approximately 55 years of age; Has, on average, 20 years of boating experience in the study area and 69% of respondents have taken a boating safety or seamanship course; Owns an open fishing vessel (59%); Operates a vessel with an average length of 23 feet; Mainly uses boat ramps (59%) to access inlet and offshore waters in the study area; Prefers boating facilities that are close to inlets, offshore waters, and\or close to favorite boating destinations, have adequate and safe parking, and have convenient hours of operation; The most popular boat ramps in the study area were Mayport, Vilano Boat Basin, and Dee Dee Bartels, Joe Calucci, Lighthouse Park, and Jim King Park; The most popular marinas were Camache Cove, Conch House Marina, Fernandina Harbour, and Amelia Island Yacht Basin; Takes an average of three to eight trips per season (primarily on weekends), with more trips taken during the spring and summer months (March through August) and fewer trips during fall and winter months (September through February); Begins a trip between 7-8AM (depending on the season) and spends about 8 hours on the water, and lastly; Perceives that there is an excess of regulations in the study area, particularly with regard to fishing regulations. 56
68 The first analytical component of this study focused on spatial patterns of offshore use and seasonal boating patterns from reported trip data. Density analysis and the Getis & Ord G*- statistic (a measure of localized spatial dependence) were used to map and evaluate boating routes identified by mail survey respondents. A visual inspection of the resulting maps shows that areas near inlets have the highest probability of occurrence throughout the year and experience some seasonal differences in use intensity. The land-based inlet observations reveal that St. Johns inlet recorded the most vessel traffic (45%), followed by St. Augustine inlet (31%) and St. Marys inlet (23%). It also showed that most of the maritine traffic in the study area is composed of recreational vessels (86%). We used a capture-recapture approach to estimate seasonal abundance of offshore recreational vessels in the study area. Winter showed the lowest abundance estimate, followed by the fall season. The population estimate for spring and summer seasons were the highest. The seasonal abundance estimates fluctuated, with higher abundance estimated for the spring 2011 and summer 2011 seasons. Monthly spatial analysis of recreational vessel and right whale sightings shows that the probability of co-occurrence may be driven by the migratory movement of the right whales while in the study area. Overall, the highest relative probabilities of right whale\recreational vessel cooccurrence are located near the St. Johns river entrance up to 25 km offshore, followed by areas near St. Augustine inlet and up to 20 km offshore. Areas near St. Marys river entrance showed a high probability of co-occurrence but it remained nearest to shore (about 5 km west). 57
69 Literature Cited Amstrup, S. C., T. L. McDonald, and B. E. Manly Handbook of capture-recapture analysis. Princeton University Press, USA. Antonini, G., Fann, D., and Roat, P A Historical Geography of Southwest Florida Waterways Volume One: Anna Maria Sound to Lemon Bay. Florida Sea Grant Publication SGEB47. University of Florida, Gainesville, Florida. Cooch, E. G., and G. C. White editors Program MARK. A gentle introduction., 14th Edition. Falk, J., Graefe, A., Drogin, E., Confer, J., Chandler, L Recreational Boating on Delaware s Inland Bays: Implications for Social and Environmental Carrying Capacity. Delaware Sea Grant Publication DEL-SG University of Delaware, Newark. Fonnesbeck, C., Garrison, L., Ward-Geiger, L., and Baumstark, R Bayesian hierarchical model for evaluation the risk of vessel strikes on North Atlantic right whales in the SE United States. Endangered Species Research VOL.6: FLHSMV Florida vessel owners: Statistics Florida Department of Highway Safety and Motor Vehicles. Retrieved on February 1, 2012 from Getis A, and Ord J., K Local Spatial Statistics: An Overview. In Longley P, Batty M (eds) Spatial Analysis Modeling in a GIS Environment. Cambridge, GeoInformation International Gorzelany, J. F Recreational boating activity in Miami-Dade. Mote Marine Laboratory. Goswami, V. R., M. D. Madhusudan, and K. U. Karanth Application of photographic capturerecapture modelling to estimate demographic parameters for male Asian elephants. Animal Conservation 10(3): Gray, D.L, Canessa, R., Keller, P., Dearden, P., and Rollins, R Spatial characterization of marine recreational boating: Exploring the use of an on-the-water questionnaire for a case study in the Pacific Northwest. Marine Policy 35(3), Guisan, A., Edwards, T., and Hastie, T Generalized linear and generalized additive models in studies of species distributions: setting the scene. Ecological Modelling 157: Hain, J., Ellis, S., and Seward, P Characterization of vessel traffic at the St Johns and St. Marys channel entrances, northeast Florida, January 1993.Final Report for MMC contract T NTIS PB pp. Jackson, K., and Pitchford, T Aerial Surveys for ship strike mitigation and other field observations of North Atlantic right whales (Eubalaena glacialis) off the East Coast of Florida December 2008-March Southern Early Warning System. Florida Fish and Wildlife Conservation Commission and Fish and Wildlife Research Institute. St. Petersburg, FL. 56pp. 58
70 Kraus, S. D., Brown, M. W., Caswell, H., Clark, C.W., Fujiwara, M., Hamilton, P. K., Kenney, R., Knowlton, A., Landry, S., Mayo, C. A., McLellan, V.A., Moore, M. J., Nowacek, D. P., Pabst, D.A., Read, A., Rolland, R North Atlantic right whales in crisis. Science. Vol. 309(5734): Lagueux, K., Zani, M., Knowlton, A., and Knowlton, S Response by vessel operators to protection measures for right whales Eubalaena glacialis in the southeast US calving ground. Endangered Species Research. VOL.14: Letson, D Economic Value and Environmental Quality: Florida s Coastal Resources, in Marine Recreational Fishing in Florida Coastal Environmental Resources: A Guide to Economic Valuation and Impact Analysis. Letson D. & Milon, J.W., eds. Florida Sea Grant Report, SGR 124. University of Florida, Gainesville. Madon, B., C. Garrigue, R. Pradel, and O. Gimenez Transience in the humpback whale population of New Caledonia and implications for abundance estimation. Marine Mammal Science 29(4): O Connor R (2002) The conceptual basis of species distribution modeling: time for a paradigm shift? In JM Scott, PJ Heglund, ML Morrison, JB Haufler, MG Raphael, WA Wall, and FB Samson (Eds.). Predicting species occurrences. Issues of accuracy and scale. Island Press. USA. Schwarz, C. J., and A. N. Arnason A general methodology for the analysis of capture-recapture experiments in open populations. Biometrics 52(3): Sidman. C., and Flamm, R A Survey of Methods for Characterizing Recreational Boating in Charlotte Harbor, Florida. Florida Sea Grant Publication TP-109. University of Florida, Gainesville, Florida. Sidman, C, Fik, T., and Sargent, W A Recreational Boating Characterization for Tampa and Sarasota Bays. Florida Sea Grant Publication TP-130. University of Florida, Gainesville, Florida. Sidman, C., Fik, T., Swett, R., Sargent, B. and Fann, S Estimating Land and Water-Side Service Areas and Use Potential for Boat Ramps: A Case Study of Tampa and Sarasota Bays. Florida Sea Grant Publication TP-142. University of Florida, Gainesville, Florida. Sidman, C., Swett, R., Fik, T., Fann, S., Fann, D. and Sargent, B A Recreational Boating Characterization for the Greater Charlotte Harbor. Florida Sea Grant Publication TP-150. University of Florida, Gainesville, Florida. Sidman, C., Swett, R., Fik, T., Fann, S, and Sargent, B A Recreational Boating Characterization of Sarasota County. Florida Sea Grant Publication TP-152. University of Florida, Gainesville, Florida. Sidman, C., Fik, T., Swett, R., Sargent, B., Fletcher, J., Fann, S., Fann, D., and Coffin, A A Recreational Boating Characterization of Brevard County. Florida Sea Grant Publication TP-160. University of Florida, Gainesville, Florida. Smallwood, C. B., Beckley, L.E., Moore, S.A., and Kobryn, H.T Assessing patterns of recreational use in large marine parks: a case study from Ningaloo marine Park, Australia. Ocean & Coastal Management 54(4):
71 Stanley, T. R., and Richards, J. D Software review: a program for testing capture-recapture data for closure. Wildlife Society Bulletin 33(2): Tixerant, M.L., Gourmelon, F., Tissot, C., and Brosset, D Modeling of human activity development in coastal sea areas. Coastal Conservation 5(4), United States Census Bureau Census. U.S. Census Bureau Retrieved on February 1, 2013 < Vanderlaan, A., Taggart, C., Serdynska, C., Kenney, R., Brown, M.V Reducing the risk of lethal encounters: vessels and right whales in the Bay of Fundy and on the Scotian Shelf. Endangered Species Research. Vol.4: Ward-Geiger, L., Silber, G., Baumstark, R., and Pulfer, T Characterization of ship traffic in right whale critical habitat. Coastal Management, 33: Waring, G., E. Josephson, K. Maze-Foley and P. Rosel U.S. Atlantic and Gulf of Mexico marine mammal stock assessments U.S. Department of Commerce, NOAA Technical Memorandum NMFS NE pp. Available from National Marine Fisheries Service, 166 Water Street, Woods Hole, MA Vaske, J.J Survey research and analysis: applications in parks, recreation and human dimensions. Venture Publishing, Inc. 635pp. West, N Recreational Boating and Energy-Related Shipping on Narragansett Bay: A Study of Environmental Attitude and Behaviour. Report submitted to the Rhode Island CEIP, Governor s Energy Office. Providence, Rhode Island. White, G. C., and K. P. Burnham Program MARK version Widmer, W.M., Underwood, A.J Factors affecting traffic and anchoring patterns of recreational boats in Sydney Harbour, Australia. Landscape and Urban Planning 66: Wildlife Resources Division Wildlife resources information system. Department of Natural Resources. Georgia. Retrieved on February 1, 2012 from gdnr_vrs/downloads/boatdata.do. Williams, B., J. D. Nichols, and M. Conroy Analysis and management of animal populations modeling, estimation, and decision making. Academic Press, USA. Williams, R., O'hara, P Modeling ship strike risk to fin, humpback and killer whales in British Columbia, Canada. Cetacean Res. Manage. 11(1):
72 Appendix A. Questionnaire and Correspondence Appendices Cover letter 61
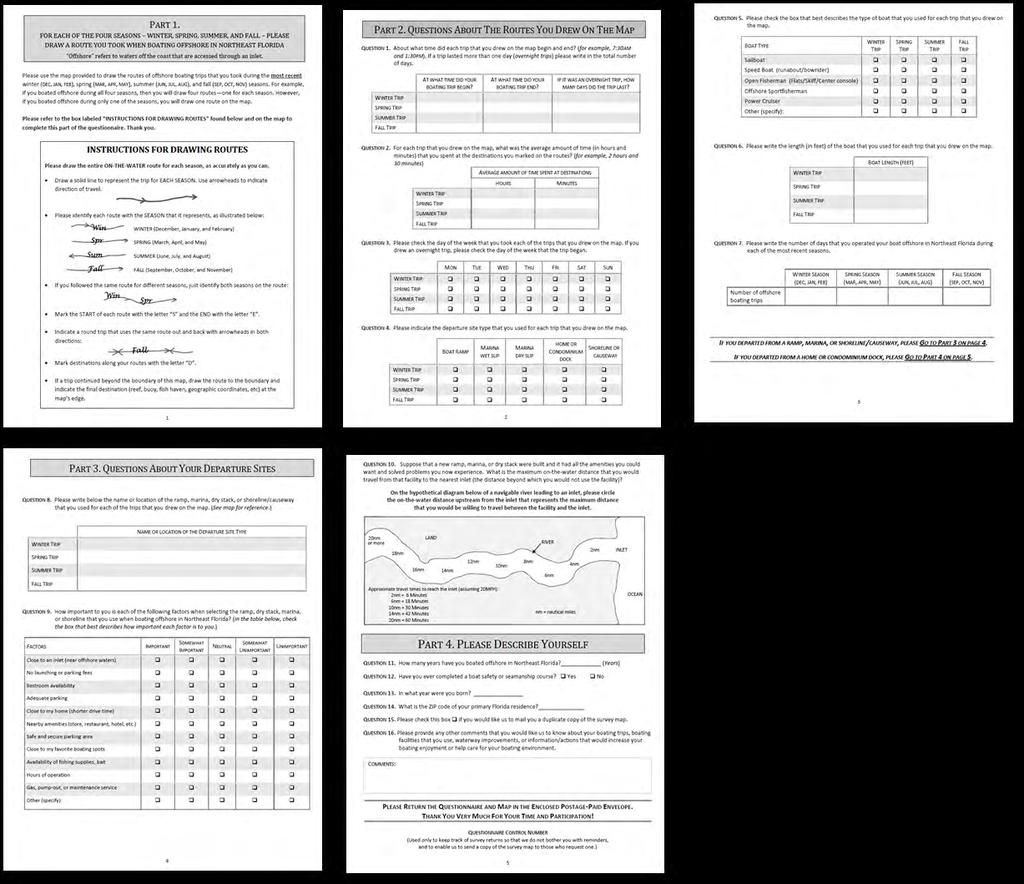

73 Questionnaire 62
Inlet Specific and Seasonal Variation in Vessel Use Patterns: The case of the Northeast Florida Region
 Inlet Specific and Seasonal Variation in Vessel Use Patterns: The case of the Northeast Florida Region Nancy Montes Robert Swett University of Florida Automatic Identification System (AIS) Ships 300 or
Archival copy: for current recommendations see or your local extension office.
 This is a publication of the Florida Sea Grant College Program, supported by the National Sea Grant College Program of the United States Department of Commerce, National Oceanic and Atmospheric Administration
A publication of the University of Florida Sea Grant Program (project numbers and ). The project was funded by Bay County through
. The project was funded by Bay County through") A publication of the University of Florida Sea Grant Program (project numbers 00067209 and 00069999). The project was funded by Bay County through the University of Florida Bay County Extension Program;
A publication of the University of Florida Sea Grant Program (project numbers 00067209 and 00069999). The project was funded by Bay County through the University of Florida Bay County Extension Program;
This publication was supported by the National Sea Grant College Program of the U.S. Department of Commerce s National Oceanic and Atmospheric
 This publication was supported by the National Sea Grant College Program of the U.S. Department of Commerce s National Oceanic and Atmospheric Administration (NOAA), Grant No. NA16RG-2195; the Florida
RESEARCH Massachusetts Recreational Boater Survey. Project Summary
 Coastal and Marine Spatial Planning RESEARCH Project Summary 2010 Massachusetts Recreational Boater Survey The 2010 Massachusetts Recreational Boater Survey gathered spatial and economic data relating
Coastal and marine recreation in New England is ingrained in the region s economic and
 RECREATION Coastal and marine recreation in New England is ingrained in the region s economic and social fabric. Recreation on the ocean and coast includes many of New Englanders most time-honored and
MARKET STUDY FOR BOATING ON THE MINNESOTA WATERS OF LAKE SUPERIOR
 MARKET STUDY FOR BOATING ON THE MINNESOTA WATERS OF LAKE SUPERIOR MARKET STUDY FOR BOATING ON THE MINNESOTA WATERS OF LAKE SUPERIOR CANADA Minnesota Apostle Islands Isle Royale Lake Superior Michigan Wisconsin
Specialized Survey Methods for Recreational Reef Fish Fisheries in Florida
 Specialized Survey Methods for Recreational Reef Fish Fisheries in Florida Beverly Sauls, Research Scientist Fish and Wildlife Research Institute Marine Fisheries Research Saint Petersburg, FL Reef Fish
Redondo Beach Boat Launch Ramp Facility
 Redondo Beach Boat Launch Ramp Facility Feasibility Report for the California Department of Boating and Waterways 2015 Grant Cycle For the City of Redondo Beach Submitted by March 13, 2014 Table of Contents
For-hire Data Collection. Gulf of Mexico Fishery Management Council Red Snapper For-hire Advisory Panel December 2-3, 2014 Tampa, FL
 For-hire Data Collection Gulf of Mexico Fishery Management Council Red Snapper For-hire Advisory Panel December 2-3, 2014 Tampa, FL Southeast Region Recreational Surveys MRIP For-hire Survey APAIS/CHTS
A SURVEY OF 1997 COLORADO ANGLERS AND THEIR WILLINGNESS TO PAY INCREASED LICENSE FEES
 Executive Summary of research titled A SURVEY OF 1997 COLORADO ANGLERS AND THEIR WILLINGNESS TO PAY INCREASED LICENSE FEES Conducted by USDA Forest Service Rocky Mountain Research Station Fort Collins,
Orange County MPA Watch A n n u a l R e p o r t
 Orange County MPA Watch 2 0 1 5 A n n u a l R e p o r t WHAT IS AN MPA? Marine Protected Areas (MPAs) are discrete geographic marine or estuarine areas designed to protect or conserve marine life and habitat.
Final Report, October 19, Socioeconomic characteristics of reef users
 Socioeconomic Study of Reefs in Southeast Florida - Executive Summary By Hazen and Sawyer in association with Florida State University and National Oceanic and Atmospheric Administration, October 19, 2001
World Shipping Council. National Oceanographic and Atmospheric Administration
 Comments of the World Shipping Council Submitted to the National Oceanographic and Atmospheric Administration In the matter of Endangered and Threatened Species; Petition for Rulemaking to Establish a
Overview of Florida s Cooperative East Coast Red Snapper Tagging Program, SEDAR41-DW10. Submitted: 1 August 2014
 Overview of Florida s Cooperative East Coast Red Snapper Tagging Program, 2011-2013 Russell B. Brodie, Justin J. Solomon, Richard Paperno, Theodore S. Switzer, Cameron B. Guenther, and Beverly Sauls SEDAR41-DW10
The Montana Expression 2018: MT Residents Use of Fishing Access Sites & Public Lands and Waterways Values
 University of Montana ScholarWorks at University of Montana Institute for Tourism and Recreation Research Publications Institute for Tourism and Recreation Research 3- Kara Grau The University of Montana
Standardized catch rates of U.S. blueline tilefish (Caulolatilus microps) from commercial logbook longline data
 from commercial logbook longline data") Standardized catch rates of U.S. blueline tilefish (Caulolatilus microps) from commercial logbook longline data Sustainable Fisheries Branch, National Marine Fisheries Service, Southeast Fisheries Science
Standardized catch rates of U.S. blueline tilefish (Caulolatilus microps) from commercial logbook longline data Sustainable Fisheries Branch, National Marine Fisheries Service, Southeast Fisheries Science
Assessment of Guide Reporting & Preliminary Results of Lion Monitoring
 Assessment of Guide Reporting & Preliminary Results of Lion Monitoring Mara Predator Project December 21 Sara Blackburn Laurence Frank maralions@gmail.com lgfrank@berkeley.edu SUMMARY The Mara Predator
EXPLORING MOTIVATION AND TOURIST TYPOLOGY: THE CASE OF KOREAN GOLF TOURISTS TRAVELLING IN THE ASIA PACIFIC. Jae Hak Kim
 EXPLORING MOTIVATION AND TOURIST TYPOLOGY: THE CASE OF KOREAN GOLF TOURISTS TRAVELLING IN THE ASIA PACIFIC Jae Hak Kim Thesis submitted for the degree of Doctor of Philosophy at the University of Canberra
1999 On-Board Sacramento Regional Transit District Survey
 SACOG-00-009 1999 On-Board Sacramento Regional Transit District Survey June 2000 Sacramento Area Council of Governments 1999 On-Board Sacramento Regional Transit District Survey June 2000 Table of Contents
Orange County MPA Watch 2016 A n n u a l R e p o r t
 Orange County MPA Watch 2016 A n n u a l R e p o r t WHAT IS AN MPA? Marine Protected Areas (MPAs) are discrete geographic marine or estuarine areas designed to protect or conserve marine life and habitat.
Orange County MPA Watch A n n u a l R e p o r t
 Orange County MPA Watch 2 0 1 4 A n n u a l R e p o r t WHAT IS AN MPA? Marine Protected Areas (MPAs) are discrete geographic marine or estuarine areas designed to protect or conserve marine life and habitat.
Appendix 9 SCUBA diving in the sea
 Appendix 9 SCUBA diving in the sea Firth of Clyde Forum SMRTS2015 Final Report 195 March 2016 Appendix 9 SCUBA diving in the sea Table A9.1: Summary of sample confidence levels Responses Spatial data Questionnaire
The Mid-Atlantic Recreational Boater Survey
 The Mid-Atlantic Recreational Boater Survey April 2016 Mid-Atlantic Recreational Boater Survey 1 CONTENTS 30TABOUT THE SPONSORS30T... 2 30TEXECUTIVE SUMMARY30T... 3 30TSURVEY OVERVIEW30T... 5 30TECONOMIC
Appendix G Whitewater Recreation Flow Study Plan
 Appendix G Whitewater Recreation Flow Study Plan Study Plan Whitewater Recreation Flow Study Grandfather Falls Hydroelectric Project FERC Project No. 1966 March 2013 An Integrys Energy Group Company Section
Appendix H Recreation and Tourism (Chapter 8) Contents. List of Tables
 Contents. List of Tables") Appendix H Recreation and Tourism (Chapter 8) Contents Trends Data... H-2 CA DMV records... H-2 CA DFG Hunting/Fishing Licenses... H-2 USDA Agricultural Tourism... H-4 United States Forest Service... H-6
Appendix H Recreation and Tourism (Chapter 8) Contents Trends Data... H-2 CA DMV records... H-2 CA DFG Hunting/Fishing Licenses... H-2 USDA Agricultural Tourism... H-4 United States Forest Service... H-6
SOUTH CAROLINA ELECTRIC & GAS COMPANY COLUMBIA, SOUTH CAROLINA
 SOUTH CAROLINA ELECTRIC & GAS COMPANY COLUMBIA, SOUTH CAROLINA SALUDA HYDROELECTRIC PROJECT (FERC NO. 516) BOATING DENSITY STUDY PLAN FINAL SEPTEMBER 2006 Prepared by: SOUTH CAROLINA ELECTRIC & GAS COMPANY
YOUR BOATING HEADQUARTERS. e GUIDE TO... TOURIST AND CONVENTION BUREAU. Jacksonville and surrounding area... docking facilities,
 YOUR BOATING HEADQUARTERS e GUIDE TO... Jacksonville and surrounding area... docking facilities, navigable waters and vacation entertainment. TOURIST AND CONVENTION BUREAU 307 Hogan Street Jacksonville,
Gray Diversion Study Draft Report
 Gray Diversion Study Draft Report Presented to: Maine Turnpike Authority HNTB Corporation January 30, 2014 Table of Contents Section 1. Purpose... 3 Section 2. Data Sources... 3 Section 3. Background...
MEMORANDUM. Existing Operations. City of Clearwater. Michael Herrman. Date: January 26, Seminole Boat Launch Overview. M&N Job No.
 1509 W. Swann Avenue, Suite 225 Tampa, FL 33606 (813) 258-8818 Fax (813) 258-8525 www.moffattnichol.com MEMORANDUM To: From: City of Clearwater Michael Herrman Date: Subject: Seminole Boat Launch Overview
SARASOTA BAY ESTUARY PROGRAM OYSTER HABITAT MONITORING RESULTS: YEAR 1. Jay R. Leverone
 SARASOTA BAY ESTUARY PROGRAM OYSTER HABITAT MONITORING RESULTS: YEAR 1 by Jay R. Leverone Mote Marine Laboratory 1600 Ken Thompson Parkway Sarasota, Fl 34236 to Gary Raulerson Sarasota Bay Estuary Program
Appendix 13 Rowing and sculling in the sea
 Appendix 13 Rowing and sculling in the sea Steve Thompson SMRTS2015 Final Report 251 March 2016 Appendix 13 Rowing and sculling in the sea Table A13.1: Summary of sample confidence levels Responses Spatial
95 Express Annual Operations Report: Fiscal Year
 95 Express Annual Operations Report: Fiscal Year 2014-2015 General The 95 Express Program completed its sixth full Fiscal Year of operations in June 2015. For the FDOT, its Fiscal Year (FY) is from July
Marine Recreational and Commercial Industries and Activities in Lee and Charlotte Counties: Economic Consequences and Impacts
 Marine Recreational and Commercial Industries and Activities in Lee and Charlotte Counties: Economic Consequences and Impacts Betty Staugler Florida Sea Grant Extension Marine Agent & Chuck Adams Florida
CHAPTER 10 TOTAL RECREATIONAL FISHING DAMAGES AND CONCLUSIONS
 CHAPTER 10 TOTAL RECREATIONAL FISHING DAMAGES AND CONCLUSIONS 10.1 INTRODUCTION This chapter provides the computation of the total value of recreational fishing service flow losses (damages) through time
Appendix 21 Sea angling from the shore
 Appendix 21 Sea angling from the shore LUC SMRTS2015 Final Report 342 March 2016 Appendix 21 Sea angling from the shore Table A21.1: Summary of sample confidence levels Responses Spatial data Questionnaire
Reducing Risk of Whale Entanglements in Oregon Dungeness Crab Gear
 Session 3 Reducing Risk of Whale Entanglements in Oregon Dungeness Crab Gear CaseID: 20150703Mn NMFS MMHSRP Permit #: 18786 Overview West Coast Information Framing the problem Summary of West Coast large
MALL CROSSING STUDY. Testing the Effectiveness Of the 4th Street East Crossing. For: City of Charlottesville Neighborhood Development Services
 MALL CROSSING STUDY One-Year Evaluation Final Report Testing the Effectiveness Of the 4th Street East Crossing For: City of Charlottesville Neighborhood Development Services May 2007 By: CHARLOTTESVILLE
JUNEAU SECOND CHANNEL CROSSING WATERWAY USER SURVEY RESULTS
 JUNEAU SECOND CHANNEL CROSSING WATERWAY USER SURVEY RESULTS PREPARED FOR: HDR Alaska, Inc. PREPARED BY: Juneau Anchorage December 2003 TABLE OF CONTENTS Executive Summary...1 Introduction and Methodology...2
A Characterization of Recreational Boating Activity And Boater Compliance with Posted Speed Zones in Palm Beach County
 A Characterization of Recreational Boating Activity And Boater Compliance with Posted Speed Zones in Palm Beach County Final Report Submitted To: Paul Davis Palm Beach County Department of Environmental
PEDESTRIAN ACTION PLAN
 ATTACHMENT 2 CITY OF SANTA MONICA PEDESTRIAN ACTION PLAN CITY OF SANTA MONICA PEDESTRIAN ACTION PLAN This page intentionally left blank EXECUTIVE SUMMARY CHAPTER 1 EXECUTIVE SUMMARY Setting the Stage
CITY OF COCOA BEACH 2025 COMPREHENSIVE PLAN. Section VIII Mobility Element Goals, Objectives, and Policies
 CITY OF COCOA BEACH 2025 COMPREHENSIVE PLAN Section VIII Mobility Element Goals, Objectives, and Policies Adopted August 6, 2015 by Ordinance No. 1591 VIII MOBILITY ELEMENT Table of Contents Page Number
Recreational Saltwater Fishing Industry Trends and Economic Impact January 2007
 Document was created exclusively for RISAA and the information contained herein is not to be disclosed without their expressed permission Recreational Saltwater Fishing Industry Trends and Economic Impact
Updated landings information for the commercial fisheries in Puerto Rico with emphasis on silk and queen snapper and parrotfish fisheries
 Updated landings information for the commercial fisheries in Puerto Rico with emphasis on silk and queen snapper and parrotfish fisheries Nancie J. Cummings and Daniel Matos-Caraballo SEDAR 26-DW-03 Date
LAKE ONTARIO FISHING AND FISH CONSUMPTION
 LAKE ONTARIO FISHING AND FISH CONSUMPTION by Nancy A. Connelly, Research Specialist, Cornell University Department of Natural Resources and Diane Kuehn, Extension Specialist, New York Sea Grant INTRODUCTION
Traffic Impact Study. Westlake Elementary School Westlake, Ohio. TMS Engineers, Inc. June 5, 2017
 TMS Engineers, Inc. Traffic Impact Study Westlake Elementary School Westlake, Ohio June 5, 2017 Prepared for: Westlake City Schools - Board of Education 27200 Hilliard Boulevard Westlake, OH 44145 TRAFFIC
Journal of Emerging Trends in Computing and Information Sciences
 A Study on Methods to Calculate the Coefficient of Variance in Daily Traffic According to the Change in Hourly Traffic Volume Jung-Ah Ha Research Specialist, Korea Institute of Construction Technology,
Marine Debris from Land to Sea: Holistic Characterization, Reduction and Education Efforts in New Hampshire
 Marine Debris from Land to Sea: Holistic Characterization, Reduction and Education Efforts in New Hampshire ABSTRACT Over time, the focus of marine debris research and work has shifted away from simply
Guidelines for Providing Access to Public Transportation Stations APPENDIX C TRANSIT STATION ACCESS PLANNING TOOL INSTRUCTIONS
 APPENDIX C TRANSIT STATION ACCESS PLANNING TOOL INSTRUCTIONS Transit Station Access Planning Tool Instructions Page C-1 Revised Final Report September 2011 TRANSIT STATION ACCESS PLANNING TOOL INSTRUCTIONS
Neighborhood Influences on Use of Urban Trails
 Neighborhood Influences on Use of Urban Trails Greg Lindsey, Yuling Han, Jeff Wilson Center for Urban Policy and the Environment Indiana University Purdue University Indianapolis Objectives Present new
Keeping Gulf Red Snapper on the Road to Recovery
 A brief from July 2016 Keeping Gulf Red Snapper on the Road to Recovery Overview In 2007, the Gulf of Mexico Fishery Management Council implemented a rebuilding plan for red snapper that included scientifically
Figure 4, Photo mosaic taken on February 14 about an hour before sunset near low tide.
 The Impact on Great South Bay of the Breach at Old Inlet Charles N. Flagg and Roger Flood School of Marine and Atmospheric Sciences, Stony Brook University Since the last report was issued on January 31
Conseil de développement économique des Territoires du Nord-Ouest Quebec Travel conversion study 2008 Report May 26, 2009
 Conseil de développement économique des Territoires du Nord-Ouest Quebec Travel conversion study 2008 Report May 26, 2009 226-388 donald street winnipeg manitoba canada R3B 2J4 204.989.8002 fax 204.989.8048
CLEARWATER COMPREHENSIVE BOATING PLAN PUBLIC OUTREACH MEETING 2. December 16, 2015
 CLEARWATER COMPREHENSIVE BOATING PLAN PUBLIC OUTREACH MEETING 2 December 16, 2015 Introduction Project Team City of Clearwater Bill Morris Director of Marine and Aviation Kyle Brotherton Planning and Development
City of Elizabeth City Neighborhood Traffic Calming Policy and Guidelines
 City of Elizabeth City Neighborhood Traffic Calming Policy and Guidelines I. Purpose: The City of Elizabeth City is committed to ensure the overall safety and livability of residential neighborhoods. One
Susitna-Watana Hydroelectric Project Document ARLIS Uniform Cover Page
 Alaska Resources Library & Information Services Document ARLIS Uniform Cover Page Title: Wildlife harvest analysis study, Study plan Section 10.20 : Final study plan SuWa 200 Author(s) Personal: Author(s)
Orange County MARINE PROTECTED AREAS
 Orange County MARINE PROTECTED AREAS Orange County Coastkeeper QUARTERLY REPORT 1/1/ 2013 3/30/12 2013 WHAT IS THE OC MPA WATCH PROGRAM? The Orange County Marine Protected Area (OC MPA) Watch Program enlists
Evaluating the Influence of R3 Treatments on Fishing License Sales in Pennsylvania
 Evaluating the Influence of R3 Treatments on Fishing License Sales in Pennsylvania Prepared for the: Pennsylvania Fish and Boat Commission Produced by: PO Box 6435 Fernandina Beach, FL 32035 Tel (904)
A Study on Weekend Travel Patterns by Individual Characteristics in the Seoul Metropolitan Area
 A Study on Weekend Travel Patterns by Individual Characteristics in the Seoul Metropolitan Area Min-Seung. Song, Sang-Su. Kim and Jin-Hyuk. Chung Abstract Continuous increase of activity on weekends have
BookletChart. Intracoastal Waterway Matecumbe to Grassy Key NOAA Chart A reduced-scale NOAA nautical chart for small boaters
 BookletChart Intracoastal Waterway Matecumbe to Grassy Key NOAA Chart 11449 A reduced-scale NOAA nautical chart for small boaters When possible, use the full-size NOAA chart for navigation. Published by
UBCM Community Excellence Awards 2007 Submission
 UBCM Community Excellence Awards 2007 Submission Formatted: Left: 2.54 cm Category: Partnerships Project: Implementation of False Creek Anchoring Management System 1. A one-paragraph summary of the project/program
SUBJECT: I-82 Existing Conditions I-84 Boardman to Ontario Corridor Management Plan P
 720 SW Washington St. Suite 500 Portland, OR 97205 503.243.3500 www.dksassociates.com MEMORANDUM DATE: March 30, 2017 TO: FROM: Laura Slater (ODOT Project Manager) ODOT PMT Group for I-84 Region 5 Corridor
Cycle journeys on the Anderston-Argyle Street footbridge: a descriptive analysis. Karen McPherson. Glasgow Centre for Population Health
 Cycle journeys on the Anderston-Argyle Street footbridge: a descriptive analysis Karen McPherson Glasgow Centre for Population Health March 2017 Key points: There were 116,334 cycle journeys made using
Rainy Lake Open-water Creel Survey:
 Rainy Lake Open-water Creel Survey: 21 11 Darryl McLeod District Update 212-1 Introduction An open-water creel survey was conducted on the Ontario portion of Rainy Lake from May 15 th (the opening of the
Beverly Sauls SEDAR31-DW11. 5 August 2012
 A Summary of Data on the Size Distribution and Release Condition of Red Snapper Discards from Recreational Fishery Surveys in the Gulf of Mexico Beverly Sauls SEDAR31-DW11 5 August 2012 This information
Orange County MPA Watch Program Quarterly Report (Jan 1 March 31, 2012)
") Orange County MPA Watch Program Quarterly Report (Jan 1 March 31, 2012) What is the OC MPA Watch Program? The Orange County Marine Protected Area (OC MPA) Watch Program enlists volunteers, community groups
Orange County MPA Watch Program Quarterly Report (Jan 1 March 31, 2012) What is the OC MPA Watch Program? The Orange County Marine Protected Area (OC MPA) Watch Program enlists volunteers, community groups
TRAFFIC IMPACT STUDY CRITERIA
 Chapter 6 - TRAFFIC IMPACT STUDY CRITERIA 6.1 GENERAL PROVISIONS 6.1.1. Purpose: The purpose of this document is to outline a standard format for preparing a traffic impact study in the City of Steamboat
METHODOLOGY. Signalized Intersection Average Control Delay (sec/veh)
") Chapter 5 Traffic Analysis 5.1 SUMMARY US /West 6 th Street assumes a unique role in the Lawrence Douglas County transportation system. This principal arterial street currently conveys commuter traffic
Chapter 5 Traffic Analysis 5.1 SUMMARY US /West 6 th Street assumes a unique role in the Lawrence Douglas County transportation system. This principal arterial street currently conveys commuter traffic
Charter Boat Fishing in Lake Michigan: 2017 Illinois Reported Harvest
 Illinois Department of Natural Resources Division of Fisheries Charter Boat Fishing in Lake Michigan: 2017 Illinois Reported Harvest Steven R. Robillard Illinois Department of Natural Resources Lake Michigan
2017 North Texas Regional Bicycle Opinion Survey
 2017 North Texas Regional Bicycle Opinion Survey Sustainable Development Program Kevin Kokes, AICP Public Meetings April, 2018 North Central Texas Council of Governments MPO for the Dallas-Fort Worth Region
WIM #36 MN 36 MP 15.0 LAKE ELMO APRIL 2014 MONTHLY REPORT
 WIM #36 MN 36 MP 15.0 LAKE ELMO APRIL 2014 MONTHLY REPORT In order to understand the vehicle classes and groupings, the MnDOT Vehicle Classification Scheme and the Vehicle Class Groupings for Forecasting
Re: Algae/Cyanobacteria Bloom in St. Lucie, Martin, Palm Beach and Lee Counties.
 July 18, 2016 Richard L. Scott Governor, State of Florida 400 S Monroe St Tallahassee, FL 32399 Re: Algae/Cyanobacteria Bloom in St. Lucie, Martin, Palm Beach and Lee Counties. Dear Governor Scott: I am
REPORT ON RED-LIGHT MONITORING SYSTEMS
 REPORT ON RED-LIGHT TRAFFIC CONTROL SIGNAL MONITORING SYSTEMS Prepared by the New Jersey Department of Transportation November 2011 Executive Summary Public Law 2007, Chapter 348 (P.L. 2007, c.348), signed
RESIDENTS AND USERS SPEAK
 Planning for Waterway Access in Taylor County, Florida: RESIDENTS AND USERS SPEAK TP - 177 Science Serving Florida s Coast Florida Sea Grant College Program PO Box 110409 University of Florida Gainseville,
Appendix 22 Sea angling from a private or chartered boat
 Appendix 22 Sea angling from a private or chartered boat LUC SMRTS2015 Final Report 359 March 2016 Appendix 22 Sea angling from a private or chartered boat Table A22.1: Summary of sample confidence levels
Chapter 5 FUNCTIONAL CLASSIFICATION
 Chapter 5 FUNCTIONAL CLASSIFICATION Functional classification is a system by which streets and roadways may be distinguished by types according to their function within the entire transportation network.
September 9, Planning and Land Development Regulation Commission (PLDRC)
") Page 1 of 19 GROWTH AND RESOURCE MANAGEMENT DEPARTMENT PLANNING AND DEVELOPMENT SERVICES DIVISION CURRENT PLANNING ACTIVITY 123 W. Indiana Avenue, Room 202, DeLand, FL 32720 (386) 943-7059 PUBLIC HEARING:
Page 1 of 19 GROWTH AND RESOURCE MANAGEMENT DEPARTMENT PLANNING AND DEVELOPMENT SERVICES DIVISION CURRENT PLANNING ACTIVITY 123 W. Indiana Avenue, Room 202, DeLand, FL 32720 (386) 943-7059 PUBLIC HEARING:
The 2001 Economic Benefits of Hunting, Fishing and Wildlife Watching in MISSOURI. Prepared by:
 The 2001 Economic Benefits of Hunting, Fishing and Wildlife Watching in MISSOURI Prepared by: Southwick Associates, Inc. PO Box 6435 Fernandina Beach, FL 32035 Ph (904) 277-9765 Fax (904) 261-1145 Email:
2016 West Coast Entanglement Summary
 March 2017 2016 West Coast Entanglement Summary Overview of Entanglement Data west coast region MMHSRP Permit #18786 In 2016, 71 separate cases of entangled whales were reported off the coasts of Washington,
Midtown Corridor Alternatives Analysis
 Midtown Corridor Alternatives Analysis Ridership Forecast Methodology and Results December 2013 Prepared by the SRF Consulting Group Team for Table of Contents Introduction... 1 Methodology... 1 Assumptions...
For Information Only. Pedestrian Collisions (2011 to 2015) Resolution. Presented: Monday, Apr 18, Report Date Tuesday, Apr 05, 2016
 Resolution. Presented: Monday, Apr 18, Report Date Tuesday, Apr 05, 2016") Presented To: Operations Committee For Information Only Pedestrian Collisions (0 to 0) Presented: Monday, Apr 8, 06 Report Date Tuesday, Apr 0, 06 Type: Correspondence for Information Only Resolution For
Presented To: Operations Committee For Information Only Pedestrian Collisions (0 to 0) Presented: Monday, Apr 8, 06 Report Date Tuesday, Apr 0, 06 Type: Correspondence for Information Only Resolution For
SANTA CLARA COUNTYWIDE BICYCLE PLAN August 2008
 SANTA CLARA COUNTYWIDE BICYCLE PLAN August 2008 To assist VTA and Member Agencies in the planning, development and programming of bicycle improvements in Santa Clara County. Vision Statement To establish,
Orange County MARINE PROTECTED AREAS 3 rd Quarter 2015 Report
 Orange County MARINE PROTECTED AREAS 3 rd Quarter 2015 Report Page 1 of 7 WHAT IS THE OC MPA WATCH PROGRAM? The Orange County Marine Protected Area (OC MPA) Watch Program enlists volunteers, community
Orange County MPA Watch M o n i t o r i n g H u m a n U s a g e
 Orange County MPA Watch M o n i t o r i n g H u m a n U s a g e WHAT IS AN MPA? Marine Protected Areas (MPAs) are discrete geographic marine or estuarine areas designed to protect or conserve marine life
Buckland Wind Resource Report
 Buckland Wind Resource Report By: Douglas Vaught, P.E., V3 Energy LLC, Eagle River, Alaska Date: September 17, 2010 Buckland met tower; D. Vaught photo Contents Summary... 2 Test Site Location... 2 Photographs...
Orange County MARINE PROTECTED AREAS 2 nd Quarter 2016 Report
 Orange County MARINE PROTECTED AREAS 2 nd Quarter 2016 Report Page 1 of 7 WHAT IS THE OC MPA WATCH PROGRAM? The Orange County Marine Protected Area (OC MPA) Watch Program enlists volunteers, community
Potential collision risks of large whales and fast ferries traveling between Korea and Japan
 Journal of Marine Animals and Their Ecology Copyright 2008 Oceanographic Environmental Research Society Vol 6, No 1, 2013 Brief Communication Potential collision risks of large whales and fast ferries
HARBOR INFRASTRUCTURE INVENTORIES Marquette Harbor, Michigan
 HARBOR INFRASTRUCTURE INVENTORIES Marquette Harbor, Michigan Harbor Location: Marquette Harbor is located in Marquette Bay on the south shore of Lake Superior, 160 miles west of Sault Ste. Marie, MI and
KC Scout Kansas City s Bi-State Transportation Management Center
 KC Scout Kansas City s Bi-State Transportation Management Center Operations Report May 216 This report contains statistical and operational data of activities at the Scout TMC for the period Sunday, May
Public Hearing Document
 Regulatory Amendment 1 to the Fishery Management Plan for the Dolphin and Wahoo Fishery of the Atlantic Modify commercial trip limits for dolphin Environmental Assessment Regulatory Impact Review Regulatory
June NMFS Address 11, 2014 (NOAA): Council Address. Dover, DE 19901
: Council Address. Dover, DE 19901") BLACK SEA BASS SEASON OPENING FRAMEWORK ADJUSTMENT Discussion Document and Background June 2014 Mid-Atlantic Fishery Management Council in cooperation with the National Marine Fisheriess Service (NMFS)
BLACK SEA BASS SEASON OPENING FRAMEWORK ADJUSTMENT Discussion Document and Background June 2014 Mid-Atlantic Fishery Management Council in cooperation with the National Marine Fisheriess Service (NMFS)
and found that there exist a significant overlap between the billfish resources and the exploitation activities targeting tunas and mahi mahi.
 Executive Summary Report 2016 Billfish Research in the Eastern Pacific Ocean Rosenstiel School of Marine and Atmospheric Science University of Miami January 2017 During 2016, the Eastern Pacific Ocean
Gulf States Marine Fisheries Commission. Dave Donaldson Assistant Director
 Gulf States Marine Fisheries Commission Dave Donaldson Assistant Director Interjurisdictional Fisheries Program The purpose of the IJF Program: Promote and encourage state activities in support of management
Near-Field Sturgeon Monitoring for the New NY Bridge at Tappan Zee. Quarterly Report July 1 September 30, 2014
 Near-Field Sturgeon Monitoring for the New NY Bridge at Tappan Zee Quarterly Report July 1 September 30, 2014 Prepared by AKRF, Inc. 7250 Parkway Drive, Suite 210 Hanover, MD 21076 for New York State Thruway
MONROE COUNTY NEW YORK
 MONROE COUNTY NEW YORK Intersection Accident Database Enhancement Project (UPWP 4380) FINAL January 2008 Prepared By: Prepared For: Bergmann Associates 200 First Federal Plaza 28 East Main Street Rochester,
KC Scout Kansas City s Bi-State Transportation Management Center
 KC Scout Kansas City s Bi-State Transportation Management Center Operations Report August- 215 This report contains statistical and operational data of activities at the Scout TMC for the period Saturday,
Socioeconomic Profile and Spatial Analysis of Fisheries in the three central California National Marine Sanctuaries
 Socioeconomic Profile and Spatial Analysis of Fisheries in the three central California National Marine Sanctuaries Overview and Assessment of CDFG Fisheries Data for use in the Joint Management Plan Review
LAKE DIANE Hillsdale County (T8-9S, R3W, Sections 34, 3, 4) Surveyed May Jeffrey J. Braunscheidel
 Surveyed May Jeffrey J. Braunscheidel") Michigan Department of Natural Resources Status of the Fishery Resource Report No. 2003-4, 2003 LAKE DIANE Hillsdale County (T8-9S, R3W, Sections 34, 3, 4) Surveyed May 2001 Jeffrey J. Braunscheidel Environment
Michigan Department of Natural Resources Status of the Fishery Resource Report No. 2003-4, 2003 LAKE DIANE Hillsdale County (T8-9S, R3W, Sections 34, 3, 4) Surveyed May 2001 Jeffrey J. Braunscheidel Environment
Legendre et al Appendices and Supplements, p. 1
 Legendre et al. 2010 Appendices and Supplements, p. 1 Appendices and Supplement to: Legendre, P., M. De Cáceres, and D. Borcard. 2010. Community surveys through space and time: testing the space-time interaction
Aerated Lakes Angler Survey: Swan and Spring Lakes, Alberta, 2015
 Aerated Lakes Angler Survey: Swan and Spring Lakes, Alberta, 2015 The Alberta Conservation Association is a Delegated Administrative Organization under Alberta s Wildlife Act. Aerated Lakes Angler Survey: