Interaction between gloves and ball surfaces in AFL and Rugby
|
|
|
- Rosemary Fox
- 6 years ago
- Views:
Transcription
1 Interaction between gloves and ball surfaces in AFL and Rugby Internship Report Author: Matthijs A. Oomen Supervisors: Prof. F.K. Fuss, RMIT University P.M. Clifton, RMIT University Prof.Dr.Ir. A. de Boer, University of Twente August 30, 2012
2
3 Internship Report Author: Matthijs A. Oomen s Supervisors: Prof. F.K. Fuss, RMIT University P.M. Clifton, RMIT University Prof.Dr.Ir. A. de Boer, University of Twente Royal Melbourne Institute of Technology School of Aerospace, Mechanical and Manufacturing Engineering Bundoora East Campus, VIC 3083 Melbourne Australia On behalf of: University of Twente Faculty of Engineering Technology Chair of Applied Mechanics June 18th September 7th 2012
4
5 Preface This report was made during my internship period at the Royal Melbourne Institute of Technology from June till September 2012 at the School of Aerospace, Mechanical and Manufacturing Engineering as a part of the curriculum for my MSc degree in Mechanical Engineering. The internship was done inside the Sports Engineering section of RMIT. It took some time to get everything arranged, but on June 10th I finally departed for a four month period of internship and traveling and I think this is the right place to say I had a great time in Melbourne. I want to thank all the people involved in creating the opportunity to go abroad for this internship and especially Prof. Franz Tino Fuss and Patrick Clifton for their supervision and help during the project. A second thank you has to go to Natalie Robson and Francois Richard for their company during the whole period, without you it would have been a lot more boring than it was now. Of course also my girlfriend Esmée, my parents and the rest of my family deserve a thank you, because they supported me through the whole process of arranging everything and actually departing for a period of four months. i
6 Summary In Australian Football players are allowed to wear gloves to keep their hand safe. The gloves used are of different types and they are made as sticky as possible, resulting in these players having an advantage over other players when catching a ball. The AFL now wants to know how much the players benefit and this has resulted in this research in quantifying the advantage when wearing these gloves. Ten different types of gloves have been tested on four different surfaces. Some of the gloves tested have an all silicon palm of the hand, while others are made out of leather or have a thin silicon pattern on a spandex palm. The tests were done by pulling a glove over a surface mounted on a forceplate. This forceplate measures normal and frictional force during the measurement and from that data the coefficient of friction can be calculated as the fraction of both. To compare the results and to broaden the research, five of the gloves were also tested on ten different rugby surfaces ranging from smooth panels to different pimple patterns. Because the gloves show signs of wear quickly, it was decided to also test them in old and new conditions. All these tests lead to the most important conclusion that for AFL a few gloves make a significant difference in performance, all being gloves with a majority of silicone in the palm. It is however highly dependent on the hand that is tested, because there were two different hands tested and they both show different behavior. This can of course be explained by the uniqueness of every hand. Gloves are not of significant use when one wants to perform better in rugby, because both hands tested already have a high coefficient of friction. Another important conclusion to be drawn is that the silicon gloves are performing better in dry conditions and the leather gloves slightly better in the wet. ii
7 Contents Preface Summary i ii 1 Introduction Research Aim Sports Background Research Background Research Previous Research and Theory Theory Friction Force Measurements Previous Research Method Gloves Surfaces Force Measurements Results and Analysis AFL Old gloves New gloves Rugby Old gloves New gloves Individual gloves Dry vs Wet Old vs New Conclusions and Discussion Conclusions AFL Rugby Old vs New Gloves Dry vs Wet Discussion Standardized Test Setup Force measurements Comfort Wet Testing Hand Testing Bibliography 23 A Gloves 24 iii
8 B Surfaces 27 C Coefficients of Friction 29
9 Chapter 1 Introduction 1.1 Research Aim The aim of this research was to investigate the friction of different glove against different AFL and rugby ball surfaces. This was done with old and new gloves and in dry and wet conditions. A quantitative result of the coefficient of friction was aimed for to conclude anything about the behavior of both the gloves and the surfaces. 1.2 Sports Background Rugby is commonly known throughout the world and is played in a few different ways of which the best known are League and Union Football. League Football is a bit faster and therefore it is also more interesting to watch for the general crowd. Australian Football (AFL) is a sport played on a professional basis only in Australia during the winter from April till September. The pace of the game is quite high and the roughness is like rugby. The pitch is oval and the long axis is about 170 meters long, see Figure 1.1. Like with rugby, a score can be made by kicking the ball between two poles, which gives the team six points. Also one instead of six points can be scored if the ball goes between one of the high poles and a lower pole next to it. One of the most important characteristics of AFL is marking the ball, which is catching the ball out of a kick, see Figure 1.2 and Figure 1.3. The official definition according to the rules of the AFL[1] is: A Mark is taken if, in the opinion of the field umpire, a player catches or takes control of the football: (a) within the playing surface; and (b) after it has been kicked by another player a distance of at least 15 meters; and (c) which has not touched the ground or been touched by another player during the period when the football was kicked until it was caught or controlled by the player. After the ball has been marked, the player is entitled to take some space to pass the ball to another player or to try and kick the ball between the poles. 1.3 Research Background Marking is usually done with two hands and subsequently the ball is brought to the chest to make sure the player holds it. Players often use gloves when they are injured, to make sure the hand is safer. It is observed that players that wear these gloves have great benefits of wearing them, because the surface roughness of the glove is higher than the surface roughness of the hand. This means that the players can more easily mark the ball when wearing a glove, because they have more grip. Players also tend to keep wearing the gloves, because they feel they have an advantage over using the normal hand. For rugby the general handling of a ball is very important and this means that if gloves make handling more easy, the players would possibly start wearing them. The Australian Football League wants to know how much the players benefit and maybe want to regulate the type of gloves to be used by the players. The aim of the research is to analyze the benefits of the 1


10 Figure 1.1: The oval shape of an AFL pitch Figure 1.2: An official Australian Football Figure 1.3: A mark taken 2
11 gloves and to obtain a quantitative result for the different types of gloves that are used in AFL at the moment. This will be done by doing friction tests of the gloves on the leather of the AFL ball and different rugby surfaces. 1.4 Research There are a few main objectives for the research. The first and most important is to test 10 different gloves in a new condition on all four AFL surfaces. Five of these gloves will also be tested in old conditions and on all ten rugby surfaces. A further objective is to analyse the data to obtain a quantitative result for all the gloves against all surfaces tested. Once this has been done, one can draw conclusions about the behavior of the different gloves in the dry and the wet and in old and new conditions. These test results will be compared to test results from bare hands from two different persons. As a further research objective, the test setup has to be standardized to make the measurements more constant and the forces that appear in normal conditions when marking a ball have to be known to limit the force and velocity region in which the experiments have to be done. 3
12 Chapter 2 Previous Research and Theory 2.1 Theory Friction When sliding a glove over a surface, the coefficient of friction is defined as the ratio between friction force F and normal force N: µ = F (2.1) N The coefficient of friction can also be brought back to a main simple example of a block on a sloped surface. The point where the block starts to slide is the point where the regime transitions from static to kinetic friction. The higher the coefficient of friction becomes, the bigger the angle at which the block starts to slide. For low coefficients of friction, a difference of a tenth in the COF results in a difference in the sliding angle of 3 to 5, but when the COF becomes higher than 2, the difference of a tenth in the COF results in a 1 difference, and this decreases even further with higher values for the COF. This means that for higher values of the coefficient of friction, bigger differences between values are less significant Force Measurements Before the field measurements were actually done, an estimate of the force was made. For this, the parameters in the flight stage have to be known or estimated with a certain degree of certainty. Ball [6] researched accuracy of kicks in AFL and for this he measured the starting velocity of the ball for 30 and 50 meter kicks. To use the extremes, the 50 meter kick was taken as a reference. The starting velocity of the ball for these kicks was 25 ms 1, so this was taken as the velocity at the start of the kick. To calculate the velocity of the ball at the marking point, the drag force has to be taken into account. The drag force is given as: F d = 1 2 ρac dv 2 (2.2) Here, ρ is the density of air, which is about kgm 3, A is the surface area of the ball, which is varying through time, so an average of m 2 is taken as value to work with, this is between the minimum and maximum value of the surface. v is the velocity and c d is the aerodynamic drag coefficient, which is taken as 0.1. Drag force is then computed as 1.263N. To know the end velocity, the drag in x-direction was computed with an average attack angle of 22.5 degrees, leading to a value of 1.167N. The deceleration in x-direction is subsequently calculated, with the mass of the official ball being 450 g and with that value also the end velocity in x-direction and the end velocity, taking into account that a kick has about three seconds of airtime: a x = F m = = 2.59 ms 2 (2.3) v x(end) = = 9.91 ms 1 (2.4) v end = 10 cos(45 ø ) = ms 1 (2.5) 4
13 With this value and the mass, the total momentum can be calculated and subsequently the force, taking into account that the time to catch the ball is taken as about 0.5 s: p end = m v end = = 6.36Ns (2.6) F = p t = 6.36 = 12.7N (2.7) 0.5 Because the player is catching the ball with two hands normally, this becomes 6.36 N per hand. There are however some parameters that can change, like the time a mark takes and the actual drag force. Because the velocity of the ball decreases during flight, also the drag force decreases and does so with the square of the velocity. The actual deceleration of the ball will thus be lower and the end velocity will be higher, resulting in a higher force. If an average drag force of 0.95 is taken for the whole flight, the end velocity would become ms 1 and the force would end up at 7.45 N per hand, which is about 1.5 times the weight of the ball per hand. What also has to be noted in this case is the direction of the ball compared to the hands that are catching it. The hands come from the side, so they exert a normal force at the ball and the ball is to be slowed down in the tangential direction of that. This means that the force actually acting on the hands will be higher than the force calculated above. Next to that also the fact that players use more force than ideally needed to catch the ball has to be taken into account, so the force will be even higher. 2.2 Previous Research For AFL surfaces, there was no real research found on friction between ball and glove surfaces, but for rugby there was some more previous research. The first research into friction between hand and ball in rugby was done by Tomlinson et al[2], comparing performance with three different gloves and the bare hand. The method they used was different than the method used in this project and they also said that there were a lot of factors that contributed to uncertainties in the results of the experiments. For example, they only did one test per condition and only used one rugby surface. In 2009, Tomlinson et al [3] did research on the friction between rugby balls and the skin of the hand and tried to visualize the handling of the ball. They did tests with four different pimple patterns of the ball and researched difference between dry and wet surfaces. Tomlinson et al [4] also did research into friction between human finger and flat contacting surfaces. They researched differences in different moisture conditions and evaluated some of the hypotheses posted before. They concluded it was very difficult to draw quantitative conclusions from the study, because there are a lot of external factors in the research method, like ambient conditions and difference between test subjects. A qualitative conclusion was drawn however that finger friction increases when someone is active, because of the sweat on the hand. In 2012, Fuss [5] did research into the behavior of the coefficient of friction of rugby ball surfaces. He concluded that if velocity or normal force is increasing, the coefficient of friction will first start to increase (strengthening part) and will subsequently decrease again (weakening region). The reason for this is that if the velocity for example becomes high enough, there will be a stick-slip effect. This effect makes that the two surfaces sliding over each other will just slip away and therefore the friction will become lower. The point where slip starts to occur is the point of impending slippage. At this point the friction coefficient has the highest value. The strenghtening and weakening parts of the regimes form a master surface in 3D, with velocity and force in log 10 scales on the horizontal x- and y-axes and coefficient of friction on the vertical z-axis [5]. The master surface indicates that the coefficient of friction between the ball and the hand in AFL and rugby also depends highly on the velocity with which they slide over each other and the force with which the ball is caught by the player. 5
14 Chapter 3 Method For the first part of the research, the different AFL and rugby ball surfaces were clamped to a Kistler Force Plate of the type 9260AA (Kistler, Winterthur, Switzerland) with a clamping bar on one side (see Figure 3.1) and a weight of 5 kg at the other side of the plate. Signal acquisition was done by a Kistler DAQ system for Bioware, type A measurement consisted of putting the glove on the surface with a total weight of 2.5 kg on it and subsequently pulling it over the force plate with constant velocity. This is shown in Figure 3.2 and Figure 3.3, the arrows indicate the direction the glove was pulled. For hand measurements, the same method was used, except for the normal force, which is exerted by the hand instead of weight. A measurement took 30 seconds in total and in that time, the glove and weights had to be put on the surface and the glove was pulled over the surface. Before every measurement, the plate forces were calibrated to make sure that the force output was only from the glove with weight on it. To get the glove sliding over the surface, first the static friction coefficient had to be reached. If this is the case, the glove starts sliding and the coefficient of friction drops again slightly. Once the glove was sliding, the velocity was kept as constant as possible, to allow for a good measurement. Sampling of the forces was done at 1 khz. Analyzing the raw data was done with Grapher. The coefficient of friction was calculated from a time period in which the shear force is constant. This time period was usually taken as a period of 5 seconds, after which the coefficient of friction is averaged over that period. Six measurements were done for every glove on every surface, after which the average of these five values was calculated as the mean friction coefficient between the two surfaces. During one set of testing, meaning all gloves dry or wet on one surface, 6 tests were done per glove in sets of 3. After each third test, another glove was used to make sure that the tests were repeatable. The wet tests were done with an amount of water on the surface, that covers the whole of the sliding path. This was done to ensure approximately the same conditions during all tests. The surfaces are hydrophobic, so they were not treated with water beforehand, because this does not make a difference. The Gripworx glove and the two Nike s are also hydrophobic, but the Franklin glove is hydrophilic and therefore it had to be soaked, because behavior will be different with different amounts of water, as the material can absorb the water. If the glove is soaked, it is not able to absorb any more water, so the behavior will be the same for all measurements. After a series of measurements on a surface, the glove was submerged again in water to keep it soaked. 3.1 Gloves Ten different gloves were used for the testing, all on the AFL surfaces and five on the rugby surfaces. The best distinction between the gloves was that there were two leather ones, two gloves with a thin silicon pattern on the palm, one with silicon pimples, one with silicon patches and four all silicon palm gloves. In Table 3.1 an overview is given of the gloves with palm material and the compositions of those materials when known. The gloves in italics were tested on both the rugby surfaces and the AFL surfaces. To make sure the measurements were the same, the fingers are cut off from the gloves to leave only the palm area to make contact with the surface. The Gripworx complete glove and the tested Magnigrip glove are shown in Figure 3.5 and Figure 3.6. The rest of the gloves can be found in Appendix A, including pictures of the whole gloves and details of new and worn gloves. 6


15 Figure 3.1: The force plate used in the experiments Figure 3.2: The test setup in total Figure 3.3: Detail of the glove with weight put onto it Figure 3.4: Raw measurement data from an experiment 7
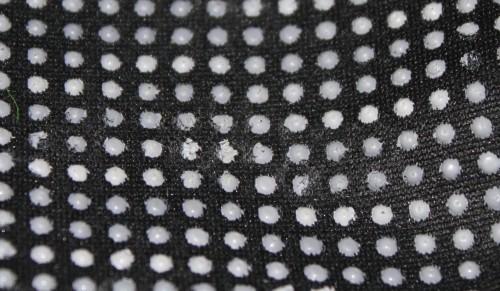
16 Figure 3.5: Complete Gripworx glove Figure 3.6: Nike Magnigrip glove Glove Palm material Material composition remarks Franklin Synthetic Leather digitally impregnated leather Gilbert Netball Flat silicon pattern polyester pattern on lycra Gilbert Rugby Rectangular silicon - pimple pattern Grays Skinfit Hockey flat silicon pattern - Gripworx Ironclad Silicon patches 60% nylon, 40% polyurethane Nike Superbad All silicon palm glove: 62% polyester, 18% nylon, 12% silicone, 8% neoprene Nike Magnigrip Elite 2.0 All silicon palm - Nike Vaporjet All silicon palm 50% silicone, 40%polyester, 7%neoprene, 3% nylon Rawlings Leather - Under Armour Blur II All silicon palm 50% polyester, 50% Polyvinyl Chloride 3.2 Surfaces Table 3.1: Overview of gloves and palm materials Two different official AFL surfaces were used to test the gloves on. These surfaces were both imprinted with a logo of a sponsor. Next to these two surfaces, two patches of the original leather without any prints were used, because one can feel the difference between the normal leather and the print on it. One of these patches was of the red leather used and the other one was the yellow leather. The rugby surfaces are made of rubber, which makes the behavior different, especially in combination with the different gloves. Three of the different rugby surfaces are also currently used in different rugby leagues, like the Rugby Union (UCO), Rugby League(NRL) and the Japanese Rugby League(FIJ). Two other surfaces were smooth, but with a difference in the composition of the material (SMO A and SMO B), one surface was an experimental surface with ordered pimples in perpendicular lines (REG) and the last surface had a snowflake pimple pattern (SNO) and this one is also experimental. The last two surfaces, as well as the NRL surface had a direction dependent pattern, which means that the coefficient of friction could be different in different directions. This means that they had to be tested in two directions, so the perpendicular pattern was tested in 0 and in 45 direction and the snowflake and Japanese pattern in two directions perpendicular to each other. This makes a total of 14 surfaces tested in both dry and wet conditions. All rugby surfaces used are summarized in Table 3.2. The Yellow official AFL ball patch is shown in Figure 3.7 and a detail of the UCO rugby surface in Figure 3.8. The rest of the surfaces are given in Appendix B, with details of all the pimple patterns. 3.3 Force Measurements For the actual force measurements, a glove and a ball were instrumented with sensors to measure the forces during some normal actions like passing, kicking and marking the ball. With the sensors in the ball, it is possible to look at the kinematics of the ball during flight, so one can see for example how much spin is on the ball and also the forces acting on the ball during release, flight and catch can be measured. The instrumented ball can be seen in Figure 3.9, all laces were cut afterwards to test the ball. The hand was instrumented inside the glove. A total of eight sensors were put on the glove to measure 8


17 Surface Pimple Pattern Remarks SMO A No pimples Rugby ball material without pattern SMO B No pimples New composition REG Ordered rectangular Experimental UCO Not ordered Used in Rugby Union NRL Not Ordered Used in Rugby League FIJ Not ordered Used in Japanese League SNO Snowflake pattern Experimental Table 3.2: Different pimple patterns of the surfaces and where they are used Figure 3.7: Yellow AFL ball patch used for testing Figure 3.8: Detail of the UCO pattern the division of the forces. Five of these were put on the inside top of the fingers and three on the palm of the hand. The instrumentation for the hand is shown in Figure The eight sensors can be seen on the left side and they are connected to a recording device, which can be connected to a computer via USB, so one can read the data. Figure 3.9: The instrumented ball Figure 3.10: The instrumentation used for measuring the force on the hand 9
18 Chapter 4 Results and Analysis All measurements were done by hand (male, 24 y/o) and because of this, it was impossible to do all measurements with exactly the same circumstances. For comparison, the hand testing was done by two different male persons of 24 and 49 years old respectively. The measurements which were clearly outliers were discarded directly. Per glove-surface combination 6 measurements were done of which most of the times one was evidently not following the trend of the other measurements. This was also discarded to leave five measurements for each glove on each surface. The average of these five values is taken as the coefficient of friction. One important thing to note is the fact that the gloves show signs of wear quickly during the measurements, so the gloves are only used as new gloves for the first 15 to 30 measurements, depending on the amount of wear showing on the glove. Because a difference is noted between old and new gloves, the measurements done are also distinguishing between new and worn gloves and after measuring three or four surfaces, a new glove has to be used. However, the difference between worn and new gloves is not the same for every surface, so it is not possible to say that old or new gloves are better by definition. The wear on the Gripworx glove can be seen in Figure 4.1. The wear shows at the patches that are more dull at for example the bottom center, compared to the patches at the right. The place the patches wear off corresponds to the place where the weight is put on it, because it is a circular shaped weight with a hole in the middle. This in its turn also corresponds to the parts of the hand that make the most contact with a ball when catching it, because the center of the palm is a bit deeper than the edges. The results are separated into a section for the results on AFL surfaces and a section for the rugby surfaces, because there are more gloves tested on the plain leather AFL surfaces. A seperate section is dedicated to the individual gloves to show the behavior if they behave better in the dry or in the wet, also with a comparison with the hand. All coefficients of friction can be found in Appendix C, Table C.1 for AFL, Table C.2 for rugby and Table C.3 for the bare hand testing. A setback for the results section is that new pairs of the Nike Magnigrip and Vaporjet gloves had to be ordered from the US and they were not delivered in time to get all the tests done before the internship was over. Figure 4.1: Details of the worn Gripworx glove 10
19 4.1 AFL Figure 4.2: Results of the AFL surfaces for old gloves in dry conditions For the AFL surfaces, two game ball patches and two plain leather patches used for making the balls were used. For the new gloves, ten different types were tested for the AFL in dry and wet conditions. Due to time constraints, only five of these gloves were tested in worn conditions, also in both the dry and the wet. These five were the leather Franklin glove, the Gripworx glove, with silicon patches on the palm, the Gilbert rugby glove, with pimples on the palm and the Nike Magnigrip and Vaporjet gloves with all silicon palms. New pairs of the Nike gloves were however not delivered on time, so the tests for new gloves could not be executed before the internship was finished Old gloves In Figure 4.2, the results for old gloves in dry conditions are given, together with the results for the hand testing. From this it can clearly be seen that two Nike gloves and the Gripworx glove all are much better than the bare hand. This is probably due to the contact surface that is created by the flat silicone surfaces, whereas the Gilbert glove has higher pimples, reducing the contact surface with the leather of the ball. As will be shown below, these pimples are convenient for rugby, but not for AFL. The Franklin glove also performs a lot worse than the silicon gloves and this has to do with the fact that it is a completely different material and the interaction between leather and silicon is different from the interaction between leather and leather. Although the two hands tested were not from professional AFL players, it can be concluded that in the case the gloves are old, the gloves with silicon patches or all silicon palms will give a player a better grip on the ball and thus the ability to perform better. For some players the leather gloves or the glover with pimples will probably be an improvement, but considering that most players will be used to handling the ball, this improvement is most likely to be minimal. For old gloves in wet conditions, shown in Figure 4.3 the performance of the gloves is in most cases worse, except for the Franklin leather glove. This glove is for three out of the four surfaces slightly better, and because of that it performs almost as well as the other gloves tested. The Gilbert glove again is far down compared to the other gloves and this is probably due to the contact surface created again. Another important thing to be seen in Figure 4.3 is the performance of the two hands. The hand of the 49 y/o performs better than all of the gloves and the hand of the 24 y/o is also a lot better and outperforms 11
20 Figure 4.3: Results of the AFL surfaces for old gloves in wet conditions the gloves slightly for the yellow leather and performs equally as good as most gloves for the red leather surfaces. This means that old gloves in wet conditions are not of significant use for a lot of players New gloves For the new gloves, the results are given in Figure 4.4 and Figure 4.5. As said there were a lot more new gloves tested than old ones. The Nike Magnigrip tests could not be executed for both the dry and the wet conditions, while the Nike Vaporjet tests could only be done for dry conditions and not in the wet. With the new gloves in the figures, the results in dry conditions give a same trend as the results with the old gloves. The hand of the 24 y/o is at the bottom of the graph, so all gloves are better than that and the hand of the 49 y/o is in the middle, with the UA Blur II being consistently better over all surfaces and the Gripworx and Nike Vaporjet and Superbad better on two or three surfaces. These are again all the gloves tested that have an all silicon palm or silicon patches on the palm. The Gilbert Netball glove and the Grays Hockey glove, both with a thin polyester pattern on the palm, and the Gilbert Rugby glove all perform not that well, compared to the silicone gloves. Compared to the hand it depends greatly on which hand is tested. For the wet conditions, results for the new gloves are also in agreement with the old gloves. The hand of the 24 y/o again rises to a value above a lot of the gloves, only under the Gripworx and the UA Blur II. The hand of the 49 y/o has again the highest or second highest coefficient of friction. Both leather gloves, the Franklin and the Rawlings, have a higher coefficient of friction for the wet tests. Interesting to see is the Nike Superbad, which performs a lot worse in the wet conditions. This glove can be compared to the other two Nike gloves, which were tested for the old gloves. These also showed a big decrease in COF in wet conditions, although the values were still a lot higher for the Magnigrip and Vaporjet. This could be because of the old gloves that are a bit more rough already. All silicon gloves show a lot more of stick-slip behavior during the tests, so they are a lot more slippery in wet conditions. The Gilbert Rugby, Gilbert Netball and Grays Hockey gloves are performing a bit worse in the wet than in the dry. Only the Franklin and the Gripworx can really be compared for the wet conditions in old and new state and from the coefficients of friction it becomes clear that the Gripworx glove is structurally better than in the conditions when wet testing is done. From both the tests in the wet and the dry, one can conclude that it is very dependent on the person if and which glove will bring you an advantage in AFL, but in general it can be said that the silicon 12
21 Figure 4.4: Results of the AFL surfaces for new gloves in dry conditions Figure 4.5: Results of the AFL surfaces for new gloves in wet conditions 13
22 gloves are definitely the best choice, with the UA Blur II and the Gripworx as the most constant in both the dry and the wet conditions. All other gloves can be better than the dry hand, but again there is a big dependency of which hand you are testing. The Gilbert Rugby, Gilbert Netball, Rawlings and Grays Hockey gloves all perform consistently bad, with a maximum coefficient of friction of 1.2 for all of these gloves. The Franklin glove gets better in the wet conditions, while the Nike Superbad significantly decreases in performance. 4.2 Rugby For the rugby surfaces a total of five different gloves was tested on 10 different surfaces with different pimple patterns. As stated above, all surfaces can be found in Appendix B. The tests were done with old and new gloves and in dry and wet conditions Old gloves In Figure 4.6, the results for old gloves on all surfaces in dry conditions are shown, together with the results for hand testing of both test persons. What can be seen is that for both smooth rubber surfaces, which are the two first surfaces in the figure, all five gloves are better than the two bare hands, but for the rest of the surfaces, one hand (49 y/o) is equally as good as the best glove or better and the other (24 y/o) is consistently better or equal to three of the gloves and equal or a bit lower than the other two gloves. the best two gloves are the Gripworx glove with the silicon patches on the palm and the Gilbert Rugby glove, with the pimples on the glove. The all silicon gloves and the leather glove are thus not performing as well as the two gloves with a combination of silicon patches and normal fabric like spandex. This is probably due to the surface interaction and the contact surface of the different gloves. Because the Gilbert Rugby glove has the pimples, it creates a lot more contact surface on the rugby surfaces with pimples than on both the smooth rubber surfaces and the AFL surfaces as previously seen. The silicon palm gloves are exactly the opposite. Because they are smooth themselves, the contact area becomes less when the surface is not smooth but pimpled. For a lot of the surfaces, the spread of the different gloves is also less then for the AFL surfaces. In the wet tests, given in Figure 4.7 the trend seen with AFL shows again. The hand performance of both hands is better than almost all gloves on all surfaces. Seen again is the poor performance of the silicon gloves compared to the Gilbert Rugby glove. The Franklin glove also is significantly better in these wet conditions and is the second best glove for almost all surfaces. Also looking at the hand measurements, one can see that both hands have approximately the same behavior if one looks at the performance at different surfaces New gloves For new gloves, the behavior and the results of the different gloves are comparable to the old gloves, as can be seen in Figure 4.8 and Figure 4.9. The Gilbert Rugby glove and the Gripworx glove are again performing best in dry conditions, ending up together with the hand measurements, while the Franklin and the Nike Vaporjet gloves are consistently performing worse. In the wet conditions there still is an advantage for both hands compared to the gloves for most of the surfaces. The Gripworx glove decreases again for the pimpled surfaces to values around the same values as the Franklin glove and the Gilbert glove stays around the same values. Over all test conditions, a few things can be concluded. In dry conditions the Gripworx glove performs very well, but for the wet tests the results decrease significantly. The all silicon gloves that performed very well for the AFL surfaces do not seem to perform very well on the rugby surfaces and as said, this is thought to be a consequence of less contact surface. The Gilbert glove is very stable in the values of the COF, giving values between 1.5 and 1.8 for every surface in every condition. The reason for this constant behavior is again the pimples on both the surfaces and the gloves. In dry conditions this creates more contact surface and interlocking can occur between the two different pimples. Next to that, in the wet conditions, the pimples of the glove can get to the surface and create contact easier than a for example all silicon palm. The all silicon gloves therefore give a more slippery behavior in wet conditions. This leads to a conclusion that if one has to choose for a glove to wear for all weather conditions, this would be the Gilbert Rugby glove. 14
23 Figure 4.6: Results rugby surfaces for old gloves in dry conditions Figure 4.7: Results rugby surfaces for old gloves in wet conditions 15
24 Figure 4.8: Results rugby surfaces for new gloves in dry conditions Figure 4.9: Results rugby surfaces for new gloves in wet conditions 16
25 With the results of the hands taken into account, the final conclusion can be drawn that wearing gloves is not really necessary from the results. Of course there are also psychological and personal aspects in the mix if it does make a difference for a player, but these were not taken into account for this research. 4.3 Individual gloves Dry vs Wet From the test results, it became apparent that some gloves perform better in the dry or in the wet. To show this graphically, seperate scatter graphs are made for each glove, showing the results in the dry on the horizontal axis plotted against the results in the wet on the vertical axis. Different series are made of old and new gloves, as well as AFL and rugby results. To make comparison a bit easier, all gloves with silicone are given in the first five figures, Figure 4.10 till Figure These figures show the UA Blur II, which showed to be the best on AFL surfaces, the Gripworx glove, all three Nike gloves and the Gilbert glove, in that order. The first five all have all silicon palms or large silicon patches and if one looks at all these graphs, all results are on the dry side of the graph. This means that wearing silicon gloves is better in dry conditions than in wet conditions. All the gloves also show a trend in which the coefficient of friction develops. This trend is that the more sticky the gloves get, the more they are on the dry side of the line. For the Magnigrip and Vaporjet gloves, there is another clear conclusion to be drawn. For both of these gloves, all AFL points and two rugby surfaces are separated from the rest of the gloves. These two rugby surfaces are both smooth surfaces that were tested. From this it can be concluded that the gloves give a better result on smooth surfaces. The Gripworx glove (Figure 4.11) gives about the same results, although the points are a bit more scattered. All points that are outside of the big group of points are points of the AFL surfaces or the smooth surfaces. For the Gilbert Rugby glove (Figure 4.15), the pattern is that it is very much on the line, so it behaves equally as good in dry as in wet conditions. As already concluded earlier, this makes that it is good to use this type of glove in all weather conditions. In Figure 4.16 and Figure 4.17, the results for the two gloves with a thin silicone pattern on a spandex palm, the Gilbert Netball and the Grays Hockey glove, are given. These show a scattering around the line for equal behavior in dry and wet conditions, but for these gloves the COF results are not very high also. The last two gloves are the Rawlings and the Franklin leather gloves. For the AFL surfaces they both show better results in the wet conditions, as opposed to the silicone gloves. For rugby surfaces only the Franklin was tested of these two and these results are often around the line of equal behavior, with the old glove performing slightly better in wet conditions and the new glove slightly better in dry conditions. All this has to be compared with the behavior of the hands to be able to draw conclusions about the use of gloves. In Figure 4.20, the results for the hand can be seen and all these results tend very much to the wet side of the line. This means that the hand has more grip when the ball is wet. When this is compared to the gloves, one can conclude that in wet conditions, the bare hand is probably the best to use in both AFL and rugby. In dry conditions however, the silicone gloves come into play, because they have a very high coefficient of friction for especially the AFL surfaces. As shown in the previous section, in rugby they are not of great extra use at the moment. Figure 4.10: UA Blur II dry vs wet Figure 4.11: Gripworx dry vs wet 17
26 Figure 4.12: Nike Magnigrip dry vs wet Figure 4.13: Nike Vaporjet dry vs wet Figure 4.14: Nike Superbad dry vs wet Figure 4.15: Gilbert Rugby dry vs wet Figure 4.16: Gilbert Netball dry vs wet Figure 4.17: Grays Hockey dry vs wet Figure 4.18: Rawlings dry vs wet Figure 4.19: Franklin dry vs wet 18
27 Figure 4.20: Hands Old vs New To compare the old and new gloves to each other, scatter graphs for these conditions are also given in Figure 4.21 till Figure These figures show only the Franklin, Gripworx, Nike Vaporjet and Gilbert Rugby gloves, because these are the only gloves that were tested in old and new conditions at the moment. If one looks at the figures, there are less clear differences between old and new conditions than there were for dry and wet conditions. For the Franklin gloves, it looks like there is a slight preference for older gloves for the rugby surfaces in the wet, as well as for the AFL surfaces in the dry. The Gripworx glove has some more outliers. For the wet rugby tests, there are two points further out on the new side and those are both smooth rugby surfaces. The dry AFL data are giving a preference for old gloves for three out of the four surfaces and the rest of the combinations are around the equal performance line. For the Nike Vaporjet the trend for dry AFL and rugby looks the same as for the Gripworx and the two AFL tests that could be done display a preference for the old side, but this can not be conclusively said before more combinations are tested. The Gilbert Rugby glove is again very consistent in the equal performance between old and new gloves. Figure 4.21: Franklin old vs new Figure 4.22: Gripworx old vs new 19
28 Figure 4.23: Vaporjet old vs new Figure 4.24: Gilbert Rugby old vs new 20
29 Chapter 5 Conclusions and Discussion 5.1 Conclusions From all the results given above, a few conclusions can be drawn. These conclusions will again be divided into a part purely for AFL and a part for rugby. After that, some conclusions will be given about the individual gloves, both about old and new conditions and about dry and wet conditions AFL This research was in the first place executed for the AFL in order to find a quantification of the advantage gloves have over using the bare hand. From the results we can conclude that the use of gloves is very dependent on the person and on the weather conditions played in, but also that some gloves have a very high coefficient of friction in dry conditions compared to results achieved with the bare hand. These gloves are the Nike Magnigrip, Nike Vaporjet, Nike Superbad, Gripworx Ironclad and Under Armour Blur II gloves. The biggest part of the palms of these gloves are all made out of silicone, while the other gloves are all made out of different materials. This leads to the conclusion that the gloves mentioned have a significant advantage over the use of the bare hand. For all other gloves it depends on the player that wears them if they have an advantage. In wet conditions the hand performs better on the leather surfaces than in dry conditions. The results showed that the Gripworx and Under Armour gloves still were quite good, but the rest was not significantly better than the use of the bare hand and thus it can be concluded that gloves are of less use in wet conditions Rugby In rugby the behavior of the gloves is shown to be different than the behavior in AFL. The hands perform a lot better compared to the gloves and the Gilbert glove also performs a lot better and is also very constant throughout testing the different surfaces. It is concluded that this is because of the contact area created between the glove and the surface. The all silicon palm gloves have a much bigger surface area on the smooth leather surfaces, as well as on the smooth rugby surfaces, but on the pimpled surfaces, they lose a lot of contact area, because they just rest on the pimples. The Gilbert glove however creates more contact surface on the pimpled surfaces, because the pimples can slide into each other to a certain degree. This is probably also the reason for the consistent results over all different pimpled surfaces for this glove Old vs New Gloves When testing the gloves, they tend to show signs of wear after 20 measurements. The gloves that were available were tested also in worn off conditions and the results for this were not conclusive about weather old or new gloves have a better performance. The Gripworx showed a slight preference for new gloves on AFL surfaces and the outliers were again the smooth surfaces. The Gilbert glove showed a very equal performance again and the rest of the gloves were not showing a significant preference for old or new gloves. 21
30 5.1.4 Dry vs Wet To see if gloves were better in wet or in dry conditions, scatter graphs have been shown and from this we can conclude that all gloves with a majority of silicon in the palm perform better in dry conditions, while the leather gloves perform better in the wet for the AFL surfaces, while the rugby surfaces showed to be on the line of equal behavior in dry and wet conditions. The Gilbert Rugby behaves the same for dry and wet, so it can be said that this is the best glove for all weather conditions. For the remaining two gloves, being the Gilbert Netball and Grays Hockey glove, there is no definite conclusion over the performance in dry or wet. 5.2 Discussion Standardized Test Setup To test the gloves in a standardized way, there has to be a test setup with which all gloves can be tested the same. This setup should consist of a force plate, possibly the one already used in the hand measurements. On the force plate, the surface and glove of interest have to be mounted. A weight element has to be put on the glove to exert a normal force and the glove has to be connected to an electric motor that can pull the glove over the surface. The motor used in this case is a Roycecross geared electric motor (Product code PGM70R6-15W) with a maximum torque of 5 Nm, a speed of 6 rpm and a gear ratio of 250:1. The way the measurements are carried out is the same as the initial testing with the hand. Unfortunately, this part of the project could not be finished in time, so this is one of the next steps due to be taken in the project. To be able to tell the quantitative differences between worn gloves and new gloves, there also has to be an automated setup, which can wear off the gloves, so there should be a friction mechanism like a treadmill on which the glove is mounted for some time Force measurements The force measurements also did not materialize in the right time frame, because the instrumentation in the ball broke down during testing. This part of the research is at the point where it is going to be tested in the very near future, leading to a better insight of the forces acting on the ball and the hand during the game. Further development of the ball and the glove subsequently has to be done to make it more standardized than it is now, for example by getting a standard instrumented ball from the manufacturer Comfort A property that can not be researched, because it is subjective from one person to another is the comfort of the different gloves. This has also a big influence on which glove a certain player wants to wear and it is regardless of the actual performance of the gloves. When a player does not feel comfortable wearing a certain glove, this will mean that he is less confident and as a consequence will probably play worse than without a glove. As said, this property is very subjective and depends on the player and maybe even on the circumstances and therefore it is not regarded as a research parameter Wet Testing The amount of water used in the wet testing phase may be a bit high, but it was only to get a good idea of the differences between the gloves in different circumstances. To map the whole behavior of the gloves, it may be a good idea to do more tests with different amounts of water when the standardized test setup is designed and working properly Hand Testing The hand testing was done by two different people. Because hands are unique, these two hands are no real good average of a normal hand, especially because the two hands are also far from each other. To get a better insight into hand behavior, more hands could be tested and possibly also with actual players of AFL and rugby. 22
31 Bibliography [1] Laws of Australian Football 2012, AFL laws.pdf, retrieved on July 30, [2] Tomlinson, S.E., Lewis, R., Carré, M.J., Friction between Players Hands and Sports Equipment, The Engineering of Sport 7, Vol 1, p26-34, Springer Verlag France, Paris, [3] Tomlinson, S.E., Lewis, R., Ball, S., Yoxall, A. & Carré, M.J., Understanding the effect of finger-ball friction on the handling performance of rugby balls, Sports Engineering 11, p , 6 February [4] Tomlinson, S.E., Lewis, R., Liu, X., Texier, C. & Carré, M.J., Understanding the friction mechanisms between the human finger and flat contacting surfaces in moist conditions, Tribology Lett. (2011) 41, , 24 October 2010 [5] Fuss, F.K., Friction of a pimpled rugby ball surface: force and velocity weakening and strengthening of the coefficient of friction, Journal of Engineering Tribology, vol. 226, no 7, p , July [6] Ball, K., Foot interaction during kicking in Australian Rules Football, Science and Football VI: The Proceedings of the Sixth World Congress on Science and Football, Routledge, New York, 2009, p


32 Appendix A Gloves Below you will find an overview of the gloves tested, with details. Figure A.1: The Franklin glove used in the testing Figure A.2: Detail of the Franklin glove Figure A.3: Worn Franklin glove Figure A.4: Detail of the worn Franklin glove Figure A.5: The Gripworx glove used in the testing Figure A.6: Detail of the Gripworx glove 24


33 Figure A.7: Worn Gripworx glove Figure A.8: Detail of the worn Gripworx glove Figure A.9: Worn Nike Magnigrip glove Figure A.10: Detail of the worn Nike Magnigrip glove Figure A.11: Worn Nike Vaporjet glove Figure A.12: Detail of the worn Nike Vaporjet glove Figure A.14: Detail of the worn Gilbert rugby glove Figure A.13: Gilbert rugby glove 25


34 Figure A.15: Grays Hockey glove Figure A.16: Detail of the Grays glove Figure A.17: Gilbert Netball glove Figure A.18: Detail of the Gilbert Netball glove Figure A.19: Nike Superbad glove Figure A.20: Detail of the Rawlings glove Figure A.21: Under Armour Blur II Glove 26


35 Appendix B Surfaces Below there is an overview of all the surfaces tested, with the details. Figure B.1: Red patch of an official ball Figure B.2: Yellow patch of an official ball Figure B.3: The patch of plain red leather Figure B.4: The patch of plain yellow leather Figure B.5: The patch of the first plain rubber surface Figure B.6: The patch of the second plain rubber surface 27


36 Figure B.7: Detail of the experimental Regular pattern Figure B.8: Detail of the Rugby Union pattern Figure B.9: Detail of the National Rugby League pattern Figure B.10: Detail of the Fine Japanese pattern Figure B.11: Detail of the Snowflake surface 28
Kick precision and spin rate in drop and torpedo punts
 Available online at www.sciencedirect.com Procedia Engineering 60 ( 2013 ) 448 452 6 th Asia-Pacific Congress on Sports Technology (APCST) Kick precision and spin rate in drop and torpedo punts Franz Konstantin
Agood tennis player knows instinctively how hard to hit a ball and at what angle to get the ball over the. Ball Trajectories
 42 Ball Trajectories Factors Influencing the Flight of the Ball Nathalie Tauziat, France By Rod Cross Introduction Agood tennis player knows instinctively how hard to hit a ball and at what angle to get
Effects of seam and surface texture on tennis balls aerodynamics
 Available online at www.sciencedirect.com Procedia Engineering 34 (2012 ) 140 145 9 th Conference of the International Sports Engineering Association (ISEA) Effects of seam and surface texture on tennis
Available online at ScienceDirect. The 2014 Conference of the International Sports Engineering Association
 Available online at www.sciencedirect.com ScienceDirect Procedia Engineering 72 ( 2014 ) 435 440 The 2014 Conference of the International Sports Engineering Association Accuracy performance parameters
Friction occurs when surfaces slide against each other.
 Chapter 12, Section 2 Key Concept: Friction is a force that opposes motion. BEFORE, you learned Gravity is the attractive force masses exert on each other Gravity increases with greater mass and decreases
Preliminary design of a high-altitude kite. A flexible membrane kite section at various wind speeds
 Preliminary design of a high-altitude kite A flexible membrane kite section at various wind speeds This is the third paper in a series that began with one titled A flexible membrane kite section at high
Measurement of court speed and bounce. Rod Cross, Physics Department, Sydney University 2nd July 2006
 1 Measurement of court speed and bounce Rod Cross, Physics Department, Sydney University 2nd July 2006 The speed of a surface refers to the change in ball speed in a direction parallel to the surface.
Effect of the Grip Angle on Off-Spin Bowling Performance Parameters, Analysed with a Smart Cricket Ball
 Proceedings Effect of the Grip Angle on Off-Spin Bowling Performance Parameters, Analysed with a Smart Cricket Ball Franz Konstantin Fuss 1, *, Batdelger Doljin 1 and René E. D. Ferdinands 2 1 Smart Equipment
Aerodynamic Terms. Angle of attack is the angle between the relative wind and the wing chord line. [Figure 2-2] Leading edge. Upper camber.
![Aerodynamic Terms. Angle of attack is the angle between the relative wind and the wing chord line. [Figure 2-2] Leading edge. Upper camber.](/thumbs/82/86661300.jpg "Aerodynamic Terms. Angle of attack is the angle between the relative wind and the wing chord line. [Figure 2-2] Leading edge. Upper camber.") Chapters 2 and 3 of the Pilot s Handbook of Aeronautical Knowledge (FAA-H-8083-25) apply to powered parachutes and are a prerequisite to reading this book. This chapter will focus on the aerodynamic fundamentals
Chapters 2 and 3 of the Pilot s Handbook of Aeronautical Knowledge (FAA-H-8083-25) apply to powered parachutes and are a prerequisite to reading this book. This chapter will focus on the aerodynamic fundamentals
Available online at ScienceDirect. Procedia Engineering 112 (2015 )
") Available online at www.sciencedirect.com ScienceDirect Procedia Engineering 112 (2015 ) 196 201 7th Asia-Pacific Congress on Sports Technology, APCST 2015 Dynamics of spin bowling: the normalized precession
Available online at www.sciencedirect.com ScienceDirect Procedia Engineering 112 (2015 ) 196 201 7th Asia-Pacific Congress on Sports Technology, APCST 2015 Dynamics of spin bowling: the normalized precession
Comparing GU & Savier airfoil equipped half canard In S4 wind tunnel (France)
") Some notes about Comparing GU & Savier airfoil equipped half canard In S4 wind tunnel (France) Matthieu Scherrer Adapted from Charlie Pujo & Nicolas Gorius work Contents Test conditions 3. S-4 Wind-tunnel.............................................
Some notes about Comparing GU & Savier airfoil equipped half canard In S4 wind tunnel (France) Matthieu Scherrer Adapted from Charlie Pujo & Nicolas Gorius work Contents Test conditions 3. S-4 Wind-tunnel.............................................
Describing a journey made by an object is very boring if you just use words. As with much of science, graphs are more revealing.
 Distance vs. Time Describing a journey made by an object is very boring if you just use words. As with much of science, graphs are more revealing. Plotting distance against time can tell you a lot about
Aerodynamic drag measurement of American footballs
 Available online at www.sciencedirect.com Procedia Engineering 34 (2012 ) 98 103 9 th Conference of the International Sports Engineering Association (ISEA) Aerodynamic drag measurement of American footballs
THEORY OF WINGS AND WIND TUNNEL TESTING OF A NACA 2415 AIRFOIL. By Mehrdad Ghods
 THEORY OF WINGS AND WIND TUNNEL TESTING OF A NACA 2415 AIRFOIL By Mehrdad Ghods Technical Communication for Engineers The University of British Columbia July 23, 2001 ABSTRACT Theory of Wings and Wind
Available online at ScienceDirect. Procedia Engineering 112 (2015 )
") Available online at www.sciencedirect.com ScienceDirect Procedia Engineering 112 (2015 ) 540 545 7th Asia-Pacific Congress on Sports Technology, APCST 2015 Movement variability of professional pool billiards
Available online at www.sciencedirect.com ScienceDirect Procedia Engineering 112 (2015 ) 540 545 7th Asia-Pacific Congress on Sports Technology, APCST 2015 Movement variability of professional pool billiards
Effect on Bowling Performance Parameters When Intentionally Increasing the Spin Rate, Analysed with a Smart Cricket Ball
 Proceedings Effect on Bowling Performance Parameters When Intentionally Increasing the Spin Rate, Analysed with a Smart Cricket Ball Franz Konstantin Fuss 1, *, Batdelger Doljin 1 and René E. D. Ferdinands
Impact Points and Their Effect on Trajectory in Soccer
 Proceedings Impact Points and Their Effect on Trajectory in Soccer Kaoru Kimachi 1, *, Sungchan Hong 2, Shuji Shimonagata 3 and Takeshi Asai 2 1 Doctoral Program of Coaching Science, University of Tsukuba,
Exploring the relationship between the pressure of the ball and coefficient of restitution.
 Exploring the relationship between the pressure of the ball and coefficient of restitution. When I started thinking about possible investigations I knew I wanted to create a lab that was related to sports.
Effect of Diameter on the Aerodynamics of Sepaktakraw Balls, A Computational Study
 ISSN 1750-9823 (print) International Journal of Sports Science and Engineering Vol. 03 (2009) No. 01, pp. 017-021 Effect of Diameter on the Aerodynamics of Sepaktakraw Balls, A Computational Study Zahari
Basketball free-throw rebound motions
 Available online at www.sciencedirect.com Procedia Engineering 3 () 94 99 5 th Asia-Pacific Congress on Sports Technology (APCST) Basketball free-throw rebound motions Hiroki Okubo a*, Mont Hubbard b a
Results and Discussion for Steady Measurements
 Chapter 5 Results and Discussion for Steady Measurements 5.1 Steady Skin-Friction Measurements 5.1.1 Data Acquisition and Reduction A Labview software program was developed for the acquisition of the steady
Aerodynamic Analysis of a Symmetric Aerofoil
 214 IJEDR Volume 2, Issue 4 ISSN: 2321-9939 Aerodynamic Analysis of a Symmetric Aerofoil Narayan U Rathod Department of Mechanical Engineering, BMS college of Engineering, Bangalore, India Abstract - The
Physics P201 D. Baxter/R. Heinz
 Seat # Physics P201 D. Baxter/R. Heinz EXAM #1 September 26, 2002 7:00 9:00 PM INSTRUCTIONS 1. Sit in SEAT # given above. 2. DO NOT OPEN THE EXAM UNTIL YOU ARE TOLD TO DO SO. 3. Print your name (last name
Opleiding Informatica
 Opleiding Informatica Determining Good Tactics for a Football Game using Raw Positional Data Davey Verhoef Supervisors: Arno Knobbe Rens Meerhoff BACHELOR THESIS Leiden Institute of Advanced Computer Science
Available online at Procedia Engineering 200 (2010) (2009) In situ drag measurements of sports balls
 (2009) In situ drag measurements of sports balls") Available online at www.sciencedirect.com Procedia Engineering 200 (2010) (2009) 2437 2442 000 000 Procedia Engineering www.elsevier.com/locate/procedia 8 th Conference of the International Sports Engineering
Available online at www.sciencedirect.com Procedia Engineering 200 (2010) (2009) 2437 2442 000 000 Procedia Engineering www.elsevier.com/locate/procedia 8 th Conference of the International Sports Engineering
Improvement of an Artificial Stall Warning System for Sailplanes
 Improvement of an Artificial Stall Warning System for Sailplanes Loek M. M. Boermans and Bart Berendsen Delft University of Technology, Faculty of Aerospace Engineering P.O.Box 5058, 2600 GB Delft, The
Available online at ScienceDirect. Procedia Engineering 105 (2015 )
") Available online at www.sciencedirect.com ScienceDirect Procedia Engineering 105 (2015 ) 317 322 6th BSME International Conference on Thermal Engineering (ICTE 2014) Aerodynamic study of FIFA-approved
Available online at www.sciencedirect.com ScienceDirect Procedia Engineering 105 (2015 ) 317 322 6th BSME International Conference on Thermal Engineering (ICTE 2014) Aerodynamic study of FIFA-approved
Your web browser (Safari 7) is out of date. For more security, comfort and. the best experience on this site: Update your browser Ignore
 is out of date. For more security, comfort and. the best experience on this site: Update your browser Ignore") Your web browser (Safari 7) is out of date. For more security, comfort and Activityengage the best experience on this site: Update your browser Ignore Gearing Up with Robots How are gears used to change
Your web browser (Safari 7) is out of date. For more security, comfort and Activityengage the best experience on this site: Update your browser Ignore Gearing Up with Robots How are gears used to change
POWERED FLIGHT HOVERING FLIGHT
 Once a helicopter leaves the ground, it is acted upon by the four aerodynamic forces. In this chapter, we will examine these forces as they relate to flight maneuvers. POWERED FLIGHT In powered flight
End of Chapter Exercises
 End of Chapter Exercises Exercises 1 12 are conceptual questions that are designed to see if you have understood the main concepts of the chapter. 1. While on an airplane, you take a drink from your water
Analysis of stroke technique using acceleration sensor IC in freestyle swimming
 Analysis of stroke technique using acceleration sensor IC in freestyle swimming Y. Ohgi, M. Yasumura Faculty of Environmental Information, Keio Univ., Japan H. Ichikawa Doctoral Prog. of Health and Sport
Types of Forces. Pressure Buoyant Force Friction Normal Force
 Types of Forces Pressure Buoyant Force Friction Normal Force Pressure Ratio of Force Per Unit Area p = F A P = N/m 2 = 1 pascal (very small) P= lbs/in 2 = psi = pounds per square inch Example: Snow Shoes
Biomechanics Sample Problems
 Biomechanics Sample Problems Forces 1) A 90 kg ice hockey player collides head on with an 80 kg ice hockey player. If the first person exerts a force of 450 N on the second player, how much force does
Exploring the relationship between the pressure of the ball and coefficient of restitution.
 Exploring the relationship between the pressure of the ball and coefficient of restitution. When I started thinking about possible investigations I knew I wanted to create a lab that was related to sports.
STUDY OF LANDING TECHNIQUE DURING VISUAL APPROACH
 24 TH INTERNATIONAL CONGRESS OF THE AERONAUTICAL SCIENCES STUDY OF LANDING TECHNIQUE DURING VISUAL APPROACH Hiroshi TAKAHARA*, Takashi KONDO*, Shinji SUZUKI** *All Nippon Airways Co., LTD., **University
29 Pressure, Temperature relationship of a gas
 Chemistry Sensors: Loggers: Gas Pressure, Temperature Any EASYSENSE Logging time: EasyLog Teacher s notes 29 Pressure, Temperature relationship of a gas Read The ideal gas laws tell us that if we keep
Ski preparation as a three-dimensional problem
 Open Access Series ISSN 2509-9442 GLIDING Article 4(2017) 19-23 source: www.team-snowstorm.de/gliding Ski preparation as a three-dimensional problem Roman Böttcher, Matthias Scherge ARTICLE INFORMATION
CASE STUDY FOR USE WITH SECTION B
 GCE A level 135/01-B PHYSICS ASSESSMENT UNIT PH5 A.M. THURSDAY, 0 June 013 CASE STUDY FOR USE WITH SECTION B Examination copy To be given out at the start of the examination. The pre-release copy must
Homework #10 Due Monday, May Compute the moment of inertia of the objects below.
 Homework #10 Due Monday, May 1. Compute the moment of inertia of the objects below. θ (a) Compute the moment of inertia of a thin rod of mass M and length R for rotations about its end. Explain why your
Available online at ScienceDirect. Procedia Engineering 112 (2015 )
") Available online at www.sciencedirect.com ScienceDirect Procedia Engineering 112 (2015 ) 395 399 7 th Asia-Pacific Congress on Sports Technology, APCST 2015 A comparative study of vent designs for effective
Available online at www.sciencedirect.com ScienceDirect Procedia Engineering 112 (2015 ) 395 399 7 th Asia-Pacific Congress on Sports Technology, APCST 2015 A comparative study of vent designs for effective
Incompressible Potential Flow. Panel Methods (3)
") Incompressible Potential Flow Panel Methods (3) Outline Some Potential Theory Derivation of the Integral Equation for the Potential Classic Panel Method Program PANEL Subsonic Airfoil Aerodynamics Issues
Incompressible Potential Flow Panel Methods (3) Outline Some Potential Theory Derivation of the Integral Equation for the Potential Classic Panel Method Program PANEL Subsonic Airfoil Aerodynamics Issues
The effect of back spin on a table tennis ball moving in a viscous fluid.
 How can planes fly? The phenomenon of lift can be produced in an ideal (non-viscous) fluid by the addition of a free vortex (circulation) around a cylinder in a rectilinear flow stream. This is known as
COMPUTATIONAL FLUID DYNAMIC ANALYSIS OF AIRFOIL NACA0015
 International Journal of Mechanical Engineering and Technology (IJMET) Volume 8, Issue 2, February 2017, pp. 210 219 Article ID: IJMET_08_02_026 Available online at http://www.iaeme.com/ijmet/issues.asp?jtype=ijmet&vtype=8&itype=2
End of Chapter Exercises
 End of Chapter Exercises Exercises 1 12 are conceptual questions that are designed to see if you have understood the main concepts of the chapter. 1. While on an airplane, you take a drink from your water
Detailed study 3.4 Topic Test Investigations: Flight
 Name: Billanook College Detailed study 3.4 Topic Test Investigations: Flight Ivanhoe Girls Grammar School Questions 1 and 2 relate to the information shown in the diagram in Figure 1. z Question 1 y Figure
Yasuyuki Hirose 1. Abstract
 Study on Tsunami force for PC box girder Yasuyuki Hirose 1 Abstract In this study, a waterway experiment was performed in order to understand the influence of tsunami forms on tsunami forces acting on
WIND-INDUCED LOADS OVER DOUBLE CANTILEVER BRIDGES UNDER CONSTRUCTION
 WIND-INDUCED LOADS OVER DOUBLE CANTILEVER BRIDGES UNDER CONSTRUCTION S. Pindado, J. Meseguer, J. M. Perales, A. Sanz-Andres and A. Martinez Key words: Wind loads, bridge construction, yawing moment. Abstract.
Instruction Manual. Pipe Friction Training Panel
 Instruction Manual HL 102 Pipe Friction Training Panel 100 90 80 70 60 50 40 30 20 10 HL 102 Instruction Manual This manual must be kept by the unit. Before operating the unit: - Read this manual. - All
Measurement of Pressure. The aerofoil shape used in wing is to. Distribution and Lift for an Aerofoil. generate lift due to the difference
 Measurement of Pressure Distribution and Lift for an Aerofoil. Objective The objective of this experiment is to investigate the pressure distribution around the surface of aerofoil NACA 4415 and to determine
Dick Bowdler Acoustic Consultant
 Dick Bowdler Acoustic Consultant 01383 882 644 077 8535 2534 dick@dickbowdler.co.uk WIND SHEAR AND ITS EFFECT ON NOISE ASSESSMENT OF WIND TURBINES June 2009 The Haven, Low Causeway, Culross, Fife. KY12
A Hare-Lynx Simulation Model
 1 A Hare- Simulation Model What happens to the numbers of hares and lynx when the core of the system is like this? Hares O Balance? S H_Births Hares H_Fertility Area KillsPerHead Fertility Births Figure
Variation of Nordic Classic Ski Characteristics from Norwegian national team athletes
 Available online at www.sciencedirect.com Procedia Engineering 34 (2012 ) 391 396 p 9 th Conference of the International Sports Engineering Association (ISEA) Variation of Nordic Classic Ski Characteristics
Aircraft Design Prof. A.K Ghosh Department of Aerospace Engineering Indian Institute of Technology, Kanpur
 Aircraft Design Prof. A.K Ghosh Department of Aerospace Engineering Indian Institute of Technology, Kanpur Lecture - 12 Design Considerations: Aerofoil Selection Good morning friends. The last lecture
Analysis of Backward Falls Caused by Accelerated Floor Movements Using a Dummy
 Original Article Analysis of Backward Falls Caused by Accelerated Floor Movements Using a Dummy Hisao NAGATA 1 * and Hisato OHNO 2 1 National Institute of Occupational Safety and Health, 1 4 6 Umezono,
Vertical Wind Energy Engineering Design and Evaluation of a Twisted Savonius Wind Turbine
 Design and Evaluation of a Twisted Savonius Wind Turbine Ian Duffett Jeff Perry Blaine Stockwood Jeremy Wiseman Outline Problem Definition Introduction Concept Selection Design Fabrication Testing Results
Stability and Flight Controls
 Stability and Flight Controls Three Axes of Flight Longitudinal (green) Nose to tail Lateral (blue) Wing tip to Wing tip Vertical (red) Top to bottom Arm Moment Force Controls The Flight Controls Pitch
Walk - Run Activity --An S and P Wave Travel Time Simulation ( S minus P Earthquake Location Method)
") Walk - Run Activity --An S and P Wave Travel Time Simulation ( S minus P Earthquake Location Method) L. W. Braile and S. J. Braile (June, 2000) braile@purdue.edu http://web.ics.purdue.edu/~braile Walk
Walk - Run Activity --An S and P Wave Travel Time Simulation ( S minus P Earthquake Location Method) L. W. Braile and S. J. Braile (June, 2000) braile@purdue.edu http://web.ics.purdue.edu/~braile Walk
Level 3 Cambridge Technical in Engineering 05822/05823/05824/05825/05873 Unit 3: Principles of mechanical engineering
 Level 3 Cambridge Technical in Engineering 05822/05823/05824/05825/05873 Unit 3: Principles of mechanical engineering Monday 16 January 2017 Afternoon Time allowed: 1 hour 30 minutes You must have: the
AERODYNAMICS I LECTURE 7 SELECTED TOPICS IN THE LOW-SPEED AERODYNAMICS
 LECTURE 7 SELECTED TOPICS IN THE LOW-SPEED AERODYNAMICS The sources of a graphical material used in this lecture are: [UA] D. McLean, Understanding Aerodynamics. Arguing from the Real Physics. Wiley, 2013.
Activities for Measuring Acceleration and Deceleration due to Gravity and Friction. Grade Level: Middle School
 Activities for Measuring Acceleration and Deceleration due to Gravity and Friction Grade Level: Middle School Author: Ron Hurlbut - Illinois Math and Science Academy (rshurl@imsa.edu) Two activities are
Variable Face Milling to Normalize Putter Ball Speed and Maximize Forgiveness
 Proceedings Variable Face Milling to Normalize Putter Ball Speed and Maximize Forgiveness Jacob Lambeth *, Dustin Brekke and Jeff Brunski Cleveland Golf, 5601 Skylab Rd. Huntington Beach, CA 92647, USA;
Welcome to Aerospace Engineering
 Welcome to Aerospace Engineering DESIGN-CENTERED INTRODUCTION TO AEROSPACE ENGINEERING Notes 4 Topics 1. Course Organization 2. Today's Dreams in Various Speed Ranges 3. Designing a Flight Vehicle: Route
- a set of known masses, - four weight hangers, - tape - a fulcrum upon which the meter stick can be mounted and pivoted - string - stopwatch
 1. In the laboratory, you are asked to determine the mass of a meter stick without using a scale of any kind. In addition to the meter stick, you may use any or all of the following equipment: - a set
An Impeller Blade Analysis of Centrifugal Gas Compressor Using CFD
 An Impeller Blade Analysis of Centrifugal Gas Compressor Using CFD Vivek V. Kulkarni Department of Mechanical Engineering KLS Gogte Institute of Technology, Belagavi, Karnataka Dr. Anil T.R. Department
Experimental Analysis on Vortex Tube Refrigerator Using Different Conical Valve Angles
 International Journal of Engineering Research and Development e-issn: 7-067X, p-issn: 7-00X, www.ijerd.com Volume 3, Issue 4 (August ), PP. 33-39 Experimental Analysis on Vortex Tube Refrigerator Using
Low Speed Wind Tunnel Wing Performance
 Low Speed Wind Tunnel Wing Performance ARO 101L Introduction to Aeronautics Section 01 Group 13 20 November 2015 Aerospace Engineering Department California Polytechnic University, Pomona Team Leader:
Influence of the Number of Blades on the Mechanical Power Curve of Wind Turbines
 European Association for the Development of Renewable Energies, Environment and Power quality International Conference on Renewable Energies and Power Quality (ICREPQ 9) Valencia (Spain), 15th to 17th
The Aging Curve(s) Jerry Meyer, Central Maryland YMCA Masters (CMYM)
 Jerry Meyer, Central Maryland YMCA Masters (CMYM)") The Aging Curve(s) Jerry Meyer, Central Maryland YMCA Masters (CMYM) Even the well-publicized benefits of Masters Swimming cannot prevent us from eventually slowing down as we get older. While some find
The Aging Curve(s) Jerry Meyer, Central Maryland YMCA Masters (CMYM) Even the well-publicized benefits of Masters Swimming cannot prevent us from eventually slowing down as we get older. While some find
6. EXPERIMENTAL METHOD. A primary result of the current research effort is the design of an experimental
 6. EXPERIMENTAL METHOD 6.1 Introduction A primary result of the current research effort is the design of an experimental setup that can simulate the interaction of a windmill with a vortex wake and record
College of Engineering
 College of Engineering Department of Mechanical and Aerospace Engineering MAE-250, Section 001 Introduction to Aerospace Engineering Final Project Bottle Rocket Written By: Jesse Hansen Connor Petersen
Heat Engine. Reading: Appropriate sections for first, second law of thermodynamics, and PV diagrams.
 Heat Engine Equipment: Capstone, 2 large glass beakers (one for ice water, the other for boiling water), temperature sensor, pressure sensor, rotary motion sensor, meter stick, calipers, set of weights,
Ozobot Bit Classroom Application: Boyle s Law Simulation
 OZO AP P EAM TR T S BO RO VE D Ozobot Bit Classroom Application: Boyle s Law Simulation Created by Richard Born Associate Professor Emeritus Northern Illinois University richb@rborn.org Topics Chemistry,
Biomechanics of Parkour: The Vertical Wall-Run Technique
 University of Colorado, Boulder CU Scholar Undergraduate Honors Theses Honors Program Spring 2015 Biomechanics of Parkour: The Vertical Wall-Run Technique Integrative Physiology, Peter.Lawson@Colorado.EDU
Hockey Scholars: Math and Science Test Study Guide-Answer Key
 1. On this scatterplot, the skate blades with the largest radius of hollow are found in: Section C 2. Using this scatterplot, you can conclude that skate blades with the smallest radius of hollow tend
BIOMECHANICAL MOVEMENT
 SECTION PART 5 5 CHAPTER 12 13 CHAPTER 12: Biomechanical movement Practice questions - text book pages 169-172 1) For which of the following is the athlete s centre of mass most likely to lie outside of
CHAPTER 9 PROPELLERS
 CHAPTER 9 CHAPTER 9 PROPELLERS CONTENTS PAGE How Lift is Generated 02 Helix Angle 04 Blade Angle of Attack and Helix Angle Changes 06 Variable Blade Angle Mechanism 08 Blade Angles 10 Blade Twist 12 PROPELLERS
Characteristics of modern soccer balls
 Available online at www.sciencedirect.com Procedia Engineering 34 (01 ) 1 17 9 th Conference of the International Sports Engineering Association (ISEA) Characteristics of modern soccer balls Takeshi Asai
Parasite Drag. by David F. Rogers Copyright c 2005 David F. Rogers. All rights reserved.
 Parasite Drag by David F. Rogers http://www.nar-associates.com Copyright c 2005 David F. Rogers. All rights reserved. How many of you still have a Grimes rotating beacon on both the top and bottom of the
Friction properties of the face of a hand-held tennis racket
 Available online at www.sciencedirect.com Procedia Engineering 34 (2012 ) 544 549 9 th Conference of the International Sports Engineering Association (ISEA) Friction properties of the face of a hand-held
AERODYNAMICS OF TEXTILES FOR ELITE CYCLIST
 Proceedings of the International Conference on Mechanical Engineering 2009 (ICME2009) 26-28 December 2009, Dhaka, Bangladesh ICME09- AERODYNAMICS OF TEXTILES FOR ELITE CYCLIST Harun Chowdhury, Firoz Alam,
How Does A Wind Turbine's Energy Production Differ from Its Power Production? 1
 Siting Wind Power: Wind Power Curves & Community Considerations (Teacher Notes) (Assessing the Feasibility of Wind Power for Pennsylvania) Notes on Part 1 A Beaufort scale is included on the next page
Kinematics errors leading to Ski Injuries (2015) Haleh Dadgostar MD Sports Medicine Specialist Iran University of Medical Sciences
 Haleh Dadgostar MD Sports Medicine Specialist Iran University of Medical Sciences") Kinematics errors leading to Ski Injuries (2015) Haleh Dadgostar MD Sports Medicine Specialist Iran University of Medical Sciences Alpine Ski Practice of skiing : 5000 years ago when early hunters and
Kinematics errors leading to Ski Injuries (2015) Haleh Dadgostar MD Sports Medicine Specialist Iran University of Medical Sciences Alpine Ski Practice of skiing : 5000 years ago when early hunters and
14 The Divine Art of Hovering
 14 The Divine Art of Hovering INTRODUCTION Having learned the fundamentals of controlling the helicopter in forward flight, the next step is hovering. To the Hover! In many schools, hovering is one of
Wind loads investigations of HAWT with wind tunnel tests and site measurements
 loads investigations of HAWT with wind tunnel tests and site measurements Shigeto HIRAI, Senior Researcher, Nagasaki R&D Center, Technical Headquarters, MITSUBISHI HEAVY INDSUTRIES, LTD, Fukahori, Nagasaki,
Mechanical Engineering Research Journal AN EXPERIMENTAL STUDY ON SPEED SKATING SKINSUITS
 Dept. of Mech. Eng. CUET Published Online March 2015 (http://www.cuet.ac.bd/merj/index.html) Mechanical Engineering Research Journal Vol. 9, pp. 110 114, 2013 M E R J ISSN: 1990-5491 AN EXPERIMENTAL STUDY
THE CURVE OF THE CRICKET BALL SWING AND REVERSE SWING
 Parabola Volume 32, Issue 2 (1996) THE CURVE OF THE CRICKET BALL SWING AND REVERSE SWING Frank Reid 1 It is a well known fact in cricket that the new ball when bowled by a fast bowler will often swing
Figure 1. The distance the train travels between A and B is not the same as the displacement of the train.
 THE DISTANCE-TIME RELATIONSHIP Q1. A train travels from town A to town B. Figure 1 shows the route taken by the train. Figure 1 has been drawn to scale. Figure 1 (a) The distance the train travels between
DEFINITIONS. Aerofoil
 Aerofoil DEFINITIONS An aerofoil is a device designed to produce more lift (or thrust) than drag when air flows over it. Angle of Attack This is the angle between the chord line of the aerofoil and the
THE INNER WORKINGS OF A SIPHON Jacques Chaurette p. eng. January 2003
 THE INNER WORKINGS OF A SIPHON Jacques Chaurette p. eng. www.lightmypump.com January 2003 Synopsis The objective of this article is to explain how a siphon works. The difference between low pressure, atmospheric
Procedia Engineering 00 2 (2010) (2009) Properties of friction during the impact between tennis racket surface and ball
 (2009) Properties of friction during the impact between tennis racket surface and ball") Procedia Engineering 00 2 (2010) (2009) 000 000 2973 2978 Procedia Engineering www.elsevier.com/locate/procedia 8 th Conference of the International Sports Engineering Association (ISEA) Properties of
Procedia Engineering 00 2 (2010) (2009) 000 000 2973 2978 Procedia Engineering www.elsevier.com/locate/procedia 8 th Conference of the International Sports Engineering Association (ISEA) Properties of
Paper 2.2. Operation of Ultrasonic Flow Meters at Conditions Different Than Their Calibration
 Paper 2.2 Operation of Ultrasonic Flow Meters at Conditions Different Than Their Calibration Mr William Freund, Daniel Measurement and Control Mr Klaus Zanker, Daniel Measurement and Control Mr Dale Goodson,
Helicopter C.E.R. Teacher Pages
 Helicopter C.E.R. Teacher Pages 45 Minutes Objective Students will conduct an experiment to determine if wing length will affect the descent time of a paper helicopter. Students will analyze their data
Available online at Procedia Engineering 200 (2010) (2009)
 (2009)") Available online at www.sciencedirect.com Procedia Engineering 200 (2010) (2009) 000 000 2487 2492 Procedia Engineering www.elsevier.com/locate/procedia 8 th Conference of the International Sports Engineering
Available online at www.sciencedirect.com Procedia Engineering 200 (2010) (2009) 000 000 2487 2492 Procedia Engineering www.elsevier.com/locate/procedia 8 th Conference of the International Sports Engineering
Engineering Flettner Rotors to Increase Propulsion
 Engineering Flettner Rotors to Increase Propulsion Author: Chance D. Messer Mentor: Jeffery R. Wehr Date: April 11, 2016 Advanced STEM Research Laboratory, Odessa High School, 107 E 4 th Avenue, Odessa
Numerical Simulations of a Train of Air Bubbles Rising Through Stagnant Water
 Numerical Simulations of a Train of Air Bubbles Rising Through Stagnant Water Hong Xu, Chokri Guetari ANSYS INC. Abstract Transient numerical simulations of the rise of a train of gas bubbles in a liquid
Pressure distribution of rotating small wind turbine blades with winglet using wind tunnel
 Journal of Scientific SARAVANAN & Industrial et al: Research PRESSURE DISTRIBUTION OF SMALL WIND TURBINE BLADES WITH WINGLET Vol. 71, June 01, pp. 45-49 45 Pressure distribution of rotating small wind
Table of Contents. Career Overview... 4
 Table of Contents Career Overview.................................................. 4 Basic Lesson Plans Activity 1 Design a Straw Rocket I...................................... 5 Activity 2 Design a Straw
AIS data analysis for vessel behavior during strong currents and during encounters in the Botlek area in the Port of Rotterdam
 International Workshop on Next Generation Nautical Traffic Models 2013, Delft, The Netherlands AIS data analysis for vessel behavior during strong currents and during encounters in the Botlek area in the
+ t1 t2 moment-time curves
 Part 6 - Angular Kinematics / Angular Impulse 1. While jumping over a hurdle, an athlete s hip angle was measured to be 2.41 radians. Within 0.15 seconds, the hurdler s hip angle changed to be 3.29 radians.
A Study on the Effects of Wind on the Drift Loss of a Cooling Tower
 A Study on the Effects of Wind on the Drift Loss of a Cooling Tower Wanchai Asvapoositkul 1* 1 Department of Mechanical Engineering, Faculty of Engineering, King Mongkut s University of Technology Thonburi