How To Win The Ashes A Statistician s Guide
|
|
|
- Bruno Shaw
- 5 years ago
- Views:
Transcription
1 How To Win The Ashes A Statistician s Guide Kevin Wang Sydney Universtiy Mathematics Society Last Modified: August 21, 2015
2 Motivation How come SUMS doesn t do statistics talk very often?
3 Motivation How come SUMS doesn t do statistics talk very often? Motivation Given the dynamic nature of the cricket game, how can we judge a player s career statistics/abilities in a meaningful way?
4 Motivation How come SUMS doesn t do statistics talk very often? Motivation Given the dynamic nature of the cricket game, how can we judge a player s career statistics/abilities in a meaningful way? How can we classify players with similar styles into some categories? How can we find interesting patterns? How does statistics students operate?
5 Outline of This Talk Theories of Principal Component Analysis (PCA) 1. The Don. The Ashes in England. The younger generation. How I will use statistics for evil and manipulate the results to suit my selfish desire to make Australia win the next Ashes. 2013) 1 An Introductory Application of Principal Components to Cricket Data. (Manage and Scariano,

6 Introduction To Cricket
7 Principal Component Analysis (PCA) Good things comes in matrix form. Say, we have a data matrix of n rows (number of samples) and p columns (number of variables).
8 Principal Component Analysis (PCA) Good things comes in matrix form. Say, we have a data matrix of n rows (number of samples) and p columns (number of variables). We want to perform data reduction to cut down the number of variables. PCA allows us to to take an useful linear combination of all variables.
9 Overview of PCA PCA summarise original variables into principal components scores (PCs). All PCs together accounts for 100 % of the variabilities in the data. But in most practical settings, the first few PCs will be enough to account for most (50 80%) of the variability in the data.
10 Overview of PCA PCA summarise original variables into principal components scores (PCs). All PCs together accounts for 100 % of the variabilities in the data. But in most practical settings, the first few PCs will be enough to account for most (50 80%) of the variability in the data. The idea of PCA is to use eigenvectors of Σ as the linear coefficients in our linear combination construction. And at the same time, the resultant PC s must capture all the original data variability (i.e. the variance of the original data equals to the variance of the transformed data).
11 Variance and Correlation For data vectors of the form x = (x 1,..., x p ) we can define Sample variance: V ar(x) = 1 p p 1 i=1 (x i x) 2. Sample Pearson s Correlation Coefficient, or just correlation: (to confuse you) p i=1 Corr(x, y) = (x i x)(y i ȳ) p i=1 (x i x) 2 p i=1 (y i ȳ). (1) 2
12 Correlation Matrix Every time we collect one sample, of dimension p, we can always write it in a vector form: X i = (X i1,..., X ip ) R p, i = 1,..., n. (2) Then, we [X ij ] is an n p matrix: X 1 X 11 X X 1p X 2 X = [X ij ] =. = X 21 X X 2p X n1 X n2... X np X n (3) We can define a p p matrix, called the correlation matrix, Σ = [Σ ij ] element-wise as: Σ ij = Corr(X i, X j ) (4)
13 The Tricky Life of Correlation Matrix Σ is... square and symmetric, non-negative definite, all of its eigenvalues are non-negative,
14 The Tricky Life of Correlation Matrix Σ is... square and symmetric, non-negative definite, all of its eigenvalues are non-negative, it can be decomposed (spectral decomposition) into Σ = UΛU 1 = UΛU, where U is a square p p matrix whose columns are orthonormal eigenvectors of Σ.
15 Skimming Over Some Mathematical Theorems Like Most Statisticians Do Consider only one row of the data (i.e. one player only): X X p 1 R p : Definition The first PC score of X is a linear combination of every element in X. And it can be defined as Y 1 = X U 1. Second and other PC score vectors can be defined similarly.
16 Skimming Over Some Mathematical Theorems Like Most Statisticians Do Consider only one row of the data (i.e. one player only): X X p 1 R p : Definition The first PC score of X is a linear combination of every element in X. And it can be defined as Y 1 = X U 1. Second and other PC score vectors can be defined similarly. Definition In general, the transformed data is Y n p = X n p U p p.
17 See Diagram on Whiteboard This construction: allows a maximisation of variance of any possible linear combination possible.
18 See Diagram on Whiteboard This construction: allows a maximisation of variance of any possible linear combination possible. For the first PC, p j=1 V ar(y j) = p j=1 V ar(x j) = λ 1 Similar holds for higher order PCs.
19 See Diagram on Whiteboard This construction: allows a maximisation of variance of any possible linear combination possible. For the first PC, p j=1 V ar(y j) = p j=1 V ar(x j) = λ 1 Similar holds for higher order PCs. the p columns of Y are called the score vectors. Each one is uncorrelated to all the PCs before it.
20 See Diagram on Whiteboard This construction: allows a maximisation of variance of any possible linear combination possible. For the first PC, p j=1 V ar(y j) = p j=1 V ar(x j) = λ 1 Similar holds for higher order PCs. the p columns of Y are called the score vectors. Each one is uncorrelated to all the PCs before it. Since each score vector has the same length p as the original variables, we can also consider their correlation! This allows us to meaningfully interpret the PC scores.
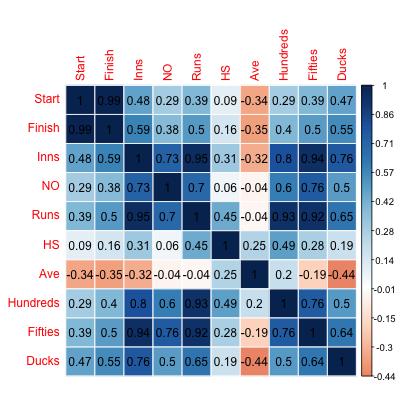
21 All Time Batsmen, Correlation Matrix Figure : /Users/kevinwang/Documents/Kevin/SUMS/Ashes_PCA/PCA_

22 All Time Batsmen, Loading Vector Plot

23 All Time Batsmen, Without Bradman

24 All Time Batsmen, With Bradman
25 All Time Batsmen, Rank Table PC1 PC2 PC3 PC4 DG Bradman RG Pollock GA Headley H Sutcliffe SR Tendulkar RT Ponting JH Kallis R Dravid BB McCullum IR Bell AN Cook MJ Clarke Selected players. PC1: high rank desirable. PC2: low rank desirable.

26 All Time Batsmen, Overall Corr(Vari, PCs)

27 Standardisation Goes A Long Way

28 Figure : It is All About The Ashes
29 Ashes in England: The Data Role Country Start Finish Mat Inns NO Runs RT Ponting A AUS MJ Clarke A AUS SR Waugh A AUS KP Pietersen A ENG IR Bell A ENG AJ Strauss A ENG HS Ave BF SR Cent HalfCent Ducks Fours Sixes

30 Ashes in England: Circle Plot and Corr(PCs, Vari) Figure : /Users/kevinwang/Documents/Kevin/SUMS/Ashes_PCA/PCA_

31 Ashes in England: Random Clustering

32 Ashes in England: Biplot of Role
33 Ashes in England: Biplot of Country
34 Ashes in England: Rank And Score Sums Remember those score vectors? Remember that from our plots, lower the first PC scores, better the batsmen.
35 Ashes in England: Rank And Score Sums Remember those score vectors? Remember that from our plots, lower the first PC scores, better the batsmen. Summing the PC scores according to the Country: AUS: , ENG:
36 Ashes in England: Rank And Score Sums Remember those score vectors? Remember that from our plots, lower the first PC scores, better the batsmen. Summing the PC scores according to the Country: AUS: , ENG: Summing the rank of the PC scores according to the Country: AUS: 2010, ENG: PC1: Scores PC1: Rank RT Ponting MJ Clarke SR Waugh KP Pietersen IR Bell AJ Strauss

37 We won the Ashes!
38 Ashes in England: Younger Generations Well, not really... Sadly, a lot of Australian legends have retired post 2007 Ashes series in Australia. The 2009 and 2013 Ashes are essentially composed of younger generation of Australian cricketers.
39 Ashes in England: Younger Generations Well, not really... Sadly, a lot of Australian legends have retired post 2007 Ashes series in Australia. The 2009 and 2013 Ashes are essentially composed of younger generation of Australian cricketers. This is a great lesson in Statistics: put your data into context. You don t have people like Steve Waugh or Glenn McGrath or Shane Warne (these used to be the players who reserve their best performance against the English). If restricting to younger players, the rank sums are 621 vs 414. Firmly in England s favour.

40 Where is hope?
41 AUS vs ENG vs WI We can perform similar analysis on the recent AUS vs WI series and ENG vs WI series. Australia series: two matches, AUS won 2-0. PC1 rank: 113 vs 212 in Australia s favour.
42 AUS vs ENG vs WI We can perform similar analysis on the recent AUS vs WI series and ENG vs WI series. Australia series: two matches, AUS won 2-0. PC1 rank: 113 vs 212 in Australia s favour. England series: three mathces, England won 2-0. PC1 rank: 154 vs 224 in England s favour. Country Series Role Mat Inns NO Runs HS AC Voges AUS 1 A SPD Smith AUS 1 A MJ Clarke AUS 1 A JE Root ENG 2 A GS Ballance ENG 2 A JC Buttler ENG 2 A Ave BF SR Cent Half.Cent Ducks Fours Sixes AC Voges SPD Smith MJ Clarke JE Root GS Ballance JC Buttler

43 Where is hope?
44 Well, not really... What I have not tell you is that ENG actually performed quite well against WI with adjustments. Good statistics does take time. I couldn t complete WI analysis in time for this talk.
45 What to take away? Statistics is different to mathematics. Uncertainty is the blood of statistics. Some analysis are subject to bias of the analyst. If the analyst is half as evil as Kevin, he/she can probably tell you what you want to hear. But the difference is: biased and non-rigorous analysis are subject to criticisms and often indefensible. Good visualisation goes a long way (As STAT3914 Students can attest) Cricket is fun! I would be extremely disappointed if we can predict the outcome of the game based on such simple analysis.
46 Thank You! Theorem Winning the Ashes is every Australians birthright. Corollary (Also know as The McGrath Hypothesis) Australia will always win the Ashes, 5-0. Proof.
47 References STAT3914 Lecture Notes. An Introductory Application of Principal Components to Cricket Data. (Manage and Scariano, 2013) All images were found on the Internet. No copyright infringement intended.
Math SL Internal Assessment What is the relationship between free throw shooting percentage and 3 point shooting percentages?
 Math SL Internal Assessment What is the relationship between free throw shooting percentage and 3 point shooting percentages? fts6 Introduction : Basketball is a sport where the players have to be adept
A Fair Target Score Calculation Method for Reduced-Over One day and T20 International Cricket Matches
 A Fair Target Score Calculation Method for Reduced-Over One day and T20 International Cricket Matches Rohan de Silva, PhD. Abstract In one day internationals and T20 cricket games, the par score is defined
Navigate to the golf data folder and make it your working directory. Load the data by typing
 Golf Analysis 1.1 Introduction In a round, golfers have a number of choices to make. For a particular shot, is it better to use the longest club available to try to reach the green, or would it be better
Modeling the Relationship Between MLB Ballparks and Home Team Performance. Using Shape Analysis. Sara Biesiadny, B.S. A Thesis
 Modeling the Relationship Between MLB Ballparks and Home Team Performance Using Shape Analysis by Sara Biesiadny, B.S. A Thesis In Mathematics and Statistics Submitted to the Graduate Faculty of Texas
y ) s x x )(y i (x i r = 1 n 1 s y Statistics Lecture 7 Exploring Data , y 2 ,y n (x 1 ),,(x n ),(x 2 ,y 1 How two variables vary together
 s x x )(y i (x i r = 1 n 1 s y Statistics Lecture 7 Exploring Data , y 2 ,y n (x 1 ),,(x n ),(x 2 ,y 1 How two variables vary together") Statistics 111 - Lecture 7 Exploring Data Numerical Summaries for Relationships between Variables Administrative Notes Homework 1 due in recitation: Friday, Feb. 5 Homework 2 now posted on course website:
Statistics 111 - Lecture 7 Exploring Data Numerical Summaries for Relationships between Variables Administrative Notes Homework 1 due in recitation: Friday, Feb. 5 Homework 2 now posted on course website:
Running head: DATA ANALYSIS AND INTERPRETATION 1
 Running head: DATA ANALYSIS AND INTERPRETATION 1 Data Analysis and Interpretation Final Project Vernon Tilly Jr. University of Central Oklahoma DATA ANALYSIS AND INTERPRETATION 2 Owners of the various
Supplemental Information
 Supplemental Information Supplemental Methods Principal Component Analysis (PCA) Every patient (identified by index k varying between 1 and n) was characterized by 4 cell-level measured features (quantitative
Finding your feet: modelling the batting abilities of cricketers using Gaussian processes
 Finding your feet: modelling the batting abilities of cricketers using Gaussian processes Oliver Stevenson & Brendon Brewer PhD candidate, Department of Statistics, University of Auckland o.stevenson@auckland.ac.nz
Reflecting Against Perception: Data Analysis of IPL Batsman
 International Journal of Engineering Science Invention ISSN (Online): 2319 6734, ISSN (Print): 2319 6726 Volume 3 Issue 6ǁ June 2014 ǁ PP.07-11 Reflecting Against Perception: Data Analysis of IPL Batsman
Correlation and regression using the Lahman database for baseball Michael Lopez, Skidmore College
 Correlation and regression using the Lahman database for baseball Michael Lopez, Skidmore College Overview The Lahman package is a gold mine for statisticians interested in studying baseball. In today
Distancei = BrandAi + 2 BrandBi + 3 BrandCi + i
 . Suppose that the United States Golf Associate (USGA) wants to compare the mean distances traveled by four brands of golf balls when struck by a driver. A completely randomized design is employed with
CS 7641 A (Machine Learning) Sethuraman K, Parameswaran Raman, Vijay Ramakrishnan
 Sethuraman K, Parameswaran Raman, Vijay Ramakrishnan") CS 7641 A (Machine Learning) Sethuraman K, Parameswaran Raman, Vijay Ramakrishnan Scenario 1: Team 1 scored 200 runs from their 50 overs, and then Team 2 reaches 146 for the loss of two wickets from their
CS 7641 A (Machine Learning) Sethuraman K, Parameswaran Raman, Vijay Ramakrishnan Scenario 1: Team 1 scored 200 runs from their 50 overs, and then Team 2 reaches 146 for the loss of two wickets from their
Solving Quadratic Equations (FAL)
") Objective: Students will be able to (SWBAT) solve quadratic equations with real coefficient that have complex solutions, in order to (IOT) make sense of a real life situation and interpret the results
Objective: Students will be able to (SWBAT) solve quadratic equations with real coefficient that have complex solutions, in order to (IOT) make sense of a real life situation and interpret the results
Matrix Methods in Machine Learning
 Matrix Methods in Machine Learning 1/34 Matrix Methods in Machine Learning V. Vijaya Saradhi Dept. of CSE, IIT Guwahati 11-April-2015 Matrix Methods in Machine Learning 1/34 Classification Examples Matrix
Lesson 14: Modeling Relationships with a Line
 Exploratory Activity: Line of Best Fit Revisited 1. Use the link http://illuminations.nctm.org/activity.aspx?id=4186 to explore how the line of best fit changes depending on your data set. A. Enter any
Citation for published version (APA): Canudas Romo, V. (2003). Decomposition Methods in Demography Groningen: s.n.
: Canudas Romo, V. (2003). Decomposition Methods in Demography Groningen: s.n.") University of Groningen Decomposition Methods in Demography Canudas Romo, Vladimir IMPORTANT NOTE: You are advised to consult the publisher's version (publisher's PDF) if you wish to cite from it. Please
University of Groningen Decomposition Methods in Demography Canudas Romo, Vladimir IMPORTANT NOTE: You are advised to consult the publisher's version (publisher's PDF) if you wish to cite from it. Please
Lesson 6: The Distance Between Two Rational Numbers
 Classwork Exercise 1 Use the number line to answer each of the following. Person A What is the distance between 4 and 5? Person B What is the distance between 5 and 4? What is the distance between 5 and
COMPLETING THE RESULTS OF THE 2013 BOSTON MARATHON
 COMPLETING THE RESULTS OF THE 2013 BOSTON MARATHON Dorit Hammerling 1, Matthew Cefalu 2, Jessi Cisewski 3, Francesca Dominici 2, Giovanni Parmigiani 2,4, Charles Paulson 5, Richard Smith 1,6 1 Statistical
Ranking teams in partially-disjoint tournaments
 Ranking teams in partially-disjoint tournaments Alex Choy Mentor: Chris Jones September 16, 2013 1 Introduction Throughout sports, whether it is professional or collegiate sports, teams are ranked. In
BASKETBALL PREDICTION ANALYSIS OF MARCH MADNESS GAMES CHRIS TSENG YIBO WANG
 BASKETBALL PREDICTION ANALYSIS OF MARCH MADNESS GAMES CHRIS TSENG YIBO WANG GOAL OF PROJECT The goal is to predict the winners between college men s basketball teams competing in the 2018 (NCAA) s March
Do Clutch Hitters Exist?
 Do Clutch Hitters Exist? David Grabiner SABRBoston Presents Sabermetrics May 20, 2006 http://remarque.org/~grabiner/bosclutch.pdf (Includes some slides skipped in the original presentation) 1 Two possible
Minimum Mean-Square Error (MMSE) and Linear MMSE (LMMSE) Estimation
 and Linear MMSE (LMMSE) Estimation") Minimum Mean-Square Error (MMSE) and Linear MMSE (LMMSE) Estimation Outline: MMSE estimation, Linear MMSE (LMMSE) estimation, Geometric formulation of LMMSE estimation and orthogonality principle. Reading:
Minimum Mean-Square Error (MMSE) and Linear MMSE (LMMSE) Estimation Outline: MMSE estimation, Linear MMSE (LMMSE) estimation, Geometric formulation of LMMSE estimation and orthogonality principle. Reading:
Is lung capacity affected by smoking, sport, height or gender. Table of contents
 Sample project This Maths Studies project has been graded by a moderator. As you read through it, you will see comments from the moderator in boxes like this: At the end of the sample project is a summary
Announcements. Lecture 19: Inference for SLR & Transformations. Online quiz 7 - commonly missed questions
 Announcements Announcements Lecture 19: Inference for SLR & Statistics 101 Mine Çetinkaya-Rundel April 3, 2012 HW 7 due Thursday. Correlation guessing game - ends on April 12 at noon. Winner will be announced
Using March Madness in the first Linear Algebra course. Steve Hilbert Ithaca College
 Using March Madness in the first Linear Algebra course Steve Hilbert Ithaca College Hilbert@ithaca.edu Background National meetings Tim Chartier 1 hr talk and special session on rankings Try something
The Simple Linear Regression Model ECONOMETRICS (ECON 360) BEN VAN KAMMEN, PHD
 BEN VAN KAMMEN, PHD") The Simple Linear Regression Model ECONOMETRICS (ECON 360) BEN VAN KAMMEN, PHD Outline Definition. Deriving the Estimates. Properties of the Estimates. Units of Measurement and Functional Form. Expected
The Simple Linear Regression Model ECONOMETRICS (ECON 360) BEN VAN KAMMEN, PHD Outline Definition. Deriving the Estimates. Properties of the Estimates. Units of Measurement and Functional Form. Expected
Introduction to Analysis of Variance (ANOVA) The Structural Model, The Summary Table, and the One- Way ANOVA
 The Structural Model, The Summary Table, and the One- Way ANOVA") Introduction to Analysis of Variance (ANOVA) The Structural Model, The Summary Table, and the One- Way ANOVA Limitations of the t-test Although the t-test is commonly used, it has limitations Can only
Introduction to Analysis of Variance (ANOVA) The Structural Model, The Summary Table, and the One- Way ANOVA Limitations of the t-test Although the t-test is commonly used, it has limitations Can only
Modelling the distribution of first innings runs in T20 Cricket
 Modelling the distribution of first innings runs in T20 Cricket James Kirkby The joy of smoothing James Kirkby Modelling the distribution of first innings runs in T20 Cricket The joy of smoothing 1 / 22
Statistics Unit Statistics 1A
 Centre Number Candidate Number For Examiner s Use Surname Other Names Candidate Signature Examiner s Initials Mathematics Unit Statistics 1A Statistics Unit Statistics 1A Friday 14 January 2011 General
Taking Your Class for a Walk, Randomly
 Taking Your Class for a Walk, Randomly Daniel Kaplan Macalester College Oct. 27, 2009 Overview of the Activity You are going to turn your students into an ensemble of random walkers. They will start at
Some Issues in the Calculation of Batting Averages: Ranking (and Re-Ranking) the Top 50 Batsmen in Test Cricket,
 the Top 50 Batsmen in Test Cricket,") Some Issues in the Calculation of Batting Averages: Ranking (and Re-Ranking) the Top 50 Batsmen in Test Cricket, 1877-2006 Vani K. Borooah School of Economics and Politics, University of Ulster, Newtownabbey
Some Issues in the Calculation of Batting Averages: Ranking (and Re-Ranking) the Top 50 Batsmen in Test Cricket, 1877-2006 Vani K. Borooah School of Economics and Politics, University of Ulster, Newtownabbey
Announcements. % College graduate vs. % Hispanic in LA. % College educated vs. % Hispanic in LA. Problem Set 10 Due Wednesday.
 Announcements Announcements UNIT 7: MULTIPLE LINEAR REGRESSION LECTURE 1: INTRODUCTION TO MLR STATISTICS 101 Problem Set 10 Due Wednesday Nicole Dalzell June 15, 2015 Statistics 101 (Nicole Dalzell) U7
Developing coping skills (losing/getting out) Developing hand eye coordination. Developing gross motor skills. Improved balance and coordination
 Developing hand eye coordination. Developing gross motor skills. Improved balance and coordination") CRICKET Cricket is a common lunchtime activity. Bins and bags can be utilised as wickets, tennis balls provide a safe option for this type of play. Bats can be lent out at the beginning of breaks. Cricket
CRICKET Cricket is a common lunchtime activity. Bins and bags can be utilised as wickets, tennis balls provide a safe option for this type of play. Bats can be lent out at the beginning of breaks. Cricket
Chapter 10 Gases. Characteristics of Gases. Pressure. The Gas Laws. The Ideal-Gas Equation. Applications of the Ideal-Gas Equation
 Characteristics of Gases Chapter 10 Gases Pressure The Gas Laws The Ideal-Gas Equation Applications of the Ideal-Gas Equation Gas mixtures and partial pressures Kinetic-Molecular Theory Real Gases: Deviations
Section I: Multiple Choice Select the best answer for each problem.
 Inference for Linear Regression Review Section I: Multiple Choice Select the best answer for each problem. 1. Which of the following is NOT one of the conditions that must be satisfied in order to perform
save percentages? (Name) (University)
 (University)") 1 IB Maths Essay: What is the correlation between the height of football players and their save percentages? (Name) (University) Table of Contents Raw Data for Analysis...3 Table 1: Raw Data...3 Rationale
1 IB Maths Essay: What is the correlation between the height of football players and their save percentages? (Name) (University) Table of Contents Raw Data for Analysis...3 Table 1: Raw Data...3 Rationale
Introduction to Pattern Recognition
 Introduction to Pattern Recognition Jason Corso SUNY at Buffalo 19 January 2011 J. Corso (SUNY at Buffalo) Introduction to Pattern Recognition 19 January 2011 1 / 32 Examples of Pattern Recognition in
Chapter 12 Practice Test
 Chapter 12 Practice Test 1. Which of the following is not one of the conditions that must be satisfied in order to perform inference about the slope of a least-squares regression line? (a) For each value
(Under the Direction of Cheolwoo Park) ABSTRACT. Major League Baseball is a sport complete with a multitude of statistics to evaluate a player s
 ABSTRACT. Major League Baseball is a sport complete with a multitude of statistics to evaluate a player s") PENALIZED REGRESSION MODELS FOR MAJOR LEAGUE BASEBALL METRICS by MUSHIMIE LONA PANDA (Under the Direction of Cheolwoo Park) ABSTRACT Major League Baseball is a sport complete with a multitude of statistics
PENALIZED REGRESSION MODELS FOR MAJOR LEAGUE BASEBALL METRICS by MUSHIMIE LONA PANDA (Under the Direction of Cheolwoo Park) ABSTRACT Major League Baseball is a sport complete with a multitude of statistics
Sport statistics: how to assemble your team elivian.nl high quality, poorly written update history current(v2.1):7-oct-16, original(v1):13-sep-14
:7-oct-16, original(v1):13-sep-14") Sport statistics: how to assemble your team elivian.nl high quality, poorly written update history current(v2.1):7-oct-16, original(v1):13-sep-14 If you ve ever tried to make a selection team for any sport,
Sport statistics: how to assemble your team elivian.nl high quality, poorly written update history current(v2.1):7-oct-16, original(v1):13-sep-14 If you ve ever tried to make a selection team for any sport,
Journal of Quantitative Analysis in Sports. Rush versus Pass: Modeling the NFL
 Journal of Quantitative Analysis in Sports Manuscript 1210 Rush versus Pass: Modeling the NFL Ralph Abbey Carl Meyer John Holodnak* Dan Moeller Chandler May * North Carolina State University Ohio Northern
Journal of Quantitative Analysis in Sports
 Journal of Quantitative Analysis in Sports Volume 1, Issue 1 2005 Article 5 Determinants of Success in the Olympic Decathlon: Some Statistical Evidence Ian Christopher Kenny Dan Sprevak Craig Sharp Colin
One-factor ANOVA by example
 ANOVA One-factor ANOVA by example 2 One-factor ANOVA by visual inspection 3 4 One-factor ANOVA H 0 H 0 : µ 1 = µ 2 = µ 3 = H A : not all means are equal 5 One-factor ANOVA but why not t-tests t-tests?
#1 Accurately Rate and Rank each FBS team, and
 The goal of the playoffpredictor website is to use statistical analysis in the absolute simplest terms to: #1 Accurately Rate and Rank each FBS team, and #2 Predict what the playoff committee will list
Besides the reported poor performance of the candidates there were a number of mistakes observed on the assessment tool itself outlined as follows:
 MATHEMATICS (309/1) REPORT The 2013 Mathematics (309/1) paper was of average standard. The paper covered a wide range of the syllabus. It was neither gender bias nor culture bias. It did not have language
Building an NFL performance metric
 Building an NFL performance metric Seonghyun Paik (spaik1@stanford.edu) December 16, 2016 I. Introduction In current pro sports, many statistical methods are applied to evaluate player s performance and
Hitting with Runners in Scoring Position
 Hitting with Runners in Scoring Position Jim Albert Department of Mathematics and Statistics Bowling Green State University November 25, 2001 Abstract Sportscasters typically tell us about the batting
Robust specification testing in regression: the FRESET test and autocorrelated disturbances
 Robust specification testing in regression: the FRESET test and autocorrelated disturbances Linda F. DeBenedictis and David E. A. Giles * Policy and Research Division, Ministry of Human Resources, 614
Reading Time: 15 minutes Writing Time: 1 hour 30 minutes. Structure of Book. Number of questions to be answered. Number of modules to be answered
 Reading Time: 15 minutes Writing Time: 1 hour 30 minutes Letter Student Number: Structure of Book Section A - Core Section B - Modules Number of questions Number of questions to be answered Number of marks
Special Topics: Data Science
 Special Topics: Data Science L Linear Methods for Prediction Dr. Vidhyasaharan Sethu School of Electrical Engineering & Telecommunications University of New South Wales Sydney, Australia V. Sethu 1 Topics
Unit 4: Inference for numerical variables Lecture 3: ANOVA
 Unit 4: Inference for numerical variables Lecture 3: ANOVA Statistics 101 Thomas Leininger June 10, 2013 Announcements Announcements Proposals due tomorrow. Will be returned to you by Wednesday. You MUST
Introduction to Pattern Recognition
 Introduction to Pattern Recognition Jason Corso SUNY at Buffalo 12 January 2009 J. Corso (SUNY at Buffalo) Introduction to Pattern Recognition 12 January 2009 1 / 28 Pattern Recognition By Example Example:
Captain's Diary By Michael Clarke
 Captain's Diary By Michael Clarke Captain's Diary by Michael Clarke Reviews, - Dec 30, 2014 Captain's Diary has 9 ratings and 1 review. Matt said: 4.5 stars.a great book that I am so pleased I got for
Chapter 10. Right Triangles
 Chapter 10 Right Triangles If we looked at enough right triangles and experimented a little, we might eventually begin to notice some relationships developing. For instance, if I were to construct squares
Using Markov Chains to Analyze a Volleyball Rally
 1 Introduction Using Markov Chains to Analyze a Volleyball Rally Spencer Best Carthage College sbest@carthage.edu November 3, 212 Abstract We examine a volleyball rally between two volleyball teams. Using
Preliminary statistical analysis of. the international eventing. results 2013
 Lausanne 28/1/14 Preliminary statistical analysis of the international eventing results 2013 Overview of the talk Statistical analysis The data The statistical technique Analysis of the falls data (related
USING A CALCULATOR TO INVESTIGATE WHETHER A LINEAR, QUADRATIC OR EXPONENTIAL FUNCTION BEST FITS A SET OF BIVARIATE NUMERICAL DATA
 USING A CALCULATOR TO INVESTIGATE WHETHER A LINEAR, QUADRATIC OR EXPONENTIAL FUNCTION BEST FITS A SET OF BIVARIATE NUMERICAL DATA Jackie Scheiber RADMASTE, Wits University Jackie.scheiber@wits.ac.za Target
Factorial Analysis of Variance
 Factorial Analysis of Variance Overview of the Factorial ANOVA Factorial ANOVA (Two-Way) In the context of ANOVA, an independent variable (or a quasiindependent variable) is called a factor, and research
Polynomial DC decompositions
 Polynomial DC decompositions Georgina Hall Princeton, ORFE Joint work with Amir Ali Ahmadi Princeton, ORFE 7/31/16 DIMACS Distance geometry workshop 1 Difference of convex (dc) programming Problems of
Analysis of performance at the 2007 Cricket World Cup
 Analysis of performance at the 2007 Cricket World Cup Petersen, C., Pyne, D.B., Portus, M.R., Cordy, J. and Dawson, B Cricket Australia, Department of Physiology, Australian Institute of Sport, Human Movement,
Lecture 1: Knot Theory
 Math 7H Professor: Padraic Bartlett Lecture 1: Knot Theory Week 1 UCSB 015 1 Introduction Outside of mathematics, knots are ways to loop a single piece of string around itself: In mathematics, we mean
The Reliability of Intrinsic Batted Ball Statistics Appendix
 The Reliability of ntrinsic Batted Ball Statistics Appendix Glenn Healey, EECS Department University of California, rvine, CA 92617 Given information about batted balls for a set of players, we review
NBA TEAM SYNERGY RESEARCH REPORT 1
 NBA TEAM SYNERGY RESEARCH REPORT 1 NBA Team Synergy and Style of Play Analysis Karrie Lopshire, Michael Avendano, Amy Lee Wang University of California Los Angeles June 3, 2016 NBA TEAM SYNERGY RESEARCH
A Novel Approach to Predicting the Results of NBA Matches
 A Novel Approach to Predicting the Results of NBA Matches Omid Aryan Stanford University aryano@stanford.edu Ali Reza Sharafat Stanford University sharafat@stanford.edu Abstract The current paper presents
PGA Tour Scores as a Gaussian Random Variable
 PGA Tour Scores as a Gaussian Random Variable Robert D. Grober Departments of Applied Physics and Physics Yale University, New Haven, CT 06520 Abstract In this paper it is demonstrated that the scoring
BRADMAN S TEST AVERAGE IS 99.94: FACT OR FICTION?
 BRADMAN S TEST AVERAGE IS 99.94: FACT OR FICTION? John M. Howells University of Otago Dunedin, New Zealand Introduction Due mainly to the popularity of the one-day game and increased television coverage,
Massey Method. Introduction. The Process
 Massey Method Introduction Massey s Method, also referred to as the Point Spread Method, is a rating method created by mathematics professor Kenneth Massey. It is currently used to determine which teams
CS249: ADVANCED DATA MINING
 CS249: ADVANCED DATA MINING Linear Regression, Logistic Regression, and GLMs Instructor: Yizhou Sun yzsun@cs.ucla.edu April 24, 2017 About WWW2017 Conference 2 Turing Award Winner Sir Tim Berners-Lee 3
Competitive Performance of Elite Olympic-Distance Triathletes: Reliability and Smallest Worthwhile Enhancement
 SPORTSCIENCE sportsci.org Original Research / Performance Competitive Performance of Elite Olympic-Distance Triathletes: Reliability and Smallest Worthwhile Enhancement Carl D Paton, Will G Hopkins Sportscience
Formula One Race Strategy
 Formula One Race Strategy McLaren Racing Limited Sports Technology McLaren is a registered trademark of McLaren Racing Limited INTRODUCTION Figure 1: A Vodafone McLaren Mercedes driven by Lewis Hamilton
Lesson 16: More on Modeling Relationships with a Line
 Student Outcomes Students use the least squares line to predict values for a given data set. Students use residuals to evaluate the accuracy of predictions based on the least squares line. Lesson Notes
Journal of Quantitative Analysis in Sports Manuscript 1039
 An Article Submitted to Journal of Quantitative Analysis in Sports Manuscript 1039 A Simple and Flexible Rating Method for Predicting Success in the NCAA Basketball Tournament Brady T. West University
Driv e accu racy. Green s in regul ation
 LEARNING ACTIVITIES FOR PART II COMPILED Statistical and Measurement Concepts We are providing a database from selected characteristics of golfers on the PGA Tour. Data are for 3 of the players, based
HSIE STAGE FIVE ACTIVITIES TEACHER S GUIDE
 HSIE STAGE FIVE ACTIVITIES TEACHER S GUIDE The following two task sheets have been designed for teachers teaching HSIE Stage 5 Topic 3 Australia between the Wars They provide students with experiences
The MACC Handicap System
 MACC Racing Technical Memo The MACC Handicap System Mike Sayers Overview of the MACC Handicap... 1 Racer Handicap Variability... 2 Racer Handicap Averages... 2 Expected Variations in Handicap... 2 MACC
Name May 3, 2007 Math Probability and Statistics
 Name May 3, 2007 Math 341 - Probability and Statistics Long Exam IV Instructions: Please include all relevant work to get full credit. Encircle your final answers. 1. An article in Professional Geographer
Evaluating and Classifying NBA Free Agents
 Evaluating and Classifying NBA Free Agents Shanwei Yan In this project, I applied machine learning techniques to perform multiclass classification on free agents by using game statistics, which is useful
Announcements. Unit 7: Multiple Linear Regression Lecture 3: Case Study. From last lab. Predicting income
 Announcements Announcements Unit 7: Multiple Linear Regression Lecture 3: Case Study Statistics 101 Mine Çetinkaya-Rundel April 18, 2013 OH: Sunday: Virtual OH, 3-4pm - you ll receive an email invitation
Growth: Humans & Surf Clams
 Growth: Humans & Surf Clams East Coast MARE Materials For the leader: Projector Whiteboard to project data graph onto White paper & markers For the activity: Copy of data table Copy of map Class graphing
KINEMATIC QUANTIFICATION OF GAIT SYMMETRY BASED ON BILATERAL CYCLOGRAMS
 KINEMATIC QUANTIFICATION OF GAIT SYMMETRY BASED ON BILATERAL CYCLOGRAMS Ambarish Goswami Honda Research Institute Mountain View, California, USA agoswami@honda-ri.com Abstract Symmetry is considered to
8th Grade. Data.
 1 8th Grade Data 2015 11 20 www.njctl.org 2 Table of Contents click on the topic to go to that section Two Variable Data Line of Best Fit Determining the Prediction Equation Two Way Table Glossary Teacher
27Quantify Predictability U10L9. April 13, 2015
 1 QUANTIFYING PREDICTABILITY Exercise #1: Make sure that your calculator has its r value on. 2 Exercise #2: In the following exercises four data sets with equal x values are given to illustrate different
Warm-up. Make a bar graph to display these data. What additional information do you need to make a pie chart?
 Warm-up The number of deaths among persons aged 15 to 24 years in the United States in 1997 due to the seven leading causes of death for this age group were accidents, 12,958; homicide, 5,793; suicide,
Parsimonious Linear Fingerprinting for Time Series
 Parsimonious Linear Fingerprinting for Time Series Lei Li, B. Aditya Prakash, Christos Faloutsos School of Computer Science Carnegie Mellon University VLDB 2010 1 L. Li, 2010 VLDB2010, 36 th International
HOW DO SPORTS USE MATHEMATICS?
 MATHS IN SPORT LEVELS 6 YEARS 9 HOW DO SPORTS USE MATHEMATICS? 1 Key concept Mathematics is involved in sport in many ways. LEVELS 6 YEAR 9 Focusing questions 1. How do sports use mathematics? 2. How is
Podcast 48 - Sir Donald Bradman - An Australian Cricket Legend
 Podcast 48 - Sir Donald Bradman - An Australian Cricket Legend by Rob McCormack - Saturday, October 18, 2014 http://slowenglish.info/?p=1403 Learn English while learning about daily life in Australia,
A scalable framework for NBA player and team comparisons using player tracking data
 Journal of Sports Analytics 2 (2016) 107 119 DOI 10.3233/JSA-160022 IOS Press 107 A scalable framework for NBA player and team comparisons using player tracking data Scott Bruce Department of Statistics,
Psychology - Mr. Callaway/Mundy s Mill HS Unit Research Methods - Statistics
 Psychology - Mr. Callaway/Mundy s Mill HS Unit 2.3 - Research Methods - Statistics How do psychologists ask & answer questions? Last time we asked that we were discussing Research Methods. This time we
SPATIAL STATISTICS A SPATIAL ANALYSIS AND COMPARISON OF NBA PLAYERS. Introduction
 A SPATIAL ANALYSIS AND COMPARISON OF NBA PLAYERS KELLIN RUMSEY Introduction The 2016 National Basketball Association championship featured two of the leagues biggest names. The Golden State Warriors Stephen
Descriptive Statistics. Dr. Tom Pierce Department of Psychology Radford University
 Descriptive Statistics Dr. Tom Pierce Department of Psychology Radford University Descriptive statistics comprise a collection of techniques for better understanding what the people in a group look like
What does it take to produce an Olympic champion? A nation naturally
 Survival of the Fittest? An Econometric Analysis in to the Effects of Military Spending on Olympic Success from 1996-01. Mark Frahill The Olympics are the world s greatest sporting celebrations, seen as
This file is part of the following reference:
 This file is part of the following reference: Hancock, Timothy Peter (2006) Multivariate consensus trees: tree-based clustering and profiling for mixed data types. PhD thesis, James Cook University. Access
Two Machine Learning Approaches to Understand the NBA Data
 Two Machine Learning Approaches to Understand the NBA Data Panagiotis Lolas December 14, 2017 1 Introduction In this project, I consider applications of machine learning in the analysis of nba data. To
Standard 3.1 The student will plan and conduct investigations in which
 Teacher Name: Tammy Heddings Date: April 04, 2009 Grade Level: 3-6 Subject: Science Time: 30 minutes Concept: Scientific Investigation Topic: Variables SOLs: Standard 3.1 The student will plan and conduct
Stat 139 Homework 3 Solutions, Spring 2015
 Stat 39 Homework 3 Solutions, Spring 05 Problem. Let i Nµ, σ ) for i,..., n, and j Nµ, σ ) for j,..., n. Also, assume that all observations are independent from each other. In Unit 4, we learned that the
Business and housing market cycles in the euro area: a multivariate unobserved component approach
 Business and housing market cycles in the euro area: a multivariate unobserved component approach Laurent Ferrara (a) and Siem Jan Koopman (b) http://staff.feweb.vu.nl/koopman (a) Banque de France (b)
DESIGN AND ANALYSIS OF ALGORITHMS (DAA 2017)
") DESIGN AND ANALYSIS OF ALGORITHMS (DAA 2017) Veli Mäkinen 12/05/2017 1 COURSE STRUCTURE 7 weeks: video lecture -> demo lecture -> study group -> exercise Video lecture: Overview, main concepts, algorithm
DESIGN AND ANALYSIS OF ALGORITHMS (DAA 2017) Veli Mäkinen 12/05/2017 1 COURSE STRUCTURE 7 weeks: video lecture -> demo lecture -> study group -> exercise Video lecture: Overview, main concepts, algorithm
Predicting the Total Number of Points Scored in NFL Games
 Predicting the Total Number of Points Scored in NFL Games Max Flores (mflores7@stanford.edu), Ajay Sohmshetty (ajay14@stanford.edu) CS 229 Fall 2014 1 Introduction Predicting the outcome of National Football
STANDARD SCORES AND THE NORMAL DISTRIBUTION
 STANDARD SCORES AND THE NORMAL DISTRIBUTION REVIEW 1.MEASURES OF CENTRAL TENDENCY A.MEAN B.MEDIAN C.MODE 2.MEASURES OF DISPERSIONS OR VARIABILITY A.RANGE B.DEVIATION FROM THE MEAN C.VARIANCE D.STANDARD
Neutral umpires and leg before wicket decisions in test cricket
 J. R. Statist. Soc. A (2006) 169, Part 4, pp. 903 911 Neutral umpires and leg before wicket decisions in test cricket Trevor J. Ringrose Cranfield University, Shrivenham, UK [Received April 2005. Final