Distancei = BrandAi + 2 BrandBi + 3 BrandCi + i
|
|
|
- Hubert Waters
- 5 years ago
- Views:
Transcription
1 . Suppose that the United States Golf Associate (USGA) wants to compare the mean distances traveled by four brands of golf balls when struck by a driver. A completely randomized design is employed with Tigger Wedge, the USGA s robot golfer, using a driver to hit a random sample of golf balls ( balls for each brand) in a random sequence. The distance is recorded for each hit, and the resulting means are organized by brand in the following table: Mean Brand A 5.8 Brand B 6.6 Brand C Brand D 9. Judy Bates was hired by the USGA to determine whether the mean distances traveled by the four brands of golf balls were the same. To do this she estimated the following linear regression model: Distancei = + BrandAi + BrandBi + BrandCi + i Where: Distancei = Distance traveled for the ith golf ball BrandAi = Dummy variable equal to for the distance traveled by BrandA golf balls; otherwise. BrandBi = Dummy variable equal to for the distance traveled by BrandB golf balls; otherwise. BrandCi = Dummy variable equal to for the distance traveled by BrandC golf balls; otherwise. Judy produced the following results for her USGA employers: Distance R i ˆ ˆ BrandA (57.6) (.8).7 ESS 79. i ˆ BrandB ˆ BrandC i i (5.8) (9.) (t statistics in parentheses) RSS TSS 67.6 a. Test, using Judy s results and a 5% level of significance, whether the brand of golf ball matters in explaining the mean distance traveled. b. Judy forgot to include the values of her parameter estimates. Help her out by calculating the numerical values for each of the estimated coefficients above. Page
2 . Consider the following regression output using data from the Colby Student Lifestyle Survey for the Fall of. Dependent Variable: GPA Method: Least Squares Included observations: 8 Variable Coefficient Std. Error Intercept.5.68 SAT SKIP FEMALE WHITE R-squared.65 Mean dependent var.68 Adjusted R-squared.8989 S.D. dependent var.556 S.E. of regression.998 F-statistic.578 Sum squared resid Prob(F-statistic). Where: GPA is the student s self-reported Grade Point Average. SAT is the student s self-reported SAT score SKIP is the number of classes skipped each semester FEMALE is a dummy variable equal to if the student is female; otherwise WHITE is a dummy variable equal to if the student is white, otherwise. a. Provide an interpretation for each of the estimated coefficients in the model above. b. Develop and complete hypothesis tests for each of the coefficients of this model, stating the null and alternative hypotheses. Include a sentence that outlines the intuition of your alternative hypothesis. Test your hypotheses at the 5% level of significance. c. Use the regression output and correlation matrix below, and apply the specification criteria we studied this semester to determine whether or not WHITE is an irrelevant variable in this equation. Dependent Variable: GPA Method: Least Squares Sample: 86 Included observations: 9 Variable Coefficient Std. Error t-statistic Prob. Intercept SAT SKIP FEMALE R-squared.575 Mean dependent var.695 Adjusted R-squared. S.D. dependent var.5 S.E. of regression.5 F-statistic Sum squared resid 5.8 Prob(F-statistic). Page
3 GPA SAT SKIP FEMALE WHITE GPA. SAT.8. SKIP FEMALE WHITE Consider the following estimated model of demand for housing (standard errors in parentheses): log Qi =.7.7 log Pi +.96 log Yi (.7) (.6) N =, families R =.7 Where Q = measure of quantity of housing in square feet consumed by each family P = price of a unit of housing in family s locality Y = measure of family income a. Calculate the price and income elasticities of demand for this model. b. Test, at the 5% level of significance, if the income elasticity of demand for housing is equal to in this model. Page
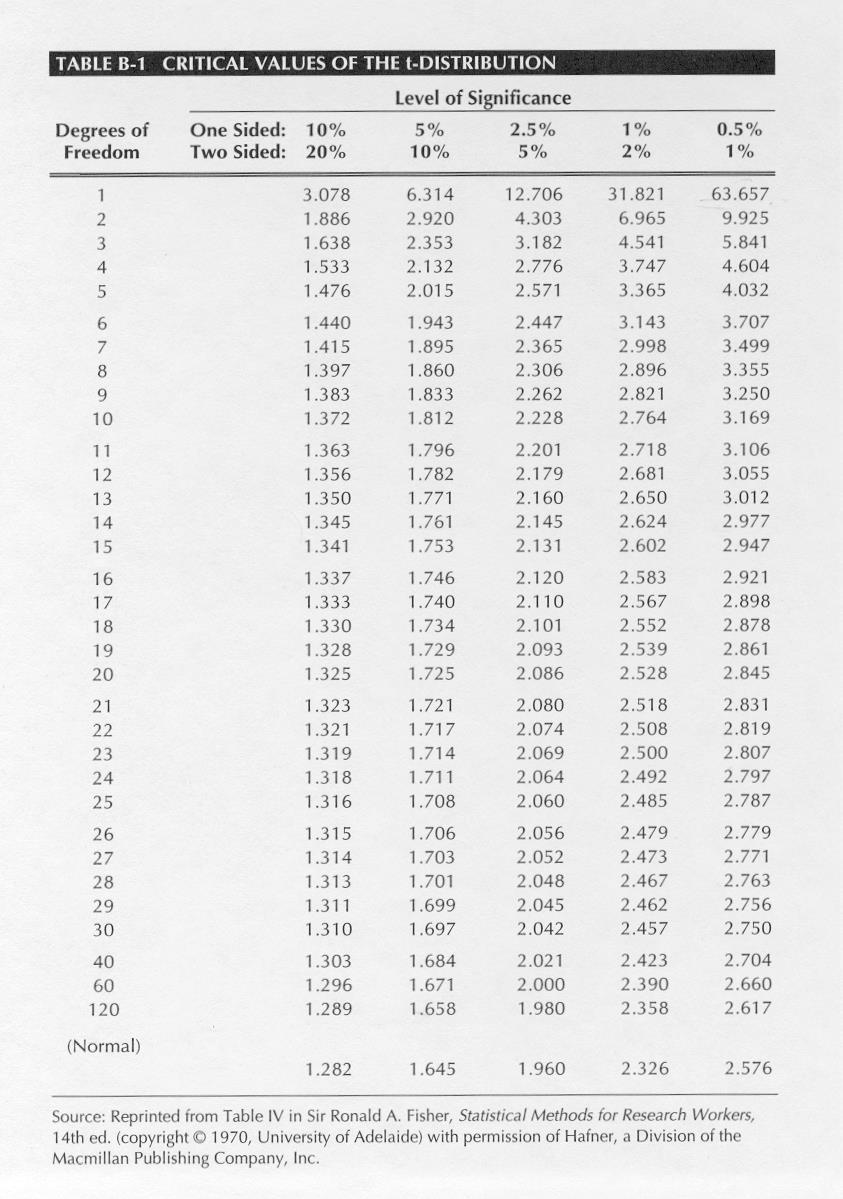
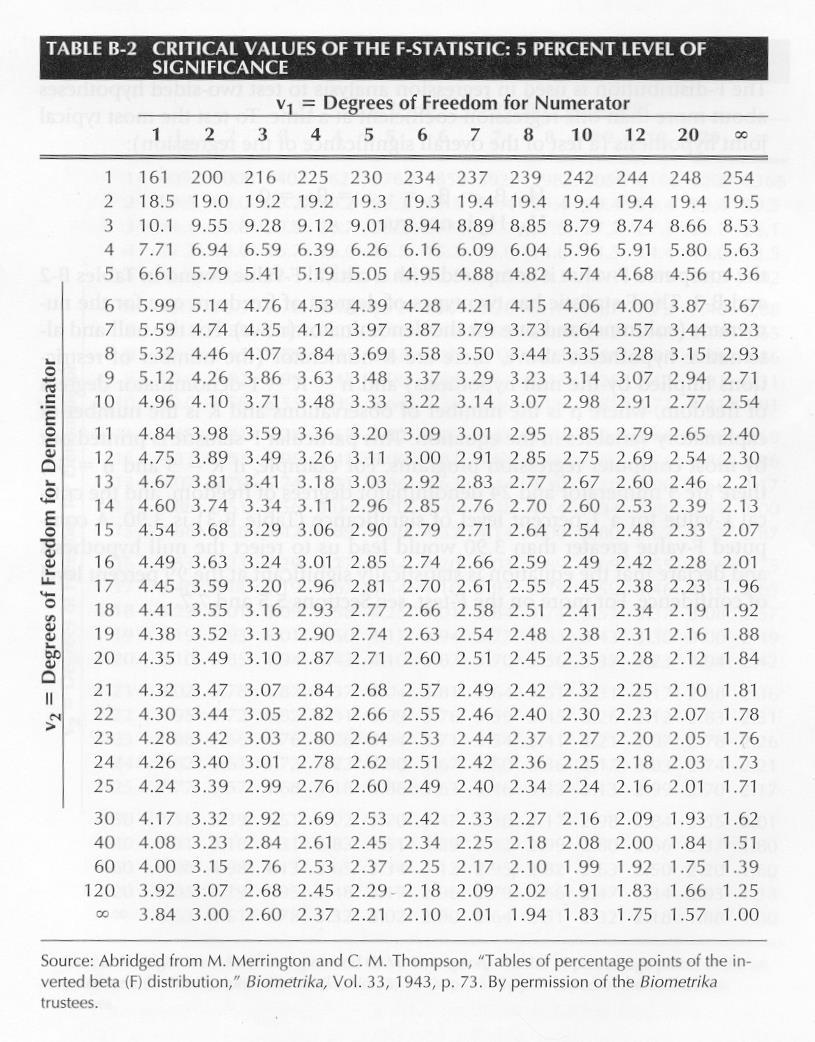
4 a. : ANSWERS H 8 points F F,6,5%,,5% ESS F K RSS n K (nearest) (interpolated) Reject H and conclude that this model is useful for predicting distance. This implies that the brand of the golf ball must have some association with mean distance since Brand is the only factor in the regression model. Therefore, mean distance will vary with Brand which implies that at least two of the brands have different mean distances. b. 8 points ˆ 9., i.e., the mean distance of Brand D golf balls (the omitted dummy variable). ˆ , i.e., the difference in the mean distance of Brand A and Brand D golf balls. ˆ , i.e., the difference in the mean distance of Brand B and Brand D golf balls. ˆ , i.e., the difference in the mean distance of Brand C and Brand D golf balls.. Dependent Variable: GPA Sample: 86 Included observations: 8 Variable Coefficient Std. Error t-statistic Prob. Intercept SAT SKIP FEMALE WHITE R-squared.65 Mean dependent var.68 Adjusted R-squared.8989 S.D. dependent var.556 S.E. of regression.998 F-statistic.578 Sum squared resid Prob(F-statistic). a. Algebraically, the OLS estimate of the intercept term is the value of the GPA when all of the explanatory variables and the error term are equal to zero. However, because the intercept term in an OLS regression equation also equals the sum of the constant effect of omitted explanatory variables and the nonzero mean of the sample error observations, it has no interpretive value. For this reason there should be no hypothesis test in part b for. pts Ceteris paribus, a point increase in a student s SAT score will, on average, increase that students GPA by. points. points Page
5 Ceteris paribus, the more classes a student skips the lower their GPA on average. Note that the size of this coefficient seems large a student who skips just classes will earn a GPA that is. lower on average according to this result. The units of the SKIP variable are not defined. In fact, the SKIP variable is an ordinal variable, meaning that SKIP equals for to classes skipped in a semester, for - classes skipped, 5 for 5-7 classes skipped, 8 for 8- classes skipped, and for or more classes skipped. Therefore, the interpretation of can only be made in relative terms as in the first sentence of this paragraph. points Ceteris paribus, females have a mean GPA that is.56 points greater than males in this sample. points Ceteris paribus, white students in this sample have a mean GPA that is.78 points higher than students of color. However, this result is not statistically significant, i.e., there is no statistically significant difference in GPAs among white and non-white students in this sample, controlling for their SAT score, the number of classes skipped, and their sex. points b. points Coefficient: Hypothesized Sign Ceteris paribus, students with higher SAT scores should have higher GPAs. Ceteris paribus, the more classes a student skips the lower their mean GPA should be. There is no convincing evidence that GPAs at Colby should differ between men and women. There is no convincing evidence that GPAs at Colby should be any different for student of color. t-statistic: t c =.65 (one-sided) t c =.96 (two-sided) Degrees of freedom = 8--=78 (Normal) Decision Rule: H : H A: > Reject H because t-stat >.65 and the estimate has the correct sign. H : H A: < Reject H because t-stat >.65 and the estimate has the correct sign. H : = H A: Do not reject H because t-stat <.96. H : = H A: Do not reject H because t-stat <.96. Page 5
6 c. Theory: There s no a priori evidence that GPAs at Colby should differ due to race, so theory is no help here in determining whether or not WHITE is an irrelevant variable. points t-test: The estimated coefficient on WHITE is not statistically significant at any reasonable level of significance, thus we can suspect that it is an irrelevant variable. points R : The regression omitting the WHITE variable has a slightly lower however, given that the value of the t-statistic for was greater than.. R. This comes as no surprise, points Expected Bias: Without an expected sign for we must examine both alternatives in conjunction with the reported sign of the correlation coefficient and compare this with the regression results. points For the regression that omits the WHITE dummy variable, the coefficient estimates for and are essentially unchanged indicating a possible [very small] negative bias. Similarly, the coefficient for is essentially unchanged but indicates a possible [very small] positive bias. The correlation coefficient for WHITE and SAT is positive as is the correlation coefficient for WHITE and FEMALE. The correlation coefficient for WHITE and SKIP is negative. To be consistent with the observed changes in coefficient estimates between the two regressions, we d therefore have to expect to be negative. Given the lack of statistical significance for and the fact that there is no significant change in the parameter estimates when WHITE is omitted, meaning that there does not appear to be any bias, we can conclude that WHITE is an irrelevant variable. 5a. For a double-log specification no calculation is necessary. The parameter estimates are elasticities. Therefore the price elasticity of demand is.7 and the income elasticity is points b. 5 points H H : : logincome logincome t.58.6 t.96 c A Since -.58 <.96 we cannot reject H and therefore cannot conclude that the income elasticity of demand is significantly Page 6
7 Page 7
8 Page 8
Name May 3, 2007 Math Probability and Statistics
 Name May 3, 2007 Math 341 - Probability and Statistics Long Exam IV Instructions: Please include all relevant work to get full credit. Encircle your final answers. 1. An article in Professional Geographer
Chapter 12 Practice Test
 Chapter 12 Practice Test 1. Which of the following is not one of the conditions that must be satisfied in order to perform inference about the slope of a least-squares regression line? (a) For each value
Section I: Multiple Choice Select the best answer for each problem.
 Inference for Linear Regression Review Section I: Multiple Choice Select the best answer for each problem. 1. Which of the following is NOT one of the conditions that must be satisfied in order to perform
a) List and define all assumptions for multiple OLS regression. These are all listed in section 6.5
 List and define all assumptions for multiple OLS regression. These are all listed in section 6.5") Prof. C. M. Dalton ECN 209A Spring 2015 Practice Problems (After HW1, HW2, before HW3) CORRECTED VERSION Question 1. Draw and describe a relationship with heteroskedastic errors. Support your claim with
Prof. C. M. Dalton ECN 209A Spring 2015 Practice Problems (After HW1, HW2, before HW3) CORRECTED VERSION Question 1. Draw and describe a relationship with heteroskedastic errors. Support your claim with
1. Answer this student s question: Is a random sample of 5% of the students at my school large enough, or should I use 10%?
 Econ 57 Gary Smith Fall 2011 Final Examination (150 minutes) No calculators allowed. Just set up your answers, for example, P = 49/52. BE SURE TO EXPLAIN YOUR REASONING. If you want extra time, you can
Is lung capacity affected by smoking, sport, height or gender. Table of contents
 Sample project This Maths Studies project has been graded by a moderator. As you read through it, you will see comments from the moderator in boxes like this: At the end of the sample project is a summary
Announcements. % College graduate vs. % Hispanic in LA. % College educated vs. % Hispanic in LA. Problem Set 10 Due Wednesday.
 Announcements Announcements UNIT 7: MULTIPLE LINEAR REGRESSION LECTURE 1: INTRODUCTION TO MLR STATISTICS 101 Problem Set 10 Due Wednesday Nicole Dalzell June 15, 2015 Statistics 101 (Nicole Dalzell) U7
Navigate to the golf data folder and make it your working directory. Load the data by typing
 Golf Analysis 1.1 Introduction In a round, golfers have a number of choices to make. For a particular shot, is it better to use the longest club available to try to reach the green, or would it be better
Stat 139 Homework 3 Solutions, Spring 2015
 Stat 39 Homework 3 Solutions, Spring 05 Problem. Let i Nµ, σ ) for i,..., n, and j Nµ, σ ) for j,..., n. Also, assume that all observations are independent from each other. In Unit 4, we learned that the
y ) s x x )(y i (x i r = 1 n 1 s y Statistics Lecture 7 Exploring Data , y 2 ,y n (x 1 ),,(x n ),(x 2 ,y 1 How two variables vary together
 s x x )(y i (x i r = 1 n 1 s y Statistics Lecture 7 Exploring Data , y 2 ,y n (x 1 ),,(x n ),(x 2 ,y 1 How two variables vary together") Statistics 111 - Lecture 7 Exploring Data Numerical Summaries for Relationships between Variables Administrative Notes Homework 1 due in recitation: Friday, Feb. 5 Homework 2 now posted on course website:
Statistics 111 - Lecture 7 Exploring Data Numerical Summaries for Relationships between Variables Administrative Notes Homework 1 due in recitation: Friday, Feb. 5 Homework 2 now posted on course website:
Announcements. Lecture 19: Inference for SLR & Transformations. Online quiz 7 - commonly missed questions
 Announcements Announcements Lecture 19: Inference for SLR & Statistics 101 Mine Çetinkaya-Rundel April 3, 2012 HW 7 due Thursday. Correlation guessing game - ends on April 12 at noon. Winner will be announced
Lesson 14: Modeling Relationships with a Line
 Exploratory Activity: Line of Best Fit Revisited 1. Use the link http://illuminations.nctm.org/activity.aspx?id=4186 to explore how the line of best fit changes depending on your data set. A. Enter any
Running head: DATA ANALYSIS AND INTERPRETATION 1
 Running head: DATA ANALYSIS AND INTERPRETATION 1 Data Analysis and Interpretation Final Project Vernon Tilly Jr. University of Central Oklahoma DATA ANALYSIS AND INTERPRETATION 2 Owners of the various
Midterm Exam 1, section 2. Thursday, September hour, 15 minutes
 San Francisco State University Michael Bar ECON 312 Fall 2018 Midterm Exam 1, section 2 Thursday, September 27 1 hour, 15 minutes Name: Instructions 1. This is closed book, closed notes exam. 2. You can
Dutch Disease, Deindustrialization and Employment in South America Roberto Frenkel
 Dutch Disease, Deindustrialization and Employment in South America Roberto Frenkel Principal Research Associate at CEDES and Honorary Professor, University of Buenos Aires 300 Real bilateral exchange rates
ECO 745: Theory of International Economics. Jack Rossbach Fall Lecture 6
 ECO 745: Theory of International Economics Jack Rossbach Fall 2015 - Lecture 6 Review We ve covered several models of trade, but the empirics have been mixed Difficulties identifying goods with a technological
Lecture 22: Multiple Regression (Ordinary Least Squares -- OLS)
") Statistics 22_multiple_regression.pdf Michael Hallstone, Ph.D. hallston@hawaii.edu Lecture 22: Multiple Regression (Ordinary Least Squares -- OLS) Some Common Sense Assumptions for Multiple Regression
Statistics 22_multiple_regression.pdf Michael Hallstone, Ph.D. hallston@hawaii.edu Lecture 22: Multiple Regression (Ordinary Least Squares -- OLS) Some Common Sense Assumptions for Multiple Regression
Consumer behaviour and the welfare eects of gambling in
 Consumer behaviour and the welfare eects of gambling in Finland Preliminary results University of Turku September 16, 2016 1 Introduction Gambling as utility creating activity Problem gambling Gambling
Economic Value of Celebrity Endorsements:
 Economic Value of Celebrity Endorsements: Tiger Woods Impact on Sales of Nike Golf Balls September 27, 2012 On Line Appendix The Golf Equipments Golf Bags Golf bags are designed to transport the golf clubs
Quantitative Methods for Economics Tutorial 6. Katherine Eyal
 Quantitative Methods for Economics Tutorial 6 Katherine Eyal TUTORIAL 6 13 September 2010 ECO3021S Part A: Problems 1. (a) In 1857, the German statistician Ernst Engel formulated his famous law: Households
Empirical Example II of Chapter 7
 Empirical Example II of Chapter 7 1. We use NBA data. The description of variables is --- --- --- storage display value variable name type format label variable label marr byte %9.2f =1 if married wage
A Hedonic Price Analysis of Internet Auctions for the BLM s Wild Horses and Burros
 A Hedonic Price Analysis of Internet Auctions for the BLM s Wild Horses and Burros Omotoyosi O. Adekunle, Lang Markus, Christina J. Stowe, and Sayed H. Saghaian Department of Agricultural Economics, University
The final set in a tennis match: four years at Wimbledon 1
 Published as: Journal of Applied Statistics, Vol. 26, No. 4, 1999, 461-468. The final set in a tennis match: four years at Wimbledon 1 Jan R. Magnus, CentER, Tilburg University, the Netherlands and Franc
Driv e accu racy. Green s in regul ation
 LEARNING ACTIVITIES FOR PART II COMPILED Statistical and Measurement Concepts We are providing a database from selected characteristics of golfers on the PGA Tour. Data are for 3 of the players, based
Introduction. Forestry, Wildlife and Fisheries Graduate Seminar Demand for Wildlife Hunting in the Southeastern United States
 Forestry, Wildlife and Fisheries Graduate Seminar Demand for Wildlife Hunting in the Southeastern United States Presented by: Neelam C. Poudyal Monday, 19 November, 2007 4:40 PM 160 PBB Introduction Hunting
Using Actual Betting Percentages to Analyze Sportsbook Behavior: The Canadian and Arena Football Leagues
 Syracuse University SURFACE College Research Center David B. Falk College of Sport and Human Dynamics October 2010 Using Actual Betting s to Analyze Sportsbook Behavior: The Canadian and Arena Football
Legendre et al Appendices and Supplements, p. 1
 Legendre et al. 2010 Appendices and Supplements, p. 1 Appendices and Supplement to: Legendre, P., M. De Cáceres, and D. Borcard. 2010. Community surveys through space and time: testing the space-time interaction
International Discrimination in NBA
 International Discrimination in NBA Sports Economics Drew Zhong Date: May 7 2017 Advisory: Prof. Benjamin Anderson JEL Classification: L83; J31; J42 Abstract Entering the 21st century, the National Basketball
Statistical Modeling of Consumers Participation in Gambling Markets and Frequency of Gambling
 Statistical Modeling of Consumers Participation in Gambling Markets and Frequency of Gambling Brad R. Humphreys University of Alberta Department of Economics Yang Seung Lee University of Alberta Department
Analysis of Variance. Copyright 2014 Pearson Education, Inc.
 Analysis of Variance 12-1 Learning Outcomes Outcome 1. Understand the basic logic of analysis of variance. Outcome 2. Perform a hypothesis test for a single-factor design using analysis of variance manually
Unit 4: Inference for numerical variables Lecture 3: ANOVA
 Unit 4: Inference for numerical variables Lecture 3: ANOVA Statistics 101 Thomas Leininger June 10, 2013 Announcements Announcements Proposals due tomorrow. Will be returned to you by Wednesday. You MUST
Effects of Incentives: Evidence from Major League Baseball. Guy Stevens April 27, 2013
 Effects of Incentives: Evidence from Major League Baseball Guy Stevens April 27, 2013 1 Contents 1 Introduction 2 2 Data 3 3 Models and Results 4 3.1 Total Offense................................... 4
the 54th Annual Conference of the Association of Collegiate School of Planning (ACSP) in Philadelphia, Pennsylvania November 2 nd, 2014
 in Philadelphia, Pennsylvania November 2 nd, 2014") the 54th Annual Conference of the Association of Collegiate School of Planning (ACSP) in Philadelphia, Pennsylvania November 2 nd, 2014 Hiroyuki Iseki, Ph.D. Assistant Professor Urban Studies and Planning
the 54th Annual Conference of the Association of Collegiate School of Planning (ACSP) in Philadelphia, Pennsylvania November 2 nd, 2014 Hiroyuki Iseki, Ph.D. Assistant Professor Urban Studies and Planning
THE INTEGRATION OF THE SEA BREAM AND SEA BASS MARKET: EVIDENCE FROM GREECE AND SPAIN
 THE INTEGRATION OF THE SEA BREAM AND SEA BASS MARKET: EVIDENCE FROM GREECE AND SPAIN Lamprakis Avdelas, Managing Authority for the Operational programme for Fisheries, lamprakisa@in.gr Jordi Guillen, University
An Econometric Evaluation of the Performance of the Greek National Football Team
 Athens Journal of Sports December 2014 An Econometric Evaluation of the Performance of the Greek National Football Team By Gregory T. Papanikos This paper uses a Cobb-Douglas production function to account
4. A student estimated a regression model using annual data for 1990 through 2015, C = β 0. Y + β 2
 Econ 57 Gary Smith Spring 2017 Final Examination (150 minutes) No calculators allowed. Just set up your answers, for example, P = 49/52. BE SURE TO EXPLAIN YOUR REASONING. If you want extra time, you can
The Effect of Newspaper Entry and Exit on Electoral Politics Matthew Gentzkow, Jesse M. Shapiro, and Michael Sinkinson Web Appendix
 The Effect of Newspaper Entry and Exit on Electoral Politics Matthew Gentzkow, Jesse M. Shapiro, and Michael Sinkinson Web Appendix 1 1 Sources of Voting Data Our primary source for county-level voting
Announcements. Unit 7: Multiple Linear Regression Lecture 3: Case Study. From last lab. Predicting income
 Announcements Announcements Unit 7: Multiple Linear Regression Lecture 3: Case Study Statistics 101 Mine Çetinkaya-Rundel April 18, 2013 OH: Sunday: Virtual OH, 3-4pm - you ll receive an email invitation
Journal of Sports Economics 2000; 1; 299
 Journal of Sports Economics http://jse.sagepub.com Equal Pay on the Hardwood: The Earnings Gap Between Male and Female NCAA Division I Basketball Coaches Brad R. Humphreys Journal of Sports Economics 2000;
Data Set 7: Bioerosion by Parrotfish Background volume of bites The question:
 Data Set 7: Bioerosion by Parrotfish Background Bioerosion of coral reefs results from animals taking bites out of the calcium-carbonate skeleton of the reef. Parrotfishes are major bioerosion agents,
Multilevel Models for Other Non-Normal Outcomes in Mplus v. 7.11
 Multilevel Models for Other Non-Normal Outcomes in Mplus v. 7.11 Study Overview: These data come from a daily diary study that followed 41 male and female college students over a six-week period to examine
Should bonus points be included in the Six Nations Championship?
 Should bonus points be included in the Six Nations Championship? Niven Winchester Joint Program on the Science and Policy of Global Change Massachusetts Institute of Technology 77 Massachusetts Avenue,
The Simple Linear Regression Model ECONOMETRICS (ECON 360) BEN VAN KAMMEN, PHD
 BEN VAN KAMMEN, PHD") The Simple Linear Regression Model ECONOMETRICS (ECON 360) BEN VAN KAMMEN, PHD Outline Definition. Deriving the Estimates. Properties of the Estimates. Units of Measurement and Functional Form. Expected
The Simple Linear Regression Model ECONOMETRICS (ECON 360) BEN VAN KAMMEN, PHD Outline Definition. Deriving the Estimates. Properties of the Estimates. Units of Measurement and Functional Form. Expected
27Quantify Predictability U10L9. April 13, 2015
 1 QUANTIFYING PREDICTABILITY Exercise #1: Make sure that your calculator has its r value on. 2 Exercise #2: In the following exercises four data sets with equal x values are given to illustrate different
Department of Economics Working Paper
 Department of Economics Working Paper Number 13-25 October 2013 Compensation Discrimination in the NFL: An Analysis of Career Earnings Johnny Ducking North Carolina A&T State University Peter A. Groothuis
ISDS 4141 Sample Data Mining Work. Tool Used: SAS Enterprise Guide
 ISDS 4141 Sample Data Mining Work Taylor C. Veillon Tool Used: SAS Enterprise Guide You may have seen the movie, Moneyball, about the Oakland A s baseball team and general manager, Billy Beane, who focused
DISMAS Evaluation: Dr. Elizabeth C. McMullan. Grambling State University
 DISMAS Evaluation 1 Running head: Project Dismas Evaluation DISMAS Evaluation: 2007 2008 Dr. Elizabeth C. McMullan Grambling State University DISMAS Evaluation 2 Abstract An offender notification project
Taking Your Class for a Walk, Randomly
 Taking Your Class for a Walk, Randomly Daniel Kaplan Macalester College Oct. 27, 2009 Overview of the Activity You are going to turn your students into an ensemble of random walkers. They will start at
Math 121 Test Questions Spring 2010 Chapters 13 and 14
 Math 121 Test Questions Spring 2010 Chapters 13 and 14 1. (10 pts) The first-semester enrollment at HSC was 1120 students. If all entering freshmen classes were the same size and there were no attrition,
5.1 Introduction. Learning Objectives
 Learning Objectives 5.1 Introduction Statistical Process Control (SPC): SPC is a powerful collection of problem-solving tools useful in achieving process stability and improving capability through the
Factors Affecting Minor League Baseball Attendance. League of AA minor league baseball. Initially launched as the Akron Aeros in 1997, the team
 Kelbach 1 Jeffrey Kelbach Econometric Project 6 May 2016 Factors Affecting Minor League Baseball Attendance 1 Introduction The Akron RubberDucks are an affiliate of the Cleveland Indians, playing in the
An Empirical Comparison of Regression Analysis Strategies with Discrete Ordinal Variables
 Kromrey & Rendina-Gobioff An Empirical Comparison of Regression Analysis Strategies with Discrete Ordinal Variables Jeffrey D. Kromrey Gianna Rendina-Gobioff University of South Florida The Type I error
Statistical Analysis of PGA Tour Skill Rankings USGA Research and Test Center June 1, 2007
 Statistical Analysis of PGA Tour Skill Rankings 198-26 USGA Research and Test Center June 1, 27 1. Introduction The PGA Tour has recorded and published Tour Player performance statistics since 198. All
What variables explain differences in coaching salaries for Division I women's sports?
 University of Northern Iowa UNI ScholarWorks Honors Program Theses University Honors Program 2014 What variables explain differences in coaching salaries for Division I women's sports? Tyler Lange University
GENETICS OF RACING PERFORMANCE IN THE AMERICAN QUARTER HORSE: II. ADJUSTMENT FACTORS AND CONTEMPORARY GROUPS 1'2
 GENETICS OF RACING PERFORMANCE IN THE AMERICAN QUARTER HORSE: II. ADJUSTMENT FACTORS AND CONTEMPORARY GROUPS 1'2 S. T. Buttram 3, R. L. Willham 4 and D. E. Wilson 4 Iowa State University, Ames 50011 ABSTRACT
Using PGA Tour Results to Illustrate the Effects of Selection Bias
 The Journal of Economic Education ISSN: 0022-0485 (Print) 2152-4068 (Online) Journal homepage: http://www.tandfonline.com/loi/vece20 Using PGA Tour Results to Illustrate the Effects of Selection Bias Amanda
Modelling residential prices with cointegration techniques and automatic selection algorithms
 Modelling residential prices with cointegration techniques and automatic selection algorithms Ramiro J. Rodríguez A presentation for ERES 2014 - PhD Sessions Bucharest, Rumania The opinions and analyses
Real-Time Electricity Pricing
 Real-Time Electricity Pricing Xi Chen, Jonathan Hosking and Soumyadip Ghosh IBM Watson Research Center / Northwestern University Yorktown Heights, NY, USA X. Chen, J. Hosking & S. Ghosh (IBM) Real-Time
The MACC Handicap System
 MACC Racing Technical Memo The MACC Handicap System Mike Sayers Overview of the MACC Handicap... 1 Racer Handicap Variability... 2 Racer Handicap Averages... 2 Expected Variations in Handicap... 2 MACC
Existence of Nash Equilibria
 Existence of Nash Equilibria Before we can prove the existence, we need to remind you of the fixed point theorem: Kakutani s Fixed Point Theorem: Consider X R n a compact convex set and a function f: X
Chapter 9: Hypothesis Testing for Comparing Population Parameters
 Chapter 9: Hypothesis Testing for Comparing Population Parameters Hypothesis testing can address many di erent types of questions. We are not restricted to looking at the estimated value of a single population
Pitching Performance and Age
 Pitching Performance and Age By: Jaime Craig, Avery Heilbron, Kasey Kirschner, Luke Rector, Will Kunin Introduction April 13, 2016 Many of the oldest players and players with the most longevity of the
When Falling Just Short is a Good Thing: the Effect of Past Performance on Improvement.
 Title: When Falling Just Short is a Good Thing: the Effect of Past Performance on Improvement. Mariya Burdina (corresponding author) Associate Professor of Economics University of Central Oklahoma 100
Efficiency Wages in Major League Baseball Starting. Pitchers Greg Madonia
 Efficiency Wages in Major League Baseball Starting Pitchers 1998-2001 Greg Madonia Statement of Problem Free agency has existed in Major League Baseball (MLB) since 1974. This is a mechanism that allows
DOE Golfer Experiment
 DOE Golfer Experiment A Design of Experiments Report Travis Anderson Jake Munger Deshun Xu 11/11/2008 INTRODUCTION We used Response Surface Methodology to optimize a golf putter. A face centered Central
Analysis of the Impacts of Transit Signal Priority on Bus Bunching and Performance
 Analysis of the Impacts of Transit Signal Priority on Bus Bunching and Performance Eric Albright Graduate Research Assistant Portland State University eea@pdx.edu Miguel Figliozzi* Associate Professor
Evaluation of Regression Approaches for Predicting Yellow Perch (Perca flavescens) Recreational Harvest in Ohio Waters of Lake Erie
 Recreational Harvest in Ohio Waters of Lake Erie") Evaluation of Regression Approaches for Predicting Yellow Perch (Perca flavescens) Recreational Harvest in Ohio Waters of Lake Erie QFC Technical Report T2010-01 Prepared for: Ohio Department of Natural
Evaluation of Regression Approaches for Predicting Yellow Perch (Perca flavescens) Recreational Harvest in Ohio Waters of Lake Erie QFC Technical Report T2010-01 Prepared for: Ohio Department of Natural
The Normal Distribution, Margin of Error, and Hypothesis Testing. Additional Resources
 The Normal Distribution, Margin of Error, and Hypothesis Testing Additional Resources The Normal Distribution and Central Limit Theorem Explanations and Visuals o http://www.statisticshowto.com/central-limit-theorem-examples/
Introduction to Analysis of Variance (ANOVA) The Structural Model, The Summary Table, and the One- Way ANOVA
 The Structural Model, The Summary Table, and the One- Way ANOVA") Introduction to Analysis of Variance (ANOVA) The Structural Model, The Summary Table, and the One- Way ANOVA Limitations of the t-test Although the t-test is commonly used, it has limitations Can only
Introduction to Analysis of Variance (ANOVA) The Structural Model, The Summary Table, and the One- Way ANOVA Limitations of the t-test Although the t-test is commonly used, it has limitations Can only
Gender, Skill, and Earnings PGA vs. LPGA
 Senior Project Department of Economics Gender, Skill, and Earnings PGA vs. LPGA Ilya Klimenko Summer, 2013 Advisor: Michael Nelson 2 Table of Contents Acknowledgements ----------------------------------------------------------------------------
Traffic Safety Barriers to Walking and Bicycling Analysis of CA Add-On Responses to the 2009 NHTS
 Traffic Safety Barriers to Walking and Bicycling Analysis of CA Add-On Responses to the 2009 NHTS NHTS Users Conference June 2011 Robert Schneider, Swati Pande, & John Bigham, University of California
Sample Final Exam MAT 128/SOC 251, Spring 2018
 Sample Final Exam MAT 128/SOC 251, Spring 2018 Name: Each question is worth 10 points. You are allowed one 8 1/2 x 11 sheet of paper with hand-written notes on both sides. 1. The CSV file citieshistpop.csv
Factors Associated with the Bicycle Commute Use of Newcomers: An analysis of the 70 largest U.S. Cities
 : An analysis of the 70 largest U.S. Cities Ryan J. Dann PhD Student, Urban Studies Portland State University May 2014 Newcomers and Bicycles Photo Credit: Daveena Tauber 2 Presentation Outline Introduction
On the Demand and Supply of Golf
 On the Demand and Supply of Golf Peter C. Melvin and Robert E. McCormick 1 Assistant Professor Department of Economics and Finance Anderson College February 6, 2001 Professor and BB&T Scholar Department
Returns to Skill in Professional Golf: A Quantile Regression Approach
 International Journal of Sport Finance, 2010, 5, 167-180, 2010 West Virginia University Returns to Skill in Professional Golf: A Quantile Regression Approach Leo H. Kahane 1 1 Providence College Leo H.
b) (2 pts.) Does the study show that drinking 4 or more cups of coffee a day caused the higher death rate?
 (2 pts.) Does the study show that drinking 4 or more cups of coffee a day caused the higher death rate?") Question 1 (10 pts) A study published in the August 15, 2017 issue of Mayo Clinic Proceedings tracked 44,000 people aged 20 to 87 for an average of about 16 years and found that those who drank 4 or more
Question 1 (10 pts) A study published in the August 15, 2017 issue of Mayo Clinic Proceedings tracked 44,000 people aged 20 to 87 for an average of about 16 years and found that those who drank 4 or more
1 Introduction. 2 EAD and Derived Factors
 Introduction A banking industry standard approach to estimating future unexpected losses to credit portfolios relies on three modeled risk measures: probability of default, loss given default, and exposure
The Value of Dune Width in Avalon, New Jersey: A Hedonic Pricing Analysis
 Journal of Environmental and Resource Economics at Colby Volume 2 Issue 1 Spring 2015 Article 3 2015 The Value of Dune Width in Avalon, New Jersey: A Hedonic Pricing Analysis Matt Mignon Colby College,
League Quality and Attendance:
 League Quality and Attendance: Evidence from a European Perspective* Dr Raymond Bachan* and Prof Barry Reilly ** *University of Brighton, UK **University of Sussex, UK Context Are less fashionable soccer
The Effects of Changes in the National Terror Alert Level on Consumer Behavior
 The Effects of Changes in the National Terror Alert Level on Consumer Behavior A thesis submitted to the Miami University Honors Program in partial fulfillment of the requirements for University Honors
Week 7 One-way ANOVA
 Week 7 One-way ANOVA Objectives By the end of this lecture, you should be able to: Understand the shortcomings of comparing multiple means as pairs of hypotheses. Understand the steps of the ANOVA method
Average & Median Wager per Field Size Woodbine 2014
 and Per-Race Wagering Determinants Steve Koch Vice President Racing Woodbine Entertainment Group Global Symposium on Racing & Gaming December 9, 2014 Average & Median Wager per Handle Avg Handle Median
Math SL Internal Assessment What is the relationship between free throw shooting percentage and 3 point shooting percentages?
 Math SL Internal Assessment What is the relationship between free throw shooting percentage and 3 point shooting percentages? fts6 Introduction : Basketball is a sport where the players have to be adept
What does it take to produce an Olympic champion? A nation naturally
 Survival of the Fittest? An Econometric Analysis in to the Effects of Military Spending on Olympic Success from 1996-01. Mark Frahill The Olympics are the world s greatest sporting celebrations, seen as
B. Single Taxpayers (122,401 obs.) A. Married Taxpayers Filing jointly (266,272 obs.) Density Distribution. Density Distribution
 A. Married Taxpayers Filing jointly (266,272 obs.) Density Distribution. Density Distribution") A. Married Taxpayers Filing jointly (266,272 obs.) Kink 15/28% at $43,850 B. Single Taxpayers (122,401 obs.) Kink 15/28% at $26,250 Density Distribution Density Distribution $0 $20,000 $40,000 $60,000
A. Married Taxpayers Filing jointly (266,272 obs.) Kink 15/28% at $43,850 B. Single Taxpayers (122,401 obs.) Kink 15/28% at $26,250 Density Distribution Density Distribution $0 $20,000 $40,000 $60,000
Building an NFL performance metric
 Building an NFL performance metric Seonghyun Paik (spaik1@stanford.edu) December 16, 2016 I. Introduction In current pro sports, many statistical methods are applied to evaluate player s performance and
DEVELOPMENT OF A SET OF TRIP GENERATION MODELS FOR TRAVEL DEMAND ESTIMATION IN THE COLOMBO METROPOLITAN REGION
 DEVELOPMENT OF A SET OF TRIP GENERATION MODELS FOR TRAVEL DEMAND ESTIMATION IN THE COLOMBO METROPOLITAN REGION Ravindra Wijesundera and Amal S. Kumarage Dept. of Civil Engineering, University of Moratuwa
Trends in Baseball Scoring & Strikeouts, Geoffrey Holland ECON 5341 Advanced Data Analysis 16 November 2015
 Trends in Baseball Scoring & Strikeouts, 1962-2014 Geoffrey Holland ECON 5341 Advanced Data Analysis 16 November 2015 Background Statistics are intrinsic part of Baseball Series under study are Runs Scored
8th Grade. Data.
 1 8th Grade Data 2015 11 20 www.njctl.org 2 Table of Contents click on the topic to go to that section Two Variable Data Line of Best Fit Determining the Prediction Equation Two Way Table Glossary Teacher
Calculation of Trail Usage from Counter Data
 1. Introduction 1 Calculation of Trail Usage from Counter Data 1/17/17 Stephen Martin, Ph.D. Automatic counters are used on trails to measure how many people are using the trail. A fundamental question
How to Win in the NBA Playoffs: A Statistical Analysis
 How to Win in the NBA Playoffs: A Statistical Analysis Michael R. Summers Pepperdine University Professional sports teams are big business. A team s competitive success is just one part of the franchise
Congestion and Safety: A Spatial Analysis of London
 Congestion and Safety: A Spatial Analysis of London Robert B. Noland Mohammed A. Quddus Centre for Transport Studies Dept. of Civil and Environmental Engineering Imperial College London London SW7 2AZ
ASTERISK OR EXCLAMATION POINT?: Power Hitting in Major League Baseball from 1950 Through the Steroid Era. Gary Evans Stat 201B Winter, 2010
 ASTERISK OR EXCLAMATION POINT?: Power Hitting in Major League Baseball from 1950 Through the Steroid Era by Gary Evans Stat 201B Winter, 2010 Introduction: After a playerʼs strike in 1994 which resulted
PLANNED ORTHOGONAL CONTRASTS
 PLANNED ORTHOGONAL CONTRASTS Please note: This handout is useful background for the workshop, not what s covered in it. Basic principles for contrasts are the same in repeated measures. Planned orthogonal
A Hedonic Price Analysis of Risk Preferences in Yearling Thoroughbred Buyers. Xiurui Iris Cui
 A Hedonic Price Analysis of Risk Preferences in Yearling Thoroughbred Buyers Xiurui Iris Cui Selected Poster prepared for presentation at the Southern Agricultural Economics Association (SAEA) Annual Meeting,
AP 11.1 Notes WEB.notebook March 25, 2014
 11.1 Chi Square Tests (Day 1) vocab *new seats* examples Objectives Comparing Observed & Expected Counts measurements of a categorical variable (ex/ color of M&Ms) Use Chi Square Goodness of Fit Test Must
Contingent Valuation Methods
 ECNS 432 Ch 15 Contingent Valuation Methods General approach to all CV methods 1 st : Identify sample of respondents from the population w/ standing 2 nd : Respondents are asked questions about their valuations
Baseball Strikes and the Demand for Attendance. Dennis Coates* And. Thane Harrison. Department of Economics. University of Maryland, Baltimore County
 Baseball Strikes and the Demand for Attendance Dennis Coates* And Thane Harrison Department of Economics University of Maryland, Baltimore County 1000 Hilltop Circle Baltimore, MD 21250 August 7, 2002
Pitching Performance and Age
 Pitching Performance and Age Jaime Craig, Avery Heilbron, Kasey Kirschner, Luke Rector and Will Kunin Introduction April 13, 2016 Many of the oldest and most long- term players of the game are pitchers.
The Impact of Placemaking Attributes on Home Prices in the Midwest United States
 The Impact of Placemaking Attributes on Home Prices in the Midwest United States 2 0 1 3 C O N S T R U C T E D E N V I R O N M E N T C O N F E R E N C E M A R Y B E T H G R A E B E R T M I C H I G A N